Embed Size (px)
Citation preview

Baltic Marine Environment Protection Commission
State amp Conservation
2021Species amp habitats
helcomfi
Identification of potential spawning recruitment and nursery areas
Essential fish habitats in the Baltic Sea
2
Essential fish habitats in the Baltic Sea Identification of potential spawning recruitment and nursery areas
Published by
Helsinki Commission ndash HELCOMKatajanokanlaituri 6 B 00160 Helsinki Finland
wwwhelcomfi
Information and views expressed in this publication are the authorsrsquo own and might vary from those of the Helsinki Commission or its members
For bibliographic purposes this document should be cited asldquoEssential fish habitats in the Baltic Sea ndash Identification of potential spawning recruitment and nursery areas HELCOM (2021)rdquo
copy Baltic Marine Environment Protection Commission ndash Helsinki Commission (2021)
All rights reserved Information included in this publication or extracts thereof with the exception of images and graphic elements that are not HELCOMrsquos own and identified as such may be reproduced without prior consent on the condition that the complete reference of the publication is given as stated above
Contributors Lena Bergstroumlm12 Maringrten Erlandsson1 Ivars Putnis3 Josianne Gatt Stoslashttrup4 Meri Kallasvuo5 Ulf Bergstroumlm1 Henri Jokinen2 Māris Plikšs3 Imre Taal6 Alexandros Kokkalis4 Elliot Brown4 Stefan Husa7 Lauri Saks6 Terje Selnes9 Roland Svirgsden6 Linda Sundstroumlm7 Anastasia O Yurtseva8 Didzis Ustups34
1) Department of Aquatic Resources Swedish University of Agricultural Sciences Sweden2) HELCOM3) Institute of Food Safety Animal Health and Environment (BIOR) Latvia4) DTU Aqua Denmark5) Natural Resources Institute Finland (Luke)6) Estonian Marine Institute Estonia7) Government of Aringland8) Laboratory of Ichthyology Zoological Institute RAS Russia 9) Swedish Agency of Water and Marine Management Sweden10) Latvian Ministry of Environment and Regional Development Latvia
Layout Laura Ramos Dominik Littfass
3
Contents Essential fish habitats in the Baltic Sea Identification of potential spawning recruitment and nursery areas
Summary 4
1 Introduction 5
2 Methods 621 Outline of the work process 622 Focal species and aspects 623 Mapping approaches 824 Validation and evaluation of data quality 825 Approaches applied for the different species 826 Cod 927 Aggregation of data layers 14
3 Results 1631 Potential spawning areas for cod 1632 Potential spawning areas for sprat 1833 Potential spawning areas for herring 1934 Potential spawning areas for European flounder 2135 Potential spawning areas for Baltic flounder 2336 Potential nursery areas for flounders 2437 Potential recruitment areas for perch 2638 Potential recruitment areas for pikeperch 2839 Aggregated map 30
4 Discussion 3141 Potential uses of the maps - MSP environmental management and green infrastructure 3142 Suggestions for the further development of the essential fish habitats concept 3143 Data quality aspects 3244 Implications for application 3245 How to consider future changes 32
5 Acknowledgements 33
6 References 34
Contents
4
Summary Essential fish habitats in the Baltic Sea Identification of potential spawning recruitment and nursery areas
Summary
Fish as well as other aquatic organisms are highly dependent on the conditions of their living environ-ment to sustain health and viable populations Maps
that identify the location of important habitats for key species are a valuable tool for marine management The habitat maps can for example support the planning of environmental man-agement actions or contribute to an ecosystem-based maritime spatial planning
There has so far been a lack of regionally coherent spatial in-formation on fish habitats in the Baltic Sea Mapping is typically restricted by data limitations which is enhanced by the need to identify potentially coherent data at the regional scale and by the challenge of depicting dynamic population properties in a representative way on the map
In the following report we explore the possibility to produce regionally coherent maps on essential fish habitats in the Bal-tic Sea based on currently available knowledge Our focus is on widely distributed fish species and on spawning nursery and recruitment areas which represent central ecological functions that need consideration in marine management and maritime spatial planning Based on the results we develop a set of re-gional habitat maps for selected fish species and life cycle stages New Baltic-wide maps representing potential spawning areas of herring sprat European flounder and Baltic flounder as well as potential nursery areas of flounders are presented Additionally previously available maps on potential cod spawning areas as well as perch and pikeperch recruitment areas are re-evaluated and improved
Data to support the mapping of essential fish habitats has been recently enhanced by national and joint Baltic projects and this fact was an important enabler of the current work The presented maps hence represent the best available information at a coherent Baltic Sea regional scale at their time of develop-ment supported and further refined by a subsequent Helcom review process
However sufficient data for mapping was not yet available for some parts of the Baltic Sea and selected species It is sug-gested that these gaps are filled in future work Also points for further improvement are identified for the presented maps To give a fuller representation of essential fish habitats one should especially include more information for fish in coastal areas and in the western Baltic Sea One should also consider additional life stages for some of the included species since both spawn-ing nursery feeding and migration areas are important exem-plifications of essential fish habitats Another key area for de-velopment is to develop a stronger understanding on how the current distribution of functional essential fish habitat is limited by human activities and how to improve management in these situations These needs are even more emphasized by climate change which is expected to have dramatic influence on the dis-tribution of fish and fish habitats in the future
5
1 Introduction Essential fish habitats in the Baltic Sea Identification of potential spawning recruitment and nursery areas
1 Introduction
Aquatic species are highly dependent on the condi-tions of their living environment to sustain healthy and viable populations For fish the preferred habitat
is highly variable among species and many fish species use dif-ferent habitat types during different parts of their life cycle such as for spawning nursery feeding or migration (Seitz et al 2014)
Essential habitats are those waters or substrates necessary for a species or population to complete their life cycle and loss or degradation of essential habitats may impact population sizes In this work we refer to ldquoessential fish habitatsrdquo as ldquoenvironments of particular importance for a fish species to complete its life cycle or maintain its populationsrdquo This concept of essential fish habitats may include spawning areas nursery areas for larvae and juveniles adult feeding areas migratory corridors and oth-er possible specific areas to which a species is highly restricted
Our definition thereby aligns with that of the Magnusson-Ste-vens Fisheries Conservation Act (2007) which is a commonly used definition in fisheries management and which defines es-sential fish habitats as ldquowaters and substrate necessary to fish for spawning breeding feeding or growth to maturityrdquo and with the work of Kraufvelin et al (2018) who in a broad sense defined essential fish habitats as any environment that is needed for the maintenance of a fish population and more specifically defined coastal essential fish habitats as shallow and nearshore waters and substrates necessary to any life-stage of fish for spawning breeding feeding or growth to maturity Here we specifically fo-cus on spawning and recruitment areas
Maps that identify the location of essential fish habitats are a tool for marine management to ensure that human activities do not affect the habitats in a way that may restrict the health of fish populations Such maps can for example help identify areas where actions to reduce pressures are particularly important support the designation of protected areas or contribute to an ecosystem-based maritime spatial planning
So far there has generally been a lack of regionally coherent spatial information on essential fish habitats in the Baltic Sea (Bergstroumlm et al 2007 Modin 2008 Kraufvelin et al 2018 HELCOM 2018a) The Baltic Scope project (2017) recommended the joint identification of essential fish habitats including spawning nurs-ery and growth areas for the whole Baltic Sea for species of interest to fisheries as one priority to further support MSP in the Baltic Sea
Defining essential fish habitats is challenging for several reasons The process of mapping aquatic habitats is generally restricted by data limitations and by the need to combine in-formation from different data sources in a coherent way There may also be ecological constraints related to defining the appro-priate spatial scale for a certain feature and potential changes in the location of a certain habitat over time In the case of fish the suitability of spawning or feeding areas depends not only on
physical and topographical characteristics which are constant over time but also on hydrological characteristics which show seasonal and inter-annual variation such as temperature con-ditions or the movements of water masses (hydrodynamics) In addition the presence of other species may be decisive for how suitable the habitat is in reality such as the presence of suitable vegetation in a spawning area or the presence of zooplankton in a recruitment area To delineate habitats on a map one also needs to consider that habitat suitability varies along environ-mental gradients Whereas areas with minimum environmental conditions can be identified for example in relation to the mini-mum salinity required for successful spawning for a marine spe-cies the environmental range representing optimal conditions is usually smaller Lastly human induced pressures such as fishing eutrophication or physical disturbance impact habitat quality and how effectively species can utilize the habitat in reality
In the following report we explore the possibility of pro-ducing regionally coherent maps on essential fish habitats in the Baltic Sea based on currently available knowledge and suggest a set of Baltic-wide maps on potential key habitats for selected fish species and life cycle stages Maps were devel-oped for selected life stages of herring sprat European floun-der and Baltic flounder for which no maps were previously available in HELCOM Additionally previously available maps for cod spawning areas as well as perch and pikeperch re-cruitment areas were re-evaluated and improved (For an over-view see Table 1) The maps are available at the HELCOM Map and Data Services1 The purpose of the presented maps is to support the identification of areas of particular concern with respect to ecological values and the provision of ecosystem services related to widely distributed fish species in the Baltic Sea By this the maps can support maritime spatial planning and environmental management including actions to reduce human impacts in areas of high nature value in the Baltic Sea
1 mapshelcomfiwebsitemapservice
6
2 Methods Essential fish habitats in the Baltic Sea Identification of potential spawning recruitment and nursery areas
2 Methods
21 Outline of the work process
The results presented in this report originate from work within the Pan Baltic Scope project1 and from a joint regional Expert Work-shop on essential fish habitats which was organized by HELCOM and the Pan Baltic Scope project (HELCOM 2018a) The develop-ment took place in steps First partner researchers of Pan Baltic Scope made an overview of current knowledge on essential fish habitats in the Baltic Sea and used this information to make initial proposals for those species and aspects (spawning areas recruit-ment areas nursery areas) that were considered feasible based on available information (Box 1 Table 1) The researchers then circu-lated the initial proposals to a wider group of nationally nominated experts who also took part in the joint HELCOM ndash Pan Baltic Scope workshop (HELCOM 2018a) to evaluate the overview and validate the proposed maps The workshop discussed the maps and the approach applied and made further recommendations on how to improve them The participants also took part in ensuing work over correspondence to finalize the development The work in progress was subsequently presented to the meetings of HELCOM Fish-Pro III 1-2019 (HELCOM 2019a) and HELCOM VASAB MSP WG 18-2019 (HELCOM 2019b) for comments and to HELCOM State amp
1 Co-funded by the European Maritime and Fisheries Fund wwwpanbalticscopeeu
Species Type of fish habitat Relation to previously available regional map
Mapping approach
Cod (Gadus morhua)
Spawning area New ndash Previous map (HELCOM 2018b) was reworked
Environmental envelope
Sprat (Sprattus sprattus)
Spawning area New ndash No previous map Environmental envelope
Herring (Clupea harengus membras)
Spawning area New ndash No previous map Habitat associations
European flounder (Platichthys flesus)
Spawning area New ndash No previous map Species distribution modelling combined with environmental envelope
Baltic flounder (Platichthys solemdali)
Spawning area New ndash No previous map Species distribution modelling combined with environmental envelope
Flounders (Platichthys spp)
Nursery area New ndash No previous map Species distribution modelling
Perch(Perca fluviatilis)
Recruitment area Updated ndash Previous map (HELCOM 2018b) was re-examined and improved
Species distribution modelling combined with direct mapping
Pikeperch (Sander lucioperca)
Recruitment area Updated ndash Previous map (HELCOM 2018b) was re-examined and improved
Species distribution modelling combined with direct mapping
Conservation WG 10-2019 and 11-2019 (HELCOM 2019c d) for en-dorsement Comments and guidance for improvement received during these steps are included in the results presented below
22 Focal species and aspects
The focus of the development was on fish spawning recruitment and nursery areas as these represent central ecological functions that need consideration in marine management and maritime spatial planning Spawning areas include those habitats where ripe adults concentrate spawn and release their eggs and where the eggs develop (eg Seitz et al 2014) These areas are a limiting factor for fish populations if the availability of functional spawn-ing habitats is not sufficient to support population maintenance or growth (Mumby et al 2004 Sundblad et al 2014) For species with pelagic or mobile eggs and larvae such as sprat herring Eu-ropean flounder and cod the distribution of the spawning area may be significantly smaller than that of the area were juveniles occur so that the spawning area contributes to the population at a much larger scale For species with a limited dispersal of the larval stage such as perch and pikeperch the spawning areas and the areas were juveniles reside often overlap (Sundblad et al 2014 Kallasvuo et al 2017) and such crucial areas for population main-tenance are here referred to as recruitment areas Finally nursery
Table 1 Overview of the presented maps The last column shows the principal mapping approach (See section 23)
7
2 Methods Essential fish habitats in the Baltic Sea Identification of potential spawning recruitment and nursery areas
Box 1
Main data sources
The developed maps build on previous work in the Baltic Sea including the follow-ing projects
HELCOM HOLAS II project (HELCOM ho-listic assessment on the ecosystem health of the Baltic Sea 2014-2018) This com-prehensive project to assess the state of the Baltic Sea during 2011-2016 included among other things an assessment of spa-tial cumulative impacts (HELCOM 2018b) To support the assessment maps on key ecosystem components in the Baltic Sea were developed and agreed on by HELCOM Contracting Parties The maps focus on the spatial distribution of species habitats and habitat types with a wide distribution in the Baltic Sea and are publicly available at the HELCOM Maps and Data services1 Re-garding fish habitats maps representing recruitment areas for perch recruitment areas for pikeperch and spawning areas for cod were considered further in the work presented in the current report Further maps representing habitat-forming species (vegetation) and habitat types from HOLAS II were used in the delineation of essen-tial fish habitat maps for herring HOLAS II also include maps on the abundance of cod herring and sprat that were not used as a basis for the current work as new ap-proaches were used instead
The BALANCE project2 (Baltic Sea Management ndash Nature Conservation and Sustainable Development of the Ecosys-tem through Spatial Planning 2005-2007) This Baltic-wide project aimed to develop informed marine management tools for the Baltic Sea based on spatial planning cross-sectoral and transnational co-oper-ation (eg Ekebom et al 2008) The work
1 mapshelcomfiwebsitemapservice2 wwwbalance-euorg
included a definition of Baltic Sea marine landscapes and the development of habi-tat maps which were also used as a basis in the current report (Al-Hamdani and Reker 2007) The work further included an evalu-ation on the state of knowledge on essen-tial fish habitats (Bergstroumlm et al 2007) The project was EU co-funded within the BSR INTERREG III B Program
The Baltic Scope project3 (2015-2017) was the first Baltic Sea project to bring to-gether national authorities with a planning mandate to collaborate in transboundary maritime spatial planning The project also collected information about essential fish habitats from national plans It was con-cluded that countries used very different approaches to map essential fish habitats For future work the project recommended to produce common essential fish habitat maps for fish species with a Baltic-wide dis-tribution (Baltic Scope 2017) The project was co-funded by the European Maritime and Fisheries Fund
The BONUS INSPIRE project4 (Inte-grating spatial processes into ecosystem models for sustainable utilization of fish re-sources 2014-2018) included the aim to re-solve the habitat requirements of different life stages of Baltic fish species focusing on cod herring sprat and flounder (Ojaveer et al 2018) In doing so the project combined field surveys and traditional methods with the application of modern analysis and modelling techniques The project was funded by the Baltic BONUS programme the EU and national funding institutions in the Baltic Sea countries
The Fish-Hab-II project (2017-2018) de-veloped habitat maps for different life stag-es of ten commercially important species in Danish waters The maps were produced for the Kattegat Belt Seas the Sound and
3 wwwbalticscopeeu4 wwwbonus- inspireorg
the western Baltic Sea area (from 959deg to 1372degE and from 5421deg to 5778deg N) and included for example EFH maps based on predictive models for cod European floun-der plaice and sole (Stoslashttrup et al 2019) The project was funded by the European Maritime and Fisheries Fund
The NCM Workshop on Essential Fish Habitats was funded by the Nordic Council of Ministers and organized by the Swedish University of Agricultural Sciences was held in 2015 with the objectives to review exist-ing knowledge on the role mapping and monitoring of essential habitats of coastal fish in the Baltic Sea (Kraufvelin et al 2016) The workshop did not produce spatial infor-mation but collated and developed a struc-tured knowledge-base for different areas around the Baltic Sea regarding the char-acteristics of essential fish habitats in coastal areas The outcome included for example information on how essential fish habitats can be defined in relation to other abiotic and biotic variables biotopes or biotope complexes as well current threats to these (Kraufvelin et al 2018)
In addition several nationally coordi-nated activities and initiatives to develop maps on nature values were considered As one such example the Finnish MSP is de-veloping synthesis maps describing ldquoeco-logically significant underwater nature areasrdquo covering the entire Finnish coastal area and representing all different ecosys-tem aspects essential fish habitats plants macroalgae bottom animals seals water birds etc Good spatial data is available from existing monitoring and the extensive VELMU inventory program5
The Copernicus Marine Environment Monitoring Service6 has provided envi-ronmental variables covering whole Baltic Sea which were used in several of the maps
5 wwwymparistofien-USVELMU 6 marinecopernicuseu
8
2 Methods Essential fish habitats in the Baltic Sea Identification of potential spawning recruitment and nursery areas
areas are here defined as areas where juvenile life stages concen-trate and which also support the adult population at a significant-ly larger spatial scale (Beck et al 2001 Dahlgren et al 2006)
Data availability to support the mapping of spawning areas was explored for seven species with commercial and ecological importance and a wide distribution in the Baltic Sea and such maps were developed for cod sprat herring European flounder and Baltic flounder Additionally existing maps on recruitment ar-eas for perch and pikeperch were evaluated and updated Finally a map on nursery areas was completed for flounders This map shows potential nursery areas for European and Baltic flounder together as these are not possible to distinguish based on field data and to large extent overlap with each other It is suggested that additional maps on nursery areas are added to the set when data and models are sufficiently developed to support this partic-ularly for cod plaice sole and flounder in the Western Baltic
23 Mapping approaches
Maps on essential fish habitats can be produced in several ways The maps presented in this report were sometimes produced in different ways depending on available information for each species This section gives a summary of the different types of approaches that were considered in the work The approaches applied for each of the species is presented in section 25 and an overview is provided in Table 1
Direct data The most reliable verification of a fish habitat is typ-ically by direct mapping based on inventory or monitoring data However since collecting field data is costly comprehensive inven-tory data on fish is often scarce It is also challenging to ascertain that the mapping results have reliable coverage This is especially true for parameters representing fish spawning recruitment and nursery areas such as the presence and abundance of fish eggs larvae and young of the year which are only present during part of the year Hence available direct data to support mapping have limited spatial extent and comprehensive data at the whole Baltic Sea scale do not exist for any of the focal species However avail-able data can still be used for the areas they represent if they have adequate resolution and coverage and ensuring that the variable descriptions (units) are comparable among different areas Avail-able direct data can also support other approaches mentioned below or be used to validate maps produced by other approaches
Species distribution models Spatial predictive modelling pro-duces maps with fuller spatial coverage which describe the prob-able distribution of fish habitats Direct data from inventories or monitoring are used as a basis for developing statistical models depicting the relationship between the key variable and environ-mental parameters Typical important environmental parameters in the case of fish habitats are for example depth salinity and wave exposure among others The statistical models are then combined with spatial data on the environmental parameters identified as having predictive importance to identify areas with similar environmental properties as the fish habitats identified in the inventory Resulting maps show the probability of occurrence of the essential fish habitat in focus according to the applied mod-el to be further validated against other information
Environmental envelope approach The envelope approach builds on similar principle as species distribution models but is not dependent on spatially referenced input data The environ-
mental envelope for a certain species and life stage is defined based on ecological knowledge on its limiting required environ-mental conditions The key environmental variables and their threshold values are identified for example based on experimen-tal studies or other relevant literature In the absence of published information expert judgement can be considered The important aspects to decide on are which environmental variables should be included in defining the envelope and what threshold levels to apply for these variables
Habitat associations If information to support the environ-mental envelope approach is insufficient the fish habitat may be depicted on an overarching level based on the distribution of benthic habitats that the focal species and life stage is mainly as-sociated with Data that could be useful include spatial informa-tion on habitat types or habitat- building species Maps on Natura 2000 habitat types might also be relevant to consider even though obtained estimates should be associated with high uncertainty as differences among countries can be expected in how the Natura 2000 habitat types are defined and delineated
24 Validation and evaluation of data quality
The initial maps should as far as possible be validated against oth-er sources of knowledge before finalization The purpose of the validation is to identify and correct for errors which may occur due to uncertainties in several factors such as the precision of the applied input data ecological assumptions the generality of the models and others If the validation suggests consistent errors in comparison with external information the selection of approach key environmental variables or threshold values should be re-ex-amined The maps should further be associated with information on data quality aspects when presented
In the current case the validation and evaluation of data quality were carried out by the HELCOM Pan Baltic Scope EFH WS (HELCOM 2018a) and in later steps by correspondence with national experts (for example HELCOM 2019 c d) When clearly justified the initial maps were adjusted manually For example the applied approach might have picked up highly modified or disturbed areas where spawning is in fact not possible (examples include channels lagoons city harbors) or additional areas were added referring to locally available mapping data Data quality aspects in relation to the presented maps are shown in Chapter 3 and discussed in Chapter 4
25 Approaches applied for the different species
Available data and knowledge were examined for each of the sev-en species and the focal aspects to decide on a mapping approach Among mapping approaches direct mapping and species distri-bution modelling were preferred whenever feasible However suf-ficiently developed research to support this was not available for pelagic habitats Hence the environmental envelope approach was applied for the maps on spawning areas of cod and sprat For floun-ders a combination of species distribution modelling and environ-mental envelope was used For herring spawning habitats available data were only sufficient to support a broad mapping based on hab-itat associations (For an overview see Table 1)
9
2 Methods Essential fish habitats in the Baltic Sea Identification of potential spawning recruitment and nursery areas
Further for the process of mapping of essential fish habitats Planque et al (2007) classified maps into either potential realized or effective essential fish habitats depending on what underlying data and assumptions the maps were based on By their defini-tions ldquopotential habitatsrdquo are those where water masses or sub-strates can support a particular life stage during a certain period of time based on for example known environmental constraints ldquoRealized habitatsrdquo again are those which have been observed to uphold that life stage based on for example sampling to show that fish eggs are present Last ldquoeffective habitatsrdquo are those which support the highest densities or have the highest relative con-tribution to the population In relation to this classification the Baltic-wide maps presented here represent potential habitats or areas where the focal habitat is likely to be found based on known environmental constraints and validated by available sampling Mapping either realized habitats or effective habitats as defined by Planque et al (2007) was not realistic at the Baltic wide scale in our work due to the many uncertainties involved as outlined above For more information on the mapping approaches applied here see section 25 Some more details on the key information consid-ered for each of the species and focal aspects are presented below
26 Cod
Cod (Gadus morhua) occurs from the Kattegat to the Baltic Proper and is hence the most widely distributed predatory fish species in the Baltic Sea Cod is important commercially but it is also a key species in the ecosystem It is the predominating predatory fish species in the open sea and a central link in the food web that connects benthic and pelagic systems By the delineation applied in fisheries management cod is represented by three stocks in the
region Eastern Baltic cod Western Baltic cod and Kattegat cod (ICES 2019a b) The map focused on spawning areas for cod
The hydrographical environment is of high importance for cod spawning in the central Baltic Sea Spawning success is mainly dependent on suitable salinity and oxygen conditions as well as
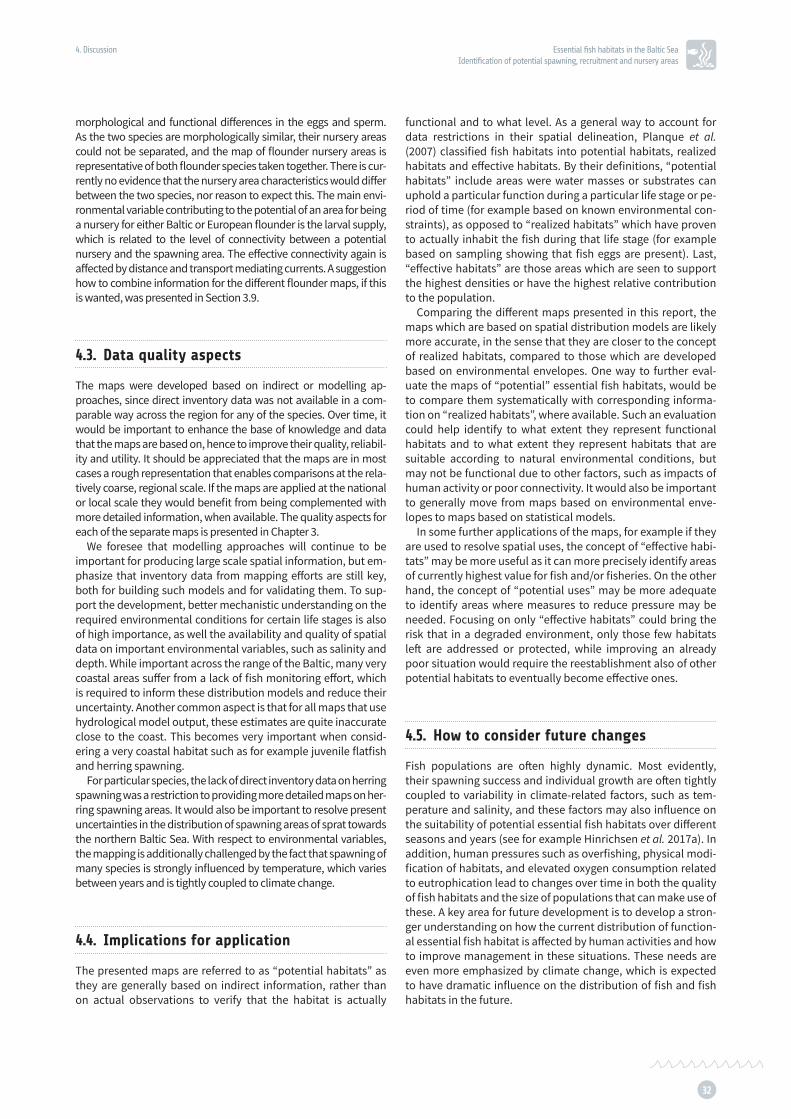
on temperature For these reasons the spawn-ing success of cod is substantially different in different parts of the region and it also varies among years Conversely a lack of suitable oxy-gen and salinity conditions has negative effects on spawning success via effects on fertilization efficiency and egg survival Eggs occurring close to the seabed also face increased risk of mortal sedimentation These hydrographical conditions depend strongly on climate change as well as on eutrophication levels in the case of oxygen In ad-dition the fact that the cod population is strongly reduced may affect to what extent some potential spawning areas are utilized in reality Available evidence show that the extent of suitable cod spawning areas has decreased over time in the Baltic Sea For example the progress of decline of cod spawning areas in the Arkona deep Gdansk deep and Gotland deep during 1971-2010 was shown through a combination of hydrodynamic modelling and Lagrangian particle tracking by Hinrichsen et al (2016 Figure 1) These findings raise questions about the current function of the Gotland deep for cod spawning as known previ-ously (Bagge et al 1994) They also emphasize the critical need for sustainable management of the Bornholm deep and the Arkona deep as further emphasized by climate change (Box 2)
Figure 1 Progression of suitable habitat status for spawning grounds for cod in southeast Baltic Sea 1971-2010 (Aggregated on basis of Hinrichsen et al 2016)
Box 2 Potential future scenarios under climate change
The importance of climate-related variables such as salinity temperature and oxygen for cod spawning in the Baltic Sea stresses the need to develop forecasts and spatial scenarios on how spawning areas may be affected by climate change In the Swedish maritime spatial planning process small steps were taken in this direction by identifying potential climate refugia
Climate refugia are areas where the effects of climate change on the ecosystem are estimated to be relatively milder (Dahlgren and Havenhand 2017) Through modelling based on projected climate-related changes in the future the Swed-ish MSP process searched to identify potential climate refugia for (inter alia) Eastern Baltic cod using climate scenarios from IPCC Models based on projected changes in salinity and oxy-gen under IPCC scenarios RCP 45 and RCP 85 indicated that even Eastern Baltic cod will most probably not have success-ful spawning in the Baltic Sea in year 2100 At RCP 45 a mar-ginal area of potentially suitable habitat was considered but would likely be too small to sustain the population also given foreseen interannual variability in environmental conditions (Toumlrnqvist et al 2019)
10
2 Methods Essential fish habitats in the Baltic Sea Identification of potential spawning recruitment and nursery areas
In the western Baltic the hydrographical conditions are less criti-cal and instead cod population abundance and age structure are relatively more important factors for recruitment The western and eastern Baltic cod stocks partly overlap and the Arkona deep is es-timated to be functional for spawning of both stocks (Huumlssy 2011)
The previously existing regionally agreed map on cod spawning areas was developed within the HELCOM HOLAS II project (HEL-COM 2018b) based on information from literature The map was approved by all HELCOM Contracting Parties in a review process However the HELCOM Pan Baltic Scope EFH WS recommended that the new map on spawning areas of cod should rather be de-veloped using an environmental window approach that consid-ers the different ecological characteristics of Eastern Baltic cod and Western Baltic cod and includes available information on Kattegat cod Background information for each of these stocks is presented below
Eastern Baltic cod Studies of the horizontal distribution of cod eggs and larvae have identified the Bornholm Basin the Gdansk Deep and the Gotland Basin as the major potential spawning grounds for Eastern Baltic cod In the eastern Baltic the spawning period is extended from March to August During the 1970s and late 1980s peak spawning took place between the end of April and mid-June A gradual shift in the timing of spawning to the end of July was observed in the 1990s and later years (Bagge et al 1994 Wieland et al 2000) Suitable environmental conditions for egg and larvae production for Eastern Baltic cod occur regularly throughout all years recorded in the Bornholm basin The abun-dance of cod eggs during the main spawning time is in general the highest in the Bornholm deep Additionally cod spawning takes place regularly in the Slupsk Furrow (ICES 2018) Since the mid-1980s cod spawning is very rare in the Gdansk and Southern Got-land basins Reproduction conditions improves during baroclinic inflows of marine water from the North Sea For example a Major Baltic Inflow in 2014-2015 led to a certain but relatively short-time improvement of cod reproductive volume and larval production in these areas (Morholts et al 2015 Naush et al 2014) However the Gdansk and Gotland basins have overall small contributions to cod recruitment since the mid-1980s which are observed in some years only The reduction is related to weaker and less frequent baroclinic inflows stagnation processes in the basins as well as low stock size (MacKenzie et al 2000 Koumlster et al 2009 Plikshs et al 2015 Koumlster et al 2017)
The use of spawning area and rate of successful spawning de-pends on the spawning stock size and suitable environmental conditions Environmental threshold values for spawning were suggested at salinity gt11 (ensuring egg buoyancy and fertilization) oxygen gt 2mLL (egg survival) and temperature gt 15ᵒC (Westin and Nissling 1991 Wieland et al 1994)
Western Baltic cod Western Baltic cod spawns from January to May with the main spawning period from March to April (Bleil et al 2005 2009) Spawning areas are regions of deeper than 20 m in the Kiel Bight the Fehmarn Belt and the Mecklenburg Bight En-vironmental threshold values for spawning of Western Baltic cod have been suggested at salinity 18-33 (ensuring egg development and survival) and temperature gt 2ᵒC (Nissling and Westin 1997 Rohlf 1999 Hussy et al 2012)
Kattegat cod Spawning in Kattegat cod takes place from be-ginning of January to end of April The spawning peaks in Janu-ary to February (Vitale et al 2005) and shows is a spatial gradient with later spawning in the southern areas Spawning aggregations have been observed north of Laeligsoslash in the central Kattegat (Bar-
tolino et al 2012) southern Kattegat including Skaumllderviken and Laholm Bay (Hagstrom and Wickstroumlm 1990 Svedaumlng and Bardon 2003) and in the Sound and Great Belt (Bagge et al 1994) How-ever with the declining stock spawning is no longer observed in many of the earlier spawning sites Active spawning sites are re-ported off the coast of Falkenberg in Sweden or more predomi-nantly in the southeastern Kattegat very close to the entrance to the Sound (Vitale et al 2008 Boumlrjesson et al 2013) Stoslashttrup et al (2019) showed salinity and depth to be significant predictors for cod spawning areas in the Kattegat They used generalized addi-tive models based on survey data for predicting spawning areas Results showed important spawning grounds in the areas off Falkenberg and to the south along the Swedish coast in the south-eastern part of the Kattegat around the entrance to the Sound and the Sound (See also Box 1) The HELCOM Pan Baltic Scope EFH WS suggested to apply a salinity threshold of 18 for spawning also for Kattegat cod (Nissling and Westin 1997 Hussy et al 2012)
261 Sprat
Sprat (Sprattus sprattus) is a small-bodied clupeid It occurs in the entire Baltic Sea mainly in open sea areas Sprat is pelag-ic schooling species which preys on zooplankton and fish eggs and functions as prey for top predators such as cod It represents one of the most important commercially exploited fish species in the Baltic Sea In fisheries management sprat is assessed as a single stock within the ICES subdivisions 22-32 in the Baltic Sea (ICES 2019a) The map focused on spawning areas for sprat
The highly stratified deep basins in the central Baltic are known to be the major spawning grounds of Baltic sprat The spawning time is different in different parts of the Baltic Sea and overall recruitment success varies tightly with temperature (Baumann et al 2006) Spawning typically occurs from February to August in the deeper parts of Bornholm and Gdansk Basins Further north it starts later giving an overall shorter time win-dow for spawning Sprat eggs are pelagic and are assumed to have a minimum limit for survival and buoyancy at a salinity of 6 (Petereit et al 2009) Recent fisheries surveys indicate that sprat spawning does no longer occur in the Gulf of Finland
There was no previously existing map on sprat spawning grounds covering all of the Baltic Sea why a new proposal for such a map was developed
262 Herring
Atlantic herring (Clupea harengus) is alongside sprat the most abundant pelagic clupeid in the Baltic Sea It is widely distrib-uted and common in all sub-basins The Baltic Sea herring is smaller than herring in the Atlantic and is well adapted to the low salinity Herring feeds in the pelagic where it mainly eats zooplankton but also other species It is an important prey for cod and marine mammals and has significant commercial im-portance in all of the Baltic Sea Genetic studies and observa-tions on spawning behavior suggest that herring shows strong local population structure in the Baltic Sea (eg Joslashrgensen et al 2005) In fisheries management Baltic herring is assessed based on four stock units representing western Baltic spring spawning herring (ICES subdivisions 22-24) Central Baltic Sea (subdivisions 25-27 282 29 and 32) Gulf of Riga (subdivision 281 and Gulf of Bothnia (subdivisions 30-31 ICES 2019a) The map focused on spawning areas of herring
11
2 Methods Essential fish habitats in the Baltic Sea Identification of potential spawning recruitment and nursery areas
Herring spawns in shallow coastal areas and in offshore shal-lows It has demersal eggs which are attached to the seabed substrate There are populations of both spring spawning and autumn spawning herring in the Baltic Sea out of which spring spawning herring strongly dominates today Available information on the distribution of herring spawning grounds are mainly based on direct local observations (see referenc-es in next section) In addition spatial predictive modelling based on physical parameters on a smaller-than regional scale has been initially explored (Modin 2008)
Studies on herring spawning grounds have been made mainly in four areas in the Greifswalder Bodden the Gulf of Riga and Paumlrnu Bay the Askouml-Landsort area in Sweden and on the Finnish coast extending from the Gulf of Finland to the Bothnian Sea All studies were made by SCUBA diving which allows direct observations of herring spawn on the bottom The first surveys of herring spawn were carried out in the 1940s and 1950s in the Gulf of Riga (Rannak 1959) The same spawning areas were also revisited in the 1980s by Raid (1990) In the Greifswalder Bodden Scabell amp Joumlnsson (1984) and Joumlnsson et al (1984) studied the spawning substrates and egg densities of the Ruumlgen herring and Klinkhardt et al (1985) described the successive use of spawning beds during the spawning season in the same area Scabell and Joumlnsson (1989) presented the monitoring program used in the spawn-ing areas of the Ruumlgen herring in the 1980s In the Gulf of Riga Ojaveer (1981) and Raid (1990) studied the density and mortality of herring eggs on the spawning grounds and Kor-nilovs (1994) made similar studies on the Latvian coast In the east coast of Sweden (Askouml archipelago) Aneer and Nellbring (1982) made an extensive survey of spawning beds and de-scribed the characteristics of herring spawning at the end of the 1970s Aneer et al (1983) also made observations on the herringrsquos spawning act in situ in the Askouml area In the Archi-pelago Sea characteristics of herring spawning have been studied by Rajasilta et al (1986 1989 1993) Oulasvirta et al (1985) and Kaumlaumlriauml et al (1988 1997) To gather information on spawning grounds along the Swedish east coast covering the coasts of the Bothnian Bay the Bothnian Sea and the Baltic proper an interview study directed towards persons with ex-tensive local experience of fishes and fishing was carried out in 2003 (Gunnartz et al 2011) More recent studies in the Baltic Sea cover Lithuanian coast (Šaškov et al 2014 Naumlslund et al 2011) The Vistula Lagoon and Pomeranian Bay are important spawning grounds of herring (Popiel 1955 1984 Strzyżewska 1969 Fey 2001 Fey et al 2014a 2014b Krasovskaya 2002)
According to the study results herring spawn in quite sim-ilar conditions around the Baltic Sea In the innermost archi-pelagos spawning in spring takes place mainly on shallow bottoms (0-8 m) but in the autumn at some greater depths (Oulasvirta 1987) Herring prefers aquatic vegetation as a spawning substrate but does not show selection for any sub-strate type (Aneer 1989) The herring schools visit the same spawning grounds one generation after another (Raid 1990) and in some spawning areas the spawning beds are used suc-cessively during the spawning season (Klinkhardt et al 1985 Rajasilta et al 1993) The common conclusion from the stud-ies is that herring spawns in relatively shallow areas mostly in areas characterized by hard bottom or on soft bottoms with erect vegetation The specific site for spawning within these areas may however be variable both among years and within
the same season as it also depends strongly on hydrological characteristics such as temperature and currents
There was no previously existing map on herring early life stages covering all of the Baltic Sea why a map on potential herring spawning areas was developed
263 Flounder
The taxonomic status of flounders in the Baltic Sea (Platich-thys spp) was revisited shortly before the time of this study It has long been known that flounders in the Baltic Sea have two different reproductive strategies representing offshore spawning populations with pelagic eggs and coastal spawn-ing populations with demersal eggs (Solemdal 1967 Nissling et al 2002) These two strategies were shown by Momigliano et al (2017) to belong to two closely related but distinct species Flounder with demersal eggs was described as a new species the Baltic flounder Platichthys solemdali (Momigliano et al 2018) The two species have overlapping feeding and winter-ing areas in the central Baltic Sea but are spatially separated during spawning time The maps focused on spawning areas of European flounder and Baltic flounder respectively and on recruitment areas for both flounder species taken together
Since the formal delineation between European and Baltic flounder was made very recently there were no studies formal-ly addressing physiological features of the two verified species but relevant information was obtained from earlier studies that distinguished the two now formally described distinct species as two different spawning ecotypes
European flounder (Platichthys flesus) is a key species in many areas of the Baltic Sea with a focus in the central and south-western sub-basins European flounder spawns exclu-sively in deep offshore basins of the south-western and central Baltic Sea where salinity is high enough for successful fertiliza-tion and water density is sufficiently high for the eggs to float in the water column to avoid the anoxic bottom waters (Nissling et al 2002 Ustups et al 2013) The species migrates between coastal and open sea areas during its life cycle Adults feed in shallow coastal areas during summer and move out to deep-er areas in winter where the spawning takes place in spring Early juvenile life stages again reside in shallow coastal areas until recruiting to the adult population (eg Carl et al 2008) Available literature suggests that the environmental limits for spawning of European flounder are rather similar to those of cod with respect to salinity and may suggest that its require-ments for oxygen are lower than for some other fish species (Steffensen et al 1982 Fonds et al 1992) Results from the hy-drodynamic modelling suggest that the level of connectivity may be high (Hinrichsen et al 2017b)
Baltic flounder (Platichthys solemdali) spawns in shallow coastal areas and on offshore banks In these spawning areas the eggs do not float as is the case for European flounder but sink to the bottom Demersally spawning flounders have been observed to lay their eggs on sandy and rocky bottom or on rocky substrates covered with algae (Bonsdorff and Norkko 1994) Early juvenile life stages reside in shallow coastal areas until recruiting to the adult population (Nissling et al 2015) Similar as for European flounder adult Baltic flounder has a migrating behavior so that it feeds in coastal areas during sum-mer and moves to deeper areas in winter In contrast to Euro-pean flounder it however spawns demersally in coastal areas
12
2 Methods Essential fish habitats in the Baltic Sea Identification of potential spawning recruitment and nursery areas
and the salinity requirements for spawning of Baltic flounder are lower Successful spawning for demersally spawning Bal-tic flounder may be expected at salinities down to around 5-7 (Nissling et al 2002) Low oxygen concentration poses a less important restriction to spawning as the coastal near-shore spawning waters are in most cases well oxygenated
264 Spawning areas of European flounder
Potential spawning habitats for flounders in the Baltic Sea were characterized and spatially predicted by Orio et al (2017) based on catches of flounder in gillnet surveys during the spawning season The basis for the study was to map mature flounder during or very close to the spawning season when they were expected to occur in their preferred spawning habitat and subsequently use the catch observations together with observed environmental data as a basic for predictive modelling over a larger geographical area (Figure 2) The focus of the study was on the southern and central Baltic Sea using depth transects at 11 locations (427 stations) The approach provides a wide-ranging description of potential spawning areas in the Baltic Sea with statistical documentation of the expected rela-tionships to environmental variables A separate model for pelagic spawning flounder (here interpreted as European flounder) showed a negative relation with temperature and bottom current and a positive relation with salinity (Figure 3)
The main uncertainties in the results by Orio et al (2017) are expected due to temporal differences in sampling and spawning time between different areas so that there is some variability in how close to spawning the flounders were at the time of capture In some areas there also occurred spent flounder in the samples which means that the flounder could spawned in another place than where they were captured This is not expected to affect results at the coarse geographical scale used here but may affect the small-scale patterns (primarily depth distributions) Generally the spawn-ing occurs earlier in the western parts of the Baltic Sea In addition low captures of flounder at some of the stations might not only re-flect poor habitat preference but may also reflect other factors for example a reduced spatial expansion due to low population size If that is the case the predicted habitat range may be underestimat-ed This may potentially affect results for pelagic spawners2 in ICES subdivisions 26-28 whereas pelagic spawners in subdivisions 24-25 have fairly strong populations (Orio et al 2017b)
To prevent extrapolation outside the realistic range of sampled en-vironmental conditions Orio et al (2017) restricted their predictions to areas within the physiological limits for fertilization of flounder egg and survival based on salinity and oxygen conditions The spatial pre-dictions were also limited in relation to depth to account for the exis-tence of two different spawning types (which were later described as separate species by Momigliano et al 2017 2018) The depth limit for pelagic spawners was set to areas deeper than 30 m and the bottom salinity to at least 10 referring to Hinrichsen et al ( 2017b) In relation to oxygen concentrations the prediction was set to 0 in all areas with bottom oxygen concentrations below 1 mll In reality the geographi-cal range of suitable spawning areas for European flounder is expect-ed to vary along with spatial variation in these hydrological variables which are forced by climate change as well as human impact related to eutrophication An increase of suitable spawning areas can be ex-pected for example in connection to Major Baltic Inflows
2 Representing European flounder
Figure 2 General model for flounder spawning areas in the Baltic Sea Response curves of environmental variables in a statistical predictive model This general model was based on data representing both Baltic and European flounder data (referred to as ldquoecotypesrdquo at that time) Dashed lines show the 95 confidence interval Source Orio et al (2017)
Figure 3 Model for pelagic spawning flounder (representing European flounder) Response curves of environmental variables in a statistical predictive model This model was made separately for data on mature flounder in deep areas Dashed lines show the 95 confidence interval Source Orio et al (2017)
13
2 Methods Essential fish habitats in the Baltic Sea Identification of potential spawning recruitment and nursery areas
Figure 4 Model for demersal spawning flounder (representing Baltic flounder) Response curves of environmental variables in a statistical predictive model This model was made separately for data on mature flounder in shallow areas Dashed lines indicate the 95 confidence interval Source Orio et al (2017)
the same nursery habitat Both European and Baltic flounder spawn in spring the former in late winter to spring and the latter in spring and early summer Young of the year fish can be observed from June to September on shallow sea beds primarily sandy substrates
Juvenile flounder (young of the year) have been sampled by three different principal methods In the Baltic Sea beach seine push net and mini trawl The three methods differ in how large area they cover but since all methods sample a known surface area their re-sults can be converted to ldquocatch per unit areardquo to be comparable A dedicated data request was carried out within the Pan Baltic Scope project and showed that comparable survey data are available for many parts of the Baltic Sea albeit with data gaps in the southern Baltic Sea (Figure 5) The natural distribution range of the two floun-der species does not extend into the Gulf of Bothnia or inner Gulf of Finland at least not with respect to spawning areas
A spatial predictive model was applied to make use of currently available data and create a map of potential nursery areas of floun-der Data from all identified available surveys of juvenile flounder were collected and compiled for the modelling (Figure 5) While in a few of the datasets occasional older juveniles may have been in-cluded the absolute majority of the observed fish were young of the year individuals why the model will represent the distribution of the youngest year-class Only results from surveys performed in June-September from 2004-2018 were used to represent the nurs-ery season and the current situation This resulted in a total of 2114 samples To harmonize the datasets all abundance estimates were converted to ldquojuvenile flounder per square meterrdquoValues for the environmental predictor variables were extracted in GIS for each sampling point The following variables were used salinity wave exposure water depth slope of the bottom surface temperature (mean for June-September) bottom currents and dis-tance to high probability spawning area for European flounder
265 Spawning areas of Baltic flounder
The predictions of potential spawning habitats for flounders in the Baltic Sea carried out by Orio et al (2017) and presented above for European flounder are also relevant for Baltic flounder Among their principal results were observations on a dual water depth distribution and salinity preference of flounders at spawn-ing time which they interpreted as distinct responses to these environmental variables by the two ecotypes later redefined to two species (Figure 2) The separate model for the demersal ecotype (P solemdali) showed a salinity optimum at around sa-linity 7 (Figure 4) The model indicated no strong relationship to vegetation or substrate although rocky habitats seemed to be preferred over pure soft substrate (Orio et al 2017)
The main uncertainties in demersal flounder model are the same as those presented for European flounder (above) Ad-ditionally in some areas a negative interaction with the pres-ence of round goby may lead to underestimations in prediction (this is encompassed in Figure 4)
To prevent unrealistic extrapolation outside the range of sampled environmental conditions Orio et al (2017) restricted the predictions to areas within the physiological limits for eggs fertilization and survival The predictions were also adjusted in relation to depth to account for the existence of two different spawning types (which were later described as separate species by Momigliano et al 2017 2018) For demersal spawners the predic-tions were restricted to areas shallower than 30 m and with salinity of at least 6 referring to Nissling et al (2002) and Hinrichsen et al (2017b) In relation to oxygen concentrations the prediction was set to 0 in all areas with bottom oxygen concentrations lt 1 mlL
266 Nursery areas for flounder
As shown in the sections above the two flounder species in the Bal-tic Sea European flounder (Platichthys flesus) and Baltic flounder (Platichthys solemdali) have different reproductive strategies and their principal spawning areas are spatially and temporally separat-ed The Baltic flounder spawns in shallow waters while European flounder spawns in deeper areas Despite these differences larvae of both species settle in shallow areas so that the two species share Figure 5 Data sampling points used in the juvenile flounder model
14
2 Methods Essential fish habitats in the Baltic Sea Identification of potential spawning recruitment and nursery areas
For making spatial predictions of flounder nursery areas a general-ized additive model with flounder abundance as response variable and the seven environmental predictor variables was constructed (Figure 6) The northern and eastern boundaries of the spatial mod-el were defined based on the predicted areal extent of the spawning areas of Baltic flounder (see above) combined with information on where juvenile flounder was caught in the surveys
Based on the models high probability nursery areas were de-fined as areas with a predicted abundance over 003 juvenile floun-der per square meter Potential nursery areas were defined by pre-dicted abundance levels between 00001 and 003 juvenile flounder per square meter Areas with a predicted abundance below 00001 were not defined as flounder nursery areas
267 Perch Perch (Perca fluviatilis) is a predominating species in many coastal areas of the Baltic Sea and a key species in coastal fish communities of the Northern and central Baltic Sea While young perch feed on zooplankton before they shift to feeding on benthic animals adult perch are predominantly piscivores It is a widely appreciated for rec-reational fishing but also has commercial importance for small-scale coastal fisheries The map focused on recruitment areas of perch
Perch is a species of freshwater origin and hence it spawns predominantly in freshwater tributaries and coastal areas close to freshwater outlets Along the coasts of Finland and Sweden perch can also spawn further away from freshwater outlets if there are enclosed bays which warm up early in the season (Snickars et al 2010 Bergstroumlm et al 2013 Sundblad et al 2014) In the southern Baltic Sea such as the Curonian lagoon perch spawns closer to the coast in areas where vegetation or other structures create suit-able spawning conditions (Jankevičius et al 1959 Gaigalas 2001 2011) Genetic studies and tagging studies suggest that perch has a local population structure with limited dispersal away from its recruitment area (eg Olsson et al 2011)
A regional map on recruitment areas of perch was made avail-able at the HELCOM Maps and data services during the HOLAS II project (HELCOM 2018b) when it was approved by all HEL-COM Contracting Parties in a dedicated review process The existing map was considered by HELCOM Pan Baltic Scope EFH WS 1-2018 who proposed adjustments to the areas covered in Russia and amendments to the text on data quality
268 Pikeperch
Pikeperch (Sander lucioperca) is found in coastal areas across the Baltic Sea predominantly in high-turbidity archipelago ar-eas and close to freshwater tributaries It is an appreciated spe-cies for the fisheries Adult pikeperch are piscivores The map focused on recruitment areas for pikeperch
Pikeperch is of freshwater origin It spawns predominantly close to freshwater tributaries to the Baltic Sea but also tol-erates relatively higher salinities (Ložys 2004 Lehtonen et al 1996) As pikeperch generally prefers turbid waters it is often associated with relatively more eutrophic areas (Bergstroumlm et al 2013 2019) Pikeperch shows local population structure and is assumed to show limited dispersal away from its recruitment area (Saumlisauml et al 2010) Populations are highly affected by fish-ing in many coastal areas (Lehtonen et al 1996 Mustamaumlki et al 2014)
Similar as for perch a regional map on pikeperch recruit-ment areas was made available at the HELCOM Maps and data services during the HOLAS II project The existing map was considered by HELCOM Pan Baltic Scope EFH WS 1-2018 who proposed adjustments to the areas covered in Estonia and Lith-uania and amendments to the text on data quality
27 Aggregation of data layers
An additional consideration for the purposes of maritime spa-tial planning (MSP) is that there can be a need to synthesize and combine the data for different species further to depict core areas for essential fish habitats at a general level The HELCOM Pan Baltic Scope EFH WS (HELCOM 2018a) considered the pro-duction of aggregated essential fish habitat maps for use in MSP processes and identified some key points for how such maps should preferably be developed at the Baltic Sea regional scale
Before producing aggregated maps it should be ensured that all maps to be combined are presented on a comparable scale They are preferably transformed either to representing only values between 0 and 1 or to the binominal scale (repre-senting only values 0 or 1)
It should also be ensured that the maps represent similar aspects to provide a meaningful aggregated map For exam-ple essential fish habitat maps may describe either spawning nursery habitats or some other aspect
When the maps are combined in GIS as described above the theoretical maximum value in the aggregated map is the total number of maps that are included However it should be not-ed that in reality this theoretical maximum only occurs in the rare case that all included data layers overlap spatially at least somewhere in the studied area If the aggregated map is to be used further in comparisons with other data layers the values should also be transformed to vary between 0 and 1
Figure 6 Response curves from the juvenile flounder model The generalized additive model explained 413 of the deviance in the data and the Rsup2-value was 032
15
2 Methods Essential fish habitats in the Baltic Sea Identification of potential spawning recruitment and nursery areas
The aggregated map should be supplemented with information on its seasonal relevance to recognize the fact that fish species use different habitats during different seasons In some cases seasonally comparable information is required to be able to use the aggregated map in a relevant way For other purposes information on the average situation over the year (annually representative information) is sufficient When applicable an overall aggregated map representing all essential fish habitats could be supplemented with separate aggregated maps for each quarter of the year to show differences in seasonality
When presenting the results at a Baltic scale it should be made clear that the expected number of essential fish habitats is different between different parts of the Baltic Sea due to nat-ural factors such as salinity
When using the resulting map it should be noted that an un-weighted aggregation gives equal influence to very common and less frequent species and that several potentially import-ant species of concern may risk being unconsidered if they are not represented in the underlying maps
Data limitations should be communicated stating for exam-ple if the aggregated map lacks information for some key as-pects of essential fish habitats or other data limitations
These aspects are intended as initial considerations to be developed further An illustrative example on to show these principles applied to the work presented in this document is presented in Section 39
16
3 Results Essential fish habitats in the Baltic Sea Identification of potential spawning recruitment and nursery areas
Figure 7 Potential spawning areas for cod
3 Results
The following chapter presents the resulting maps (Figures 7-14) together with background information on each of the data layers (Sections 31-38 Tables 2-9) The maps are also available at the HELCOM Maps and Data Service1
31 Potential spawning areas for cod
Cod (Gadus morhua) is represented by three stocks in the Baltic Sea Eastern Baltic Western Baltic and Kattegat cod which is reflected in the map ldquoPotential spawning areasrdquo were ini-tially delimitated based on Huumlssy (2011) In ad-dition the Gdansk deep as delineated by Bag-ge et al (1994) was included as it sometimes contributes to reproduction of Eastern Baltic cod (Hinrichsen et al 2016) The Gotland basin has ceased to contribute to the reproduction of cod (Hinrichsen et al 2016) These definitions were applied in the HOLAS II project (HELCOM 2018b) based on approval by all HELCOM Con-tracting Parties in a review process (there re-ferred to as lsquooccasional successful spawningrsquo and lsquosuccessful spawningrsquo) Following HELCOM (2018a) additional potential spawning areas were identified by environmental thresholds for egg development and survival based on sa-linity and oxygen conditions (Hinrichsen et al 2016) during 2011-2016 Separate thresholds were used for Eastern Baltic Western Baltic and Kattegat cod Areas denoted ldquohigh prob-ability spawning areasrdquo correspond to where the initial delineations (Huumlssy 2011 Bagge et al 1994) achieve the environmental threshold values (Table 2 Figure 7)
1 mapshelcomfiwebsitemapservice
17
3 Results Essential fish habitats in the Baltic Sea Identification of potential spawning recruitment and nursery areas
Species Cod (Gadus morhua)
Stocks Kattegat cod ICES subdivision 21 Western Baltic cod ICES subdivisions 22-24 Eastern Baltic cod ICES subdivisions 24 + 25-32
EFH type Potential spawning areas
Approach Literature review combined with identification of environmental window for spawning based on salinity and oxygen for Eastern Baltic cod and on salinity and depth for Western Baltic Cod and Kattegat cod
Time period 2011-2016
Data source Initial polygon data received from Karin Huumlssy DTU Aqua Denmark The method for delineating the spawning area is described in Huumlssy (2011)
Salinity and Oxygen Copernicus Marine Environment Monitoring Service SMHI The data represents monthly data for years 2011-2016 downloaded from Copernicus Marine Environment Monitoring Service (httpmarinecopernicuseu) Reanalysis products of SMHI for years 1989-2004 55km grid cells The layers represent condi-tions at the sea floor For salinity extrapolation to some coastal areas that were outside the original data due to low resolution of the grid was carried out
Depth Swedish Agency of Marine and Water Management For Metadata see SwAM (2019) p 232-236
Variables and thresholds Eastern Baltic cod Salinity gt 11 Oxygen gt 15 mlL (annual average)Western Baltic cod and Kattegat cod Salinity gt 18 Depth gt20 m
References Bagge et al (1994) Huumlssy (2011) Huumlssy et al (2012) Hinrichsen et al (2016)
Data quality The Arkona deep is functional for spawning of both the Eastern and the Western Baltic cod and in effect the defi-nition of the Arkona Basin as a high probability areas in the Arkona Basin reflect the result for Eastern Baltic cod
The effective distribution of cod spawning areas is highly dependent on the prevailing hydrological regime and the presence of spawning also depends on seasonally variable hydrographical conditions such as temperature salinity and oxygen Seasonal differences lead to a progressive spawning season towards the east typically start-ing in Kattegat and the Sound in JanuaryFebruary and ending in JulyAugust in the Bornholm area Fluctuations in temperature can delay the spawning season up to two months
It is difficult to collect egg samples to verify cod spawning as cod eggs may drift in deep areas and instead the level of ichthyoplankton is a main source for estimation of good environmental conditions for cod spawning Modelling based on ichthyoplankton should be validated by comparison with distribution of running adults to resolve the potential influence of prevailing current speed The proposed delineations are also influenced by research on the maturity of adults and histology of gonads
The adult and juvenile cod are distributed far outside of the spawning areas depicted in the map
Attribute information Raster value representing no spawning (0) potential spawning area (05) and high proba-bility spawning area (1)
Table 2 Data table for potential cod spawning areas
18
3 Results Essential fish habitats in the Baltic Sea Identification of potential spawning recruitment and nursery areas
Figure 8 Potential spawning areas for sprat
Species Sprat (Sprattus sprattus)
Stocks Sprat in subdivisions 22-32 (ICES)
EFH type Potential spawning areas
Approach Environmental envelope corrected for areas 20-40 m south of Bornholm
Time period 2011-2016
Data source Depth Baltic Sea Bathymetry database (httpdatabshcpro2518201) complemented in some coastal areas with Seifert et al (2001)
Salinity Copernicus Marine Environment Monitoring Service SMHI The data represents monthly data for years 2011-2016 downloaded from Copernicus Marine Environment Monitoring Service (httpmarinecopernicuseu) Reanal-ysis products of SMHI for years 1989-2004 55km grid cells The layers represent conditions at the sea floor Extrap-olation to some coastal areas that were outside the original data due to low resolution of the grid was carried out
Variables and thresholds Potential spawning area Depth gt 30 m Salinity gt 6 (annual average)High probability spawning area Depth gt70 m Salinity gt 6 (annual average)
References Grauman (1980) Bauman et al (2006) Voss et al (2012) HELCOM (2018a) National information from Poland
Data quality The map is based on literature and environmental variables not actual data on sprat spawning The map might overestimate the spawning area west and north of Gotland
The data layers on environmental variables are based on modelling
Attribute information Raster value representing no spawning (0) potential spawning area (05) and high proba-bility spawning area (1)
Table 3 Data table for potential sprat spawning areas
32 Potential spawning areas for sprat
Sprat (Sprattus sprattus) occurs in the entire Baltic Sea and mainly in open sea areas It is assessed as a single stock in the Baltic Sea within fisheries management Sprat eggs are pelagic and sprat spawning is well known from the deep basins in the central Baltic where it typically occurs from February to August Further north spawning starts later in the year and is less certain Recent fisher-ies surveys indicate that sprat spawning does no longer occur in the Gulf of Finland Sprat spawning areas were delineated using envi-ronmental variables due to lack of coherent field data across the Baltic Sea countries ldquoPo-tential sprat spawning areasrdquo were delineated as areas with salinity gt 6 and water depth gt 30 m but for the Arkona Basin depth gt 20 m was used (Grauman 1980 Bauman et al 2006 Voss et al 2012) ldquoHigh probability spawning areasrdquo were delineated for areas deeper than 70 m (Table 3 Figure 8)
19
3 Results Essential fish habitats in the Baltic Sea Identification of potential spawning recruitment and nursery areas
Figure 9 Potential spawning areas for herring
33 Potential spawning areas for herring
Herring (Clupea harengus) is widely distributed in the Baltic Sea and is common in all sub-ba-sins Herring feeds in the pelagic mainly on zoo-plankton and is an important prey for cod other fish and marine mammals In fisheries manage-ment herring in the Baltic Sea is sub-divided into several stocks Herring spawns in coastal areas or offshore shallows It has demersal eggs which are attached to the substrate Spawning may occur both in spring and autumn depend-ing on population but spring spawning dom-inates today Spawning areas of herring were identified by main habitat associations based on existing observations of herring spawning grounds in the Baltic Sea lsquoPotential spawning areasrsquo were delineated based on the distribu-tion of any of the following modelled photic zone photic hard bottom charophytes Fucus spp Furcellaria lumbricalis and Zostera marina several data layers were combined due to un-certainty in the coverage of some of them lsquoHigh probabilityrsquo spawning areas were identified as areas where the modelled photic zone overlaps with any of the other layers The habitat vari-ables were identified by other existing HELCOM data layers (Table 4 Figure 9)
20
3 Results Essential fish habitats in the Baltic Sea Identification of potential spawning recruitment and nursery areas
Species Herrring (Clupea harengus)
Stocks Herring in ICES subdivisions 22-24 (spring spawning) subdivisions 25-27 282 29 and 32 subdivision 281 (Gulf of Riga) subdivisions 30-31
EFH type Spawning areas
Approach Habitat associations combined with manual corrections to eastern Gulf of Finland (Neva inlet) Curonian lagoon Szczechin lagoon Vistula lagoon and German waters
Time period 2011-2016
Data source Photic zone As produced within the EU Interreg IIIB project BALANCE (HELCOM 2018c)Seabed sediments ndash Photic hard bottom Benthic biotope complexes in the Baltic Sea based on a combination of geolog-ical sediment data from the EU Interreg IIIB project BALANCE and light availability data from EUSeaMap (HELCOM 2018)
Charophyte distribution HOLAS II Dataset ldquoCharophyte distributionrdquo (HELCOM 2018d) representing the distribu-tion of charophytes (Chara spp Nitella spp Nitellopsis spp Tolypella spp) mainly based on data submission by HELCOM contracting parties Submitted point data were originally gathered in national mapping and monitoring campaigns or for scientific research Scientific publications were used to complement the data for the Curonian Vistula and Szczechin lagoons Polygon data from Poland was digitized based on the Polish Marine Atlas From Estonian waters a predictive model was used (200m resolution) which was converted to presenceabsence us-ing minimized difference threshold criteria All data (point polygon and the raster presenting predicted presence of charophytes) were generalized to 5km x 5km grid cells
Fucus speciesrsquo distribution HOLAS II Dataset ldquoFucus distributionrdquo (HELCOM 2018d) based on data submission by HELCOM contracting parties Mainly pointwise occurrences of Fucus were submitted as originally gathered in na-tional mapping and monitoring campaigns or for scientific research From Estonian waters a predictive model was used (200m resolution) that was converted to presenceabsence using minimized difference threshold criteria All data (point and the raster presenting predicted presence of Fucus) were generalized to 5km x 5km grid cells
Furcellaria lumbricalis distribution HOLAS II Dataset ldquoFurcellaria lumbricalis distributionrdquo (HELCOM 2018d) based on data submission by HELCOM contracting parties Mainly pointwise occurrences of Furcellaria were submitted originally gathered in national mapping and monitoring campaigns or for scientific research From Estonian waters a predictive model was used (200m resolution) that was converted to presenceabsence us-ing minimized difference threshold criteria For Poland only confirmed occurrence of Furcellaria was included (Slupsk bank Rowy reef and reef at Orlowo cliff) All data (point and the raster presenting predicted presence of Furcellaria) were generalized to 5km x 5km grid cells
Zostera marina distribution HELCOM HOLAS II Dataset ldquoZostera marina distributionrdquo (2018d) The data was based on data submission by HELCOM contracting parties Mainly pointwise occurrences of eelgrass were submitted originally gathered in national mapping and monitoring campaigns or for scientific research Polygon data from Puck Bay (Poland) was digitized based on Polish Marine Atlas and Orlowo cliff area was added based on expert knowledge From Estonian waters a predictive model was used (200m resolution) that was converted to pres-enceabsence using minimized difference threshold criteria All data (point polygon and the raster presenting predicted presence of eelgrass in the Estonian waters) were generalized to 5km x 5km grid cells
Variables and thresholds Distribution of Photic zone Photic hard bottom Charophytes Fucus spp Furcellaria lumbricalis Zostera marinaThe resulting data layer was corrected by removing recruitment areas in eastern Gulf of Finland (Neva inlet) Curonian lagoon Szczechin lagoon and enhancing that of the Vistula lagoon
References HELCOM (2018c 2018d) Kanstinger et al (2018) Popiel (1984) Strzyżewska (1969) Fey (2001) Fey et al (2014a 2014b) Krasovskaya (2002)
Data quality The data layer is mainly developed based on main habitat associations as identified from scientific literature not actual data on herring spawning
The delineations are based on other data layers (benthic and habitat-related ecosystem components) for which mapping is not exhaustive and sampling density may vary between countries Underlying data layers on vege-tation (Fucus Furcellaria charophytes Zostera) are based on inventory data and species distribution models Information on the distribution of Furcellaria is lacking from Russia
Herring preferably spawns in shallow areas However the layer does not include depth as a variable as some known spawning areas offshore would not be included if the depth restriction is used Due to constraints in the resolution of the underlying data layer the map also identifies areas shallower than one meter as potential spawning areas of Baltic herring However spawning of Baltic herring does not usually occur in such shallow depth
The map represents potential spawning areas In addition behavioral components and hydrographic factors in-fluence on the actual chose of spawning site at a certain occasion Due to these constraints the data layer on Baltic herring spawning habitats should be considered as a rough estimation
Attribute information Raster value representing no spawning (0) potential spawning area (05) and high proba-bility spawning area (1)
Table 4 Data table for potential herring spawning areas
21
3 Results Essential fish habitats in the Baltic Sea Identification of potential spawning recruitment and nursery areas
Figure 10 Potential spawning areas for European flounder
34 Potential spawning areas for European flounder
European flounder (Platichthys flesus) is a key species in many coastal areas of the Baltic Sea mainly in the central and southern sub-basins Adults feed in shallow coastal areas during summer and move out to deeper areas in win-ter where the spawning takes place in spring European flounder spawns above the sea floor in deep water in areas with sufficiently high sa-linity for fertilization and pelagic egg develop-ment lsquoPotential spawning areasrsquo were initially delineated by a species distribution model (Orio et al 2017) developed based on years 1993-1997 to consider a period with relative-ly better oxygen conditions but applied with more recent data (2011-2014) The area was further delineated to encompass only areas deeper than 30 m in order to represent pelagic spawning habitat lsquoHigh probability spawning areasrsquo were identified as the sub-section en-compassing salinity gt 10 It should be noted that flounders in the Baltic Sea were recently separated into two species and that spawning areas of the Baltic flounder (Platichthys solem-dali) are described separately The two data layers do not overlap and can be combined to obtain a map on spawning areas for both floun-der species taken together (Table 5 Figure 10)
22
3 Results Essential fish habitats in the Baltic Sea Identification of potential spawning recruitment and nursery areas
Species European flounder (Platichthys flesus)
Stocks ICES identifies two stocks of European flounder in the Baltic Sea ICES subdivisions 22-23 (Belt Sea and the Sound) and 24-25 (West of Bornholm and Southern Central Baltic Sea)
EFH type Spawning areas
Approach Species distribution modelling combined with identification of environmental salinity window and depth conditions for spawning
Time period 2011-2014
Data source Model results from Orio et al 2017a
Depth Baltic Sea Bathymetry database (httpdatabshcpro2518201 ) complemented in some coastal areas with IOW bathymetry data (Seifert et al 2001)
Salinity Copernicus Marine Environment Monitoring Service SMHI The data represents monthly data for years 2011-2014 downloaded from Copernicus Marine Environment Monitoring Service (httpmarinecopernicuseu) Reanalysis prod-ucts of SMHI for years 1989-2004 55km grid cells The layers represent conditions at the sea floor Extrapolation to some coastal areas that were outside the original data due to low resolution of the grid
Variables and thresholds Depth gt 30 m Salinity gt 10
References Orio et al (2017a) Momigliano et al (2018) Nissling et al (2002)
Data quality The data layer is based on species distribution modelling focusing on mature flounder at the spawning stage and should be considered a rough estimation
The data layers on environmental variables are based on modelling Other variables than those tested in the model may also be influential
The studies from which the thresholds values for environmental variables have been obtained are based on pub-lications conducted before the separation of Baltic flounder from European flounder but have taken the specific characteristics of the separate spawning ecotypes into account
Note the map on European flounder spawning areas is currently missing information for the western Baltic Sea including the Kattegat
Attribute information Raster value representing no spawning (0) potential spawning area (05) and high proba-bility spawning area (1)
Table 5 Data table for potential European flounder spawning areas
23
3 Results Essential fish habitats in the Baltic Sea Identification of potential spawning recruitment and nursery areas
Species Baltic flounder (Platichthys solemdali)
Stocks ICES identifies two stocks of Baltic flounder ICES subdivisions 26 28 (East of Gotland and Gulf of Gdansk) and 27 29-32 (Northern Central Baltic Sea and Northern Baltic Sea)
EFH type Spawning areas
Approach Species distribution modelling combined with identification of environmental salinity window and depth condi-tions for spawning supplemented with additional information from monitoring in Estonian waters
Time period 2011-2014
Data source Model results from Orio et al (2017a)
Depth Baltic Sea Bathymetry database (httpdatabshcpro2518201 ) complemented in some coastal ar-eas with IOW bathymetry data (Seifert et al 2001)
Salinity Copernicus Marine Environment Monitoring Service SMHI The data represents monthly means of May for years 2011-2014 (httpmarinecopernicuseu) Reanalysis products of SMHI for years 1989-2004 55km grid cells The layers represent conditions at the sea floor Extrapolation to some coastal areas that were outside the original data due to low resolution of the grid
Variables and thresholds Depth lt 30 m Salinity gt 6
References Orio et al (2017) Momigliano et al (2018) Nissling et al (2002)
Data quality The data layer is based on species distribution modelling focusing on mature flounder at the spawning stage and should be considered a rough estimation
The data layers on environmental variables are based on modelling Other variables than those tested in the model may also be influential
The studies from which the thresholds values for environmental variables have been obtained are based on pub-lications conducted before the separation of Baltic flounder from European flounder but have taken the specific characteristics of the separate spawning ecotypes into account
Attribute information Raster value representing no spawning (0) potential spawning area (05) and high proba-bility spawning area (1)
Table 6 Data table for potential Baltic flounder spawning areas
Figure 11 Potential spawning areas for Baltic flounder
35 Potential spawning areas for Baltic flounder
Baltic flounder (Platichthys solemdali) is a key species in many coastal areas of the Baltic Sea It is the only endemic fish spe-cies of the Baltic Sea Baltic flounder spawns in shallow coastal areas and on offshore banks with eggs developing on the sea floor Successful spawning may be expected at salinities down to around 5-7 (Nissling et al 2002) lsquoPotential spawning areasrsquo were initially delineated by a species distribution model (Orio et al 2017) developed based on years 1993-1997 to consider a period with relatively better oxygen conditions but applied with more recent data (2011-2014) The area was further delin-eated to encompass only areas shallower than 30 m in order to represent the demersal spawning habitat lsquoHigh probability spawning areasrsquo were identified as the sub-section encompass-ing salinity gt 6 It should be noted that flounders in the Baltic Sea were recently separated into two species and that spawn-ing areas of the European flounder (Platichthys flesus) are de-scribed separately The two data layers do not overlap and can be combined to obtain a map on spawning areas for both floun-der species taken together (Table 6 Figure 11)
24
3 Results Essential fish habitats in the Baltic Sea Identification of potential spawning recruitment and nursery areas
Figure 12 Potential nursery areas for European and Baltic flounder
36 Potential nursery areas for flounders
The two flounder species in the Baltic Sea (Pla-tichthys flesus and P solemdali) have different reproductive strategies spawning in the pelag-ic and in shallow waters respectively However they utilize the same type nursery habitat For both species young of the year are found on shallow bottoms from June to September pri-marily on sandy substrates Flounder nursery areas were predicted by a generalized additive model with flounder abundance as response variable and seven map-based predictor vari-ables The model was based on data from avail-able surveys of juvenile flounder in the Baltic Sea compiled within the Pan Baltic Scope proj-ect To represent the nursery season and the current situation only results from surveys per-formed in June-September during 2004-2018 were used resulting in totally 2114 samples All abundance estimates were harmonized to numbers of juvenile flounder per square meter Values for the predictor variables were extract-ed for each sampling point in GIS The follow-ing environmental variables were used salin-ity wave exposure water depth slope of the bottom surface temperature bottom currents and distance to high probability spawning area for European flounder (Table 7 Figure 12)
25
3 Results Essential fish habitats in the Baltic Sea Identification of potential spawning recruitment and nursery areas
Species Baltic flounder (Platichthys solemdali) and European flounder (Platichthys flesus)
Stock Baltic flounder ICES subdivisions 26 28 (East of Gotland and Gulf of Gdansk) and 27 29-32 (Northern Central Baltic Sea and Northern Baltic Sea) European flounder ICES subdivisions 22-23 (Belt Sea and the Sound) and 24-25 (West of Bornholm and Southern Central Baltic Sea)
EFH type Nursery areas
Approach Species distribution modelling
Time period 2004-2018
Data source Model results as described in Chapter 2 of this report
Salinity Monthly means in March-May from 2014-2016 for salinity at the seafloor within a 600 m radius from the sam-pling point Extracted from the hydrodynamic Baltic Sea Ice-Ocean Model (BSIOM Lehmann et al 2002)
Wave exposure Log transformed wave impact index calculated for the whole Baltic Sea (Isaeligus 2004)
Depth Mean water depth within a 600 m radius from sampling point according to the Baltic Sea Bathymetry database (httpdatabshcpro2518201)
Slope Mean slope within a 600 m radius from sampling point based on data produced within the EU Interreg IIIB project BALANCE (HELCOM 2018)
Surface temperature Monthly means of June-September for years 2016-2018 downloaded from Copernicus Marine En-vironment Monitoring Service (httpmarinecopernicuseu ) The data is from the HBM model produced by the Danish Meteorological Institute (DMI httpoceandmidkmodelshbmukphp)
Bottom currents Mean bottom current velocity within a 600 m radius from sampling point based on data produced within the EU Interreg IIIB project BALANCE (HELCOM 2018)
Distance to high probability spawning area for European flounder as shown in section 34 of this report
Variables and thresh-olds
High probability nursery areas represent areas with a predicted abundance gt 003 juvenile floundermsup2 based on the applied data sets and model Potential nursery areas represent predicted abundance levels between 00001 and 003 juvenile floundermsup2 Areas with a predicted abundance lt 00001 juvenile floundersmsup2 are defined as not being flounder nursery areas
Reference This report chapter 2
Data quality Data on juvenile flounder abundances to support the spatial model is missing from Denmark Germany Poland and Rus-sia Predictions are uncertain in these areas and especially along the south coast of the Baltic Sea
The mix of data from different years months and gear types may have contributed to increasing the variability in the dataset even though a relatively high deviance explained by the model (41) shows that it has predictive power
The spatial resolution of the predictor variables varies between 200 m and 2 km which gives coarse predictions locally even though values are representative at an overall regional scale
The prediction is limited by a lack of accurate spatial information on surface sediments Sandy substrates are well known as important flounder nursery habitats Unfortunately the only available sediment map on a Baltic Sea wide scale was too inaccurate for shallow waters where juvenile flounder occurs and was therefore excluded from the model
The map on flounder nursery areas does not make assumptions on species identity in any area
Attribute information Raster value representing no nursery area (0) potential nursery area (05) and high probability nursery area (1)
Table 7 Data table for potential flounder nursery areas
26
3 Results Essential fish habitats in the Baltic Sea Identification of potential spawning recruitment and nursery areas
Figure 13 Potential recruitment areas for perch
37 Potential recruitment areas for perch
Perch (Perca fluviatilis) is a key species in many Baltic coastal areas It is of freshwater origin and spawns predominantly in freshwater tributaries close to the coastline or in enclosed bays Spe-cies distribution modelling have shown the im-portance of suitable environmental conditions for perch reproduction Young perch has limited dispersal from its spawning area and tagging studies have shown that most (50-95 of the re-captures of perch are made up to 20 km from tag-ging site in the Baltic Sea (Johnsson 1978 Boumlhling and Lehtonen 1985 Veneranta et al 2020 Saks et al 2020) Due to lack of coherent data on perch spawning and nursery areas across the Baltic Sea countries environmental variables were used in delineating potential recruitment areas for perch The map was originally developed within the HOLAS II project (HELCOM 2018b) when it was approved by all HELCOM Contracting Parties in a dedicated review process Potential perch recruit-ment areas were delineated as areas with suitable condition of depth wave exposure and salinity Thresholds were obtained from literature and se-lected to rather overestimate than underestimate the recruitment area For the Finnish coastline a national model was used The map was subse-quently considered by the Pan Baltic Scope proj-ect who proposed adjustments to thresholds for some areas in Russian waters and corrections to Estonian and German waters (Table 8 Figure 13)
27
3 Results Essential fish habitats in the Baltic Sea Identification of potential spawning recruitment and nursery areas
Species Perch (Perca fluviatilis)
Stock Several undefined
EFH type Recruitment areas
Approach Environmental window national modelling approach in Finnish waters supplemented with corrections to Estonian Ger-man and Russian waters based on national validation with monitoring data
Time period 2011-2014
Data sources Depth Baltic Sea Bathymetry database (httpdatabshcpro2518201) complemented in some coastal areas with IOW bathymetry data (Seifert et al 2001)
Wave exposure Wave Impact Index calculated for the whole Baltic Sea (Isaeligus 2004)
Salinity Monthly means of May for years 2011-2014 downloaded from Copernicus Marine Environment Monitoring Service (httpmarinecopernicuseu ) Reanalysis products of SMHI for years 1989-2004 55km grid cells A May mean for 2011-2014 was calculated Extrapolation to some coastal areas that were outside the original data due to low resolution of the grid
National model for Finnish waters generalized to 1x1 km grid (Kallasvuo et al 2017)
Variables and thresh-olds
Depth lt 4 m (for Danish waters lt 3 m)
Logged exposure lt 5 (For Koporo Bay and Narva Bay in Russian waters lt 523)
Salinity lt 10
Based on the model for the Finnish coastline perch recruitment areas were defined as Unsuitable for reproduction P(-catch larvae) lt 05 Suitable for reproduction P(catch larvae) gt 05 Important for reproduction the smallest area where the expected cumulative larval abundance is 80 of the total expected abundance over study area
References Snickars et al (2010) Bergstroumlm et al (2013) Skovrind et al (2013) Sundblad et al (2014) Kallasvuo et al (2017) HEL-COM (2018a) this report
Comments and data quality
Recruitment area here refers to essential habitats for young of the year perch (based on inventory data from spawning until the end of the first summer) The map is based on literature and environmental variables derived from inventory data The species distribution modelling studies where the thresholds values for environmental variables have been obtained are from the northern Baltic Sea Here the same thresholds have been applied in the southern Baltic Also the data layers on environmental variables are based on modelling Due to these constraints the data layer should be considered as a rough estimation
Attribute information Raster value representing the potential occurrence of perch recruitment area (either 0 or 1)
Table 8 Data table for potential perch recruitment areas
28
3 Results Essential fish habitats in the Baltic Sea Identification of potential spawning recruitment and nursery areas
38 Potential recruitment areas for pikeperch
Pikeperch (Sander lucioperca) is a species of fresh-water origin which spawns predominantly in freshwater tributaries and has a relatively limited dispersal away from its recruitment area Species distribution modelling studies have shown the importance of suitable environmental conditions for pikeperch recruitment Due to lack of coherent data on pikeperch spawning and nursery areas across the Baltic Sea countries the distribution of pikeperch recruitment areas was delineated based on areas with suitable conditions of depth wave exposure salinity water transparency (Sec-chi depth) and distance to deeper (10 m) waters The threshold values were obtained from litera-ture Temperature although important for pike-perch was left out due to high variation in timing of suitable spawning temperatures across the Baltic Sea The map on pikeperch recruitment areas was originally developed within the HOLAS II project (HELCOM 2018b) when it was approved by all HELCOM Contracting Parties in a dedicated review process after correction to Swedish wa-ters The map was subsequently considered by the Pan Baltic Scope project who proposed ad-justments to Estonian German Lithuanian and Polish waters (Table 9 Figure 14) Figure 14 Potential recruitment areas of pikeperch
29
3 Results Essential fish habitats in the Baltic Sea Identification of potential spawning recruitment and nursery areas
Species Pikeperch (Sander lucioperca)
Stock Several undefined
EFH type Recruitment areas
Approach Environmental window with national approach for Finnish waters selected data points corrected for Estonian German Lithua-nian Polish and Swedish waters
Time period 2011-2014
Data source Depth Baltic Sea Bathymetry database (httpdatabshcpro2518201) complemented in some coastal areas with IOW ba-thymetry data (Seifert et al 2001)
Wave exposure Wave Impact Index calculated for the whole Baltic Sea (Isaeligus 2004)
Salinity Monthly means of May for years 2011-2014 downloaded from Copernicus Marine Environment Monitoring Service (httpmarinecopernicuseu ) Reanalysis products of SMHI for years 1989-2004 55km grid cells A May mean for 2011-2014 was calculated Extrapolation to some coastal areas that were outside the original data due to low resolution of the grid
Secchi depth Satellite based (MERIS) composite layer of May 2011 kindly provided by Krista Alikas at Tartu Observatory Estonia (Alikas and Kratzer 2017)
National model for Finnish waters generalized to 1x1 km grid (Kallasvuo et al 2017)
Variables and thresh-olds
Depth lt 5 m
Logged exposure lt 5
Salinity lt 7
Secchi depth lt 2
Distance to deep (10m) water lt 4km
Based on the model for the Finnish coastline pikeperch recruitment areas were defined as Unsuitable for reproduction P(catch larvae) lt 05 Suitable for reproduction P(catch larvae) gt 05 Important for reproduction the smallest area where the expected cumulative larval abundance is 80 of the total expected abundance over study area
References Veneranta et al (2011) Bergstroumlm et al (2013) Sundblad et al (2014) Kallasvuo et al (2017) Gunnartz et al (2011) (HEL-COM 2018b) this report
Comments and data quality
Recruitment area here refers to essential habitats for young of the year pikeperch (based on inventory data from spawning until the end of the first summer) The map is based on literature and environmental variables derived from inventory data The species distribution modelling studies where the thresholds values for environmental variables have been obtained are from the northern Baltic Sea Also the data layers on environmental variables are based on modelling Here same thresholds have been applied in the southern Baltic Due to these constraints the data layer should be considered as a rough estimation
In addition temperature is important for pikeperch recruitment but was not included as a delineating variable due to high variation in timing
The data layer may underestimate pikeperch in Finnish waters with respect to habitats for young of the year pikeperch as it focused on newly-hatched larvae when the dispersal is more limited compared to later in the season
Attribute information Raster value representing the potential occurrence of pikeperch reproduction area (either 0 or 1)
Table 9 Data table for potential pikeperch recruitment areas
30
3 Results Essential fish habitats in the Baltic Sea Identification of potential spawning recruitment and nursery areas
Figure 15 Aggregate essential fish habitat map with data layers for the seven different species (Figures 7-14) stacked on top of each other The data layer on flounder nursery areas is only included where it does not overlap with any of the layers on flounder spawning areas in order to not double-count results for the same species However it should be noted that the aggregated map is not representative for essential fish habitats in the whole Baltic Sea area as information on some additionally important species and life stages are still missing Most importantly information on spawning areas of European flounder is lacking West of the Arkona Basin Also information on sole which would be relevant for this areas is missing Kattegat holds essential fish habitats for several species that are not included here Uncertainties in relation to each of the included data layers are presented in tables 2-9
39 Aggregated map
Figure 15 shows an aggregated map in which all data layers presented in figures 7-14 are added to each other with equal weight to each layer The data layer on flounder nursery areas (Fig-ure 12) is only included where it does not over-lap with spawning areas for European flounder or Baltic flounder (Figures 10-11) in order to not double-count habitats for the same species
The aggregated map has a maximum val-ue of four which occurs in some coastal areas where spawningrecruitment areas for herring Baltic flounder perch and pikeperch overlap In addition the importance of deep areas of the southern Baltic Sea for spawning of cod sprat and European flounder is clearly seen
As the aggregate map (Figure 15) is limited to the available data layers it is not completely representative of the region The most evident gaps occur West of the Arkona Basin for exam-ple information on spawning areas of European flounder is missing from these areas Impor-tantly several other species are also relevant West of the Arkona Basin but are not included in this report for example sole (Solea solea) but also turbot (Scophthalmus maximus) and plaice (Pleuronectes platessa) This information should be added in order for the aggregated map to be relevant also for this area (See also Chapter 4 for a discussion on this)
In the coastal zone generally a delineation of nursery areas for cod is missing but would be important for a more complete picture The possibility to develop such as map was consid-ered by HELCOM (2018a) but was not consid-ered feasible at the Baltic Sea scale based on available data at the time
31
4 Discussion Essential fish habitats in the Baltic Sea Identification of potential spawning recruitment and nursery areas
4 Discussion
41 Potential uses of the maps - MSP environmental management and green infrastructure
Spatial information on distribution of species and habitats is import-ant to support various aspects of marine management It is needed for example in maritime spatial planning (MSP) where national plans have to ensure that ecosystem considerations the potential vulnera-bility of species and habitats to pressures from human activities are taken into account (eg EC 2014 Kraufvelin et al 2018) Maps on the distribution of species and habitats are also used in spatial assess-ment of cumulative impacts (HELCOM 2018d Bergstroumlm et al 2019) These maps are important for identifying areas that are subject to high levels of pressures and may need priority in conservation or en-vironmental management actions This report contributes to these needs by identifying areas of potential key importance for fish
The maps which are presented here have also been initially includ-ed in a suggested approach for mapping green infrastructure in the Baltic Sea developed within the Pan Baltic Scope project (Ruskule et al 2019) Green infrastructure is still an emerging concept especially in marine environments but is seen as a promising tool to support ecosystem-based management and spatial planning (See for exam-ple Liquete et al 2015) The purpose is to help identify areas which are essential for ensuring the resilience of the marine ecosystem and the delivery of a wide range of ecosystem services hence contributing to human well-being In MSP green infrastructure can identify structures of ecological importance from a landscape perspective which might not be included in networks of legally protected areas hence high-lighting additional aspects of importance
Ruskule et al (2019) suggested a matrix approach for identifying ecosystem components of key importance for ecosystem services and ecological value The approach also encompassed the maps on essential fish habitats presented here (see also Bergstroumlm et al 2019 Miloš and Bergstroumlm 2019) However further efforts are needed to complete the work especially in the area of developing spatial data of adequate quality (Ruskule et al 2019) Also the work developed so far is focused on essential habitats but does not consider feeding areas migration corridors or aspects of connectivity among populations which are other important component of green infrastructure both on land and at sea (Liquete et al 2015)
Some further development needs specifically with respect to es-sential fish habitats are presented below
42 Suggestions for the further development of the essential fish habitats concept
This report presents maps on selected potential spawning recruit-ment and nursery areas for seven fish species in the Baltic Sea Hence the maps show information for a subset of all species that are actually present and are focused on selected life stages Our general inventory of data availability (Chapter 2) showed
that data to support the mapping of spawning recruitment and nursery areas for fish in the Baltic Sea has been greatly improved by recent national and joint Baltic projects but that sufficient data is still lacking for many parts of the Baltic Sea and selected species In particular coastal areas lack data The maps presented here represent the best available information at a coherent Baltic Sea regional scale at their time of devel-opment A recommended long-term aim would be to obtain regional maps on relevant essential fish habitats for all widely distributed fish species in the Baltic Sea considering at least spawning and nursery areas
To give a fuller representation of essential fish habitats one should especially include more information for species in coastal areas and in the western Baltic Sea One should also consider additional life stages for some of the included species since both spawning nursery feeding and migration areas are potential essential fish habitats The availability and quality of juvenile feeding areas may be particularly important as they directly influence juvenile growth and survival and thereby the level of recruitment to adult populations
Some information on juvenile (and adult) habitats is already available for the Baltic Sea regions but was not considered de-veloped enough to form the basis of maps at the regional scale However the possibilities to model important areas for juvenile cod should be considered as a next step In addition account-ing for the spatio-temporal dynamics of essential fish habitats would be of relevance as many fish are highly dependent on prevailing temperature oxygen and salinity regimes (see for ex-ample Hinrichsen et al 2017a) With respect to species additions it would be particularly important to include maps on sole and on other flatfishes with respect to the distribution of spawning areas of these west of the Arkona Basin Furthermore once hab-itats of different life-history stages for any given species have been adequately mapped the degree of connectivity between them is also of key importance (Brown et al 2019) Knowledge on migration between essential fish habitats will help to identify potential population sinks and sources increasing the relevant information available to planners and decision makers
A novelty in this report was possible due to the fact that flounder of the Baltic Sea was recently separated into two dis-tinct species with Baltic flounder being identified as endemic to the region Even though the presence of two distinct floun-der species was only recently documented (Momigliano et al 2017) the presence of types of flounder in the Baltic Sea has been long known to research (eg Solemdal 1967 Nissling et al 2002) Based on information from previous studies on eco-typic differences between the different types of flounder and based on recommendations from experts on flounder ecology in the region separate maps for potential spawning areas of European and Baltic flounders were developed (Figures 10-11) The main difference between the species is the genetics and the reproductive characteristics such as spawning behavior and
32
4 Discussion Essential fish habitats in the Baltic Sea Identification of potential spawning recruitment and nursery areas
morphological and functional differences in the eggs and sperm As the two species are morphologically similar their nursery areas could not be separated and the map of flounder nursery areas is representative of both flounder species taken together There is cur-rently no evidence that the nursery area characteristics would differ between the two species nor reason to expect this The main envi-ronmental variable contributing to the potential of an area for being a nursery for either Baltic or European flounder is the larval supply which is related to the level of connectivity between a potential nursery and the spawning area The effective connectivity again is affected by distance and transport mediating currents A suggestion how to combine information for the different flounder maps if this is wanted was presented in Section 39
43 Data quality aspects
The maps were developed based on indirect or modelling ap-proaches since direct inventory data was not available in a com-parable way across the region for any of the species Over time it would be important to enhance the base of knowledge and data that the maps are based on hence to improve their quality reliabil-ity and utility It should be appreciated that the maps are in most cases a rough representation that enables comparisons at the rela-tively coarse regional scale If the maps are applied at the national or local scale they would benefit from being complemented with more detailed information when available The quality aspects for each of the separate maps is presented in Chapter 3
We foresee that modelling approaches will continue to be important for producing large scale spatial information but em-phasize that inventory data from mapping efforts are still key both for building such models and for validating them To sup-port the development better mechanistic understanding on the required environmental conditions for certain life stages is also of high importance as well the availability and quality of spatial data on important environmental variables such as salinity and depth While important across the range of the Baltic many very coastal areas suffer from a lack of fish monitoring effort which is required to inform these distribution models and reduce their uncertainty Another common aspect is that for all maps that use hydrological model output these estimates are quite inaccurate close to the coast This becomes very important when consid-ering a very coastal habitat such as for example juvenile flatfish and herring spawning
For particular species the lack of direct inventory data on herring spawning was a restriction to providing more detailed maps on her-ring spawning areas It would also be important to resolve present uncertainties in the distribution of spawning areas of sprat towards the northern Baltic Sea With respect to environmental variables the mapping is additionally challenged by the fact that spawning of many species is strongly influenced by temperature which varies between years and is tightly coupled to climate change
44 Implications for application
The presented maps are referred to as ldquopotential habitatsrdquo as they are generally based on indirect information rather than on actual observations to verify that the habitat is actually
functional and to what level As a general way to account for data restrictions in their spatial delineation Planque et al (2007) classified fish habitats into potential habitats realized habitats and effective habitats By their definitions ldquopotential habitatsrdquo include areas were water masses or substrates can uphold a particular function during a particular life stage or pe-riod of time (for example based on known environmental con-straints) as opposed to ldquorealized habitatsrdquo which have proven to actually inhabit the fish during that life stage (for example based on sampling showing that fish eggs are present) Last ldquoeffective habitatsrdquo are those areas which are seen to support the highest densities or have the highest relative contribution to the population
Comparing the different maps presented in this report the maps which are based on spatial distribution models are likely more accurate in the sense that they are closer to the concept of realized habitats compared to those which are developed based on environmental envelopes One way to further eval-uate the maps of ldquopotentialrdquo essential fish habitats would be to compare them systematically with corresponding informa-tion on ldquorealized habitatsrdquo where available Such an evaluation could help identify to what extent they represent functional habitats and to what extent they represent habitats that are suitable according to natural environmental conditions but may not be functional due to other factors such as impacts of human activity or poor connectivity It would also be important to generally move from maps based on environmental enve-lopes to maps based on statistical models
In some further applications of the maps for example if they are used to resolve spatial uses the concept of ldquoeffective habi-tatsrdquo may be more useful as it can more precisely identify areas of currently highest value for fish andor fisheries On the other hand the concept of ldquopotential usesrdquo may be more adequate to identify areas where measures to reduce pressure may be needed Focusing on only ldquoeffective habitatsrdquo could bring the risk that in a degraded environment only those few habitats left are addressed or protected while improving an already poor situation would require the reestablishment also of other potential habitats to eventually become effective ones
45 How to consider future changes
Fish populations are often highly dynamic Most evidently their spawning success and individual growth are often tightly coupled to variability in climate-related factors such as tem-perature and salinity and these factors may also influence on the suitability of potential essential fish habitats over different seasons and years (see for example Hinrichsen et al 2017a) In addition human pressures such as overfishing physical modi-fication of habitats and elevated oxygen consumption related to eutrophication lead to changes over time in both the quality of fish habitats and the size of populations that can make use of these A key area for future development is to develop a stron-ger understanding on how the current distribution of function-al essential fish habitat is affected by human activities and how to improve management in these situations These needs are even more emphasized by climate change which is expected to have dramatic influence on the distribution of fish and fish habitats in the future
33
4 Discussion Essential fish habitats in the Baltic Sea Identification of potential spawning recruitment and nursery areas
5 Acknowledgements
The work was carried out as part of the EU co-funded Pan Baltic Scope project (2018-2019) which overall aim was to support a co-herent maritime spatial planning among countries in the Baltic Sea region furthering the implementation of an ecosystem-based ap-proach The resulting maps were produced as a joint activity of the Pan Baltic Scope project and HELCOM to incorporate currently avail-able knowledge in the Baltic Sea region at the time of the project
34
5 References Essential fish habitats in the Baltic Sea Identification of potential spawning recruitment and nursery areas
6 References
Al-Hamdani Z and J Reker (2007) Towards marine landscapes in the Baltic Sea BALANCE Interim Report No 10 httpbalance-euorg
Alikas K and Kratzer S (2017) Improved retrieval of Secchi depth for optically-complex waters using remote sensing data Ecological Indi-cators 77 218-227
Aneer G (1989) Herring (Clupea harengus L) spawning and spawning ground characteristics in the Baltic Sea Fisheries Research 8169-195
Aneer G and S Nellbring (1982) A SCUBA-diving investigation of Bal-tic herring (Clupea harengus membras L) spawning grounds in the Askouml-Landsort area northern Baltic proper Journal of Fish Biology 21433-442
Aneer G G Florell U Kautsky S Nellbring and L Sjoumlstedt (1983) In situ observations of Baltic herring (Clupea harengus membras L) spawn-ing behaviour in the Askouml-Landsort area Northern Baltic proper Ma-rine Biology 74105-110
Bagge O F Thurow E Steffensen and J Bay (1994) The Baltic cod Dana 101-28
Baltic Scope (2017) Recommendations on maritime spatial plan-ning across borders httpwwwbalticscopeeucontentup-loads201507BalticScope_OverallRecomendations_EN_WWWpdf
Baumann H H Hinrichsen C Mollmann F Koster A Malzahn and A Temming (2006) Recruitment variability in Baltic Sea sprat (Sprattus sprattus) in tightly coupled to temperature and transport patterns af-fecting the larval and early juvenile stages Canadian Journal of Fish-eries and Aquatic Science 632191-2201
Bartolino V M Cardinale H Svedaumlng HW Linderholm M Casini and A Grimwall (2012) Historical spatiotemporal dynamics of eastern North Sea cod Canadian Journal of Fisheries and Aquatic Sciences 69833-841
Beck MW KL Heck KW Able DL Childers DB Eggleston BM Gilland-ers B Halpern CG Hays K Hoshino TJ Minello RJ Orth PF Sheridan and MP Weinstein (2001) The identification conservation and man-agement of estuarine and marine nurseries for fish and invertebrates BioScience 51633-641
Bergstroumlm L S Korpinen U Bergstroumlm and Aring Andersson (2007) Es-sential fish habitats and fish migration patterns in the North-ern Baltic Sea BALANCE Interim Report No 29 httpbalance-euorg
Bergstroumlm L M Karlsson U Bergstroumlm L Pihl and P Kraufvelin (2019) Relative impacts of fishing and eutrophication on coastal fish as-sessed by comparing a no-take area with an environmental gradient Ambio 48 565-579
Bergstroumlm L A Miloš J Haapaniemi CR Saha P Arndt J Schmidt-bauer-Crona J Kotta J Kaitaranta S Husa J Palsson M Pohja-Mykrauml A Ruskule M Matczak S Strake A Zych A Nummela M Wesolowska and G Carneiro (2019) Cumulative Impact Assessment for Maritime Spatial Planning in the Baltic Sea Region Pan Baltic Scope wwwpanbalticscopeeu
Bergstroumlm U G Sundblad A-L Downie M Snickars C Bostroumlm and M Lindegarth (2013) Evaluating eutrophication management scenarios in the Baltic Sea using species distribution modelling Journal of Ap-plied Ecology 50680-690
Bleil M and R Oeberst (2005) The potential fecundity of cod in the Baltic Sea from 1993 to 1999 Journal of Applied Ichthyology 2119ndash27
Bleil M R Oeberst and P Urrutia (2009) Seasonal maturity develop-ment of Baltic cod in different spawning areas importance of the Arkona Sea for the summer spawning stock Journal of Applied Ich-thyology 2510ndash17
Boumlhling P and H Lehtonen (1985) Effect of environmental factors on migrations of perch (Perca fluviatilis) tagged in the coastal waters of Finland Finnish Fisheries Research 5 31-40
Bonsdorff E and A Norkko (1994) Flounder (Platichthys flesus) spawning in Finnish coastal waters Memoranda Societas pro Fauna et Flora Fennica 7030-31
Boumlrjesson P P Jonsson S Pacariz G Bjoumlrk MI Taylor and H Svedaumlng (2013) Spawning of Kattegat cod (Gadus morhua) Mapping spatial distribution by egg surveys Fisheries Research 14763-71
Brown EJ P Reis-Santos BM Gillanders and JG Stoslashttrup (2019) Juvenile fish habitat across the inner Danish waters Using otolith chemistry to discriminate between hybridising con-familials and contiguous coastal habitat Estuarine Coastal and Shelf Science 220 111ndash119
Carl JD CR Sparrevohn H Nicolajsen and JG Stoslashttrup (2008) Sub-stratum selection by juvenile flounder Platichthys flesus (L) effect of ephemeral filamentous macroalgae Journal of Fish Biology 722570-2578
Dahlgren T and J Havenhand (2017) An assessment of the theoret-ical basis and practical options for incorporating the effects of pro-jected climate change in marine spatial planning of Swedish waters Swedish Agency of marine and Water Management report 201726
Dahlgren CP Kellison GT Adams AJ Gillanders BM Kendall MS Lay-man CA Ley JA Nagelkerken I Serafy JE (2006) Marine nurseries and effective juvenile habitats concepts and applications Marine Ecolo-gy Progress Series 312291-295
35
5 References Essential fish habitats in the Baltic Sea Identification of potential spawning recruitment and nursery areas
EC (2014) Directive 201489EU of the European Parliament and of the Council of 23 July 2014 establishing a framework for mari-time spatial planning OJ L 257
Ekebom J J Jaumlaumlnheimo and J Reker (2008) Towards Marine Spatial Planning in the Baltic Sea BALANCE Technical Summary Report 4 1-132 httpbalance-euorg
Fey DP (2001) Differences in temperature conditions and somat-ic growth rate of larval and early juvenile spring spawned herring from the Vistula Lagoon Baltic Sea manifested in the otolith size to fish size relationship Journal of Fish Biology 58 1257-1273
Fey DP AM Lejk P Margonski L Szymanek I Psuty T Nermer F Lempe HV Strehlow P Polte D Moll N Stybel A Hiller and M van Laak (2014a) Herring An analysis of spawning ground manage-ment ecological conditions and human impacts in Greifswald Bay Vistula Lagoon and Hanouml Bight NMFRI Gdynia
Fey D A Szkudlarek-Pawełczyk and A Woźniczka (2014b) Abun-dance and distribution of larval herring Clupea harengus (Acti-nopterygii Clupeiformes Clupeidae) in the Pomeranian Bay Baltic Sea as an indicator of spawning sites Acta Ichthyologica et Piscatoria 44 309-317
Fonds M R Cronie AD Vethaak and P Van Der Puyl (1992) Me-tabolism food consumption and growth of plaice (Pleuronect-es platessa) and flounder (Platichthys flesus) in relation to fish size and temperature Netherlands Journal of Sea Research 29 127ndash143
Gaigalas K (2001) Lithuanian fishery in the region of the Nemu-nas lower reaches (In Lithuanian) Klaipėda Libra
Gaigalas K (2011) Fish and fishery in Curonian Lagoon basin (In Lithuanian) Klaipėda Eglė
Grauman GB (1980) Long term changes in the abundance data of eggs and larvae of sprat in the Baltic Sea Fisheries research in the Baltic Sea Riga 15138-150 (in Russian)
Gunnartz U M Lif P Lindberg L Ljunggren A Sandstroumlm and G Sundblad (2011) Kartlaumlggning av lekomraringden foumlr kommer-siella fiskarter laumlngs den svenska ostkusten - en intervjustud-ie (In Swedish with summary in English) Finfo 201131-42 httpswwwhavochvattensedownload1864f5b3211343cffddb28000180151348912838028finfo2011_3pdf
HELCOM (2018a) Outcome of the regional expert workshop on essential fish habitats organized by Pan Baltic Scope project and HELCOM (HELCOM Pan Baltic Scope EFH WS 1-2018)
HELCOM (2018b) State of the Baltic Sea - Second HELCOM holistic assessment 2011-2016 Baltic Sea Environment Proceedings 155
HELCOM (2018c) HELCOM Map and Data service Layers mean slope and bottom currents httpmapshelcomfiwebsitemapservice Accessed March 2019
HELCOM (2018d) HELCOM Map and Data service Layers Seabed sediment polygon (BALANCE) Fucus distribution Furcellaria
lumbricalis distribution httpmapshelcomfiwebsitemap-service Accessed 29 October 2018
HELCOM (2018e) HELCOM Thematic assessment of cumulative impacts on the Baltic Sea 2011-2016 Baltic Sea Environment Pro-ceedings 159
HELCOM (2019a) Outcome of the 1st Meeting of the continuation of the project for Balticwide assessment of coastal fish communi-ties in support of an ecosystembased management (FISH-PRO III)
HELCOM (2019b) Outcome of HELCOM-VASAB MSP WG 18-2019
HELCOM (2019c) Outcome of the tenth Meeting of the Working Group on the State of the Environment and Nature Conservation (STATE amp CONSERVATION 10-2019)
HELCOM (2019d) Outcome of the eleventh Meeting of the Work-ing Group on the State of the Environment and Nature Conserva-tion (STATE amp CONSERVATION 11-2019)
Hagstrom O and H Wickstroumlm (1990) Immigration of young eels to the Skagerrak-Kattegat area 1900 to 1989 Internationale Revue der gesamten Hydrobiologie und Hydrographie 75707-716
Hinrichsen HH A Lehmann C Petereit A Nissling D Ustups U Bergstroumlm and K Huumlssy (2016) Spawning areas of eastern Baltic cod revisited Using hydrodynamic modelling to reveal spawning habitat suitability egg survival probability and connectivity pat-terns Progress in Oceanography 14313-25
Hinrichsen HH B von Dewitz A Lehmann U Bergstroumlm and K Huumlssy (2017a) Spatio-temporal dynamics of cod nursery areas in the Baltic Sea Progress in Oceanography 15528-40
Hinrichsen HH C Petereit A Nissling I Wallin D Ustups and A-B Florin (2017b) Survival and dispersal variability of pelagic eggs and yolk-sac larvae of central and eastern Baltic flounder (Pla-tichthys flesus) application of biophysical models ICES Journal of Marine Science 7441-55
Huumlssy K (2011) Review of western Baltic cod (Gadus morhua) recruitment dynamics ICES Journal of Marine Science 681459-1471
Huumlssy K HH Hinrichsen and B Huwer (2012) Hydrographic in-fluence on the spawning habitat suitability of western Baltic cod (Gadus morhua) ICES Journal of Marine Science doi101093ic-esjmsfss136
ICES (2019a) ICES Fisheries overviews Baltic Sea Ecoregion Pub-lished 2 September 2019 Version 2 29 November 2019 httpsdoiorg1017895icesadvice5566
ICES (2019b) ICES Fisheries Overviews Great North Sea Ecoregion Published 29 November 2019 Version 2 15 January 2020 httpsdoiorg1017895icesadvice5710
Isaeligus M (2004) Factors structuring Fucus communities at open and complex coastlines in the Baltic Sea PhD thesis Stockholm University
36
5 References Essential fish habitats in the Baltic Sea Identification of potential spawning recruitment and nursery areas
Jankevičius K I Gasiūnas A Gediminas V Gudelis A Kublickas and I Maniukas (Eds) (1959) Curonian Lagoon (In Russian) Vilni-us Pergalė 552 pp
Johnsson T (1978) Dispersal area of perch Perca fluviatilis tagged in a stream flowing into the Bothnian Sea Aquilo Series Zoologica 18 62-64
Joumlnsson N J Scabell and B Gentzen (1984) Praxisorientierte Verhaltensuntersuchungen am Rtigenschen Frtihjahrshering Wiss Z WPU Rostock Naturwiss Reihe 3368-75
Joslashrgensen HB MM Hansen D Bekkevold DE Ruzzante and V Loeschcke (2005) Marine landscapes and population genetic structure of herring (Clupea harengus L) in the Baltic Sea Molec-ular Ecology 143219-3234
Kallasvuo M J Vanhatalo and L Veneranta (2017) Modeling the spatial distribution of larval fish abundance provides essential information for management Canadian Journal of Fisheries and Aquatic Sciences 74636-649
Kanstinger P J Beher G Grenzdoumlrffer C Hammer KB Huebert D Stepputtis and M Peck (2018) What is left Macrophyte mead-ows and Atlantic herring (Clupea harengus) spawning sites in the Greifswalder Bodden Baltic Sea Estuar Coast Shelf Sci 20172-81)
Krasovskaya N (2002) Spawning of Baltic herring in the Vistula Lagoon Effects of environmental conditions and stock parame-ters Bulletin of Sea Fish Inst No 1 (155) Gdynia 3-25
Kaumlaumlriauml J J Eklund S Hallikainen R Kaumlaumlriauml M Rajasilta K Ran-ta-Aho and M Soikkeli (1988) Effects of coastal eutrophication on the spawning grounds of the Baltic herring in the SW Archipelago of Finland Kieler Meeresforschungen Sonderheft 6348-356
Kaumlaumlriauml J M Rajasilta M Kurkilahti and M Soikkeli (1997) Spawn-ing bed selection by the Baltic herring (Clupea harengus mem-bras) in the Archipelago of SW Finland ICES Journal of Marine Science 54917-923
Klinkhardt M DR Lill and E Biester (1985) Untersuchungen zum Ablauf der Fruumlhjahrslaichsaisons 1982 und 1983 der Ruumlgen-heringe (Clupea harengus L) auf einem ausgewaumlhlten Laichplatz des Greifswalder Boddens Fisch Forsch Wiss Sehr 2341-48
Kornilovs G (1994) Baltijas reņģes nārsta vietu un embrionālās attīstības raksturojums Rīgas jūras līcī PhD Thesis (in Latvian) University of Latvia
Koumlster FW M Vinther BR MacKenzie M Eero and M Plikshs (2009) Environmental effects on recruitment and implications for bi-ological reference points of eastern Baltic cod (Gadus morhua) Journal of Northwest Atlantic Fishery Science 41205-220
Koumlster FW B Huwer HH Hinrichsen V Neumann A Makarchouk M Eero BV Dewitz K Huumlssy J Tomkiewicz P Margonski A Tem-ming J-P Hermann D Oesterwind J Dierking P Kotterba and M Plikshs (2017) Eastern Baltic cod recruitment revisited - dynam-ics and impacting factors ICES Journal of Marine Science 743-19
Kraufvelin P Z Pekcan-Hekim U Bergstroumlm A-B Florin A Le-hikoinen J Mattila and J Olsson (2016) Essential fish habitats (EFH) - Conclusions from a workshop on the importance map-ping monitoring threats and conservation of coastal EFH in the Baltic Sea TemaNord 2016539
Kraufvelin P Z Pekcan-Hekim U Bergstroumlm A-B Florin A Lehi-koinen J Mattila T Arula L Briekmane E J Brown Z Celmer J Dainys H Jokinen P Kaumlaumlriauml M Kallasvuo A Lappalainen L Lozys P Moumlller A Orio M Rohtla L Saks M Snickars J Stoslashttrup G Sundblad I Taal D Ustups A Verliin M Vetemaa H Winkler A Wozniczka and J Olsson (2018) Essential coastal habitats for fish in the Baltic Sea Estuarine Coastal and Shelf Science 20414- 30
Lehmann A W Krauszlig and HH Hinrichsen (2002) Effects of re-mote and local atmospheric forcing on circulation and upwelling in the Baltic Sea Tellus A 54299-316
Lehtonen H S Hansson and H Winkler (1996) Biology and ex-ploitation of pikeperch Stizostedion lucioperca (L) in the Baltic Sea area Annales Zoologici Fennici 33 525-535
Liquete C S Kleeschulte G Dige J Maes B Grizzetti B Olah and G Zulian (2015) Mapping green infrastructure based on ecosys-tem services and ecological networks A Pan-European case study Environmental Science amp Policy 54 268-280
Ložys L (2004) The growth of pikeperch (Sander lucioperca L) and perch (Perca fluviatilis L) under different water temperature and salinity conditions in the Curonian Lagoon and Lithuanian coastal waters of the Baltic Sea Hydrobiologia 514 105-113
MacKenzie BR HH Hinrichsen M Plikshs and K Wieland (2000) Quantifying environmental heterogeneity estimating the size for successful cod egg development in the Baltic Sea and its in-fluence on recruitment Marine Ecology Progress Series 193143-156
Magnuson-Stevens Fisheries Conservation and Management Act As amended through 12 Jan 2007 (2007) Second printing US Department of Commerce National Oceanic and Atmo-spheric Administration and National Marine Fisheries Service httpswwwfisheriesnoaagovwebdamdownload55860982
Miloš A and L Bergstroumlm (2019) Cumulative impact Assessment Toolbox with user manual 23102019 httpsgithubcomhel-comsecretariatCumulative-impact-Assessment-Toolbox
Modin J (2008) Progress report of the NAF project Towards an ecosystem-based management of herring in the Baltic Sea 1st workshop on habitat mapping of spawning and nursery areas of Baltic herring Oumlregrund Sweden 8-12 December 2008
Moll D (2018) Contribution of coastal nursery areas to the spring-spawning population of Atlantic herring (Clupea haren-gus) in the Western Baltic Sea Dissertation Universitaumlt Hamburg
Momigliano P H Jokinen A Fraimout A-B Florin A Norkko and J Merilauml (2017) Extraordinarily rapid speciation in a marine fish Proceedings of the National Academy of Sciences of the United States of America 1146074-6079
37
5 References Essential fish habitats in the Baltic Sea Identification of potential spawning recruitment and nursery areas
Momigliano P GP Denys H Jokinen and J Merilauml (2018) Platich-thys solemdali sp nov (Actinopterygii Pleuronectiformes) a new flounder species from the Baltic Sea Frontiers in Marine Science 5225
Mohrholz V M Naumann G Nausch S Kruumlger and U Graumlwe (2015) Fresh oxygen for the Baltic Sea - an exceptional saline inflow after a decade of stagnation Journal of Marine System 148152-166
Mumby P A Edwards J Ernesto Arias-Gonzaacutelez et al (2004) Man-groves enhance the biomass of coral reef fish communities in the Caribbean Nature 427 533ndash536
Mustamaumlki N U Bergstroumlm K Aringdjers A Sevastik and J Mattila (2014) Pikeperch (Sander lucioperca (L)) in decline High mortality of three populations in the northern Baltic Sea Ambio 43325-336
Naumlslund J T Didrikas and A Šaškov (2011) Predicted herring (Clu-pea harengus) spawning grounds on the Lithuanian coast Aqua-Biota Report 201101
Naush G R Feistel M Naumann and V Mohrholz (2014) Water Ex-change between the Baltic Sea and the North Sea and conditions in the Deep Basins HELCOM Baltic Sea Environment Fact Sheets Online [Published 3112014] httpwwwhelcomfibaltic-sea-trendsenvironment-fact-sheets
Nissling A and L Westin (1997) Salinity requirements for success-ful spawning of Baltic and Belt Sea cod and the potential for cod stock interactions in the Baltic Sea Marine Ecology Progress Series 152261-71
Nissling A L Westin and O Hjerne (2002) Reproductive success in relation to salinity for three flatfish species dab (Limanda liman-da) plaice (Pleuronectes platessa) and flounder (Pleuronectes flesus) in the brackish water Baltic Sea ICES Journal of Marine Science 5993-108
Nissling A A Thorsen and FF Da Silva (2015) Fecundity regulation in relation to habitat utilisation of two sympatric flounder (Pla-tichtys flesus) populations in the brackish water Baltic Sea Jour-nal of Sea Research 95188-195
Olsson J K Mo A-B FlorinT Aho and N Ryman (2011) Genetic pop-ulation structure of perch Perca fluviatilis along the Swedish coast of the Baltic Sea Journal of Fish Biology 79 122-137
Ojaveer E (1981) On embryonal mortality of spring spawning herring on spawning grounds in the northeastern Gulf of Riga Rapports et Procegraves-Verbaux des Reacuteunions du Conseil Permanent International pour lrsquoExploration de la Mer 178401
Ojaveer H S Neuenfeldt U Bergstroumlm T Blenckner M Casini M Eero R Eschbaum A-B Florin H-H Hinrichsen K Houmlflich K Hom-mik J Horbovy K Huumlssy S Kininmonth R Klais G Kornilovs M Kroll A Lehmann K Limburg A Luzenczyk C Moellmann D Moll S Niiranen A Nilsson A Nissling A Orio A PerssonM Podolska P Polte J Poumlnni K Radtke T Raid J Raitaniemi I Sics G Guntars and D Ustups (2018) Integrating spatial processes into ecosystem models for sustainable utilization of fish resources INSPIRE Final report httpswwwbonus-inspireorg
Orio A U Bergstroumlm M Casini M Erlandsson R Eschbaum K Huumlssy A Lehmann L Ložys D Ustups and A-B Florin (2017a) Char-acterizing and predicting the distribution of Baltic Sea flounder (Platichthys flesus) during the spawning season Journal of Sea Research 12646-55
Orio A A-B Florin U Bergstroumlm I Šics T Baranova and M Casini (2017b) Modelling indices of abundance and size- based indicators of cod and flounder stocks in the Baltic Sea using newly standard-ized trawl survey data ICES Journal of Marine Science 74322-1333
Oulasvirta P J Rissanen and R Parmanne (1985) Spawning of Bal-tic herring (Clupea harengus membras) in the western part of the Gulf of Finland Finnish Fisheries Research 541-54
Oulasvirta P (1987) Spawning of autumn-spawning Baltic herring (Clupea harengus L) in the Bothnian Sea Finnish Fisheries Re-search 731-37
Petereit C H-H Hinrichsen R Voss G Kraus M Freese and C Clem-mesen (2009) The influence of different salinity conditions on egg buoyancy and development and yolk sac larval survival and morphometric traits of Baltic Sea sprat (Sprattus sprattus balticus Schneider) Scientia Marina 73 59-72
Planque B E Bellier and P Lazure (2007) Modelling potential spawning habitat of sardine (Sardina pilchardus) and anchovy (Engraulis encrasicolus) in the Bay of Biscay Fisheries Oceanog-raphy 1616-30
Popiel J (1955) Z biologii śledzi bałtyckich [About the Baltic her-ring biology] Prace Mor Inst Ryb Gdynia nr 8 [in Polish]
Popiel J (1984) On the biology of the Baltic herring Reports of the Sea Fisheries Institute Gdynia 19 8-16
Plikshs M HH Hinrichsen D Elferts I Sics G Kornilovs and FW Koumlster (2015) Baltic cod reproduction in the Gotland Basin causes of annual variability Acta Ichthyologica et Piscatoria 45247-258
Raid T (1990) On herring reproduction in the Northeastern Baltic Sea Baltic Fish Committee CM 1990J5
Rajasilta M J Kaumlaumlriauml J Eklund and K Ranta-Aho (1986) Reproduc-tion of the Baltic herring (Clupea harengus membras L) in the sea area of Turku SW Finland Ophelia Supplement 4339-343
Rajasilta M J Eklund J Kaumlaumlriauml and K Ranta-Aho (1989) The depo-sition and mortality of the eggs of the Baltic herring Clupea haren-gus membras L on different substrates in the south-west archipel-ago of Finland Journal of Fish Biology 34417-427
Rajasilta M J Eklund J Haumlnninen M Kurkilahti J Kaumlaumlriauml P Rannik-ko and M Soikkeli (1993) Spawning of herring (Clupea harengus membras L) in the Archipelago Sea ICES Journal of Marine Sci-ence 50233-246
Rannak LA (1959) Quantitative study of the Baltic herring eggs and larvae in the northern part of the Gulf of Riga and principal factors determining their survival Fisheries Research Board of Canada Translation Series 2381-15
38
5 References Essential fish habitats in the Baltic Sea Identification of potential spawning recruitment and nursery areas
Rohlf N (1999) Verhaltensaumlnderungen der Larven des Ostsee-dorsches (Gadus morhua callarias) waumlhrend der Dottersackphase Berichte aus dem Institut fuumlr Meereskunde 312
Ruskule A L Bergstroumlm J Schmidtbauer Crona J Kotta P Arndt S Strāķe S Sprukta D Ustups and I Urtāne (2019) Mapping of Marine Green Infrastructure Pan Baltic Scope Approach Pan Baltic Scope wwwpanbalticscopeeu
Saks L R Eschbaum K Juumlrgens and I Taal (2020) Ahvena raumlnded Liivi lahel ja Vaumlinameres Eesti Mereinstituut Tartu httpswwwka-lateaveeeimagespdfUuringudAhvena_rC3A4nded_Liivi_la-hel_ja_VC3A4inamerespdf
Saumlisauml M M Salminen ML Koljonen and J Ruuhijaumlrvi (2010) Coastal and freshwater pikeperch (Sander lucioperca) populations differ ge-netically in the Baltic Sea basin Hereditas 147 205-214
Scabell J and N Joumlnsson (1984) Untersuchungen zum natuumlrlichen Laichverhalten des Ruumlgenschen Fruumlhjahrsherings im Greifswalder Bodden Fischerei-Forschung 2268-72
Šaškov A A Šiaulys M Bučas and D Daunys (2014) Baltic herring (Clupea harengus membras) spawning grounds on the Lithuanian coast current status and shaping factors Oceanologia 56789-804
Seifert T F Tauber and B Kayser (2001) A high resolution spherical grid topography of the Baltic Sea -2nd edition Baltic sea Science Congress Stockholm 25-29 November 2001 Poster 147
Seitz RD H Wennhage U Bergstroumlm RN Lipcius and T Ysebaert (2014) Ecological value of coastal habitats for commercially and ecologically important species ICES Journal of Marine Science 71 648-665 httpsdoiorg101093icesjmsfst152
Skovrind M EAF Christensen L Jacobs and PR Moller (2013) Ma-rine spawning sites of Perca fluviatilis revealed by oviduct-inserted acoustic transmitters Aquatic Biology 19201-206
Snickars M G Sundblad A Sandstroumlm L Ljunggren U Bergstroumlm G Johansson and J Mattila (2010) Habitat selectivity of substrate spawning fish - modelling requirements of the Eurasian perch Per-ca fluviatilis Marine Ecology Progress Series 398235-243
Solemdal P (1967) The effect of salinity on buoyancy size and de-velopment of flounder eggs Sarsia 29431- 442
Steffensen J J Lomholt and K Johansen (1982) Gill ventilation and O2 extraction during graded hypoxia in two ecologically distinct species of flatfish the flounder (Platichthys flesus) and the plaice (Pleuronectes platessa) Environmental Biology of Fishes 7 157ndash163
Strzyżewska K (1969) Studium poroacutewnawcze populacji śledzi trą-cych się u polskich wybrzeży Bałtyku [A comparative study of her-ring populations spawning off the Polish Baltic coasts] Prace Mor Inst Ryb Gdynia T 15 ser A 211-277 [in Polish]
Stoslashttrup JG A Kokkalis EJ Brown B Vastenhoud S Ferreira J Olsen and GE Dinesen (2019) Essential Fish-habitats for com-mercially important marine species in the inner Danish waters DTU Aqua report 338-2019
Sundblad G Bergstroumlm U Sandstroumlm A and P Ekloumlv (2014) Nurs-ery habitat availability limits adult stock sizes of predatory coastal fish ICES Journal of Marine Science 71672-680
Svedaumlng H and G Bardon (2003) Spatial and temporal aspects of the decline in cod (Gadus morhua L) abundance in the Kattegat and eastern Skagerrak ICES Journal of Marine Science 6032-37
SwAM (2019) Swedish Agency for Marine and Water Management Symphony Metadata March 2019whttpswwwhavochvattensedownload1867e0eb431695d86393371d861552566811384bila-ga-1-symphony-metadatazip
Ustups D B Muumlller-Karulis U Bergstroumlm A Makarchouk and I Sics (2013) The influence of environmental conditions on early life stages of flounder (Platichthys flesus) in the central Baltic Sea Journal of Sea Research 7577-84
Toumlrnqvist O PR Jonsson and D Hume (2019) Climate refugia in the Baltic sea Modelling future important habitats by using cli-mate projections Pan Baltic Scope report Uppsala amp Gothenburg
Veneranta L L Urho A Lappalainen and M Kallasvuo (2011) Tur-bidity characterizes reproduction areas of pikeperch (Sander lucioperca (L)) in the northern Baltic Sea Estuarine Coastal and Shelf Science 95199-206
Veneranta L M Olin and H Harjunpaumlauml (2020) Ahventen pyynti- ja syoumlnnoumlsalueet Merenkurkussa tankkurimerkinnaumln perusteella Luonnonvara- ja biotalouden tutkimus 72020
Vitale F P Boumlrjesson H Svedaumlng and M Casini (2008) The spatial distribution of cod (Gadus morhua L) spawning grounds in the Kattegat eastern North Sea Fisheries Research 9036-44
Vitale F Cardinale M and H Svedaumlng (2005) Evaluation of the temporal development of the ovaries in Gadus morhua from the Sound and Kattegat North Sea Journal of Fish Biology 67669-683
Voss R MA Peck HH Hinrichsen C Clemmesen H Baumann D Stepputis M Bernreuther JO Schmidt A Temming and FW Koumlster (2012) Recruitment processes in Baltic sprat - A re-eval-uation of GLOBEC Germany hypotheses Progress in Oceanog-raphy 10761-79
Westin L and A Nissling(1991) Effect of salinity on spermatozoa motility percentage of fertilized eggs and egg development of Bal-tic cod (Gadus morhua) and implications for cod stock fluctuations in the Baltic Marine Biology 108 5-9
Wieland K U Waller U and D Schnack (1994) Development of Bal-tic cod eggs at different levels of temperature and oxygen content Dana 10 163-177
Wieland K A Jarre-Teichmann and K Horbowa (2000) Changes in the timing of spawning of Baltic cod possible causes and implica-tions for recruitment ICES Journal of Marine Science 57 452-464

2
Essential fish habitats in the Baltic Sea Identification of potential spawning recruitment and nursery areas
Published by
Helsinki Commission ndash HELCOMKatajanokanlaituri 6 B 00160 Helsinki Finland
wwwhelcomfi
Information and views expressed in this publication are the authorsrsquo own and might vary from those of the Helsinki Commission or its members
For bibliographic purposes this document should be cited asldquoEssential fish habitats in the Baltic Sea ndash Identification of potential spawning recruitment and nursery areas HELCOM (2021)rdquo
copy Baltic Marine Environment Protection Commission ndash Helsinki Commission (2021)
All rights reserved Information included in this publication or extracts thereof with the exception of images and graphic elements that are not HELCOMrsquos own and identified as such may be reproduced without prior consent on the condition that the complete reference of the publication is given as stated above
Contributors Lena Bergstroumlm12 Maringrten Erlandsson1 Ivars Putnis3 Josianne Gatt Stoslashttrup4 Meri Kallasvuo5 Ulf Bergstroumlm1 Henri Jokinen2 Māris Plikšs3 Imre Taal6 Alexandros Kokkalis4 Elliot Brown4 Stefan Husa7 Lauri Saks6 Terje Selnes9 Roland Svirgsden6 Linda Sundstroumlm7 Anastasia O Yurtseva8 Didzis Ustups34
1) Department of Aquatic Resources Swedish University of Agricultural Sciences Sweden2) HELCOM3) Institute of Food Safety Animal Health and Environment (BIOR) Latvia4) DTU Aqua Denmark5) Natural Resources Institute Finland (Luke)6) Estonian Marine Institute Estonia7) Government of Aringland8) Laboratory of Ichthyology Zoological Institute RAS Russia 9) Swedish Agency of Water and Marine Management Sweden10) Latvian Ministry of Environment and Regional Development Latvia
Layout Laura Ramos Dominik Littfass
3
Contents Essential fish habitats in the Baltic Sea Identification of potential spawning recruitment and nursery areas
Summary 4
1 Introduction 5
2 Methods 621 Outline of the work process 622 Focal species and aspects 623 Mapping approaches 824 Validation and evaluation of data quality 825 Approaches applied for the different species 826 Cod 927 Aggregation of data layers 14
3 Results 1631 Potential spawning areas for cod 1632 Potential spawning areas for sprat 1833 Potential spawning areas for herring 1934 Potential spawning areas for European flounder 2135 Potential spawning areas for Baltic flounder 2336 Potential nursery areas for flounders 2437 Potential recruitment areas for perch 2638 Potential recruitment areas for pikeperch 2839 Aggregated map 30
4 Discussion 3141 Potential uses of the maps - MSP environmental management and green infrastructure 3142 Suggestions for the further development of the essential fish habitats concept 3143 Data quality aspects 3244 Implications for application 3245 How to consider future changes 32
5 Acknowledgements 33
6 References 34
Contents
4
Summary Essential fish habitats in the Baltic Sea Identification of potential spawning recruitment and nursery areas
Summary
Fish as well as other aquatic organisms are highly dependent on the conditions of their living environ-ment to sustain health and viable populations Maps
that identify the location of important habitats for key species are a valuable tool for marine management The habitat maps can for example support the planning of environmental man-agement actions or contribute to an ecosystem-based maritime spatial planning
There has so far been a lack of regionally coherent spatial in-formation on fish habitats in the Baltic Sea Mapping is typically restricted by data limitations which is enhanced by the need to identify potentially coherent data at the regional scale and by the challenge of depicting dynamic population properties in a representative way on the map
In the following report we explore the possibility to produce regionally coherent maps on essential fish habitats in the Bal-tic Sea based on currently available knowledge Our focus is on widely distributed fish species and on spawning nursery and recruitment areas which represent central ecological functions that need consideration in marine management and maritime spatial planning Based on the results we develop a set of re-gional habitat maps for selected fish species and life cycle stages New Baltic-wide maps representing potential spawning areas of herring sprat European flounder and Baltic flounder as well as potential nursery areas of flounders are presented Additionally previously available maps on potential cod spawning areas as well as perch and pikeperch recruitment areas are re-evaluated and improved
Data to support the mapping of essential fish habitats has been recently enhanced by national and joint Baltic projects and this fact was an important enabler of the current work The presented maps hence represent the best available information at a coherent Baltic Sea regional scale at their time of develop-ment supported and further refined by a subsequent Helcom review process
However sufficient data for mapping was not yet available for some parts of the Baltic Sea and selected species It is sug-gested that these gaps are filled in future work Also points for further improvement are identified for the presented maps To give a fuller representation of essential fish habitats one should especially include more information for fish in coastal areas and in the western Baltic Sea One should also consider additional life stages for some of the included species since both spawn-ing nursery feeding and migration areas are important exem-plifications of essential fish habitats Another key area for de-velopment is to develop a stronger understanding on how the current distribution of functional essential fish habitat is limited by human activities and how to improve management in these situations These needs are even more emphasized by climate change which is expected to have dramatic influence on the dis-tribution of fish and fish habitats in the future
5
1 Introduction Essential fish habitats in the Baltic Sea Identification of potential spawning recruitment and nursery areas
1 Introduction
Aquatic species are highly dependent on the condi-tions of their living environment to sustain healthy and viable populations For fish the preferred habitat
is highly variable among species and many fish species use dif-ferent habitat types during different parts of their life cycle such as for spawning nursery feeding or migration (Seitz et al 2014)
Essential habitats are those waters or substrates necessary for a species or population to complete their life cycle and loss or degradation of essential habitats may impact population sizes In this work we refer to ldquoessential fish habitatsrdquo as ldquoenvironments of particular importance for a fish species to complete its life cycle or maintain its populationsrdquo This concept of essential fish habitats may include spawning areas nursery areas for larvae and juveniles adult feeding areas migratory corridors and oth-er possible specific areas to which a species is highly restricted
Our definition thereby aligns with that of the Magnusson-Ste-vens Fisheries Conservation Act (2007) which is a commonly used definition in fisheries management and which defines es-sential fish habitats as ldquowaters and substrate necessary to fish for spawning breeding feeding or growth to maturityrdquo and with the work of Kraufvelin et al (2018) who in a broad sense defined essential fish habitats as any environment that is needed for the maintenance of a fish population and more specifically defined coastal essential fish habitats as shallow and nearshore waters and substrates necessary to any life-stage of fish for spawning breeding feeding or growth to maturity Here we specifically fo-cus on spawning and recruitment areas
Maps that identify the location of essential fish habitats are a tool for marine management to ensure that human activities do not affect the habitats in a way that may restrict the health of fish populations Such maps can for example help identify areas where actions to reduce pressures are particularly important support the designation of protected areas or contribute to an ecosystem-based maritime spatial planning
So far there has generally been a lack of regionally coherent spatial information on essential fish habitats in the Baltic Sea (Bergstroumlm et al 2007 Modin 2008 Kraufvelin et al 2018 HELCOM 2018a) The Baltic Scope project (2017) recommended the joint identification of essential fish habitats including spawning nurs-ery and growth areas for the whole Baltic Sea for species of interest to fisheries as one priority to further support MSP in the Baltic Sea
Defining essential fish habitats is challenging for several reasons The process of mapping aquatic habitats is generally restricted by data limitations and by the need to combine in-formation from different data sources in a coherent way There may also be ecological constraints related to defining the appro-priate spatial scale for a certain feature and potential changes in the location of a certain habitat over time In the case of fish the suitability of spawning or feeding areas depends not only on
physical and topographical characteristics which are constant over time but also on hydrological characteristics which show seasonal and inter-annual variation such as temperature con-ditions or the movements of water masses (hydrodynamics) In addition the presence of other species may be decisive for how suitable the habitat is in reality such as the presence of suitable vegetation in a spawning area or the presence of zooplankton in a recruitment area To delineate habitats on a map one also needs to consider that habitat suitability varies along environ-mental gradients Whereas areas with minimum environmental conditions can be identified for example in relation to the mini-mum salinity required for successful spawning for a marine spe-cies the environmental range representing optimal conditions is usually smaller Lastly human induced pressures such as fishing eutrophication or physical disturbance impact habitat quality and how effectively species can utilize the habitat in reality
In the following report we explore the possibility of pro-ducing regionally coherent maps on essential fish habitats in the Baltic Sea based on currently available knowledge and suggest a set of Baltic-wide maps on potential key habitats for selected fish species and life cycle stages Maps were devel-oped for selected life stages of herring sprat European floun-der and Baltic flounder for which no maps were previously available in HELCOM Additionally previously available maps for cod spawning areas as well as perch and pikeperch re-cruitment areas were re-evaluated and improved (For an over-view see Table 1) The maps are available at the HELCOM Map and Data Services1 The purpose of the presented maps is to support the identification of areas of particular concern with respect to ecological values and the provision of ecosystem services related to widely distributed fish species in the Baltic Sea By this the maps can support maritime spatial planning and environmental management including actions to reduce human impacts in areas of high nature value in the Baltic Sea
1 mapshelcomfiwebsitemapservice
6
2 Methods Essential fish habitats in the Baltic Sea Identification of potential spawning recruitment and nursery areas
2 Methods
21 Outline of the work process
The results presented in this report originate from work within the Pan Baltic Scope project1 and from a joint regional Expert Work-shop on essential fish habitats which was organized by HELCOM and the Pan Baltic Scope project (HELCOM 2018a) The develop-ment took place in steps First partner researchers of Pan Baltic Scope made an overview of current knowledge on essential fish habitats in the Baltic Sea and used this information to make initial proposals for those species and aspects (spawning areas recruit-ment areas nursery areas) that were considered feasible based on available information (Box 1 Table 1) The researchers then circu-lated the initial proposals to a wider group of nationally nominated experts who also took part in the joint HELCOM ndash Pan Baltic Scope workshop (HELCOM 2018a) to evaluate the overview and validate the proposed maps The workshop discussed the maps and the approach applied and made further recommendations on how to improve them The participants also took part in ensuing work over correspondence to finalize the development The work in progress was subsequently presented to the meetings of HELCOM Fish-Pro III 1-2019 (HELCOM 2019a) and HELCOM VASAB MSP WG 18-2019 (HELCOM 2019b) for comments and to HELCOM State amp
1 Co-funded by the European Maritime and Fisheries Fund wwwpanbalticscopeeu
Species Type of fish habitat Relation to previously available regional map
Mapping approach
Cod (Gadus morhua)
Spawning area New ndash Previous map (HELCOM 2018b) was reworked
Environmental envelope
Sprat (Sprattus sprattus)
Spawning area New ndash No previous map Environmental envelope
Herring (Clupea harengus membras)
Spawning area New ndash No previous map Habitat associations
European flounder (Platichthys flesus)
Spawning area New ndash No previous map Species distribution modelling combined with environmental envelope
Baltic flounder (Platichthys solemdali)
Spawning area New ndash No previous map Species distribution modelling combined with environmental envelope
Flounders (Platichthys spp)
Nursery area New ndash No previous map Species distribution modelling
Perch(Perca fluviatilis)
Recruitment area Updated ndash Previous map (HELCOM 2018b) was re-examined and improved
Species distribution modelling combined with direct mapping
Pikeperch (Sander lucioperca)
Recruitment area Updated ndash Previous map (HELCOM 2018b) was re-examined and improved
Species distribution modelling combined with direct mapping
Conservation WG 10-2019 and 11-2019 (HELCOM 2019c d) for en-dorsement Comments and guidance for improvement received during these steps are included in the results presented below
22 Focal species and aspects
The focus of the development was on fish spawning recruitment and nursery areas as these represent central ecological functions that need consideration in marine management and maritime spatial planning Spawning areas include those habitats where ripe adults concentrate spawn and release their eggs and where the eggs develop (eg Seitz et al 2014) These areas are a limiting factor for fish populations if the availability of functional spawn-ing habitats is not sufficient to support population maintenance or growth (Mumby et al 2004 Sundblad et al 2014) For species with pelagic or mobile eggs and larvae such as sprat herring Eu-ropean flounder and cod the distribution of the spawning area may be significantly smaller than that of the area were juveniles occur so that the spawning area contributes to the population at a much larger scale For species with a limited dispersal of the larval stage such as perch and pikeperch the spawning areas and the areas were juveniles reside often overlap (Sundblad et al 2014 Kallasvuo et al 2017) and such crucial areas for population main-tenance are here referred to as recruitment areas Finally nursery
Table 1 Overview of the presented maps The last column shows the principal mapping approach (See section 23)
7
2 Methods Essential fish habitats in the Baltic Sea Identification of potential spawning recruitment and nursery areas
Box 1
Main data sources
The developed maps build on previous work in the Baltic Sea including the follow-ing projects
HELCOM HOLAS II project (HELCOM ho-listic assessment on the ecosystem health of the Baltic Sea 2014-2018) This com-prehensive project to assess the state of the Baltic Sea during 2011-2016 included among other things an assessment of spa-tial cumulative impacts (HELCOM 2018b) To support the assessment maps on key ecosystem components in the Baltic Sea were developed and agreed on by HELCOM Contracting Parties The maps focus on the spatial distribution of species habitats and habitat types with a wide distribution in the Baltic Sea and are publicly available at the HELCOM Maps and Data services1 Re-garding fish habitats maps representing recruitment areas for perch recruitment areas for pikeperch and spawning areas for cod were considered further in the work presented in the current report Further maps representing habitat-forming species (vegetation) and habitat types from HOLAS II were used in the delineation of essen-tial fish habitat maps for herring HOLAS II also include maps on the abundance of cod herring and sprat that were not used as a basis for the current work as new ap-proaches were used instead
The BALANCE project2 (Baltic Sea Management ndash Nature Conservation and Sustainable Development of the Ecosys-tem through Spatial Planning 2005-2007) This Baltic-wide project aimed to develop informed marine management tools for the Baltic Sea based on spatial planning cross-sectoral and transnational co-oper-ation (eg Ekebom et al 2008) The work
1 mapshelcomfiwebsitemapservice2 wwwbalance-euorg
included a definition of Baltic Sea marine landscapes and the development of habi-tat maps which were also used as a basis in the current report (Al-Hamdani and Reker 2007) The work further included an evalu-ation on the state of knowledge on essen-tial fish habitats (Bergstroumlm et al 2007) The project was EU co-funded within the BSR INTERREG III B Program
The Baltic Scope project3 (2015-2017) was the first Baltic Sea project to bring to-gether national authorities with a planning mandate to collaborate in transboundary maritime spatial planning The project also collected information about essential fish habitats from national plans It was con-cluded that countries used very different approaches to map essential fish habitats For future work the project recommended to produce common essential fish habitat maps for fish species with a Baltic-wide dis-tribution (Baltic Scope 2017) The project was co-funded by the European Maritime and Fisheries Fund
The BONUS INSPIRE project4 (Inte-grating spatial processes into ecosystem models for sustainable utilization of fish re-sources 2014-2018) included the aim to re-solve the habitat requirements of different life stages of Baltic fish species focusing on cod herring sprat and flounder (Ojaveer et al 2018) In doing so the project combined field surveys and traditional methods with the application of modern analysis and modelling techniques The project was funded by the Baltic BONUS programme the EU and national funding institutions in the Baltic Sea countries
The Fish-Hab-II project (2017-2018) de-veloped habitat maps for different life stag-es of ten commercially important species in Danish waters The maps were produced for the Kattegat Belt Seas the Sound and
3 wwwbalticscopeeu4 wwwbonus- inspireorg
the western Baltic Sea area (from 959deg to 1372degE and from 5421deg to 5778deg N) and included for example EFH maps based on predictive models for cod European floun-der plaice and sole (Stoslashttrup et al 2019) The project was funded by the European Maritime and Fisheries Fund
The NCM Workshop on Essential Fish Habitats was funded by the Nordic Council of Ministers and organized by the Swedish University of Agricultural Sciences was held in 2015 with the objectives to review exist-ing knowledge on the role mapping and monitoring of essential habitats of coastal fish in the Baltic Sea (Kraufvelin et al 2016) The workshop did not produce spatial infor-mation but collated and developed a struc-tured knowledge-base for different areas around the Baltic Sea regarding the char-acteristics of essential fish habitats in coastal areas The outcome included for example information on how essential fish habitats can be defined in relation to other abiotic and biotic variables biotopes or biotope complexes as well current threats to these (Kraufvelin et al 2018)
In addition several nationally coordi-nated activities and initiatives to develop maps on nature values were considered As one such example the Finnish MSP is de-veloping synthesis maps describing ldquoeco-logically significant underwater nature areasrdquo covering the entire Finnish coastal area and representing all different ecosys-tem aspects essential fish habitats plants macroalgae bottom animals seals water birds etc Good spatial data is available from existing monitoring and the extensive VELMU inventory program5
The Copernicus Marine Environment Monitoring Service6 has provided envi-ronmental variables covering whole Baltic Sea which were used in several of the maps
5 wwwymparistofien-USVELMU 6 marinecopernicuseu
8
2 Methods Essential fish habitats in the Baltic Sea Identification of potential spawning recruitment and nursery areas
areas are here defined as areas where juvenile life stages concen-trate and which also support the adult population at a significant-ly larger spatial scale (Beck et al 2001 Dahlgren et al 2006)
Data availability to support the mapping of spawning areas was explored for seven species with commercial and ecological importance and a wide distribution in the Baltic Sea and such maps were developed for cod sprat herring European flounder and Baltic flounder Additionally existing maps on recruitment ar-eas for perch and pikeperch were evaluated and updated Finally a map on nursery areas was completed for flounders This map shows potential nursery areas for European and Baltic flounder together as these are not possible to distinguish based on field data and to large extent overlap with each other It is suggested that additional maps on nursery areas are added to the set when data and models are sufficiently developed to support this partic-ularly for cod plaice sole and flounder in the Western Baltic
23 Mapping approaches
Maps on essential fish habitats can be produced in several ways The maps presented in this report were sometimes produced in different ways depending on available information for each species This section gives a summary of the different types of approaches that were considered in the work The approaches applied for each of the species is presented in section 25 and an overview is provided in Table 1
Direct data The most reliable verification of a fish habitat is typ-ically by direct mapping based on inventory or monitoring data However since collecting field data is costly comprehensive inven-tory data on fish is often scarce It is also challenging to ascertain that the mapping results have reliable coverage This is especially true for parameters representing fish spawning recruitment and nursery areas such as the presence and abundance of fish eggs larvae and young of the year which are only present during part of the year Hence available direct data to support mapping have limited spatial extent and comprehensive data at the whole Baltic Sea scale do not exist for any of the focal species However avail-able data can still be used for the areas they represent if they have adequate resolution and coverage and ensuring that the variable descriptions (units) are comparable among different areas Avail-able direct data can also support other approaches mentioned below or be used to validate maps produced by other approaches
Species distribution models Spatial predictive modelling pro-duces maps with fuller spatial coverage which describe the prob-able distribution of fish habitats Direct data from inventories or monitoring are used as a basis for developing statistical models depicting the relationship between the key variable and environ-mental parameters Typical important environmental parameters in the case of fish habitats are for example depth salinity and wave exposure among others The statistical models are then combined with spatial data on the environmental parameters identified as having predictive importance to identify areas with similar environmental properties as the fish habitats identified in the inventory Resulting maps show the probability of occurrence of the essential fish habitat in focus according to the applied mod-el to be further validated against other information
Environmental envelope approach The envelope approach builds on similar principle as species distribution models but is not dependent on spatially referenced input data The environ-
mental envelope for a certain species and life stage is defined based on ecological knowledge on its limiting required environ-mental conditions The key environmental variables and their threshold values are identified for example based on experimen-tal studies or other relevant literature In the absence of published information expert judgement can be considered The important aspects to decide on are which environmental variables should be included in defining the envelope and what threshold levels to apply for these variables
Habitat associations If information to support the environ-mental envelope approach is insufficient the fish habitat may be depicted on an overarching level based on the distribution of benthic habitats that the focal species and life stage is mainly as-sociated with Data that could be useful include spatial informa-tion on habitat types or habitat- building species Maps on Natura 2000 habitat types might also be relevant to consider even though obtained estimates should be associated with high uncertainty as differences among countries can be expected in how the Natura 2000 habitat types are defined and delineated
24 Validation and evaluation of data quality
The initial maps should as far as possible be validated against oth-er sources of knowledge before finalization The purpose of the validation is to identify and correct for errors which may occur due to uncertainties in several factors such as the precision of the applied input data ecological assumptions the generality of the models and others If the validation suggests consistent errors in comparison with external information the selection of approach key environmental variables or threshold values should be re-ex-amined The maps should further be associated with information on data quality aspects when presented
In the current case the validation and evaluation of data quality were carried out by the HELCOM Pan Baltic Scope EFH WS (HELCOM 2018a) and in later steps by correspondence with national experts (for example HELCOM 2019 c d) When clearly justified the initial maps were adjusted manually For example the applied approach might have picked up highly modified or disturbed areas where spawning is in fact not possible (examples include channels lagoons city harbors) or additional areas were added referring to locally available mapping data Data quality aspects in relation to the presented maps are shown in Chapter 3 and discussed in Chapter 4
25 Approaches applied for the different species
Available data and knowledge were examined for each of the sev-en species and the focal aspects to decide on a mapping approach Among mapping approaches direct mapping and species distri-bution modelling were preferred whenever feasible However suf-ficiently developed research to support this was not available for pelagic habitats Hence the environmental envelope approach was applied for the maps on spawning areas of cod and sprat For floun-ders a combination of species distribution modelling and environ-mental envelope was used For herring spawning habitats available data were only sufficient to support a broad mapping based on hab-itat associations (For an overview see Table 1)
9
2 Methods Essential fish habitats in the Baltic Sea Identification of potential spawning recruitment and nursery areas
Further for the process of mapping of essential fish habitats Planque et al (2007) classified maps into either potential realized or effective essential fish habitats depending on what underlying data and assumptions the maps were based on By their defini-tions ldquopotential habitatsrdquo are those where water masses or sub-strates can support a particular life stage during a certain period of time based on for example known environmental constraints ldquoRealized habitatsrdquo again are those which have been observed to uphold that life stage based on for example sampling to show that fish eggs are present Last ldquoeffective habitatsrdquo are those which support the highest densities or have the highest relative con-tribution to the population In relation to this classification the Baltic-wide maps presented here represent potential habitats or areas where the focal habitat is likely to be found based on known environmental constraints and validated by available sampling Mapping either realized habitats or effective habitats as defined by Planque et al (2007) was not realistic at the Baltic wide scale in our work due to the many uncertainties involved as outlined above For more information on the mapping approaches applied here see section 25 Some more details on the key information consid-ered for each of the species and focal aspects are presented below
26 Cod
Cod (Gadus morhua) occurs from the Kattegat to the Baltic Proper and is hence the most widely distributed predatory fish species in the Baltic Sea Cod is important commercially but it is also a key species in the ecosystem It is the predominating predatory fish species in the open sea and a central link in the food web that connects benthic and pelagic systems By the delineation applied in fisheries management cod is represented by three stocks in the
region Eastern Baltic cod Western Baltic cod and Kattegat cod (ICES 2019a b) The map focused on spawning areas for cod
The hydrographical environment is of high importance for cod spawning in the central Baltic Sea Spawning success is mainly dependent on suitable salinity and oxygen conditions as well as
on temperature For these reasons the spawn-ing success of cod is substantially different in different parts of the region and it also varies among years Conversely a lack of suitable oxy-gen and salinity conditions has negative effects on spawning success via effects on fertilization efficiency and egg survival Eggs occurring close to the seabed also face increased risk of mortal sedimentation These hydrographical conditions depend strongly on climate change as well as on eutrophication levels in the case of oxygen In ad-dition the fact that the cod population is strongly reduced may affect to what extent some potential spawning areas are utilized in reality Available evidence show that the extent of suitable cod spawning areas has decreased over time in the Baltic Sea For example the progress of decline of cod spawning areas in the Arkona deep Gdansk deep and Gotland deep during 1971-2010 was shown through a combination of hydrodynamic modelling and Lagrangian particle tracking by Hinrichsen et al (2016 Figure 1) These findings raise questions about the current function of the Gotland deep for cod spawning as known previ-ously (Bagge et al 1994) They also emphasize the critical need for sustainable management of the Bornholm deep and the Arkona deep as further emphasized by climate change (Box 2)
Figure 1 Progression of suitable habitat status for spawning grounds for cod in southeast Baltic Sea 1971-2010 (Aggregated on basis of Hinrichsen et al 2016)
Box 2 Potential future scenarios under climate change
The importance of climate-related variables such as salinity temperature and oxygen for cod spawning in the Baltic Sea stresses the need to develop forecasts and spatial scenarios on how spawning areas may be affected by climate change In the Swedish maritime spatial planning process small steps were taken in this direction by identifying potential climate refugia
Climate refugia are areas where the effects of climate change on the ecosystem are estimated to be relatively milder (Dahlgren and Havenhand 2017) Through modelling based on projected climate-related changes in the future the Swed-ish MSP process searched to identify potential climate refugia for (inter alia) Eastern Baltic cod using climate scenarios from IPCC Models based on projected changes in salinity and oxy-gen under IPCC scenarios RCP 45 and RCP 85 indicated that even Eastern Baltic cod will most probably not have success-ful spawning in the Baltic Sea in year 2100 At RCP 45 a mar-ginal area of potentially suitable habitat was considered but would likely be too small to sustain the population also given foreseen interannual variability in environmental conditions (Toumlrnqvist et al 2019)
10
2 Methods Essential fish habitats in the Baltic Sea Identification of potential spawning recruitment and nursery areas
In the western Baltic the hydrographical conditions are less criti-cal and instead cod population abundance and age structure are relatively more important factors for recruitment The western and eastern Baltic cod stocks partly overlap and the Arkona deep is es-timated to be functional for spawning of both stocks (Huumlssy 2011)
The previously existing regionally agreed map on cod spawning areas was developed within the HELCOM HOLAS II project (HEL-COM 2018b) based on information from literature The map was approved by all HELCOM Contracting Parties in a review process However the HELCOM Pan Baltic Scope EFH WS recommended that the new map on spawning areas of cod should rather be de-veloped using an environmental window approach that consid-ers the different ecological characteristics of Eastern Baltic cod and Western Baltic cod and includes available information on Kattegat cod Background information for each of these stocks is presented below
Eastern Baltic cod Studies of the horizontal distribution of cod eggs and larvae have identified the Bornholm Basin the Gdansk Deep and the Gotland Basin as the major potential spawning grounds for Eastern Baltic cod In the eastern Baltic the spawning period is extended from March to August During the 1970s and late 1980s peak spawning took place between the end of April and mid-June A gradual shift in the timing of spawning to the end of July was observed in the 1990s and later years (Bagge et al 1994 Wieland et al 2000) Suitable environmental conditions for egg and larvae production for Eastern Baltic cod occur regularly throughout all years recorded in the Bornholm basin The abun-dance of cod eggs during the main spawning time is in general the highest in the Bornholm deep Additionally cod spawning takes place regularly in the Slupsk Furrow (ICES 2018) Since the mid-1980s cod spawning is very rare in the Gdansk and Southern Got-land basins Reproduction conditions improves during baroclinic inflows of marine water from the North Sea For example a Major Baltic Inflow in 2014-2015 led to a certain but relatively short-time improvement of cod reproductive volume and larval production in these areas (Morholts et al 2015 Naush et al 2014) However the Gdansk and Gotland basins have overall small contributions to cod recruitment since the mid-1980s which are observed in some years only The reduction is related to weaker and less frequent baroclinic inflows stagnation processes in the basins as well as low stock size (MacKenzie et al 2000 Koumlster et al 2009 Plikshs et al 2015 Koumlster et al 2017)
The use of spawning area and rate of successful spawning de-pends on the spawning stock size and suitable environmental conditions Environmental threshold values for spawning were suggested at salinity gt11 (ensuring egg buoyancy and fertilization) oxygen gt 2mLL (egg survival) and temperature gt 15ᵒC (Westin and Nissling 1991 Wieland et al 1994)
Western Baltic cod Western Baltic cod spawns from January to May with the main spawning period from March to April (Bleil et al 2005 2009) Spawning areas are regions of deeper than 20 m in the Kiel Bight the Fehmarn Belt and the Mecklenburg Bight En-vironmental threshold values for spawning of Western Baltic cod have been suggested at salinity 18-33 (ensuring egg development and survival) and temperature gt 2ᵒC (Nissling and Westin 1997 Rohlf 1999 Hussy et al 2012)
Kattegat cod Spawning in Kattegat cod takes place from be-ginning of January to end of April The spawning peaks in Janu-ary to February (Vitale et al 2005) and shows is a spatial gradient with later spawning in the southern areas Spawning aggregations have been observed north of Laeligsoslash in the central Kattegat (Bar-
tolino et al 2012) southern Kattegat including Skaumllderviken and Laholm Bay (Hagstrom and Wickstroumlm 1990 Svedaumlng and Bardon 2003) and in the Sound and Great Belt (Bagge et al 1994) How-ever with the declining stock spawning is no longer observed in many of the earlier spawning sites Active spawning sites are re-ported off the coast of Falkenberg in Sweden or more predomi-nantly in the southeastern Kattegat very close to the entrance to the Sound (Vitale et al 2008 Boumlrjesson et al 2013) Stoslashttrup et al (2019) showed salinity and depth to be significant predictors for cod spawning areas in the Kattegat They used generalized addi-tive models based on survey data for predicting spawning areas Results showed important spawning grounds in the areas off Falkenberg and to the south along the Swedish coast in the south-eastern part of the Kattegat around the entrance to the Sound and the Sound (See also Box 1) The HELCOM Pan Baltic Scope EFH WS suggested to apply a salinity threshold of 18 for spawning also for Kattegat cod (Nissling and Westin 1997 Hussy et al 2012)
261 Sprat
Sprat (Sprattus sprattus) is a small-bodied clupeid It occurs in the entire Baltic Sea mainly in open sea areas Sprat is pelag-ic schooling species which preys on zooplankton and fish eggs and functions as prey for top predators such as cod It represents one of the most important commercially exploited fish species in the Baltic Sea In fisheries management sprat is assessed as a single stock within the ICES subdivisions 22-32 in the Baltic Sea (ICES 2019a) The map focused on spawning areas for sprat
The highly stratified deep basins in the central Baltic are known to be the major spawning grounds of Baltic sprat The spawning time is different in different parts of the Baltic Sea and overall recruitment success varies tightly with temperature (Baumann et al 2006) Spawning typically occurs from February to August in the deeper parts of Bornholm and Gdansk Basins Further north it starts later giving an overall shorter time win-dow for spawning Sprat eggs are pelagic and are assumed to have a minimum limit for survival and buoyancy at a salinity of 6 (Petereit et al 2009) Recent fisheries surveys indicate that sprat spawning does no longer occur in the Gulf of Finland
There was no previously existing map on sprat spawning grounds covering all of the Baltic Sea why a new proposal for such a map was developed
262 Herring
Atlantic herring (Clupea harengus) is alongside sprat the most abundant pelagic clupeid in the Baltic Sea It is widely distrib-uted and common in all sub-basins The Baltic Sea herring is smaller than herring in the Atlantic and is well adapted to the low salinity Herring feeds in the pelagic where it mainly eats zooplankton but also other species It is an important prey for cod and marine mammals and has significant commercial im-portance in all of the Baltic Sea Genetic studies and observa-tions on spawning behavior suggest that herring shows strong local population structure in the Baltic Sea (eg Joslashrgensen et al 2005) In fisheries management Baltic herring is assessed based on four stock units representing western Baltic spring spawning herring (ICES subdivisions 22-24) Central Baltic Sea (subdivisions 25-27 282 29 and 32) Gulf of Riga (subdivision 281 and Gulf of Bothnia (subdivisions 30-31 ICES 2019a) The map focused on spawning areas of herring
11
2 Methods Essential fish habitats in the Baltic Sea Identification of potential spawning recruitment and nursery areas
Herring spawns in shallow coastal areas and in offshore shal-lows It has demersal eggs which are attached to the seabed substrate There are populations of both spring spawning and autumn spawning herring in the Baltic Sea out of which spring spawning herring strongly dominates today Available information on the distribution of herring spawning grounds are mainly based on direct local observations (see referenc-es in next section) In addition spatial predictive modelling based on physical parameters on a smaller-than regional scale has been initially explored (Modin 2008)
Studies on herring spawning grounds have been made mainly in four areas in the Greifswalder Bodden the Gulf of Riga and Paumlrnu Bay the Askouml-Landsort area in Sweden and on the Finnish coast extending from the Gulf of Finland to the Bothnian Sea All studies were made by SCUBA diving which allows direct observations of herring spawn on the bottom The first surveys of herring spawn were carried out in the 1940s and 1950s in the Gulf of Riga (Rannak 1959) The same spawning areas were also revisited in the 1980s by Raid (1990) In the Greifswalder Bodden Scabell amp Joumlnsson (1984) and Joumlnsson et al (1984) studied the spawning substrates and egg densities of the Ruumlgen herring and Klinkhardt et al (1985) described the successive use of spawning beds during the spawning season in the same area Scabell and Joumlnsson (1989) presented the monitoring program used in the spawn-ing areas of the Ruumlgen herring in the 1980s In the Gulf of Riga Ojaveer (1981) and Raid (1990) studied the density and mortality of herring eggs on the spawning grounds and Kor-nilovs (1994) made similar studies on the Latvian coast In the east coast of Sweden (Askouml archipelago) Aneer and Nellbring (1982) made an extensive survey of spawning beds and de-scribed the characteristics of herring spawning at the end of the 1970s Aneer et al (1983) also made observations on the herringrsquos spawning act in situ in the Askouml area In the Archi-pelago Sea characteristics of herring spawning have been studied by Rajasilta et al (1986 1989 1993) Oulasvirta et al (1985) and Kaumlaumlriauml et al (1988 1997) To gather information on spawning grounds along the Swedish east coast covering the coasts of the Bothnian Bay the Bothnian Sea and the Baltic proper an interview study directed towards persons with ex-tensive local experience of fishes and fishing was carried out in 2003 (Gunnartz et al 2011) More recent studies in the Baltic Sea cover Lithuanian coast (Šaškov et al 2014 Naumlslund et al 2011) The Vistula Lagoon and Pomeranian Bay are important spawning grounds of herring (Popiel 1955 1984 Strzyżewska 1969 Fey 2001 Fey et al 2014a 2014b Krasovskaya 2002)
According to the study results herring spawn in quite sim-ilar conditions around the Baltic Sea In the innermost archi-pelagos spawning in spring takes place mainly on shallow bottoms (0-8 m) but in the autumn at some greater depths (Oulasvirta 1987) Herring prefers aquatic vegetation as a spawning substrate but does not show selection for any sub-strate type (Aneer 1989) The herring schools visit the same spawning grounds one generation after another (Raid 1990) and in some spawning areas the spawning beds are used suc-cessively during the spawning season (Klinkhardt et al 1985 Rajasilta et al 1993) The common conclusion from the stud-ies is that herring spawns in relatively shallow areas mostly in areas characterized by hard bottom or on soft bottoms with erect vegetation The specific site for spawning within these areas may however be variable both among years and within
the same season as it also depends strongly on hydrological characteristics such as temperature and currents
There was no previously existing map on herring early life stages covering all of the Baltic Sea why a map on potential herring spawning areas was developed
263 Flounder
The taxonomic status of flounders in the Baltic Sea (Platich-thys spp) was revisited shortly before the time of this study It has long been known that flounders in the Baltic Sea have two different reproductive strategies representing offshore spawning populations with pelagic eggs and coastal spawn-ing populations with demersal eggs (Solemdal 1967 Nissling et al 2002) These two strategies were shown by Momigliano et al (2017) to belong to two closely related but distinct species Flounder with demersal eggs was described as a new species the Baltic flounder Platichthys solemdali (Momigliano et al 2018) The two species have overlapping feeding and winter-ing areas in the central Baltic Sea but are spatially separated during spawning time The maps focused on spawning areas of European flounder and Baltic flounder respectively and on recruitment areas for both flounder species taken together
Since the formal delineation between European and Baltic flounder was made very recently there were no studies formal-ly addressing physiological features of the two verified species but relevant information was obtained from earlier studies that distinguished the two now formally described distinct species as two different spawning ecotypes
European flounder (Platichthys flesus) is a key species in many areas of the Baltic Sea with a focus in the central and south-western sub-basins European flounder spawns exclu-sively in deep offshore basins of the south-western and central Baltic Sea where salinity is high enough for successful fertiliza-tion and water density is sufficiently high for the eggs to float in the water column to avoid the anoxic bottom waters (Nissling et al 2002 Ustups et al 2013) The species migrates between coastal and open sea areas during its life cycle Adults feed in shallow coastal areas during summer and move out to deep-er areas in winter where the spawning takes place in spring Early juvenile life stages again reside in shallow coastal areas until recruiting to the adult population (eg Carl et al 2008) Available literature suggests that the environmental limits for spawning of European flounder are rather similar to those of cod with respect to salinity and may suggest that its require-ments for oxygen are lower than for some other fish species (Steffensen et al 1982 Fonds et al 1992) Results from the hy-drodynamic modelling suggest that the level of connectivity may be high (Hinrichsen et al 2017b)
Baltic flounder (Platichthys solemdali) spawns in shallow coastal areas and on offshore banks In these spawning areas the eggs do not float as is the case for European flounder but sink to the bottom Demersally spawning flounders have been observed to lay their eggs on sandy and rocky bottom or on rocky substrates covered with algae (Bonsdorff and Norkko 1994) Early juvenile life stages reside in shallow coastal areas until recruiting to the adult population (Nissling et al 2015) Similar as for European flounder adult Baltic flounder has a migrating behavior so that it feeds in coastal areas during sum-mer and moves to deeper areas in winter In contrast to Euro-pean flounder it however spawns demersally in coastal areas
12
2 Methods Essential fish habitats in the Baltic Sea Identification of potential spawning recruitment and nursery areas
and the salinity requirements for spawning of Baltic flounder are lower Successful spawning for demersally spawning Bal-tic flounder may be expected at salinities down to around 5-7 (Nissling et al 2002) Low oxygen concentration poses a less important restriction to spawning as the coastal near-shore spawning waters are in most cases well oxygenated
264 Spawning areas of European flounder
Potential spawning habitats for flounders in the Baltic Sea were characterized and spatially predicted by Orio et al (2017) based on catches of flounder in gillnet surveys during the spawning season The basis for the study was to map mature flounder during or very close to the spawning season when they were expected to occur in their preferred spawning habitat and subsequently use the catch observations together with observed environmental data as a basic for predictive modelling over a larger geographical area (Figure 2) The focus of the study was on the southern and central Baltic Sea using depth transects at 11 locations (427 stations) The approach provides a wide-ranging description of potential spawning areas in the Baltic Sea with statistical documentation of the expected rela-tionships to environmental variables A separate model for pelagic spawning flounder (here interpreted as European flounder) showed a negative relation with temperature and bottom current and a positive relation with salinity (Figure 3)
The main uncertainties in the results by Orio et al (2017) are expected due to temporal differences in sampling and spawning time between different areas so that there is some variability in how close to spawning the flounders were at the time of capture In some areas there also occurred spent flounder in the samples which means that the flounder could spawned in another place than where they were captured This is not expected to affect results at the coarse geographical scale used here but may affect the small-scale patterns (primarily depth distributions) Generally the spawn-ing occurs earlier in the western parts of the Baltic Sea In addition low captures of flounder at some of the stations might not only re-flect poor habitat preference but may also reflect other factors for example a reduced spatial expansion due to low population size If that is the case the predicted habitat range may be underestimat-ed This may potentially affect results for pelagic spawners2 in ICES subdivisions 26-28 whereas pelagic spawners in subdivisions 24-25 have fairly strong populations (Orio et al 2017b)
To prevent extrapolation outside the realistic range of sampled en-vironmental conditions Orio et al (2017) restricted their predictions to areas within the physiological limits for fertilization of flounder egg and survival based on salinity and oxygen conditions The spatial pre-dictions were also limited in relation to depth to account for the exis-tence of two different spawning types (which were later described as separate species by Momigliano et al 2017 2018) The depth limit for pelagic spawners was set to areas deeper than 30 m and the bottom salinity to at least 10 referring to Hinrichsen et al ( 2017b) In relation to oxygen concentrations the prediction was set to 0 in all areas with bottom oxygen concentrations below 1 mll In reality the geographi-cal range of suitable spawning areas for European flounder is expect-ed to vary along with spatial variation in these hydrological variables which are forced by climate change as well as human impact related to eutrophication An increase of suitable spawning areas can be ex-pected for example in connection to Major Baltic Inflows
2 Representing European flounder
Figure 2 General model for flounder spawning areas in the Baltic Sea Response curves of environmental variables in a statistical predictive model This general model was based on data representing both Baltic and European flounder data (referred to as ldquoecotypesrdquo at that time) Dashed lines show the 95 confidence interval Source Orio et al (2017)
Figure 3 Model for pelagic spawning flounder (representing European flounder) Response curves of environmental variables in a statistical predictive model This model was made separately for data on mature flounder in deep areas Dashed lines show the 95 confidence interval Source Orio et al (2017)
13
2 Methods Essential fish habitats in the Baltic Sea Identification of potential spawning recruitment and nursery areas
Figure 4 Model for demersal spawning flounder (representing Baltic flounder) Response curves of environmental variables in a statistical predictive model This model was made separately for data on mature flounder in shallow areas Dashed lines indicate the 95 confidence interval Source Orio et al (2017)
the same nursery habitat Both European and Baltic flounder spawn in spring the former in late winter to spring and the latter in spring and early summer Young of the year fish can be observed from June to September on shallow sea beds primarily sandy substrates
Juvenile flounder (young of the year) have been sampled by three different principal methods In the Baltic Sea beach seine push net and mini trawl The three methods differ in how large area they cover but since all methods sample a known surface area their re-sults can be converted to ldquocatch per unit areardquo to be comparable A dedicated data request was carried out within the Pan Baltic Scope project and showed that comparable survey data are available for many parts of the Baltic Sea albeit with data gaps in the southern Baltic Sea (Figure 5) The natural distribution range of the two floun-der species does not extend into the Gulf of Bothnia or inner Gulf of Finland at least not with respect to spawning areas
A spatial predictive model was applied to make use of currently available data and create a map of potential nursery areas of floun-der Data from all identified available surveys of juvenile flounder were collected and compiled for the modelling (Figure 5) While in a few of the datasets occasional older juveniles may have been in-cluded the absolute majority of the observed fish were young of the year individuals why the model will represent the distribution of the youngest year-class Only results from surveys performed in June-September from 2004-2018 were used to represent the nurs-ery season and the current situation This resulted in a total of 2114 samples To harmonize the datasets all abundance estimates were converted to ldquojuvenile flounder per square meterrdquoValues for the environmental predictor variables were extracted in GIS for each sampling point The following variables were used salinity wave exposure water depth slope of the bottom surface temperature (mean for June-September) bottom currents and dis-tance to high probability spawning area for European flounder
265 Spawning areas of Baltic flounder
The predictions of potential spawning habitats for flounders in the Baltic Sea carried out by Orio et al (2017) and presented above for European flounder are also relevant for Baltic flounder Among their principal results were observations on a dual water depth distribution and salinity preference of flounders at spawn-ing time which they interpreted as distinct responses to these environmental variables by the two ecotypes later redefined to two species (Figure 2) The separate model for the demersal ecotype (P solemdali) showed a salinity optimum at around sa-linity 7 (Figure 4) The model indicated no strong relationship to vegetation or substrate although rocky habitats seemed to be preferred over pure soft substrate (Orio et al 2017)
The main uncertainties in demersal flounder model are the same as those presented for European flounder (above) Ad-ditionally in some areas a negative interaction with the pres-ence of round goby may lead to underestimations in prediction (this is encompassed in Figure 4)
To prevent unrealistic extrapolation outside the range of sampled environmental conditions Orio et al (2017) restricted the predictions to areas within the physiological limits for eggs fertilization and survival The predictions were also adjusted in relation to depth to account for the existence of two different spawning types (which were later described as separate species by Momigliano et al 2017 2018) For demersal spawners the predic-tions were restricted to areas shallower than 30 m and with salinity of at least 6 referring to Nissling et al (2002) and Hinrichsen et al (2017b) In relation to oxygen concentrations the prediction was set to 0 in all areas with bottom oxygen concentrations lt 1 mlL
266 Nursery areas for flounder
As shown in the sections above the two flounder species in the Bal-tic Sea European flounder (Platichthys flesus) and Baltic flounder (Platichthys solemdali) have different reproductive strategies and their principal spawning areas are spatially and temporally separat-ed The Baltic flounder spawns in shallow waters while European flounder spawns in deeper areas Despite these differences larvae of both species settle in shallow areas so that the two species share Figure 5 Data sampling points used in the juvenile flounder model
14
2 Methods Essential fish habitats in the Baltic Sea Identification of potential spawning recruitment and nursery areas
For making spatial predictions of flounder nursery areas a general-ized additive model with flounder abundance as response variable and the seven environmental predictor variables was constructed (Figure 6) The northern and eastern boundaries of the spatial mod-el were defined based on the predicted areal extent of the spawning areas of Baltic flounder (see above) combined with information on where juvenile flounder was caught in the surveys
Based on the models high probability nursery areas were de-fined as areas with a predicted abundance over 003 juvenile floun-der per square meter Potential nursery areas were defined by pre-dicted abundance levels between 00001 and 003 juvenile flounder per square meter Areas with a predicted abundance below 00001 were not defined as flounder nursery areas
267 Perch Perch (Perca fluviatilis) is a predominating species in many coastal areas of the Baltic Sea and a key species in coastal fish communities of the Northern and central Baltic Sea While young perch feed on zooplankton before they shift to feeding on benthic animals adult perch are predominantly piscivores It is a widely appreciated for rec-reational fishing but also has commercial importance for small-scale coastal fisheries The map focused on recruitment areas of perch
Perch is a species of freshwater origin and hence it spawns predominantly in freshwater tributaries and coastal areas close to freshwater outlets Along the coasts of Finland and Sweden perch can also spawn further away from freshwater outlets if there are enclosed bays which warm up early in the season (Snickars et al 2010 Bergstroumlm et al 2013 Sundblad et al 2014) In the southern Baltic Sea such as the Curonian lagoon perch spawns closer to the coast in areas where vegetation or other structures create suit-able spawning conditions (Jankevičius et al 1959 Gaigalas 2001 2011) Genetic studies and tagging studies suggest that perch has a local population structure with limited dispersal away from its recruitment area (eg Olsson et al 2011)
A regional map on recruitment areas of perch was made avail-able at the HELCOM Maps and data services during the HOLAS II project (HELCOM 2018b) when it was approved by all HEL-COM Contracting Parties in a dedicated review process The existing map was considered by HELCOM Pan Baltic Scope EFH WS 1-2018 who proposed adjustments to the areas covered in Russia and amendments to the text on data quality
268 Pikeperch
Pikeperch (Sander lucioperca) is found in coastal areas across the Baltic Sea predominantly in high-turbidity archipelago ar-eas and close to freshwater tributaries It is an appreciated spe-cies for the fisheries Adult pikeperch are piscivores The map focused on recruitment areas for pikeperch
Pikeperch is of freshwater origin It spawns predominantly close to freshwater tributaries to the Baltic Sea but also tol-erates relatively higher salinities (Ložys 2004 Lehtonen et al 1996) As pikeperch generally prefers turbid waters it is often associated with relatively more eutrophic areas (Bergstroumlm et al 2013 2019) Pikeperch shows local population structure and is assumed to show limited dispersal away from its recruitment area (Saumlisauml et al 2010) Populations are highly affected by fish-ing in many coastal areas (Lehtonen et al 1996 Mustamaumlki et al 2014)
Similar as for perch a regional map on pikeperch recruit-ment areas was made available at the HELCOM Maps and data services during the HOLAS II project The existing map was considered by HELCOM Pan Baltic Scope EFH WS 1-2018 who proposed adjustments to the areas covered in Estonia and Lith-uania and amendments to the text on data quality
27 Aggregation of data layers
An additional consideration for the purposes of maritime spa-tial planning (MSP) is that there can be a need to synthesize and combine the data for different species further to depict core areas for essential fish habitats at a general level The HELCOM Pan Baltic Scope EFH WS (HELCOM 2018a) considered the pro-duction of aggregated essential fish habitat maps for use in MSP processes and identified some key points for how such maps should preferably be developed at the Baltic Sea regional scale
Before producing aggregated maps it should be ensured that all maps to be combined are presented on a comparable scale They are preferably transformed either to representing only values between 0 and 1 or to the binominal scale (repre-senting only values 0 or 1)
It should also be ensured that the maps represent similar aspects to provide a meaningful aggregated map For exam-ple essential fish habitat maps may describe either spawning nursery habitats or some other aspect
When the maps are combined in GIS as described above the theoretical maximum value in the aggregated map is the total number of maps that are included However it should be not-ed that in reality this theoretical maximum only occurs in the rare case that all included data layers overlap spatially at least somewhere in the studied area If the aggregated map is to be used further in comparisons with other data layers the values should also be transformed to vary between 0 and 1
Figure 6 Response curves from the juvenile flounder model The generalized additive model explained 413 of the deviance in the data and the Rsup2-value was 032
15
2 Methods Essential fish habitats in the Baltic Sea Identification of potential spawning recruitment and nursery areas
The aggregated map should be supplemented with information on its seasonal relevance to recognize the fact that fish species use different habitats during different seasons In some cases seasonally comparable information is required to be able to use the aggregated map in a relevant way For other purposes information on the average situation over the year (annually representative information) is sufficient When applicable an overall aggregated map representing all essential fish habitats could be supplemented with separate aggregated maps for each quarter of the year to show differences in seasonality
When presenting the results at a Baltic scale it should be made clear that the expected number of essential fish habitats is different between different parts of the Baltic Sea due to nat-ural factors such as salinity
When using the resulting map it should be noted that an un-weighted aggregation gives equal influence to very common and less frequent species and that several potentially import-ant species of concern may risk being unconsidered if they are not represented in the underlying maps
Data limitations should be communicated stating for exam-ple if the aggregated map lacks information for some key as-pects of essential fish habitats or other data limitations
These aspects are intended as initial considerations to be developed further An illustrative example on to show these principles applied to the work presented in this document is presented in Section 39
16
3 Results Essential fish habitats in the Baltic Sea Identification of potential spawning recruitment and nursery areas
Figure 7 Potential spawning areas for cod
3 Results
The following chapter presents the resulting maps (Figures 7-14) together with background information on each of the data layers (Sections 31-38 Tables 2-9) The maps are also available at the HELCOM Maps and Data Service1
31 Potential spawning areas for cod
Cod (Gadus morhua) is represented by three stocks in the Baltic Sea Eastern Baltic Western Baltic and Kattegat cod which is reflected in the map ldquoPotential spawning areasrdquo were ini-tially delimitated based on Huumlssy (2011) In ad-dition the Gdansk deep as delineated by Bag-ge et al (1994) was included as it sometimes contributes to reproduction of Eastern Baltic cod (Hinrichsen et al 2016) The Gotland basin has ceased to contribute to the reproduction of cod (Hinrichsen et al 2016) These definitions were applied in the HOLAS II project (HELCOM 2018b) based on approval by all HELCOM Con-tracting Parties in a review process (there re-ferred to as lsquooccasional successful spawningrsquo and lsquosuccessful spawningrsquo) Following HELCOM (2018a) additional potential spawning areas were identified by environmental thresholds for egg development and survival based on sa-linity and oxygen conditions (Hinrichsen et al 2016) during 2011-2016 Separate thresholds were used for Eastern Baltic Western Baltic and Kattegat cod Areas denoted ldquohigh prob-ability spawning areasrdquo correspond to where the initial delineations (Huumlssy 2011 Bagge et al 1994) achieve the environmental threshold values (Table 2 Figure 7)
1 mapshelcomfiwebsitemapservice
17
3 Results Essential fish habitats in the Baltic Sea Identification of potential spawning recruitment and nursery areas
Species Cod (Gadus morhua)
Stocks Kattegat cod ICES subdivision 21 Western Baltic cod ICES subdivisions 22-24 Eastern Baltic cod ICES subdivisions 24 + 25-32
EFH type Potential spawning areas
Approach Literature review combined with identification of environmental window for spawning based on salinity and oxygen for Eastern Baltic cod and on salinity and depth for Western Baltic Cod and Kattegat cod
Time period 2011-2016
Data source Initial polygon data received from Karin Huumlssy DTU Aqua Denmark The method for delineating the spawning area is described in Huumlssy (2011)
Salinity and Oxygen Copernicus Marine Environment Monitoring Service SMHI The data represents monthly data for years 2011-2016 downloaded from Copernicus Marine Environment Monitoring Service (httpmarinecopernicuseu) Reanalysis products of SMHI for years 1989-2004 55km grid cells The layers represent condi-tions at the sea floor For salinity extrapolation to some coastal areas that were outside the original data due to low resolution of the grid was carried out
Depth Swedish Agency of Marine and Water Management For Metadata see SwAM (2019) p 232-236
Variables and thresholds Eastern Baltic cod Salinity gt 11 Oxygen gt 15 mlL (annual average)Western Baltic cod and Kattegat cod Salinity gt 18 Depth gt20 m
References Bagge et al (1994) Huumlssy (2011) Huumlssy et al (2012) Hinrichsen et al (2016)
Data quality The Arkona deep is functional for spawning of both the Eastern and the Western Baltic cod and in effect the defi-nition of the Arkona Basin as a high probability areas in the Arkona Basin reflect the result for Eastern Baltic cod
The effective distribution of cod spawning areas is highly dependent on the prevailing hydrological regime and the presence of spawning also depends on seasonally variable hydrographical conditions such as temperature salinity and oxygen Seasonal differences lead to a progressive spawning season towards the east typically start-ing in Kattegat and the Sound in JanuaryFebruary and ending in JulyAugust in the Bornholm area Fluctuations in temperature can delay the spawning season up to two months
It is difficult to collect egg samples to verify cod spawning as cod eggs may drift in deep areas and instead the level of ichthyoplankton is a main source for estimation of good environmental conditions for cod spawning Modelling based on ichthyoplankton should be validated by comparison with distribution of running adults to resolve the potential influence of prevailing current speed The proposed delineations are also influenced by research on the maturity of adults and histology of gonads
The adult and juvenile cod are distributed far outside of the spawning areas depicted in the map
Attribute information Raster value representing no spawning (0) potential spawning area (05) and high proba-bility spawning area (1)
Table 2 Data table for potential cod spawning areas
18
3 Results Essential fish habitats in the Baltic Sea Identification of potential spawning recruitment and nursery areas
Figure 8 Potential spawning areas for sprat
Species Sprat (Sprattus sprattus)
Stocks Sprat in subdivisions 22-32 (ICES)
EFH type Potential spawning areas
Approach Environmental envelope corrected for areas 20-40 m south of Bornholm
Time period 2011-2016
Data source Depth Baltic Sea Bathymetry database (httpdatabshcpro2518201) complemented in some coastal areas with Seifert et al (2001)
Salinity Copernicus Marine Environment Monitoring Service SMHI The data represents monthly data for years 2011-2016 downloaded from Copernicus Marine Environment Monitoring Service (httpmarinecopernicuseu) Reanal-ysis products of SMHI for years 1989-2004 55km grid cells The layers represent conditions at the sea floor Extrap-olation to some coastal areas that were outside the original data due to low resolution of the grid was carried out
Variables and thresholds Potential spawning area Depth gt 30 m Salinity gt 6 (annual average)High probability spawning area Depth gt70 m Salinity gt 6 (annual average)
References Grauman (1980) Bauman et al (2006) Voss et al (2012) HELCOM (2018a) National information from Poland
Data quality The map is based on literature and environmental variables not actual data on sprat spawning The map might overestimate the spawning area west and north of Gotland
The data layers on environmental variables are based on modelling
Attribute information Raster value representing no spawning (0) potential spawning area (05) and high proba-bility spawning area (1)
Table 3 Data table for potential sprat spawning areas
32 Potential spawning areas for sprat
Sprat (Sprattus sprattus) occurs in the entire Baltic Sea and mainly in open sea areas It is assessed as a single stock in the Baltic Sea within fisheries management Sprat eggs are pelagic and sprat spawning is well known from the deep basins in the central Baltic where it typically occurs from February to August Further north spawning starts later in the year and is less certain Recent fisher-ies surveys indicate that sprat spawning does no longer occur in the Gulf of Finland Sprat spawning areas were delineated using envi-ronmental variables due to lack of coherent field data across the Baltic Sea countries ldquoPo-tential sprat spawning areasrdquo were delineated as areas with salinity gt 6 and water depth gt 30 m but for the Arkona Basin depth gt 20 m was used (Grauman 1980 Bauman et al 2006 Voss et al 2012) ldquoHigh probability spawning areasrdquo were delineated for areas deeper than 70 m (Table 3 Figure 8)
19
3 Results Essential fish habitats in the Baltic Sea Identification of potential spawning recruitment and nursery areas
Figure 9 Potential spawning areas for herring
33 Potential spawning areas for herring
Herring (Clupea harengus) is widely distributed in the Baltic Sea and is common in all sub-ba-sins Herring feeds in the pelagic mainly on zoo-plankton and is an important prey for cod other fish and marine mammals In fisheries manage-ment herring in the Baltic Sea is sub-divided into several stocks Herring spawns in coastal areas or offshore shallows It has demersal eggs which are attached to the substrate Spawning may occur both in spring and autumn depend-ing on population but spring spawning dom-inates today Spawning areas of herring were identified by main habitat associations based on existing observations of herring spawning grounds in the Baltic Sea lsquoPotential spawning areasrsquo were delineated based on the distribu-tion of any of the following modelled photic zone photic hard bottom charophytes Fucus spp Furcellaria lumbricalis and Zostera marina several data layers were combined due to un-certainty in the coverage of some of them lsquoHigh probabilityrsquo spawning areas were identified as areas where the modelled photic zone overlaps with any of the other layers The habitat vari-ables were identified by other existing HELCOM data layers (Table 4 Figure 9)
20
3 Results Essential fish habitats in the Baltic Sea Identification of potential spawning recruitment and nursery areas
Species Herrring (Clupea harengus)
Stocks Herring in ICES subdivisions 22-24 (spring spawning) subdivisions 25-27 282 29 and 32 subdivision 281 (Gulf of Riga) subdivisions 30-31
EFH type Spawning areas
Approach Habitat associations combined with manual corrections to eastern Gulf of Finland (Neva inlet) Curonian lagoon Szczechin lagoon Vistula lagoon and German waters
Time period 2011-2016
Data source Photic zone As produced within the EU Interreg IIIB project BALANCE (HELCOM 2018c)Seabed sediments ndash Photic hard bottom Benthic biotope complexes in the Baltic Sea based on a combination of geolog-ical sediment data from the EU Interreg IIIB project BALANCE and light availability data from EUSeaMap (HELCOM 2018)
Charophyte distribution HOLAS II Dataset ldquoCharophyte distributionrdquo (HELCOM 2018d) representing the distribu-tion of charophytes (Chara spp Nitella spp Nitellopsis spp Tolypella spp) mainly based on data submission by HELCOM contracting parties Submitted point data were originally gathered in national mapping and monitoring campaigns or for scientific research Scientific publications were used to complement the data for the Curonian Vistula and Szczechin lagoons Polygon data from Poland was digitized based on the Polish Marine Atlas From Estonian waters a predictive model was used (200m resolution) which was converted to presenceabsence us-ing minimized difference threshold criteria All data (point polygon and the raster presenting predicted presence of charophytes) were generalized to 5km x 5km grid cells
Fucus speciesrsquo distribution HOLAS II Dataset ldquoFucus distributionrdquo (HELCOM 2018d) based on data submission by HELCOM contracting parties Mainly pointwise occurrences of Fucus were submitted as originally gathered in na-tional mapping and monitoring campaigns or for scientific research From Estonian waters a predictive model was used (200m resolution) that was converted to presenceabsence using minimized difference threshold criteria All data (point and the raster presenting predicted presence of Fucus) were generalized to 5km x 5km grid cells
Furcellaria lumbricalis distribution HOLAS II Dataset ldquoFurcellaria lumbricalis distributionrdquo (HELCOM 2018d) based on data submission by HELCOM contracting parties Mainly pointwise occurrences of Furcellaria were submitted originally gathered in national mapping and monitoring campaigns or for scientific research From Estonian waters a predictive model was used (200m resolution) that was converted to presenceabsence us-ing minimized difference threshold criteria For Poland only confirmed occurrence of Furcellaria was included (Slupsk bank Rowy reef and reef at Orlowo cliff) All data (point and the raster presenting predicted presence of Furcellaria) were generalized to 5km x 5km grid cells
Zostera marina distribution HELCOM HOLAS II Dataset ldquoZostera marina distributionrdquo (2018d) The data was based on data submission by HELCOM contracting parties Mainly pointwise occurrences of eelgrass were submitted originally gathered in national mapping and monitoring campaigns or for scientific research Polygon data from Puck Bay (Poland) was digitized based on Polish Marine Atlas and Orlowo cliff area was added based on expert knowledge From Estonian waters a predictive model was used (200m resolution) that was converted to pres-enceabsence using minimized difference threshold criteria All data (point polygon and the raster presenting predicted presence of eelgrass in the Estonian waters) were generalized to 5km x 5km grid cells
Variables and thresholds Distribution of Photic zone Photic hard bottom Charophytes Fucus spp Furcellaria lumbricalis Zostera marinaThe resulting data layer was corrected by removing recruitment areas in eastern Gulf of Finland (Neva inlet) Curonian lagoon Szczechin lagoon and enhancing that of the Vistula lagoon
References HELCOM (2018c 2018d) Kanstinger et al (2018) Popiel (1984) Strzyżewska (1969) Fey (2001) Fey et al (2014a 2014b) Krasovskaya (2002)
Data quality The data layer is mainly developed based on main habitat associations as identified from scientific literature not actual data on herring spawning
The delineations are based on other data layers (benthic and habitat-related ecosystem components) for which mapping is not exhaustive and sampling density may vary between countries Underlying data layers on vege-tation (Fucus Furcellaria charophytes Zostera) are based on inventory data and species distribution models Information on the distribution of Furcellaria is lacking from Russia
Herring preferably spawns in shallow areas However the layer does not include depth as a variable as some known spawning areas offshore would not be included if the depth restriction is used Due to constraints in the resolution of the underlying data layer the map also identifies areas shallower than one meter as potential spawning areas of Baltic herring However spawning of Baltic herring does not usually occur in such shallow depth
The map represents potential spawning areas In addition behavioral components and hydrographic factors in-fluence on the actual chose of spawning site at a certain occasion Due to these constraints the data layer on Baltic herring spawning habitats should be considered as a rough estimation
Attribute information Raster value representing no spawning (0) potential spawning area (05) and high proba-bility spawning area (1)
Table 4 Data table for potential herring spawning areas
21
3 Results Essential fish habitats in the Baltic Sea Identification of potential spawning recruitment and nursery areas
Figure 10 Potential spawning areas for European flounder
34 Potential spawning areas for European flounder
European flounder (Platichthys flesus) is a key species in many coastal areas of the Baltic Sea mainly in the central and southern sub-basins Adults feed in shallow coastal areas during summer and move out to deeper areas in win-ter where the spawning takes place in spring European flounder spawns above the sea floor in deep water in areas with sufficiently high sa-linity for fertilization and pelagic egg develop-ment lsquoPotential spawning areasrsquo were initially delineated by a species distribution model (Orio et al 2017) developed based on years 1993-1997 to consider a period with relative-ly better oxygen conditions but applied with more recent data (2011-2014) The area was further delineated to encompass only areas deeper than 30 m in order to represent pelagic spawning habitat lsquoHigh probability spawning areasrsquo were identified as the sub-section en-compassing salinity gt 10 It should be noted that flounders in the Baltic Sea were recently separated into two species and that spawning areas of the Baltic flounder (Platichthys solem-dali) are described separately The two data layers do not overlap and can be combined to obtain a map on spawning areas for both floun-der species taken together (Table 5 Figure 10)
22
3 Results Essential fish habitats in the Baltic Sea Identification of potential spawning recruitment and nursery areas
Species European flounder (Platichthys flesus)
Stocks ICES identifies two stocks of European flounder in the Baltic Sea ICES subdivisions 22-23 (Belt Sea and the Sound) and 24-25 (West of Bornholm and Southern Central Baltic Sea)
EFH type Spawning areas
Approach Species distribution modelling combined with identification of environmental salinity window and depth conditions for spawning
Time period 2011-2014
Data source Model results from Orio et al 2017a
Depth Baltic Sea Bathymetry database (httpdatabshcpro2518201 ) complemented in some coastal areas with IOW bathymetry data (Seifert et al 2001)
Salinity Copernicus Marine Environment Monitoring Service SMHI The data represents monthly data for years 2011-2014 downloaded from Copernicus Marine Environment Monitoring Service (httpmarinecopernicuseu) Reanalysis prod-ucts of SMHI for years 1989-2004 55km grid cells The layers represent conditions at the sea floor Extrapolation to some coastal areas that were outside the original data due to low resolution of the grid
Variables and thresholds Depth gt 30 m Salinity gt 10
References Orio et al (2017a) Momigliano et al (2018) Nissling et al (2002)
Data quality The data layer is based on species distribution modelling focusing on mature flounder at the spawning stage and should be considered a rough estimation
The data layers on environmental variables are based on modelling Other variables than those tested in the model may also be influential
The studies from which the thresholds values for environmental variables have been obtained are based on pub-lications conducted before the separation of Baltic flounder from European flounder but have taken the specific characteristics of the separate spawning ecotypes into account
Note the map on European flounder spawning areas is currently missing information for the western Baltic Sea including the Kattegat
Attribute information Raster value representing no spawning (0) potential spawning area (05) and high proba-bility spawning area (1)
Table 5 Data table for potential European flounder spawning areas
23
3 Results Essential fish habitats in the Baltic Sea Identification of potential spawning recruitment and nursery areas
Species Baltic flounder (Platichthys solemdali)
Stocks ICES identifies two stocks of Baltic flounder ICES subdivisions 26 28 (East of Gotland and Gulf of Gdansk) and 27 29-32 (Northern Central Baltic Sea and Northern Baltic Sea)
EFH type Spawning areas
Approach Species distribution modelling combined with identification of environmental salinity window and depth condi-tions for spawning supplemented with additional information from monitoring in Estonian waters
Time period 2011-2014
Data source Model results from Orio et al (2017a)
Depth Baltic Sea Bathymetry database (httpdatabshcpro2518201 ) complemented in some coastal ar-eas with IOW bathymetry data (Seifert et al 2001)
Salinity Copernicus Marine Environment Monitoring Service SMHI The data represents monthly means of May for years 2011-2014 (httpmarinecopernicuseu) Reanalysis products of SMHI for years 1989-2004 55km grid cells The layers represent conditions at the sea floor Extrapolation to some coastal areas that were outside the original data due to low resolution of the grid
Variables and thresholds Depth lt 30 m Salinity gt 6
References Orio et al (2017) Momigliano et al (2018) Nissling et al (2002)
Data quality The data layer is based on species distribution modelling focusing on mature flounder at the spawning stage and should be considered a rough estimation
The data layers on environmental variables are based on modelling Other variables than those tested in the model may also be influential
The studies from which the thresholds values for environmental variables have been obtained are based on pub-lications conducted before the separation of Baltic flounder from European flounder but have taken the specific characteristics of the separate spawning ecotypes into account
Attribute information Raster value representing no spawning (0) potential spawning area (05) and high proba-bility spawning area (1)
Table 6 Data table for potential Baltic flounder spawning areas
Figure 11 Potential spawning areas for Baltic flounder
35 Potential spawning areas for Baltic flounder
Baltic flounder (Platichthys solemdali) is a key species in many coastal areas of the Baltic Sea It is the only endemic fish spe-cies of the Baltic Sea Baltic flounder spawns in shallow coastal areas and on offshore banks with eggs developing on the sea floor Successful spawning may be expected at salinities down to around 5-7 (Nissling et al 2002) lsquoPotential spawning areasrsquo were initially delineated by a species distribution model (Orio et al 2017) developed based on years 1993-1997 to consider a period with relatively better oxygen conditions but applied with more recent data (2011-2014) The area was further delin-eated to encompass only areas shallower than 30 m in order to represent the demersal spawning habitat lsquoHigh probability spawning areasrsquo were identified as the sub-section encompass-ing salinity gt 6 It should be noted that flounders in the Baltic Sea were recently separated into two species and that spawn-ing areas of the European flounder (Platichthys flesus) are de-scribed separately The two data layers do not overlap and can be combined to obtain a map on spawning areas for both floun-der species taken together (Table 6 Figure 11)
24
3 Results Essential fish habitats in the Baltic Sea Identification of potential spawning recruitment and nursery areas
Figure 12 Potential nursery areas for European and Baltic flounder
36 Potential nursery areas for flounders
The two flounder species in the Baltic Sea (Pla-tichthys flesus and P solemdali) have different reproductive strategies spawning in the pelag-ic and in shallow waters respectively However they utilize the same type nursery habitat For both species young of the year are found on shallow bottoms from June to September pri-marily on sandy substrates Flounder nursery areas were predicted by a generalized additive model with flounder abundance as response variable and seven map-based predictor vari-ables The model was based on data from avail-able surveys of juvenile flounder in the Baltic Sea compiled within the Pan Baltic Scope proj-ect To represent the nursery season and the current situation only results from surveys per-formed in June-September during 2004-2018 were used resulting in totally 2114 samples All abundance estimates were harmonized to numbers of juvenile flounder per square meter Values for the predictor variables were extract-ed for each sampling point in GIS The follow-ing environmental variables were used salin-ity wave exposure water depth slope of the bottom surface temperature bottom currents and distance to high probability spawning area for European flounder (Table 7 Figure 12)
25
3 Results Essential fish habitats in the Baltic Sea Identification of potential spawning recruitment and nursery areas
Species Baltic flounder (Platichthys solemdali) and European flounder (Platichthys flesus)
Stock Baltic flounder ICES subdivisions 26 28 (East of Gotland and Gulf of Gdansk) and 27 29-32 (Northern Central Baltic Sea and Northern Baltic Sea) European flounder ICES subdivisions 22-23 (Belt Sea and the Sound) and 24-25 (West of Bornholm and Southern Central Baltic Sea)
EFH type Nursery areas
Approach Species distribution modelling
Time period 2004-2018
Data source Model results as described in Chapter 2 of this report
Salinity Monthly means in March-May from 2014-2016 for salinity at the seafloor within a 600 m radius from the sam-pling point Extracted from the hydrodynamic Baltic Sea Ice-Ocean Model (BSIOM Lehmann et al 2002)
Wave exposure Log transformed wave impact index calculated for the whole Baltic Sea (Isaeligus 2004)
Depth Mean water depth within a 600 m radius from sampling point according to the Baltic Sea Bathymetry database (httpdatabshcpro2518201)
Slope Mean slope within a 600 m radius from sampling point based on data produced within the EU Interreg IIIB project BALANCE (HELCOM 2018)
Surface temperature Monthly means of June-September for years 2016-2018 downloaded from Copernicus Marine En-vironment Monitoring Service (httpmarinecopernicuseu ) The data is from the HBM model produced by the Danish Meteorological Institute (DMI httpoceandmidkmodelshbmukphp)
Bottom currents Mean bottom current velocity within a 600 m radius from sampling point based on data produced within the EU Interreg IIIB project BALANCE (HELCOM 2018)
Distance to high probability spawning area for European flounder as shown in section 34 of this report
Variables and thresh-olds
High probability nursery areas represent areas with a predicted abundance gt 003 juvenile floundermsup2 based on the applied data sets and model Potential nursery areas represent predicted abundance levels between 00001 and 003 juvenile floundermsup2 Areas with a predicted abundance lt 00001 juvenile floundersmsup2 are defined as not being flounder nursery areas
Reference This report chapter 2
Data quality Data on juvenile flounder abundances to support the spatial model is missing from Denmark Germany Poland and Rus-sia Predictions are uncertain in these areas and especially along the south coast of the Baltic Sea
The mix of data from different years months and gear types may have contributed to increasing the variability in the dataset even though a relatively high deviance explained by the model (41) shows that it has predictive power
The spatial resolution of the predictor variables varies between 200 m and 2 km which gives coarse predictions locally even though values are representative at an overall regional scale
The prediction is limited by a lack of accurate spatial information on surface sediments Sandy substrates are well known as important flounder nursery habitats Unfortunately the only available sediment map on a Baltic Sea wide scale was too inaccurate for shallow waters where juvenile flounder occurs and was therefore excluded from the model
The map on flounder nursery areas does not make assumptions on species identity in any area
Attribute information Raster value representing no nursery area (0) potential nursery area (05) and high probability nursery area (1)
Table 7 Data table for potential flounder nursery areas
26
3 Results Essential fish habitats in the Baltic Sea Identification of potential spawning recruitment and nursery areas
Figure 13 Potential recruitment areas for perch
37 Potential recruitment areas for perch
Perch (Perca fluviatilis) is a key species in many Baltic coastal areas It is of freshwater origin and spawns predominantly in freshwater tributaries close to the coastline or in enclosed bays Spe-cies distribution modelling have shown the im-portance of suitable environmental conditions for perch reproduction Young perch has limited dispersal from its spawning area and tagging studies have shown that most (50-95 of the re-captures of perch are made up to 20 km from tag-ging site in the Baltic Sea (Johnsson 1978 Boumlhling and Lehtonen 1985 Veneranta et al 2020 Saks et al 2020) Due to lack of coherent data on perch spawning and nursery areas across the Baltic Sea countries environmental variables were used in delineating potential recruitment areas for perch The map was originally developed within the HOLAS II project (HELCOM 2018b) when it was approved by all HELCOM Contracting Parties in a dedicated review process Potential perch recruit-ment areas were delineated as areas with suitable condition of depth wave exposure and salinity Thresholds were obtained from literature and se-lected to rather overestimate than underestimate the recruitment area For the Finnish coastline a national model was used The map was subse-quently considered by the Pan Baltic Scope proj-ect who proposed adjustments to thresholds for some areas in Russian waters and corrections to Estonian and German waters (Table 8 Figure 13)
27
3 Results Essential fish habitats in the Baltic Sea Identification of potential spawning recruitment and nursery areas
Species Perch (Perca fluviatilis)
Stock Several undefined
EFH type Recruitment areas
Approach Environmental window national modelling approach in Finnish waters supplemented with corrections to Estonian Ger-man and Russian waters based on national validation with monitoring data
Time period 2011-2014
Data sources Depth Baltic Sea Bathymetry database (httpdatabshcpro2518201) complemented in some coastal areas with IOW bathymetry data (Seifert et al 2001)
Wave exposure Wave Impact Index calculated for the whole Baltic Sea (Isaeligus 2004)
Salinity Monthly means of May for years 2011-2014 downloaded from Copernicus Marine Environment Monitoring Service (httpmarinecopernicuseu ) Reanalysis products of SMHI for years 1989-2004 55km grid cells A May mean for 2011-2014 was calculated Extrapolation to some coastal areas that were outside the original data due to low resolution of the grid
National model for Finnish waters generalized to 1x1 km grid (Kallasvuo et al 2017)
Variables and thresh-olds
Depth lt 4 m (for Danish waters lt 3 m)
Logged exposure lt 5 (For Koporo Bay and Narva Bay in Russian waters lt 523)
Salinity lt 10
Based on the model for the Finnish coastline perch recruitment areas were defined as Unsuitable for reproduction P(-catch larvae) lt 05 Suitable for reproduction P(catch larvae) gt 05 Important for reproduction the smallest area where the expected cumulative larval abundance is 80 of the total expected abundance over study area
References Snickars et al (2010) Bergstroumlm et al (2013) Skovrind et al (2013) Sundblad et al (2014) Kallasvuo et al (2017) HEL-COM (2018a) this report
Comments and data quality
Recruitment area here refers to essential habitats for young of the year perch (based on inventory data from spawning until the end of the first summer) The map is based on literature and environmental variables derived from inventory data The species distribution modelling studies where the thresholds values for environmental variables have been obtained are from the northern Baltic Sea Here the same thresholds have been applied in the southern Baltic Also the data layers on environmental variables are based on modelling Due to these constraints the data layer should be considered as a rough estimation
Attribute information Raster value representing the potential occurrence of perch recruitment area (either 0 or 1)
Table 8 Data table for potential perch recruitment areas
28
3 Results Essential fish habitats in the Baltic Sea Identification of potential spawning recruitment and nursery areas
38 Potential recruitment areas for pikeperch
Pikeperch (Sander lucioperca) is a species of fresh-water origin which spawns predominantly in freshwater tributaries and has a relatively limited dispersal away from its recruitment area Species distribution modelling studies have shown the importance of suitable environmental conditions for pikeperch recruitment Due to lack of coherent data on pikeperch spawning and nursery areas across the Baltic Sea countries the distribution of pikeperch recruitment areas was delineated based on areas with suitable conditions of depth wave exposure salinity water transparency (Sec-chi depth) and distance to deeper (10 m) waters The threshold values were obtained from litera-ture Temperature although important for pike-perch was left out due to high variation in timing of suitable spawning temperatures across the Baltic Sea The map on pikeperch recruitment areas was originally developed within the HOLAS II project (HELCOM 2018b) when it was approved by all HELCOM Contracting Parties in a dedicated review process after correction to Swedish wa-ters The map was subsequently considered by the Pan Baltic Scope project who proposed ad-justments to Estonian German Lithuanian and Polish waters (Table 9 Figure 14) Figure 14 Potential recruitment areas of pikeperch
29
3 Results Essential fish habitats in the Baltic Sea Identification of potential spawning recruitment and nursery areas
Species Pikeperch (Sander lucioperca)
Stock Several undefined
EFH type Recruitment areas
Approach Environmental window with national approach for Finnish waters selected data points corrected for Estonian German Lithua-nian Polish and Swedish waters
Time period 2011-2014
Data source Depth Baltic Sea Bathymetry database (httpdatabshcpro2518201) complemented in some coastal areas with IOW ba-thymetry data (Seifert et al 2001)
Wave exposure Wave Impact Index calculated for the whole Baltic Sea (Isaeligus 2004)
Salinity Monthly means of May for years 2011-2014 downloaded from Copernicus Marine Environment Monitoring Service (httpmarinecopernicuseu ) Reanalysis products of SMHI for years 1989-2004 55km grid cells A May mean for 2011-2014 was calculated Extrapolation to some coastal areas that were outside the original data due to low resolution of the grid
Secchi depth Satellite based (MERIS) composite layer of May 2011 kindly provided by Krista Alikas at Tartu Observatory Estonia (Alikas and Kratzer 2017)
National model for Finnish waters generalized to 1x1 km grid (Kallasvuo et al 2017)
Variables and thresh-olds
Depth lt 5 m
Logged exposure lt 5
Salinity lt 7
Secchi depth lt 2
Distance to deep (10m) water lt 4km
Based on the model for the Finnish coastline pikeperch recruitment areas were defined as Unsuitable for reproduction P(catch larvae) lt 05 Suitable for reproduction P(catch larvae) gt 05 Important for reproduction the smallest area where the expected cumulative larval abundance is 80 of the total expected abundance over study area
References Veneranta et al (2011) Bergstroumlm et al (2013) Sundblad et al (2014) Kallasvuo et al (2017) Gunnartz et al (2011) (HEL-COM 2018b) this report
Comments and data quality
Recruitment area here refers to essential habitats for young of the year pikeperch (based on inventory data from spawning until the end of the first summer) The map is based on literature and environmental variables derived from inventory data The species distribution modelling studies where the thresholds values for environmental variables have been obtained are from the northern Baltic Sea Also the data layers on environmental variables are based on modelling Here same thresholds have been applied in the southern Baltic Due to these constraints the data layer should be considered as a rough estimation
In addition temperature is important for pikeperch recruitment but was not included as a delineating variable due to high variation in timing
The data layer may underestimate pikeperch in Finnish waters with respect to habitats for young of the year pikeperch as it focused on newly-hatched larvae when the dispersal is more limited compared to later in the season
Attribute information Raster value representing the potential occurrence of pikeperch reproduction area (either 0 or 1)
Table 9 Data table for potential pikeperch recruitment areas
30
3 Results Essential fish habitats in the Baltic Sea Identification of potential spawning recruitment and nursery areas
Figure 15 Aggregate essential fish habitat map with data layers for the seven different species (Figures 7-14) stacked on top of each other The data layer on flounder nursery areas is only included where it does not overlap with any of the layers on flounder spawning areas in order to not double-count results for the same species However it should be noted that the aggregated map is not representative for essential fish habitats in the whole Baltic Sea area as information on some additionally important species and life stages are still missing Most importantly information on spawning areas of European flounder is lacking West of the Arkona Basin Also information on sole which would be relevant for this areas is missing Kattegat holds essential fish habitats for several species that are not included here Uncertainties in relation to each of the included data layers are presented in tables 2-9
39 Aggregated map
Figure 15 shows an aggregated map in which all data layers presented in figures 7-14 are added to each other with equal weight to each layer The data layer on flounder nursery areas (Fig-ure 12) is only included where it does not over-lap with spawning areas for European flounder or Baltic flounder (Figures 10-11) in order to not double-count habitats for the same species
The aggregated map has a maximum val-ue of four which occurs in some coastal areas where spawningrecruitment areas for herring Baltic flounder perch and pikeperch overlap In addition the importance of deep areas of the southern Baltic Sea for spawning of cod sprat and European flounder is clearly seen
As the aggregate map (Figure 15) is limited to the available data layers it is not completely representative of the region The most evident gaps occur West of the Arkona Basin for exam-ple information on spawning areas of European flounder is missing from these areas Impor-tantly several other species are also relevant West of the Arkona Basin but are not included in this report for example sole (Solea solea) but also turbot (Scophthalmus maximus) and plaice (Pleuronectes platessa) This information should be added in order for the aggregated map to be relevant also for this area (See also Chapter 4 for a discussion on this)
In the coastal zone generally a delineation of nursery areas for cod is missing but would be important for a more complete picture The possibility to develop such as map was consid-ered by HELCOM (2018a) but was not consid-ered feasible at the Baltic Sea scale based on available data at the time
31
4 Discussion Essential fish habitats in the Baltic Sea Identification of potential spawning recruitment and nursery areas
4 Discussion
41 Potential uses of the maps - MSP environmental management and green infrastructure
Spatial information on distribution of species and habitats is import-ant to support various aspects of marine management It is needed for example in maritime spatial planning (MSP) where national plans have to ensure that ecosystem considerations the potential vulnera-bility of species and habitats to pressures from human activities are taken into account (eg EC 2014 Kraufvelin et al 2018) Maps on the distribution of species and habitats are also used in spatial assess-ment of cumulative impacts (HELCOM 2018d Bergstroumlm et al 2019) These maps are important for identifying areas that are subject to high levels of pressures and may need priority in conservation or en-vironmental management actions This report contributes to these needs by identifying areas of potential key importance for fish
The maps which are presented here have also been initially includ-ed in a suggested approach for mapping green infrastructure in the Baltic Sea developed within the Pan Baltic Scope project (Ruskule et al 2019) Green infrastructure is still an emerging concept especially in marine environments but is seen as a promising tool to support ecosystem-based management and spatial planning (See for exam-ple Liquete et al 2015) The purpose is to help identify areas which are essential for ensuring the resilience of the marine ecosystem and the delivery of a wide range of ecosystem services hence contributing to human well-being In MSP green infrastructure can identify structures of ecological importance from a landscape perspective which might not be included in networks of legally protected areas hence high-lighting additional aspects of importance
Ruskule et al (2019) suggested a matrix approach for identifying ecosystem components of key importance for ecosystem services and ecological value The approach also encompassed the maps on essential fish habitats presented here (see also Bergstroumlm et al 2019 Miloš and Bergstroumlm 2019) However further efforts are needed to complete the work especially in the area of developing spatial data of adequate quality (Ruskule et al 2019) Also the work developed so far is focused on essential habitats but does not consider feeding areas migration corridors or aspects of connectivity among populations which are other important component of green infrastructure both on land and at sea (Liquete et al 2015)
Some further development needs specifically with respect to es-sential fish habitats are presented below
42 Suggestions for the further development of the essential fish habitats concept
This report presents maps on selected potential spawning recruit-ment and nursery areas for seven fish species in the Baltic Sea Hence the maps show information for a subset of all species that are actually present and are focused on selected life stages Our general inventory of data availability (Chapter 2) showed
that data to support the mapping of spawning recruitment and nursery areas for fish in the Baltic Sea has been greatly improved by recent national and joint Baltic projects but that sufficient data is still lacking for many parts of the Baltic Sea and selected species In particular coastal areas lack data The maps presented here represent the best available information at a coherent Baltic Sea regional scale at their time of devel-opment A recommended long-term aim would be to obtain regional maps on relevant essential fish habitats for all widely distributed fish species in the Baltic Sea considering at least spawning and nursery areas
To give a fuller representation of essential fish habitats one should especially include more information for species in coastal areas and in the western Baltic Sea One should also consider additional life stages for some of the included species since both spawning nursery feeding and migration areas are potential essential fish habitats The availability and quality of juvenile feeding areas may be particularly important as they directly influence juvenile growth and survival and thereby the level of recruitment to adult populations
Some information on juvenile (and adult) habitats is already available for the Baltic Sea regions but was not considered de-veloped enough to form the basis of maps at the regional scale However the possibilities to model important areas for juvenile cod should be considered as a next step In addition account-ing for the spatio-temporal dynamics of essential fish habitats would be of relevance as many fish are highly dependent on prevailing temperature oxygen and salinity regimes (see for ex-ample Hinrichsen et al 2017a) With respect to species additions it would be particularly important to include maps on sole and on other flatfishes with respect to the distribution of spawning areas of these west of the Arkona Basin Furthermore once hab-itats of different life-history stages for any given species have been adequately mapped the degree of connectivity between them is also of key importance (Brown et al 2019) Knowledge on migration between essential fish habitats will help to identify potential population sinks and sources increasing the relevant information available to planners and decision makers
A novelty in this report was possible due to the fact that flounder of the Baltic Sea was recently separated into two dis-tinct species with Baltic flounder being identified as endemic to the region Even though the presence of two distinct floun-der species was only recently documented (Momigliano et al 2017) the presence of types of flounder in the Baltic Sea has been long known to research (eg Solemdal 1967 Nissling et al 2002) Based on information from previous studies on eco-typic differences between the different types of flounder and based on recommendations from experts on flounder ecology in the region separate maps for potential spawning areas of European and Baltic flounders were developed (Figures 10-11) The main difference between the species is the genetics and the reproductive characteristics such as spawning behavior and
32
4 Discussion Essential fish habitats in the Baltic Sea Identification of potential spawning recruitment and nursery areas
morphological and functional differences in the eggs and sperm As the two species are morphologically similar their nursery areas could not be separated and the map of flounder nursery areas is representative of both flounder species taken together There is cur-rently no evidence that the nursery area characteristics would differ between the two species nor reason to expect this The main envi-ronmental variable contributing to the potential of an area for being a nursery for either Baltic or European flounder is the larval supply which is related to the level of connectivity between a potential nursery and the spawning area The effective connectivity again is affected by distance and transport mediating currents A suggestion how to combine information for the different flounder maps if this is wanted was presented in Section 39
43 Data quality aspects
The maps were developed based on indirect or modelling ap-proaches since direct inventory data was not available in a com-parable way across the region for any of the species Over time it would be important to enhance the base of knowledge and data that the maps are based on hence to improve their quality reliabil-ity and utility It should be appreciated that the maps are in most cases a rough representation that enables comparisons at the rela-tively coarse regional scale If the maps are applied at the national or local scale they would benefit from being complemented with more detailed information when available The quality aspects for each of the separate maps is presented in Chapter 3
We foresee that modelling approaches will continue to be important for producing large scale spatial information but em-phasize that inventory data from mapping efforts are still key both for building such models and for validating them To sup-port the development better mechanistic understanding on the required environmental conditions for certain life stages is also of high importance as well the availability and quality of spatial data on important environmental variables such as salinity and depth While important across the range of the Baltic many very coastal areas suffer from a lack of fish monitoring effort which is required to inform these distribution models and reduce their uncertainty Another common aspect is that for all maps that use hydrological model output these estimates are quite inaccurate close to the coast This becomes very important when consid-ering a very coastal habitat such as for example juvenile flatfish and herring spawning
For particular species the lack of direct inventory data on herring spawning was a restriction to providing more detailed maps on her-ring spawning areas It would also be important to resolve present uncertainties in the distribution of spawning areas of sprat towards the northern Baltic Sea With respect to environmental variables the mapping is additionally challenged by the fact that spawning of many species is strongly influenced by temperature which varies between years and is tightly coupled to climate change
44 Implications for application
The presented maps are referred to as ldquopotential habitatsrdquo as they are generally based on indirect information rather than on actual observations to verify that the habitat is actually
functional and to what level As a general way to account for data restrictions in their spatial delineation Planque et al (2007) classified fish habitats into potential habitats realized habitats and effective habitats By their definitions ldquopotential habitatsrdquo include areas were water masses or substrates can uphold a particular function during a particular life stage or pe-riod of time (for example based on known environmental con-straints) as opposed to ldquorealized habitatsrdquo which have proven to actually inhabit the fish during that life stage (for example based on sampling showing that fish eggs are present) Last ldquoeffective habitatsrdquo are those areas which are seen to support the highest densities or have the highest relative contribution to the population
Comparing the different maps presented in this report the maps which are based on spatial distribution models are likely more accurate in the sense that they are closer to the concept of realized habitats compared to those which are developed based on environmental envelopes One way to further eval-uate the maps of ldquopotentialrdquo essential fish habitats would be to compare them systematically with corresponding informa-tion on ldquorealized habitatsrdquo where available Such an evaluation could help identify to what extent they represent functional habitats and to what extent they represent habitats that are suitable according to natural environmental conditions but may not be functional due to other factors such as impacts of human activity or poor connectivity It would also be important to generally move from maps based on environmental enve-lopes to maps based on statistical models
In some further applications of the maps for example if they are used to resolve spatial uses the concept of ldquoeffective habi-tatsrdquo may be more useful as it can more precisely identify areas of currently highest value for fish andor fisheries On the other hand the concept of ldquopotential usesrdquo may be more adequate to identify areas where measures to reduce pressure may be needed Focusing on only ldquoeffective habitatsrdquo could bring the risk that in a degraded environment only those few habitats left are addressed or protected while improving an already poor situation would require the reestablishment also of other potential habitats to eventually become effective ones
45 How to consider future changes
Fish populations are often highly dynamic Most evidently their spawning success and individual growth are often tightly coupled to variability in climate-related factors such as tem-perature and salinity and these factors may also influence on the suitability of potential essential fish habitats over different seasons and years (see for example Hinrichsen et al 2017a) In addition human pressures such as overfishing physical modi-fication of habitats and elevated oxygen consumption related to eutrophication lead to changes over time in both the quality of fish habitats and the size of populations that can make use of these A key area for future development is to develop a stron-ger understanding on how the current distribution of function-al essential fish habitat is affected by human activities and how to improve management in these situations These needs are even more emphasized by climate change which is expected to have dramatic influence on the distribution of fish and fish habitats in the future
33
4 Discussion Essential fish habitats in the Baltic Sea Identification of potential spawning recruitment and nursery areas
5 Acknowledgements
The work was carried out as part of the EU co-funded Pan Baltic Scope project (2018-2019) which overall aim was to support a co-herent maritime spatial planning among countries in the Baltic Sea region furthering the implementation of an ecosystem-based ap-proach The resulting maps were produced as a joint activity of the Pan Baltic Scope project and HELCOM to incorporate currently avail-able knowledge in the Baltic Sea region at the time of the project
34
5 References Essential fish habitats in the Baltic Sea Identification of potential spawning recruitment and nursery areas
6 References
Al-Hamdani Z and J Reker (2007) Towards marine landscapes in the Baltic Sea BALANCE Interim Report No 10 httpbalance-euorg
Alikas K and Kratzer S (2017) Improved retrieval of Secchi depth for optically-complex waters using remote sensing data Ecological Indi-cators 77 218-227
Aneer G (1989) Herring (Clupea harengus L) spawning and spawning ground characteristics in the Baltic Sea Fisheries Research 8169-195
Aneer G and S Nellbring (1982) A SCUBA-diving investigation of Bal-tic herring (Clupea harengus membras L) spawning grounds in the Askouml-Landsort area northern Baltic proper Journal of Fish Biology 21433-442
Aneer G G Florell U Kautsky S Nellbring and L Sjoumlstedt (1983) In situ observations of Baltic herring (Clupea harengus membras L) spawn-ing behaviour in the Askouml-Landsort area Northern Baltic proper Ma-rine Biology 74105-110
Bagge O F Thurow E Steffensen and J Bay (1994) The Baltic cod Dana 101-28
Baltic Scope (2017) Recommendations on maritime spatial plan-ning across borders httpwwwbalticscopeeucontentup-loads201507BalticScope_OverallRecomendations_EN_WWWpdf
Baumann H H Hinrichsen C Mollmann F Koster A Malzahn and A Temming (2006) Recruitment variability in Baltic Sea sprat (Sprattus sprattus) in tightly coupled to temperature and transport patterns af-fecting the larval and early juvenile stages Canadian Journal of Fish-eries and Aquatic Science 632191-2201
Bartolino V M Cardinale H Svedaumlng HW Linderholm M Casini and A Grimwall (2012) Historical spatiotemporal dynamics of eastern North Sea cod Canadian Journal of Fisheries and Aquatic Sciences 69833-841
Beck MW KL Heck KW Able DL Childers DB Eggleston BM Gilland-ers B Halpern CG Hays K Hoshino TJ Minello RJ Orth PF Sheridan and MP Weinstein (2001) The identification conservation and man-agement of estuarine and marine nurseries for fish and invertebrates BioScience 51633-641
Bergstroumlm L S Korpinen U Bergstroumlm and Aring Andersson (2007) Es-sential fish habitats and fish migration patterns in the North-ern Baltic Sea BALANCE Interim Report No 29 httpbalance-euorg
Bergstroumlm L M Karlsson U Bergstroumlm L Pihl and P Kraufvelin (2019) Relative impacts of fishing and eutrophication on coastal fish as-sessed by comparing a no-take area with an environmental gradient Ambio 48 565-579
Bergstroumlm L A Miloš J Haapaniemi CR Saha P Arndt J Schmidt-bauer-Crona J Kotta J Kaitaranta S Husa J Palsson M Pohja-Mykrauml A Ruskule M Matczak S Strake A Zych A Nummela M Wesolowska and G Carneiro (2019) Cumulative Impact Assessment for Maritime Spatial Planning in the Baltic Sea Region Pan Baltic Scope wwwpanbalticscopeeu
Bergstroumlm U G Sundblad A-L Downie M Snickars C Bostroumlm and M Lindegarth (2013) Evaluating eutrophication management scenarios in the Baltic Sea using species distribution modelling Journal of Ap-plied Ecology 50680-690
Bleil M and R Oeberst (2005) The potential fecundity of cod in the Baltic Sea from 1993 to 1999 Journal of Applied Ichthyology 2119ndash27
Bleil M R Oeberst and P Urrutia (2009) Seasonal maturity develop-ment of Baltic cod in different spawning areas importance of the Arkona Sea for the summer spawning stock Journal of Applied Ich-thyology 2510ndash17
Boumlhling P and H Lehtonen (1985) Effect of environmental factors on migrations of perch (Perca fluviatilis) tagged in the coastal waters of Finland Finnish Fisheries Research 5 31-40
Bonsdorff E and A Norkko (1994) Flounder (Platichthys flesus) spawning in Finnish coastal waters Memoranda Societas pro Fauna et Flora Fennica 7030-31
Boumlrjesson P P Jonsson S Pacariz G Bjoumlrk MI Taylor and H Svedaumlng (2013) Spawning of Kattegat cod (Gadus morhua) Mapping spatial distribution by egg surveys Fisheries Research 14763-71
Brown EJ P Reis-Santos BM Gillanders and JG Stoslashttrup (2019) Juvenile fish habitat across the inner Danish waters Using otolith chemistry to discriminate between hybridising con-familials and contiguous coastal habitat Estuarine Coastal and Shelf Science 220 111ndash119
Carl JD CR Sparrevohn H Nicolajsen and JG Stoslashttrup (2008) Sub-stratum selection by juvenile flounder Platichthys flesus (L) effect of ephemeral filamentous macroalgae Journal of Fish Biology 722570-2578
Dahlgren T and J Havenhand (2017) An assessment of the theoret-ical basis and practical options for incorporating the effects of pro-jected climate change in marine spatial planning of Swedish waters Swedish Agency of marine and Water Management report 201726
Dahlgren CP Kellison GT Adams AJ Gillanders BM Kendall MS Lay-man CA Ley JA Nagelkerken I Serafy JE (2006) Marine nurseries and effective juvenile habitats concepts and applications Marine Ecolo-gy Progress Series 312291-295
35
5 References Essential fish habitats in the Baltic Sea Identification of potential spawning recruitment and nursery areas
EC (2014) Directive 201489EU of the European Parliament and of the Council of 23 July 2014 establishing a framework for mari-time spatial planning OJ L 257
Ekebom J J Jaumlaumlnheimo and J Reker (2008) Towards Marine Spatial Planning in the Baltic Sea BALANCE Technical Summary Report 4 1-132 httpbalance-euorg
Fey DP (2001) Differences in temperature conditions and somat-ic growth rate of larval and early juvenile spring spawned herring from the Vistula Lagoon Baltic Sea manifested in the otolith size to fish size relationship Journal of Fish Biology 58 1257-1273
Fey DP AM Lejk P Margonski L Szymanek I Psuty T Nermer F Lempe HV Strehlow P Polte D Moll N Stybel A Hiller and M van Laak (2014a) Herring An analysis of spawning ground manage-ment ecological conditions and human impacts in Greifswald Bay Vistula Lagoon and Hanouml Bight NMFRI Gdynia
Fey D A Szkudlarek-Pawełczyk and A Woźniczka (2014b) Abun-dance and distribution of larval herring Clupea harengus (Acti-nopterygii Clupeiformes Clupeidae) in the Pomeranian Bay Baltic Sea as an indicator of spawning sites Acta Ichthyologica et Piscatoria 44 309-317
Fonds M R Cronie AD Vethaak and P Van Der Puyl (1992) Me-tabolism food consumption and growth of plaice (Pleuronect-es platessa) and flounder (Platichthys flesus) in relation to fish size and temperature Netherlands Journal of Sea Research 29 127ndash143
Gaigalas K (2001) Lithuanian fishery in the region of the Nemu-nas lower reaches (In Lithuanian) Klaipėda Libra
Gaigalas K (2011) Fish and fishery in Curonian Lagoon basin (In Lithuanian) Klaipėda Eglė
Grauman GB (1980) Long term changes in the abundance data of eggs and larvae of sprat in the Baltic Sea Fisheries research in the Baltic Sea Riga 15138-150 (in Russian)
Gunnartz U M Lif P Lindberg L Ljunggren A Sandstroumlm and G Sundblad (2011) Kartlaumlggning av lekomraringden foumlr kommer-siella fiskarter laumlngs den svenska ostkusten - en intervjustud-ie (In Swedish with summary in English) Finfo 201131-42 httpswwwhavochvattensedownload1864f5b3211343cffddb28000180151348912838028finfo2011_3pdf
HELCOM (2018a) Outcome of the regional expert workshop on essential fish habitats organized by Pan Baltic Scope project and HELCOM (HELCOM Pan Baltic Scope EFH WS 1-2018)
HELCOM (2018b) State of the Baltic Sea - Second HELCOM holistic assessment 2011-2016 Baltic Sea Environment Proceedings 155
HELCOM (2018c) HELCOM Map and Data service Layers mean slope and bottom currents httpmapshelcomfiwebsitemapservice Accessed March 2019
HELCOM (2018d) HELCOM Map and Data service Layers Seabed sediment polygon (BALANCE) Fucus distribution Furcellaria
lumbricalis distribution httpmapshelcomfiwebsitemap-service Accessed 29 October 2018
HELCOM (2018e) HELCOM Thematic assessment of cumulative impacts on the Baltic Sea 2011-2016 Baltic Sea Environment Pro-ceedings 159
HELCOM (2019a) Outcome of the 1st Meeting of the continuation of the project for Balticwide assessment of coastal fish communi-ties in support of an ecosystembased management (FISH-PRO III)
HELCOM (2019b) Outcome of HELCOM-VASAB MSP WG 18-2019
HELCOM (2019c) Outcome of the tenth Meeting of the Working Group on the State of the Environment and Nature Conservation (STATE amp CONSERVATION 10-2019)
HELCOM (2019d) Outcome of the eleventh Meeting of the Work-ing Group on the State of the Environment and Nature Conserva-tion (STATE amp CONSERVATION 11-2019)
Hagstrom O and H Wickstroumlm (1990) Immigration of young eels to the Skagerrak-Kattegat area 1900 to 1989 Internationale Revue der gesamten Hydrobiologie und Hydrographie 75707-716
Hinrichsen HH A Lehmann C Petereit A Nissling D Ustups U Bergstroumlm and K Huumlssy (2016) Spawning areas of eastern Baltic cod revisited Using hydrodynamic modelling to reveal spawning habitat suitability egg survival probability and connectivity pat-terns Progress in Oceanography 14313-25
Hinrichsen HH B von Dewitz A Lehmann U Bergstroumlm and K Huumlssy (2017a) Spatio-temporal dynamics of cod nursery areas in the Baltic Sea Progress in Oceanography 15528-40
Hinrichsen HH C Petereit A Nissling I Wallin D Ustups and A-B Florin (2017b) Survival and dispersal variability of pelagic eggs and yolk-sac larvae of central and eastern Baltic flounder (Pla-tichthys flesus) application of biophysical models ICES Journal of Marine Science 7441-55
Huumlssy K (2011) Review of western Baltic cod (Gadus morhua) recruitment dynamics ICES Journal of Marine Science 681459-1471
Huumlssy K HH Hinrichsen and B Huwer (2012) Hydrographic in-fluence on the spawning habitat suitability of western Baltic cod (Gadus morhua) ICES Journal of Marine Science doi101093ic-esjmsfss136
ICES (2019a) ICES Fisheries overviews Baltic Sea Ecoregion Pub-lished 2 September 2019 Version 2 29 November 2019 httpsdoiorg1017895icesadvice5566
ICES (2019b) ICES Fisheries Overviews Great North Sea Ecoregion Published 29 November 2019 Version 2 15 January 2020 httpsdoiorg1017895icesadvice5710
Isaeligus M (2004) Factors structuring Fucus communities at open and complex coastlines in the Baltic Sea PhD thesis Stockholm University
36
5 References Essential fish habitats in the Baltic Sea Identification of potential spawning recruitment and nursery areas
Jankevičius K I Gasiūnas A Gediminas V Gudelis A Kublickas and I Maniukas (Eds) (1959) Curonian Lagoon (In Russian) Vilni-us Pergalė 552 pp
Johnsson T (1978) Dispersal area of perch Perca fluviatilis tagged in a stream flowing into the Bothnian Sea Aquilo Series Zoologica 18 62-64
Joumlnsson N J Scabell and B Gentzen (1984) Praxisorientierte Verhaltensuntersuchungen am Rtigenschen Frtihjahrshering Wiss Z WPU Rostock Naturwiss Reihe 3368-75
Joslashrgensen HB MM Hansen D Bekkevold DE Ruzzante and V Loeschcke (2005) Marine landscapes and population genetic structure of herring (Clupea harengus L) in the Baltic Sea Molec-ular Ecology 143219-3234
Kallasvuo M J Vanhatalo and L Veneranta (2017) Modeling the spatial distribution of larval fish abundance provides essential information for management Canadian Journal of Fisheries and Aquatic Sciences 74636-649
Kanstinger P J Beher G Grenzdoumlrffer C Hammer KB Huebert D Stepputtis and M Peck (2018) What is left Macrophyte mead-ows and Atlantic herring (Clupea harengus) spawning sites in the Greifswalder Bodden Baltic Sea Estuar Coast Shelf Sci 20172-81)
Krasovskaya N (2002) Spawning of Baltic herring in the Vistula Lagoon Effects of environmental conditions and stock parame-ters Bulletin of Sea Fish Inst No 1 (155) Gdynia 3-25
Kaumlaumlriauml J J Eklund S Hallikainen R Kaumlaumlriauml M Rajasilta K Ran-ta-Aho and M Soikkeli (1988) Effects of coastal eutrophication on the spawning grounds of the Baltic herring in the SW Archipelago of Finland Kieler Meeresforschungen Sonderheft 6348-356
Kaumlaumlriauml J M Rajasilta M Kurkilahti and M Soikkeli (1997) Spawn-ing bed selection by the Baltic herring (Clupea harengus mem-bras) in the Archipelago of SW Finland ICES Journal of Marine Science 54917-923
Klinkhardt M DR Lill and E Biester (1985) Untersuchungen zum Ablauf der Fruumlhjahrslaichsaisons 1982 und 1983 der Ruumlgen-heringe (Clupea harengus L) auf einem ausgewaumlhlten Laichplatz des Greifswalder Boddens Fisch Forsch Wiss Sehr 2341-48
Kornilovs G (1994) Baltijas reņģes nārsta vietu un embrionālās attīstības raksturojums Rīgas jūras līcī PhD Thesis (in Latvian) University of Latvia
Koumlster FW M Vinther BR MacKenzie M Eero and M Plikshs (2009) Environmental effects on recruitment and implications for bi-ological reference points of eastern Baltic cod (Gadus morhua) Journal of Northwest Atlantic Fishery Science 41205-220
Koumlster FW B Huwer HH Hinrichsen V Neumann A Makarchouk M Eero BV Dewitz K Huumlssy J Tomkiewicz P Margonski A Tem-ming J-P Hermann D Oesterwind J Dierking P Kotterba and M Plikshs (2017) Eastern Baltic cod recruitment revisited - dynam-ics and impacting factors ICES Journal of Marine Science 743-19
Kraufvelin P Z Pekcan-Hekim U Bergstroumlm A-B Florin A Le-hikoinen J Mattila and J Olsson (2016) Essential fish habitats (EFH) - Conclusions from a workshop on the importance map-ping monitoring threats and conservation of coastal EFH in the Baltic Sea TemaNord 2016539
Kraufvelin P Z Pekcan-Hekim U Bergstroumlm A-B Florin A Lehi-koinen J Mattila T Arula L Briekmane E J Brown Z Celmer J Dainys H Jokinen P Kaumlaumlriauml M Kallasvuo A Lappalainen L Lozys P Moumlller A Orio M Rohtla L Saks M Snickars J Stoslashttrup G Sundblad I Taal D Ustups A Verliin M Vetemaa H Winkler A Wozniczka and J Olsson (2018) Essential coastal habitats for fish in the Baltic Sea Estuarine Coastal and Shelf Science 20414- 30
Lehmann A W Krauszlig and HH Hinrichsen (2002) Effects of re-mote and local atmospheric forcing on circulation and upwelling in the Baltic Sea Tellus A 54299-316
Lehtonen H S Hansson and H Winkler (1996) Biology and ex-ploitation of pikeperch Stizostedion lucioperca (L) in the Baltic Sea area Annales Zoologici Fennici 33 525-535
Liquete C S Kleeschulte G Dige J Maes B Grizzetti B Olah and G Zulian (2015) Mapping green infrastructure based on ecosys-tem services and ecological networks A Pan-European case study Environmental Science amp Policy 54 268-280
Ložys L (2004) The growth of pikeperch (Sander lucioperca L) and perch (Perca fluviatilis L) under different water temperature and salinity conditions in the Curonian Lagoon and Lithuanian coastal waters of the Baltic Sea Hydrobiologia 514 105-113
MacKenzie BR HH Hinrichsen M Plikshs and K Wieland (2000) Quantifying environmental heterogeneity estimating the size for successful cod egg development in the Baltic Sea and its in-fluence on recruitment Marine Ecology Progress Series 193143-156
Magnuson-Stevens Fisheries Conservation and Management Act As amended through 12 Jan 2007 (2007) Second printing US Department of Commerce National Oceanic and Atmo-spheric Administration and National Marine Fisheries Service httpswwwfisheriesnoaagovwebdamdownload55860982
Miloš A and L Bergstroumlm (2019) Cumulative impact Assessment Toolbox with user manual 23102019 httpsgithubcomhel-comsecretariatCumulative-impact-Assessment-Toolbox
Modin J (2008) Progress report of the NAF project Towards an ecosystem-based management of herring in the Baltic Sea 1st workshop on habitat mapping of spawning and nursery areas of Baltic herring Oumlregrund Sweden 8-12 December 2008
Moll D (2018) Contribution of coastal nursery areas to the spring-spawning population of Atlantic herring (Clupea haren-gus) in the Western Baltic Sea Dissertation Universitaumlt Hamburg
Momigliano P H Jokinen A Fraimout A-B Florin A Norkko and J Merilauml (2017) Extraordinarily rapid speciation in a marine fish Proceedings of the National Academy of Sciences of the United States of America 1146074-6079
37
5 References Essential fish habitats in the Baltic Sea Identification of potential spawning recruitment and nursery areas
Momigliano P GP Denys H Jokinen and J Merilauml (2018) Platich-thys solemdali sp nov (Actinopterygii Pleuronectiformes) a new flounder species from the Baltic Sea Frontiers in Marine Science 5225
Mohrholz V M Naumann G Nausch S Kruumlger and U Graumlwe (2015) Fresh oxygen for the Baltic Sea - an exceptional saline inflow after a decade of stagnation Journal of Marine System 148152-166
Mumby P A Edwards J Ernesto Arias-Gonzaacutelez et al (2004) Man-groves enhance the biomass of coral reef fish communities in the Caribbean Nature 427 533ndash536
Mustamaumlki N U Bergstroumlm K Aringdjers A Sevastik and J Mattila (2014) Pikeperch (Sander lucioperca (L)) in decline High mortality of three populations in the northern Baltic Sea Ambio 43325-336
Naumlslund J T Didrikas and A Šaškov (2011) Predicted herring (Clu-pea harengus) spawning grounds on the Lithuanian coast Aqua-Biota Report 201101
Naush G R Feistel M Naumann and V Mohrholz (2014) Water Ex-change between the Baltic Sea and the North Sea and conditions in the Deep Basins HELCOM Baltic Sea Environment Fact Sheets Online [Published 3112014] httpwwwhelcomfibaltic-sea-trendsenvironment-fact-sheets
Nissling A and L Westin (1997) Salinity requirements for success-ful spawning of Baltic and Belt Sea cod and the potential for cod stock interactions in the Baltic Sea Marine Ecology Progress Series 152261-71
Nissling A L Westin and O Hjerne (2002) Reproductive success in relation to salinity for three flatfish species dab (Limanda liman-da) plaice (Pleuronectes platessa) and flounder (Pleuronectes flesus) in the brackish water Baltic Sea ICES Journal of Marine Science 5993-108
Nissling A A Thorsen and FF Da Silva (2015) Fecundity regulation in relation to habitat utilisation of two sympatric flounder (Pla-tichtys flesus) populations in the brackish water Baltic Sea Jour-nal of Sea Research 95188-195
Olsson J K Mo A-B FlorinT Aho and N Ryman (2011) Genetic pop-ulation structure of perch Perca fluviatilis along the Swedish coast of the Baltic Sea Journal of Fish Biology 79 122-137
Ojaveer E (1981) On embryonal mortality of spring spawning herring on spawning grounds in the northeastern Gulf of Riga Rapports et Procegraves-Verbaux des Reacuteunions du Conseil Permanent International pour lrsquoExploration de la Mer 178401
Ojaveer H S Neuenfeldt U Bergstroumlm T Blenckner M Casini M Eero R Eschbaum A-B Florin H-H Hinrichsen K Houmlflich K Hom-mik J Horbovy K Huumlssy S Kininmonth R Klais G Kornilovs M Kroll A Lehmann K Limburg A Luzenczyk C Moellmann D Moll S Niiranen A Nilsson A Nissling A Orio A PerssonM Podolska P Polte J Poumlnni K Radtke T Raid J Raitaniemi I Sics G Guntars and D Ustups (2018) Integrating spatial processes into ecosystem models for sustainable utilization of fish resources INSPIRE Final report httpswwwbonus-inspireorg
Orio A U Bergstroumlm M Casini M Erlandsson R Eschbaum K Huumlssy A Lehmann L Ložys D Ustups and A-B Florin (2017a) Char-acterizing and predicting the distribution of Baltic Sea flounder (Platichthys flesus) during the spawning season Journal of Sea Research 12646-55
Orio A A-B Florin U Bergstroumlm I Šics T Baranova and M Casini (2017b) Modelling indices of abundance and size- based indicators of cod and flounder stocks in the Baltic Sea using newly standard-ized trawl survey data ICES Journal of Marine Science 74322-1333
Oulasvirta P J Rissanen and R Parmanne (1985) Spawning of Bal-tic herring (Clupea harengus membras) in the western part of the Gulf of Finland Finnish Fisheries Research 541-54
Oulasvirta P (1987) Spawning of autumn-spawning Baltic herring (Clupea harengus L) in the Bothnian Sea Finnish Fisheries Re-search 731-37
Petereit C H-H Hinrichsen R Voss G Kraus M Freese and C Clem-mesen (2009) The influence of different salinity conditions on egg buoyancy and development and yolk sac larval survival and morphometric traits of Baltic Sea sprat (Sprattus sprattus balticus Schneider) Scientia Marina 73 59-72
Planque B E Bellier and P Lazure (2007) Modelling potential spawning habitat of sardine (Sardina pilchardus) and anchovy (Engraulis encrasicolus) in the Bay of Biscay Fisheries Oceanog-raphy 1616-30
Popiel J (1955) Z biologii śledzi bałtyckich [About the Baltic her-ring biology] Prace Mor Inst Ryb Gdynia nr 8 [in Polish]
Popiel J (1984) On the biology of the Baltic herring Reports of the Sea Fisheries Institute Gdynia 19 8-16
Plikshs M HH Hinrichsen D Elferts I Sics G Kornilovs and FW Koumlster (2015) Baltic cod reproduction in the Gotland Basin causes of annual variability Acta Ichthyologica et Piscatoria 45247-258
Raid T (1990) On herring reproduction in the Northeastern Baltic Sea Baltic Fish Committee CM 1990J5
Rajasilta M J Kaumlaumlriauml J Eklund and K Ranta-Aho (1986) Reproduc-tion of the Baltic herring (Clupea harengus membras L) in the sea area of Turku SW Finland Ophelia Supplement 4339-343
Rajasilta M J Eklund J Kaumlaumlriauml and K Ranta-Aho (1989) The depo-sition and mortality of the eggs of the Baltic herring Clupea haren-gus membras L on different substrates in the south-west archipel-ago of Finland Journal of Fish Biology 34417-427
Rajasilta M J Eklund J Haumlnninen M Kurkilahti J Kaumlaumlriauml P Rannik-ko and M Soikkeli (1993) Spawning of herring (Clupea harengus membras L) in the Archipelago Sea ICES Journal of Marine Sci-ence 50233-246
Rannak LA (1959) Quantitative study of the Baltic herring eggs and larvae in the northern part of the Gulf of Riga and principal factors determining their survival Fisheries Research Board of Canada Translation Series 2381-15
38
5 References Essential fish habitats in the Baltic Sea Identification of potential spawning recruitment and nursery areas
Rohlf N (1999) Verhaltensaumlnderungen der Larven des Ostsee-dorsches (Gadus morhua callarias) waumlhrend der Dottersackphase Berichte aus dem Institut fuumlr Meereskunde 312
Ruskule A L Bergstroumlm J Schmidtbauer Crona J Kotta P Arndt S Strāķe S Sprukta D Ustups and I Urtāne (2019) Mapping of Marine Green Infrastructure Pan Baltic Scope Approach Pan Baltic Scope wwwpanbalticscopeeu
Saks L R Eschbaum K Juumlrgens and I Taal (2020) Ahvena raumlnded Liivi lahel ja Vaumlinameres Eesti Mereinstituut Tartu httpswwwka-lateaveeeimagespdfUuringudAhvena_rC3A4nded_Liivi_la-hel_ja_VC3A4inamerespdf
Saumlisauml M M Salminen ML Koljonen and J Ruuhijaumlrvi (2010) Coastal and freshwater pikeperch (Sander lucioperca) populations differ ge-netically in the Baltic Sea basin Hereditas 147 205-214
Scabell J and N Joumlnsson (1984) Untersuchungen zum natuumlrlichen Laichverhalten des Ruumlgenschen Fruumlhjahrsherings im Greifswalder Bodden Fischerei-Forschung 2268-72
Šaškov A A Šiaulys M Bučas and D Daunys (2014) Baltic herring (Clupea harengus membras) spawning grounds on the Lithuanian coast current status and shaping factors Oceanologia 56789-804
Seifert T F Tauber and B Kayser (2001) A high resolution spherical grid topography of the Baltic Sea -2nd edition Baltic sea Science Congress Stockholm 25-29 November 2001 Poster 147
Seitz RD H Wennhage U Bergstroumlm RN Lipcius and T Ysebaert (2014) Ecological value of coastal habitats for commercially and ecologically important species ICES Journal of Marine Science 71 648-665 httpsdoiorg101093icesjmsfst152
Skovrind M EAF Christensen L Jacobs and PR Moller (2013) Ma-rine spawning sites of Perca fluviatilis revealed by oviduct-inserted acoustic transmitters Aquatic Biology 19201-206
Snickars M G Sundblad A Sandstroumlm L Ljunggren U Bergstroumlm G Johansson and J Mattila (2010) Habitat selectivity of substrate spawning fish - modelling requirements of the Eurasian perch Per-ca fluviatilis Marine Ecology Progress Series 398235-243
Solemdal P (1967) The effect of salinity on buoyancy size and de-velopment of flounder eggs Sarsia 29431- 442
Steffensen J J Lomholt and K Johansen (1982) Gill ventilation and O2 extraction during graded hypoxia in two ecologically distinct species of flatfish the flounder (Platichthys flesus) and the plaice (Pleuronectes platessa) Environmental Biology of Fishes 7 157ndash163
Strzyżewska K (1969) Studium poroacutewnawcze populacji śledzi trą-cych się u polskich wybrzeży Bałtyku [A comparative study of her-ring populations spawning off the Polish Baltic coasts] Prace Mor Inst Ryb Gdynia T 15 ser A 211-277 [in Polish]
Stoslashttrup JG A Kokkalis EJ Brown B Vastenhoud S Ferreira J Olsen and GE Dinesen (2019) Essential Fish-habitats for com-mercially important marine species in the inner Danish waters DTU Aqua report 338-2019
Sundblad G Bergstroumlm U Sandstroumlm A and P Ekloumlv (2014) Nurs-ery habitat availability limits adult stock sizes of predatory coastal fish ICES Journal of Marine Science 71672-680
Svedaumlng H and G Bardon (2003) Spatial and temporal aspects of the decline in cod (Gadus morhua L) abundance in the Kattegat and eastern Skagerrak ICES Journal of Marine Science 6032-37
SwAM (2019) Swedish Agency for Marine and Water Management Symphony Metadata March 2019whttpswwwhavochvattensedownload1867e0eb431695d86393371d861552566811384bila-ga-1-symphony-metadatazip
Ustups D B Muumlller-Karulis U Bergstroumlm A Makarchouk and I Sics (2013) The influence of environmental conditions on early life stages of flounder (Platichthys flesus) in the central Baltic Sea Journal of Sea Research 7577-84
Toumlrnqvist O PR Jonsson and D Hume (2019) Climate refugia in the Baltic sea Modelling future important habitats by using cli-mate projections Pan Baltic Scope report Uppsala amp Gothenburg
Veneranta L L Urho A Lappalainen and M Kallasvuo (2011) Tur-bidity characterizes reproduction areas of pikeperch (Sander lucioperca (L)) in the northern Baltic Sea Estuarine Coastal and Shelf Science 95199-206
Veneranta L M Olin and H Harjunpaumlauml (2020) Ahventen pyynti- ja syoumlnnoumlsalueet Merenkurkussa tankkurimerkinnaumln perusteella Luonnonvara- ja biotalouden tutkimus 72020
Vitale F P Boumlrjesson H Svedaumlng and M Casini (2008) The spatial distribution of cod (Gadus morhua L) spawning grounds in the Kattegat eastern North Sea Fisheries Research 9036-44
Vitale F Cardinale M and H Svedaumlng (2005) Evaluation of the temporal development of the ovaries in Gadus morhua from the Sound and Kattegat North Sea Journal of Fish Biology 67669-683
Voss R MA Peck HH Hinrichsen C Clemmesen H Baumann D Stepputis M Bernreuther JO Schmidt A Temming and FW Koumlster (2012) Recruitment processes in Baltic sprat - A re-eval-uation of GLOBEC Germany hypotheses Progress in Oceanog-raphy 10761-79
Westin L and A Nissling(1991) Effect of salinity on spermatozoa motility percentage of fertilized eggs and egg development of Bal-tic cod (Gadus morhua) and implications for cod stock fluctuations in the Baltic Marine Biology 108 5-9
Wieland K U Waller U and D Schnack (1994) Development of Bal-tic cod eggs at different levels of temperature and oxygen content Dana 10 163-177
Wieland K A Jarre-Teichmann and K Horbowa (2000) Changes in the timing of spawning of Baltic cod possible causes and implica-tions for recruitment ICES Journal of Marine Science 57 452-464
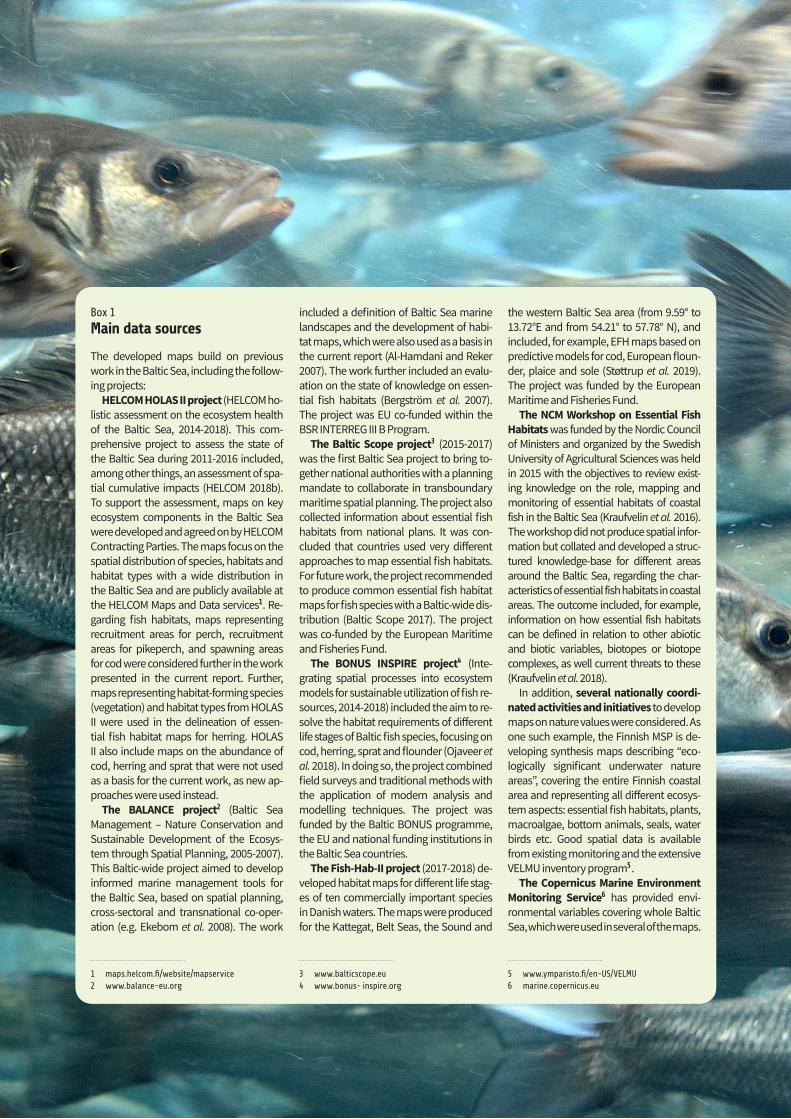