Embed Size (px)
Citation preview

Berger TA (1995) Packed-Column SFC, pp. 102}136.London: Royal Society of Chemistry.
Berger TA (1997) Separation of polar solutes by packedcolumn supercritical-Suid chromatography. Journal ofChromatography A 785: 3}33.
Jinno K (1992) Hyphenated Techniques in Supercritical-Fluid Chromatography and Extraction. Amsterdam:Elsevier.
Markides KE, Lee ML and Later DW (1989) Capillarysupercritical-Suid chromatography: practical aspects.In: Yang FJ (ed.) Microbore Column Chromatography:A UniTed Approach to Chromatography, pp. 239}266.New York: Marcel Dekker.
Mulcahey LJ, Rankin CL and McNally MP (1994) Envir-onmental applications of supercritical-Suid chromato-graphy. Advances in Chromatography 34: 251}308.
Petersson P and Markides KE (1994) Chiral separationsperformed by supercritical-Suid chromatography.Journal of Chromatography A 666: 381}394.
Schoenmakers PJ (1988) Supercritical-Suid chromatogra-phy: open columns vs. packed columns. In: SmithRM (ed.) Supercritical-Fluid Chromatography, pp.102}136. London: Royal Society of Chemistry.
Schoenmakers PJ and Uunk LGM (1989) Mobile and sta-tionary phases for supercritical-Suid chromatography.Advances in Chromatography 30: 1}80.
Smith RM (ed.) (1988) Supercritical-Uuid Chromatogra-phy. London: Royal Society of Chemistry.
Smith RM and Hawthorne SB (eds) (1997) SupercriticalFluids in Chromatography and Extraction. Oxford:Elsevier.
White CM (ed.) (1988) Modern Supercritical-FluidChromatography. Heidelberg: HuK thig.
Wilson ID and Davis RJ (1993) Supercritical-Suidchromatography and extraction of pharmaceuticals. In:Dean J (ed.) Application of Supercritical Fluids in Indus-trial Analysis, pp. 74}103. Glasgow: Blackie.
ESSENTIAL GUIDES TO METHODDEVELOPMENT IN THIN-LAYER (PLANAR)CHROMATOGRAPHY
S. Nyiredy, Research Institute for Medicinal Plants,Budakala& sz, Hungary
Copyright^ 2000 Academic Press
Introduction
One of the most critical steps of qualitative andquantitative planar (thin-layer) chromatographic(TLC) analysis is development of a method result-ing in sufRcient separation. The main steps ofmethod development are summarized in Figure 1.The Rrst stage is selection of the stationary phase, thevapour phase, and suitable solvents. This stage is thesine qua non of method development, and the selec-tion of these can occasionally immediately result ina suitable separation. For most real separation prob-lems the second stage, optimization of the mobilephase is also necessary. The third part of methoddevelopment is selection of the Rnal conditions, forexample the mode of development, transfer of themobile phase to an appropriate forced-Sow method,and last but not least, the selection of suitable oper-ating parameters. This paper gives essential guides tomethod development in planar chromatography anddraws attention to the most important considerations.
Stationary Phase Selection
TLC separations can be performed on modiRed,unmodiRed, and impregnated stationary phases, be-cause of differences between the chemical proper-ties of the sorbent material and those of compoundspresent in the sample to be separated. Differenttypes of chromatographic process (normal-phase,reversed-phase, partition, and ion exchangechromatography) can be distinguished on the basisof the types of interactions involved. Although morethan 90% of TLC separations are performed on sil-ica, chemically bonded phases have recently becomeincreasingly popular for solving special separationproblems.
In normal-phase chromatography the hydroxylgroups on the surface of the silica are the polar, activecentres which result in the interactions leading tothe retention of the compounds to be separated.These interactions are mainly hydrogen-bonding andinduced dipole}dipole interactions. The stationaryphase can generally be characterized in terms of itsspeciRc surface area, speciRc pore volume, and meanpore diameter.
UnmodiRed stationary phases include silicas,aluminas, kieselguhr, silicates, controlled-porosityglass, cellulose, starch, gypsum, polyamides, and
4652 APPENDIX 2 /ESSENTIAL GUIDES TOMETHOD DEVELOPMENT IN THIN-LAYER (PLANAR) CHROMATOGRAPHY

Figure 1 Schematic diagram of method development.
Figure 2 The structures of some commercially available surface-modified silicas.
chitin. For TLC separations silica is manufacturedby spontaneous polymerization and dehydration ofaqueous silicic acid, which is prepared by adding acidto a solution of sodium silicate. The product of thisprocess is an amorphous, porous solid, the speciRcsurface area of which can vary over a wide range (200to more than 100 m2 g��, as can the average porediameter (10}1500 A� ).
ModiRed silicas can be nonpolar or polar adsor-bents. The former include silicas bearing alkane oralkene chains or phenyl groups, whereas the polarmodiRed silicas contain cyano, diol, amino, or thiolgroups or substance-speciRc complexing ligands. Thestructures of some chemically modiRed silicas areshown in Figure 2.
Almost all the stationary phases used in normal-and reversed-phase column liquid chromatographyare also available for TLC. The dimensions of com-mercially available analytical thin-layer plates are10�10, 10�20 or 20�20 cm; the layer thickness is20 or 25 �m. It is generally accepted that betterresolution is obtained on thinner layers (10 �m), de-pending on the mode of detection. The silica mater-ials commonly used for precoated plates have anaverage particle size of ca. 11 �m, the size range isfrom 3 to 18 �m; for analytical layers prepared in theuser’s laboratory the average particle size is 15 �mand the range of particle sizes is much greater. Theaverage particle size of precoated high-performanceTLC (HPTLC) plates is now 5}6 �m and the range ofparticle sizes is very small.
APPENDIX 2 /ESSENTIAL GUIDES TO METHOD DEVELOPMENT IN THIN-LAYER (PLANAR)CHROMATOGRAPHY 4653

Figure 3 Flow chart illustrating a systematic approach for the selection of the appropriate separation technique and stationary phase.
Precoated analytical layers with a preadsorbentzone are also commercially available for linear devel-opment. This zone serves to hold the sample untildevelopment begins. Compounds soluble in the sol-vent system pass through the preadsorbent zone andare concentrated in a narrow band on entering thechromatographic layer; this improves resolution.Figure 3 gives a decision Sow chart for the systematicselection of the appropriate separation technique andstationary phase.
Vapour Phase Selection
In planar chromatography the separation process oc-curs in a three-phase system of stationary, mobile,and vapour phases, all of which interact both witheach other and with the operating conditions.Selection of chamber type and vapour space is a vari-able offered only by planar chromatography as thethird dimension of the chromatographic parameters.The role of the vapour phase in TLC is well known,although little attention is given to this in practice.
In planar chromatography two basic types ofchromatographic chamber must be distinguished.In the common normal (N) chamber the distance
between the layer and the wall of the chromato-graphic tank is more than 3 mm. If this distance issmaller, the chamber is said to have the S conRgura-tion. Both types of chamber can be used for un-saturated or saturated systems. As a rule of thumb, ifthe sample contains fewer than seven compounds tobe quantitatively determined, saturated N chambersmust be selected for method development. If thesample contains more than seven substances, or theseparation is very difRcult, S chambers must beselected which enable transfer of the optimizedmobile phase by forced-Sow.
Often the separation problem cannot be solved byuse of conventional TLC with solvent migration bycapillary action, because of the relatively modest sep-arating power of the method. In such circumstancesuse of one of the different forced-Sow techniquesis necessary; this must be considered during selectionof the vapour phase. The chambers used for forced-Sow planar separations can be also assigned to theabove two categories. The chambers used for over-pressured layer chromatography (OPLC) are un-saturated S chambers, theoretically and practicallydevoid of any vapour space. This must be consideredin the selection of appropriate solvents and during the
4654 APPENDIX 2 /ESSENTIAL GUIDES TOMETHOD DEVELOPMENT IN THIN-LAYER (PLANAR) CHROMATOGRAPHY
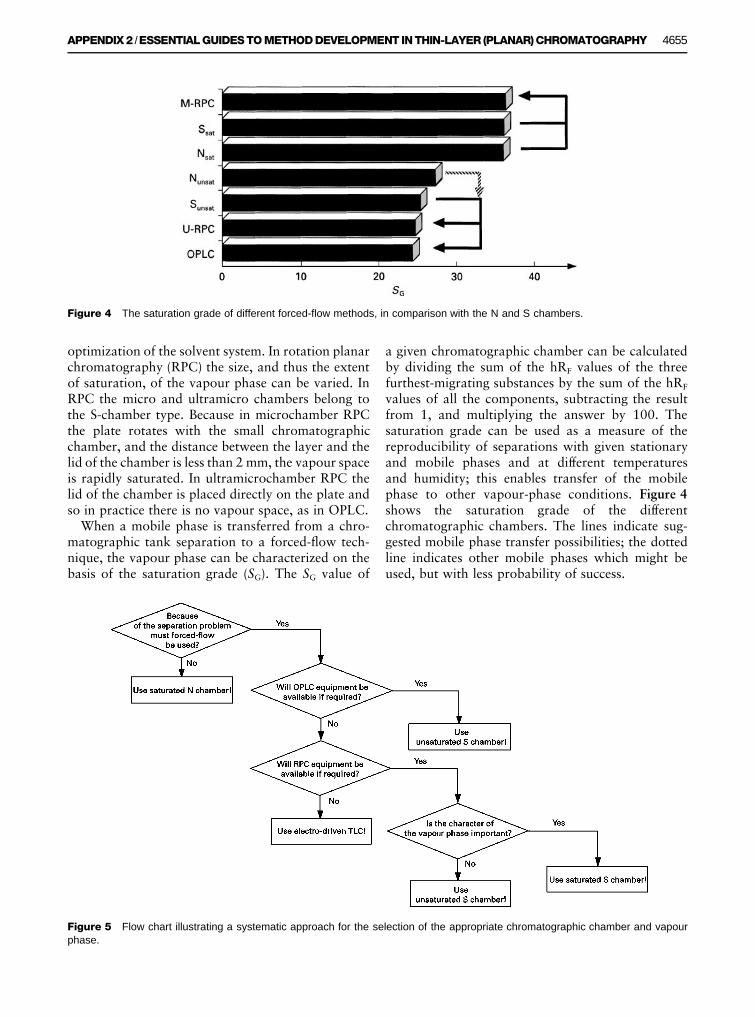
Figure 4 The saturation grade of different forced-flow methods, in comparison with the N and S chambers.
Figure 5 Flow chart illustrating a systematic approach for the selection of the appropriate chromatographic chamber and vapourphase.
optimization of the solvent system. In rotation planarchromatography (RPC) the size, and thus the extentof saturation, of the vapour phase can be varied. InRPC the micro and ultramicro chambers belong tothe S-chamber type. Because in microchamber RPCthe plate rotates with the small chromatographicchamber, and the distance between the layer and thelid of the chamber is less than 2 mm, the vapour spaceis rapidly saturated. In ultramicrochamber RPC thelid of the chamber is placed directly on the plate andso in practice there is no vapour space, as in OPLC.
When a mobile phase is transferred from a chro-matographic tank separation to a forced-Sow tech-nique, the vapour phase can be characterized on thebasis of the saturation grade (SG). The SG value of
a given chromatographic chamber can be calculatedby dividing the sum of the hRF values of the threefurthest-migrating substances by the sum of the hRF
values of all the components, subtracting the resultfrom 1, and multiplying the answer by 100. Thesaturation grade can be used as a measure of thereproducibility of separations with given stationaryand mobile phases and at different temperaturesand humidity; this enables transfer of the mobilephase to other vapour-phase conditions. Figure 4shows the saturation grade of the differentchromatographic chambers. The lines indicate sug-gested mobile phase transfer possibilities; the dottedline indicates other mobile phases which might beused, but with less probability of success.
APPENDIX 2 /ESSENTIAL GUIDES TO METHOD DEVELOPMENT IN THIN-LAYER (PLANAR)CHROMATOGRAPHY 4655

Table 1 Solvent classification based on solvent strength and selectivity values
Group Solvent Solvent strength (Si ) Xe Xd Sv"Xe
Xd
} n-Hexane 0 } } 0.10H
I n-Butyl ether 2.1 0.44 0.18 2.44Diisopropyl ether 2.4 0.48 0.14 3.43Methyl-t-butyl ether 2.7 0.49 0.14 3.50Diethyl ether* 2.8 0.53 0.13 4.08
II i-Pentanol 3.7 0.56 0.19 2.95n-Butanol 3.9 0.56 0.19 2.95i-Propanol 3.9 0.55 0.19 2.89n-Propanol 4.0 0.54 0.19 2.84Ethanol* 4.3 0.52 0.19 2.74Methanol 5.1 0.48 0.22 2.18
III Tetrahydrofuran* 4.0 0.38 0.20 1.90Pyridine 5.3 0.41 0.22 1.86Methoxyethanol 5.5 0.38 0.24 1.58Methylformamide 6.0 0.41 0.23 1.78Dimethylformamide 6.4 0.39 0.21 1.86Dimethylsulfoxide 7.2 0.39 0.23 1.70
IV Acetic acid* 6.0 0.39 0.31 1.26Formamide 9.6 0.36 0.23 1.57
V Dichloromethane* 3.1 0.29 0.18 1.611,1-Dichloroethane 3.5 0.30 0.21 1.43Benzyl alcohol 5.7 0.40 0.30 1.33
VI Ethyl acetate* 4.4 0.34 0.23 1.48Methyl ethyl ketone 4.7 0.35 0.22 1.59Dioxane 4.8 0.36 0.24 1.50Acetone 5.1 0.35 0.23 1.52Acetonitrile 5.8 0.31 0.27 1.15
VII Toluene* 2.4 0.25 0.28 0.89Benzene 2.7 0.23 0.32 0.72Nitrobenzene 4.4 0.26 0.30 0.87Nitromethane 6.0 0.28 0.31 0.90
VIII Chloroform* 4.1 0.25 0.41 0.61Dodecafluoroheptanol 8.8 0.33 0.40 0.83Water 10.2 0.37 0.37 1.00
*Approximate value.
Among the forced-Sow methods the highest separ-ating power is obtained with OPLC, because of theoptimum mobile phase velocity on the HPTLC plateand the greater separation distance. If, therefore, thequality of the Rnal separation is likely to be deter-mined by the separation distance, OPLC and, for thepreassay, the unsaturated S chamber must be selected.If RPC equipment is available for improving the ef-Rciency of the Rnal separation, the choice ofchromatographic tank for the preassay depends onthe types of compound to be separated. If the acidicor basic character of the vapour phase is importantfor the separation, a saturated S-chamber (micro-chamber) should be used; if this is not available,a saturated N chamber is the right selection for theTLC pre-assay. If the mobile phase is to be transferred
to a U-RPC separation, an unsaturated S chamber(ultramicro chamber) must be chosen. These consid-erations are summarized in Figure 5.
Selection of Suitable Solvents
The modern strategy of solvent selection is basedon the solvent classiRcation by Snyder, who classiRedmore than 80 solvents into eight groups for normal-phase chromatography according to their propertiesas proton acceptors (xa) and proton donors (xd), andtheir dipole}dipole interactions (xn).
For, selection of suitable solvents, preliminary experi-ments are performed on silica TLC plates with the ninesolvents indicated by stars in Table 1, which lists thesolvents commonly used in planar chromatography.
4656 APPENDIX 2 /ESSENTIAL GUIDES TOMETHOD DEVELOPMENT IN THIN-LAYER (PLANAR) CHROMATOGRAPHY

Figure 6 Strategy for the selection of a suitable TLC solvent.
After these initial TLC experiments with the neatsolvents, the solvent strength (Si) must either be re-duced or increased so that the substance zones aredistributed between hRF 20 and 80. The two theoret-ical situations are depicted in Figure 6 (A and P inFigure 6). If the compounds to be separated migratein the upper third of the plate (A-a in Figure 6) thesolvent strength must be reduced by dilution withhexane. If the neat solvents do not cause migration of
the substances, the solvent strength must be increased(P-a in Figure 6) by the addition of water. In bothcircumstances the solvent strength should be variedso that better distribution of the substance zones isobtained. Consequently, the structures and propertiesof the compounds to be separated do not have to beknown. Their classiRcation as apolar (A) or polar (P)compounds can be made in accordance with theirbehaviour in these TLC experiments.
APPENDIX 2 /ESSENTIAL GUIDES TO METHOD DEVELOPMENT IN THIN-LAYER (PLANAR)CHROMATOGRAPHY 4657

Figure 7 Flow chart illustrating a systematic approach for the selection of suitable solvents.
If solvents result in good separation, their homo-logues or other solvents of the same group can alsobe tested, as indicated by A-b and P-b in Figure 6.After these experiments the solvents giving the bestseparations are chosen for further optimization ofthe separation of apolar compounds. For optimiza-tion of the mobile phase for separation of polarcompounds, suitable solvents are again selected; thesolvent mixture should contain one solvent in whichthe compounds do not migrate; this is necessary forthe transfer of the mobile phase to certain forced-Sow techniques. In certain circumstances a suitableseparation can be achieved with this solvent-selectionstrategy. The individual steps of this method ofsolvent selection are depicted in a Sow chart inFigure 7.
Thus the structures and properties of the com-pounds to be separated do not have to be known forthese experiments. After these experiments, the sol-vents giving adequate separations are chosen foroptimization of the mobile phase.
Mobile Phase Optimization
Mobile phase optimization is based both on modi-Rcation of published data, on experience with theanalytes, and on intuition. As sample compositionbecomes more complex, however, systematic solventoptimization becomes increasingly important. For sys-tematic mobile phase optimization four methods aregenerally used in planar chromatography:
} window diagram} sequential simplex method} Geiss’s structural approach} the ‘PRISMA’ model.
Because only the ‘PRISMA’ model is currently suit-able for both manual and automatic mobile phaseoptimization, this method is summarized below.
After the selection of suitable solvents the construc-tion of the actual ‘PRISMA’ model is begun. In gen-eral between two and Rve solvents might be selectedfor the construction of the model; modiRers might
4658 APPENDIX 2 /ESSENTIAL GUIDES TOMETHOD DEVELOPMENT IN THIN-LAYER (PLANAR) CHROMATOGRAPHY

Figure 8 The ‘PRISMA’ system for the systematic optimization of a planar chromatographic method.
also be added. The actual ‘PRISMA’ model is a threedimensional geometrical design which correlates thesolvent strength with the selectivity value of the mo-bile phase. The tripartite model (see the central partof Figure 8) consists of an irregular top part (lightgrey), a regular middle part (white) and the lowerpart (dark grey) symbolizing the modiRer(s). Whenworking with silica as the stationary phase, the upperfrustum is generally used for the optimization ofmobile phases, with or without modiRer, for theseparation of polar compounds. The regular centreportion of the prism is used for the optimization ofmobile phases, with or without modiRer, for the sep-aration of apolar compounds. The construction of themodel, the role of solvent strength, and the character-ization of the selectivity points (PS) are describedextensively in the literature.
The selectivity points on the vertical planes of theregular part of the prism can be obtained by dilutingthe solvent mixtures with a solvent-strength regula-tor. Solvent-strength (ST) values decrease from top tobottom; at the base of the prism ST is zero. If sectionsare taken across the regular prism parallel to the base,triangles of different ST levels are obtained. Ob-viously, the solvent strength is identical at all pointson one of these triangles, and all points on a verticalstraight line correspond to the same selectivity point.
For normal-phase chromatography hexane (Si"0)is the regulator. If reversed-phase plates must be used
for the separation, the regular part of the model isused for the separation, irrespective of the polarity ofthe compounds to be separated. In these circumstan-ces water, rather than hexane, must be used as thesolvent-strength regulator.
The solvent-strength values of the modiRer(s) aretreated by the ‘PRISMA’ model as additive terms. Forthe sake of simplicity, the solvent-strength values ofthe modiRers are neglected, because they are usuallypresent at low, constant concentrations (generallybetween 0.1 and 3%, e.g. acids, ion pairs).
Manual Optimization Procedure
The four basic selectivity points within the regularpart of the prism (PS"333, 811, 181, 118) for foursolvent mixtures and the three basic selectivity pointson the side of the prism (PS"550, 75}25, 25}75) forthree solvent mixtures are emphasized in Figure 9.The black points symbolize mixtures of one solventand the solvent strength regulator (binary systems);the dark grey points symbolize mixtures of two sol-vents and the regulator (ternary systems); and thethree-digit numbers symbolize mixtures of three sol-vents and the regulator (quaternary systems).
If three solvents were selected for the separation ofapolar compounds, optimization is performed withinthe regular part of the model with the help of the fourbasic selectivity points. The steps for optimizing thesolvent combination for apolar compounds are
APPENDIX 2 /ESSENTIAL GUIDES TO METHOD DEVELOPMENT IN THIN-LAYER (PLANAR)CHROMATOGRAPHY 4659

Figure 9 Favoured selectivity points for mobile phase optimization.
depicted in a Sow chart in Figure 10. If two solventswere selected, the optimization is performed alongthe side of the prism. In both circumstances the sol-vent strength is adjusted and then different selec-tivity points are tested. If three to Rve solventsare selected as best, the number of solvents is reducedon the basis of criteria such as the number of com-pounds separated and the �RF values obtained. If thesolvent combinations tested with this strategy do notresult in a sufRcient separation, or at least thebeginnings of a separation, of important pairs of sub-stances, other solvents must be selected and the processmust be repeated, as indicated in the Sow chart.
For the separation of apolar compounds the op-timization is generally a rapid process because a fewexperiments are sufRcient to evaluate the optimummobile-phase composition.
For polar compounds, the optimization is alwaysstarted on the top irregular triangle of the model,either within the triangle, when three solvents wereselected, or along one side, when two solvents wereselected. Water is usually used as a modiRer to in-crease solvent strength and reduce tailing; if wateris used, several selectivity points cannot be testedbecause of immiscibility problems (especially nearPS"811).
Changing the selectivity points on the top trianglealso changes the solvent strength; thus a small changein the selectivity point might result in a large dif-ference in resolution, especially when the solvent
strength of the selected solvents differs substan-tially. The subsequent procedure is similar to thatfor the apolar compounds, but the solvent strengthmust be adjusted after a suitable selectivity is found.The Sow chart for the optimization of the solventcombination for polar compounds is shown inFigure 11.
In contrast to the separation of apolar compounds,optimization is a longer process for polar substancesbecause of the simultaneous change in solventstrength and selectivity. When water, in particular, isone of the solvents selected for the construction of thetriangle, a small change in selectivity results in ex-treme changes in resolution. More chromatographicexperience is, therefore, necessary if the separationproblem is to be solved rapidly.
Manual optimization of the mobile phase mustbe performed until at least the beginnings of a separ-ation of the compounds is obtained. This can usuallybe achieved with the Rrst ‘PRISMA’ combination,assuming the individual solvents were selected cor-rectly.
Automatic Optimization Procedure
The basis of automatic mobile-phase optimization,the correlation between mobile-phase compositionand resolution for saturated TLC systems, can bedescribed by mathematical functions. The correlationbetween hRF values and the selectivity points at aconstant solvent strength level can be expressed by
4660 APPENDIX 2 /ESSENTIAL GUIDES TOMETHOD DEVELOPMENT IN THIN-LAYER (PLANAR) CHROMATOGRAPHY

Figure 10 Flow chart illustrating a systematic approach for the optimization of the mobile phase for the separation of nonplanarcompounds.
the function:
hRF"a(PS)2#b(PS)#c
For quaternary solvent systems, the correlation be-tween hRF values and solvent strength at a constantselectivity point can be expressed by the function:
ln hRF"d(ST)#e
Because the vertical correlation can be linearized,measurements on three solvent-strength levels areneeded to calculate the hRF values for all selectivitypoints in the spatial design. These correlations arealso relevant when modiRers are used in constantamounts, for different classes of substance. Fromthese correlations of hRF values with the selectivity ofthe mobile phase, the chromatographic behaviour of
APPENDIX 2 /ESSENTIAL GUIDES TO METHOD DEVELOPMENT IN THIN-LAYER (PLANAR)CHROMATOGRAPHY 4661

Figure 11 Flow chart illustrating a systematic approach for the optimization of the mobile phase for the separation of polarcompounds.
substances to be separated can be predicted for allselectivity values in saturated chromatographicchambers.
The separation quality of predicted chromato-grams can be assessed by use of a chromatographic
response function (CRF). The optimum compositioncan be found by a simple mathematical proced-ure which maximizes the CRF by monitoring itsdependence upon mobile-phase composition. Twelvemeasurements are necessary to discover a local opti-
4662 APPENDIX 2 /ESSENTIAL GUIDES TOMETHOD DEVELOPMENT IN THIN-LAYER (PLANAR) CHROMATOGRAPHY

Table 2 Required measurements for automatic mobile phaseoptimization to achieve the global optimum
Solvent strength Selectivity points
ST1 811 631 118 343 136 181ST2 811 433 118 316 361 181ST3 811 613 118 334 163 181
Figure 12 Effect on the �RF value of the distance betweenmobile phase inlet and sample.
mum, and Rfteen for the global optimum. To increasethe accuracy, six measurements at three differentsolvent strength levels (18 experiments) are necessary,as is seen in Table 2.
Selection of the Mode of Development
Planar chromatography differs from all other chro-matographic methods in that it enables selection ofthe optimum mode of development; the linear modeof development is used most frequently. Because as-cending development has no theoretical advantageover horizontal development, the latter, being moreadaptable, has become increasingly common in re-cent years.
The advantage of circular development, where thesolvent system migrates radially from the centre ofthe plate to the periphery, is well known for theseparation of compounds in the lower RF range.Working with the same mobile phase, the resolutionis about 4}5 times higher in circular than in lineardevelopment mode, as is seen in Figure 12. This state-ment is only valid if the samples are spotted exactly atthe centre (x"0 cm). If the distance between thesample and the mobile phase inlet is, e.g. 2 cm, thereis no signiRcant difference in the lower RF rangebetween circular and linear development (seeFigure 12). Development can, however, be startedat a point displaced from the centre if a Rlter-paperring is used to achieve higher mobile-phase velocity.Under these conditions many samples can be appliedand the advantages of circular development can beexploited.
In anticircular development the mobile phase isapplied to the layer as a circle and Sows towardsthe centre. Because the solvent Sow velocity decreaseswith the square of the distance, but the area wettedalso decreases with the square of the distancetravelled, the speed of mobile-phase migration ispractically constant. Although anticircular develop-ment is rarely used, it is an accepted approach inTLC if resolution must be increased in the higherRF range.
The multiple development (MD) techniques, UMD(unidimensional MD) and IMD (incremental MD)can also be used to increase separating power in thelower RF range. UMD is the repeated development ofthe plate over the same development distance withmobile phase of the same composition; between de-velopment steps the mobile phase is removed fromthe layer by careful drying and the dried plate isreturned to the development chamber for developmentunder the same chromatographic conditions as pre-viously. IMD is an alternative version of this techniquein which successive chromatographic developmentsare performed over increasing development distanceswith mobile phase of the same composition. In theIMD Rrst development distance is the shortest andsubsequent development steps are over longer distances;the development distance usually increases by equalincrements. The last migration distance, the longest,corresponds to the useful development length ofthe plate (but can depend on the mobile phaseemployed).
The advantages of the different modes of de-velopment can be summarized as follows:
} circular development increases resolution in thelower RF range} anticircular development increases resolution in
the higher RF range} UMD is most effective at improving separ-
ation in the lower RF range} IMD improves zone-centre separation.
A comparison of these modes of development is pre-sented in Figure 13.
Mobile Phase Transfer
There are two reasons for transferring the optimizedTLC mobile phase. The Rrst is that the separation isnot sufRciently good and better resolution mightbe achieved by use of forced-Sow methods. The opti-mized TLC mobile phase is, therefore, transferredwithout alteration to the U-RPC or OPLC technique.When the latter is used, a prerun must be performed.For separation of nonpolar compounds the preruncan be performed with hexane; for separation of polar
APPENDIX 2 /ESSENTIAL GUIDES TO METHOD DEVELOPMENT IN THIN-LAYER (PLANAR)CHROMATOGRAPHY 4663

Figure 13 Effect of linear, circular, UMD, and IMD development modes on RF values in the lower RF range.
Figure 14 Possibilities of transferring the optimized TLC mo-bile phase to the different forced-flow planar chromatographicmethods, and to preparative column liquid chromatographictechniques.
substances the prerun can be performed with anycomponent of the mobile phase in which the compo-nents do not migrate. The selection of this solvent
might be considered during optimization of the mo-bile phase. Highly effective separation can beachieved by use of HPTLC plates and forced-Sowtechniques.
The second reason for transferring an optimizedTLC mobile phase is when scaling up to the variouspreparative chromatographic systems. As a result ofthe characterization of the different saturationgrade of chromatographic chambers (see Figure 4),excellent mobile phase transfer between analyticaland preparative planar chromatographic methodsand analytical HPLC can be achieved. The transfercan be performed on the basis of the chromatographicconditions used. Dry-Rlled preparative columns (forSash, low-pressure liquid, and medium-pressureliquid chromatography) can be equilibrated with thesolvent used for the prerun in analytical OPLC,whereas if the column is Rlled by the slurrytechnique, the slurry must be prepared from thesame solvent as was used for the OPLC prerun. Inboth of these, air bubbles can be eliminated by pas-sage of an appropriate amount of the solvent usedfor the prerun; preparative separation can then bestarted with the optimized unsaturated TLC mobilephase.
The possibilities of mobile-phase transfer between thedifferent solid}liquid chromatographic methodsare comprehensively summarized in Figure 14, whichdemonstrates the possibilities of direct transfer. Dif-ferent lines show those applicable to the differentmethods; dotted lines and thin lines are indicativeof ofSine and online methods, respectively,whereas thick lines indicate the possibility of transferof the optimized mobile phase without change be-tween different solid}liquid planar and columnchromatographic techniques, both ofSine and on-line.
4664 APPENDIX 2 /ESSENTIAL GUIDES TOMETHOD DEVELOPMENT IN THIN-LAYER (PLANAR) CHROMATOGRAPHY

Figure 15 Flow chart illustrating a systematic approach for the selection of the mode of development, development distance, andforced-flow technique.
Selection of Other OperatingParameters
In conventional TLC the solvent velocity cannot, inprinciple, be inSuenced by the chromatographer. Theenhanced efRciency of forced-Sow techniques,
compared with TLC driven by capillary action only,results from the constant linear mobile phase velocity.Forced-Sow techniques guarantee optimum H/uvalues. In OPLC the upper limit of velocity dependson the applied external pressure and on the viscosity.In RPC, the greater the speed of rotation, the faster
APPENDIX 2 /ESSENTIAL GUIDES TO METHOD DEVELOPMENT IN THIN-LAYER (PLANAR)CHROMATOGRAPHY 4665

the migration of the mobile phase. The local mobile-phase velocity can be inSuenced by the mode ofdevelopment selected.
In TLC separation efRciency improves with thesquare root of the separation distance. The optimum,however, depends on the quality of the plate (averageparticle size and size distribution of the stationaryphase), the vapour space, the mode of development,and the properties of the compounds to be separated.The Rrst of these cannot be inSuenced by the user ofprecoated plates. The maximum length of commer-cially available precoated plates is 20 cm. Thus, themaximum separation distance in linear developmentis 18 cm. The efRciency and rapidity of planar chro-matography can be increased by the use of a novelcategory of multilayer OPLC, long-distance OPLC,by use of which the separation efRciency is in-creased signiRcantly. In this technique the end ofthe Rrst plate has a slit-like perforation throughwhich the mobile phase is transferred to a secondlayer. Clearly, on this basis, a very long separationdistance can be achieved by combining one plate withanother.
Sample application is one of the most importantstages of successful planar chromatography. Theamount of applied sample depends on the determina-tion method. Generally, �g and ng quantities of sam-ple can be determined, but even less than 100 pmolsubstance per chromatogram zone has been reported.
During method development, the separation dis-tance always depends on the mode of developmentand the forced-Sow technique used, and on the devel-opment distance; this is summarized in Figure 15 inthe form of a Sow-chart.
In normal circumstances alteration of temperatureis not an effective means of modifying selectivityand maximizing resolution. If two compounds areunresolved at a given temperature, they normallyremain unseparated at other temperatures, irrespect-ive of whether N- or S-chambers are used. It cangenerally be stated that in saturated chromatographicchambers, which are most commonly used, the tem-perature does not have a great inSuence on separ-ations. A change of $53C results in a change in hRF
of less than 3. Nevertheless, in the interest of reproduc-ibility in duplicate separations it is important to notethe working temperature. Remarkably, temperatureis now being found to play an important role in theselectivity and efRciency of OPLC separations.
Strategy of Method Development
The ‘PRISMA’ optimization system is a strategy formethod development in liquid chromatography. Fig-
ure 8, which shows the ‘PRISMA’ system for planarchromatography, consists of three parts. The Rrst part isthe selection of the basic parameters; stationary andvapour phases and suitable solvents, the last accordingto the Snyder classiRcation. The second part is theoptimization of the mobile phase, using the ‘PRISMA’optimization model. The third part is the selection of theRnal parameters; the mode of development, transfer ofthe mobile phase to the appropriate forced-Sow methodand, last but not least, the selection of suitable operatingconditions. The ‘PRISMA’ system enables the combi-nation of the appropriate mode of development withthe appropriate forced-Sow technique by the use ofa mobile phase of optimized composition; this of-fers special possibilities for solving difRcult separ-ation problems. This system provides guidelines formethod development in planar chromatography.
See also: II/Chromatography: Thin-Layer (Planar)Chromatography: Historical Development; Instrumenta-tion; Layers; Modes of Development; Conventional;Modes of Development; Forced Flow OverpressuredLayer and Centrifugal Chromatography.
Further Reading
Geiss F (1987) Fundamentals of Thin Layer Chromatogra-phy (Planar Chromatography). Heidelberg: HuK thig.
Nyiredy Sz (1992) Planar chromatography. In: HeftmannE (ed.) Chromatography, 5th edition, pp. A109}150,Amsterdam: Elsevier.
Nyiredy Sz (1997) Solvent classiRcation for liquid chromato-graphy. In: Kaiser O, Kaiser RE, Gunz H and GuK nterW (eds) Chromatography, pp. 231}239. DuK sseldorf :InCom Sonderband.
Nyiredy Sz, Botz L, Sticher O (1989) ROTACHROM�.A new instrument for rotation planar chromatography(RPC). Journal of Planar Chromatography 2: 53}61.
Nyiredy Sz, Dallenbach-Toelke K and Sticher O (1988) The‘PRISMA’ optimization system in planar chromatogra-phy. Journal Planar Chromatography 1: 336}342.
Nyiredy Sz, FateH r Zs, Botz L and Sticher O (1992) The roleof chamber saturation in the optimization and transferof the mobile phase. Journal Planar Chromatography 5:308}315.
Schoenmakers PJ (1986) Optimization of Chromato-graphic Selectivity. Amsterdam: Elsevier.
Sherma J and Fried B (eds) (1995) Handbook of Thin-LayerChromatography. New York: Dekker.
Szepesi G and Nyiredy Sz (1995) Pharmaceuticals anddrugs. In: Fried B and Sherma J (eds) Handbook of ThinLayer Chromatography, pp. 819}876. Marcel Dekker:New York.
TyihaH k E and Mincsovics E (1988) Forced-Sow planarliquid chromatographic techniques. Journal of PlanarChromatography 1: 6}19.
4666 APPENDIX 2 /ESSENTIAL GUIDES TOMETHOD DEVELOPMENT IN THIN-LAYER (PLANAR) CHROMATOGRAPHY