Embed Size (px)
Citation preview
Establishment of an in vitro monolayer model of macularcorneal dystrophySumit Murab, Shibu Chameettachal and Sourabh Ghosh
Macular corneal dystrophy (MCD) is characterized by multiple punctate gray–white opacities in the corneal stromal region,due to the accumulation of abnormally sulfated keratan sulfates. We attempted to develop an in vitro model of MCD bysimulating the sulfation inhibition using sodium chlorate, a chemical inhibitor of 3′-phosphoadenosine-5′-phosphosulfate(PAPs). The SEM and micro-Raman spectroscopy results showed the hallmark feature of MCD. Further the gene expressionstudies elucidated the direct effect of sulfation inhibition on the WNT pathway, that in turn downregulated production ofmatrix metalloproteinases (MMPs), which causes abnormal matrix deposits leading to loss of transparency in vivo. It alsoresulted in downregulation of integrin and cadherin complexation that leads to disruption of the epithelial layer in theMCD affected corneas. This study offers a promising initial step toward establishing a relevant in vitro MCD disease model,to assess signaling transduction pathways and devise potential treatment strategies based on MMP administration to theMCD affected corneas.Laboratory Investigation (2016) 96, 1311–1326; doi:10.1038/labinvest.2016.102; published online 17 October 2016
Macular corneal dystrophy (MCD) is the most common of theclassical forms of inherited corneal dystrophies affectingstroma.1 MCD causes increasing corneal cloudiness resultingin progressive loss of vision. The endothelium, descemet’smembrane and stroma get affected in the diseased state as thekeratocytes and endothelial cells start accumulating intracyto-plasmic vacuoles of abnormally sulfated keratan sulfate,2 butthe epithelium is not involved in the degeneration process.Corneal thickness also gets reduced due to very dense packingof the collagen bundles as abnormally sulfated keratan sulfatemolecules fail to form the bridges between the collagenbundles.2
Despite the disease being one of the common causes of cornealblindness, there is no complete cure for it. Penetrating keratoplastyand deep anterior lamellar keratoplasty (DALK) are often done totreat the condition but the grafts again develop the haziness andthus fail.3 Penetrating keratoplasty offers an immediate improve-ment in the vision but is associated with a number of secondarycomplications. Although DALK offers much lesser complicationsbut is associated with poor vision acuity and higher recurrencerates.3 The cause of MCD has been identified, but thepathophysiology of disease progression is not fully understood.Thus in order to understand the disease pathology and to developrelated therapies and drugs; the development of an in vitro diseasemodel system would be exceedingly necessary.
MCD is classified into two subtypes I and II, dependingupon the presence or absence of sulfated keratan sulfatein the serum of the patients affected with the disease.4 Boththe subtypes of the disease are caused due to a mutationin the gene Carbohydrate Sulfotransferase 6 (CHST6),which encodes the enzyme GlcNAc-6-sulphotransferase(C-GlcNAc6ST). MCD type I is caused by several mutationsin the coding region of CHST6, while MCD type II is causedby deletions or replacements in the upstream region ofCHST6 which causes complete inhibition of expression ofCHST6 in the corneas.4 This mutation results in productionof inactive form of C-GlcNAc6ST enzyme which is respon-sible for the sulfation of keratan sulfate molecules.
Keratan sulfate is the predominant glycosaminoglycanpresent in the corneal stroma. GAGs play a very importantrole in creating the regular lattice structure of collagenbundles in the corneal stroma which is responsible for thetransparency of the tissue. The GAG molecules produceosmotic pressure as a result of the Donnan effect which helpsin keeping the collagen bundles at specific distance that helpscreate the collagen lattice structure. The negatively chargedsulfated side chains of these GAG molecules are basicallyresponsible for creating this osmotic balance that keeps thecorneal lattice intact.5 However, another theory suggests thatthe GAG molecules form duplex bridges between adjacent
Department of Textile Technology, Indian Institute of Technology Delhi, New Delhi, IndiaCorrespondence: Dr S Ghosh, PhD, Department of Textile Technology, Indian Institute of Technology Delhi, Hauz Khas, New Delhi 110016, India.E-mail: [email protected]
Received 26 July 2016; revised 13 August 2016; accepted 15 August 2016
www.laboratoryinvestigation.org | Laboratory Investigation | Volume 96 December 2016 1311
Laboratory Investigation (2016) 96, 1311–1326© 2016 USCAP, Inc All rights reserved 0023-6837/16
collagen bundle that help in maintaining the interfibrillardistance which is responsible for maintaining the regularcorneal lattice structure.6–8 Taken together, both of thesetheories indicate the central role of sulfated GAGs inmaintaining the corneal lattice structure, and in turn, thetransparency. Thus, a disturbance in sulfation of keratansulfate molecules would likely result in a disorder of thecorneal lattice structure and loss of its transparency in bothMCD types I and II.
The basic requirement for development of an in vitrodisease model of MCD is the inhibition of sulfation of keratansulfate molecules in the corneal stromal cells. In this study,sodium chlorate, which is a specific sulfotransferase inhibitor,was used to recapitulate the disease in vitro. Sodium chlorateinhibits 3′-phosphoadenosine-5′-phosphosulfate (PAPS)synthetase-2 which synthesizes PAPS.9 PAPS is the lonesulphur donor, thus inhibiting the enzyme which produces it;ceases the sulfation process of GAG molecules.9 Sodiumchlorate has been earlier demonstrated to inhibit sulfation ofproteoglycans during chondrogenesis.9 Sodium chlorate hasalso been reported for inducing desulfation of MG-63osteosarcoma cells which negatively affected cell proliferationwhen exposed for short or medium duration.10 Long-termexposure of sodium chlorate hindered mineralization process,as it resulted in disruption of BMP2/noggin signalingpathway.10 Sodium chlorate at a concentration of 10 mMwas found to hinder 96% of sulfate incorporation in theproteoglycans of human fibroblasts. It also slightly affectedthe incorporation of leucine and glucosamine while there wasno effect on degree of polymerization of the polysaccharidechain of the proteoglycans.11 Another study demonstrated theeffect of sodium chlorate on sulfation of heparan sulfate inMadin-Darby canine kidney cells.12 Taken together, there areconvincing evidences demonstrating role of sodium chloratein specifically obstructing sulfation of proteoglycans byinhibiting PAPS synthetase activity. This property wasexploited in the present study to design an in vitro diseasemodel system of MCD.
The abnormally sulfated keratan sulfate molecules do notget degraded by the remodeling enzymes present in thecorneal stroma. It will be interesting to know if theseabnormally sulfated keratan sulfate molecules can berecognized by the matrix remodeling enzymes. Second, whatis the effect of this undersulfation of keratan sulfate moleculeson the underlying endothelial layer? Knowledge of suchmechanisms will help us develop new clinical strategies totackle MCD without wasting the already scarce donor cornealtissue because of recurrence of the opacity.
Thus in the present study we have attempted to simulatethe in vivo conditions prevailing in MCD by inhibiting thesulfation of keratan sulfate in corneal stromal cells (kerato-cytes). This study can pave the way for more advanced modelsystems for the study of pathophysiology of this disease andcan also be used for the search of new molecules and clinicalstrategies for the treatment of this disease that makes a major
share in inducing corneal blindness. This study for the firsttime demonstrated the effect of inhibition of sulfation ofkeratan sulfate in corneal stromal cells; mimicking thephysiological conditions prevailing in MCD affected corneas.
METHODS AND MATERIALSCorneal Stromal Cell IsolationCadaveric goat eyes were collected from All India Institute ofMedical Sciences, New Delhi, India with prior approval fromthe Institute Ethical Committee. The goat corneas wereexcised from the ocular globe under sterile conditions andwashed several times in PBS (Himedia Laboratories; pH 7.2–7.4) containing 100 U/ml penicillin- streptomycin (Lonza,USA), 50 μg/ml gentamycin (Himedia Laboratories), and100 μg/ml amphotericin B (Himedia Laboratories; antibioticmixture).
Goat cornea was isolated from the ocular globe byremoving the sclera, soft connective tissue and the limbalrings. After separating the three layers carefully, the stromallayer was cut into small pieces of ~ 2–3 mm and washedextensively with antibiotic mixture. After thoroughly rinsingwith PBS, the fragmented tissue pieces were carefully liftedusing sterile forceps and incubated at the bottom of a T25tissue culture flask for 7 days in DMEM (CELLclone, India).The freshly isolated goat corneal stromal cells were expandedin DMEM with 10% fetal bovine serum (Biological Industries,India) and 100 U/ml penicillin–streptomycin. For serialpassaging, cells were washed with PBS and dissociated using0.25% trypsin (v/v; Lonza, USA) diluted in PBS. Standardculture conditions of 5% CO2 and 95% humidity at 37 °Cwere maintained.
Corneal Stromal Cell Culture with Sodium ChlorateCorneal stromal cells were cultured on coverslips in 24-wellplates with an initial seeding density of 1 × 10⁵ cells/well.Alpha MEM with 10% fetal bovine serum (HimediaLaboratories, Mumbai, India), 1% penicillin–streptomycin(Himedia Laboratories), 1% amphotericin (Himedia Labora-tories), 0.5% gentamicin (Himedia Laboratories), and 1%HEPES (Himedia Laboratories) was used for culturing thecells. Sodium chlorate (Sigma-Aldrich, Bengaluru, India) wasadded to the culture media at a concentration of 5, 10, and50 mM for three respective test groups while the controlgroup was cultured without sodium chlorate. Samples fordifferent studies were collected at day 1, 7, and 14. The groupshave been coded as given in Table 1 that has been usedthroughout the manuscript.
MTT AssayMTT assay was used to assess the metabolic activity of thecorneal stromal cells at days 1, 7, and 14. For the assay, cellswere incubated in a 9:1 ratio of standard culture media andMTT (3-(4,5-dimethylthiazol-2-yl)-2, 5-diphenyl tetrasodiumbromide, Millipore CT0-A, USA) and incubated for 6 h at 37 °C. Following incubation, the media-MTT solution was
In vitro model of macular corneal dystrophyS Murab et al
1312 Laboratory Investigation | Volume 96 December 2016 | www.laboratoryinvestigation.org
centrifuged to collect the insoluble formazan crystals whichwere solubilised in 1 ml DMSO to dissolve the crystals.Absorbance was measured at 560 nm using microplate reader(BIORAD iMark Microplate reader, USA). Standard calibra-tion curve was made by plotting the absorbance valuesobtained for the test samples (normalized to control) againstthe counted cell numbers.
DNA QuantificationDNA was isolated from the cultured corneal stromal cellsusing DNA extraction kit (Agilent Technologies, Germany,Catalog no. 200600-1) according to the manufacturer’sguidelines. Quantification was performed on a spectro-photometer (Thermo Scientific NanoDrop 2000c, USA).
Biochemical EstimationCorneal stromal cells were analyzed for GAG and collagenproduction after 14 days of culture and the values werenormalized to their DNA content. For biochemical analysis,the constructs were digested with proteinase K (SRL,Mumbai) at 60 °C overnight. Portions of the digest werethen analyzed to quantify sulfated GAG and hydroxyprolinecontent. GAG content was determined by dimethylmethyleneblue assay using chondroitin sulfate (Himedia Laboratories)calibration curve.13 The hydroxyproline content was con-verted to total collagen content using a 7.25 mass ratio ofcollagen to hydroxyproline. The spectrophotometric readingswere taken on an iMark Microplate Absorbance Reader, BIO-RAD.
Scanning Electron MicroscopyFor scanning electron microscopy (SEM) analysis, all sampleswere vacuum dried and coated with gold using a gold sputtercoater (EMITECH K550X, UK) at 25 mA for 1 min, to form acoating of ~ 15–20 nm thickness. Cellular morphology wasimaged using SEM at an accelerating voltage of 20 kV (ZeissEVO 50). Cellular morphology was monitored on thecoverslips seeded with corneal stromal cells on days 1 and 14.
Raman Analysis of ECMRaman spectra of the extracellular matrix was obtained usinga confocal laser dispersion Micro-Raman spectrometer (inViareflex, UK) system equipped with a 785 nm diode laser andintegrated with FTIR IlluminatIR II module.14 This systemwas combined with Leica microscope to allow scatter, line,
area mapping, and confocal depth profiling. All Ramanmeasurements were taken at × 10 magnification. The sampleswere placed on aluminium slides and measurements weretaken on five randomly selected points per sample with anintegration time of 10 s.
Histochemistry and Immunofluorescence StudiesAfter 14 days of culture, cells were fixed with 10%formaldehyde for 4 h, washed with PBS twice. The cells werethen stained with hematoxylin and eosin (H&E) to checkcellular morphology. Safranin-O and alcian blue staining wereused to visualize the extracellular GAG accumulated on thescaffold. Cell samples were blocked by 10% bovine serumalbumin for 30 min at room temperature, and incubated withprimary antibodies against Collagen type I (ab90395/Abcam),Cytokeratin 14 (KRT 14) (ab7800/Abcam), Fibronectin-1 (FN1) (ab6328/Abcam), E-cadherin (E-CD) (ab1416/Abcam),Actin (ACT) (PF7551/ECM Biosciences). and 4′,6′-diami-dino-2-phenylindole (DAPI/32670/Sigma Aldrich) was usedto stain the nucleus. Alexa Fluor 546 goat anti-mouse IgG(1:200, Invitrogen) was used for fluorescent labelling. Thesections were given three consecutive washed with PBS.Following this step, specimens were rinsed twice with PBS/Tween and the sections were subsequently mounted ontoslides. Immunostained sections were examined using Con-focal Laser Scanning Microscope (Leica TCS SP5, Germany).
Digital Image AnalysisFor image analysis, five randomly selected regions fromimmunohistochemistry micrographs were analyzed indepen-dently for each respective sample; one representative imagehas been shown. Color de-convolution technique was used asdescribed earlier for the analysis.15 Pure safranin-O/alcianblue staining patterns were assigned with an automated scoreafter observation and measurement of every histogram profilegenerated by Image J software (NIH, USA). The pixelnumbers of particular intensity were represented againstcorresponding intensity by the histogram profile. Thus,categorization was made into high positive, positive, andnegative zones depending on the color score intensity of theimages.
Quantitative Real-Time Reverse TranscriptionPolymerase Chain ReactionAll cell samples were disrupted in Trizol (Invitrogen) andtotal mRNA was extracted as per the manufacture’s protocol.The aqueous phase was transferred to an RNeasy mini-spincolumn (Qiagen, Germany), eluted and then the RNAsamples were reverse transcribed into cDNA according tothe manufacture’s protocol. The expression of COL1 (QT00037793), biglycan (QT00000483), MMP 1 (QT00014581), MMP 13 (QT00001764), RAC 1 (QT00065856),RHO A (QT00044723), SMAD 4 (QT00013174), β-catenin(β-CTNN) (QT00077882), KRT-14 (QT00052283), FN1 (QT00038024), CDH 1 (QT00080143), and GAPDH
Table 1 Code name for the three test and one control groups
Group Code
5 mM Sodium chlorate 5
10 mM Sodium chlorate 10
50 mM Sodium chlorate 50
Without sodium chlorate w/o
In vitro model of macular corneal dystrophyS Murab et al
www.laboratoryinvestigation.org | Laboratory Investigation | Volume 96 December 2016 1313
(QT00079247) were quantified using QuantiTect primer assay(Qiagen) and Rotorgene real-time PCR system (Qiagen,Germany), and were normalized against glyceraldehyde-3-phosphate-dehydrogenase (GAPDH) (QT00079247). Theanalysis was performed using Rotorgene Q software and therelative expression levels were calculated using 2-(ΔΔc(t))
method.16
Protein–Protein Interaction and Gene OntologicalStudiesThe protein–protein interactions were studied using adatabase of known and predicted protein interactionsSTRING 10.0 (Search Tool for the Retrieval of InteractingGenes/Proteins) software (http://string-db.org). Although thegene ontological studies were performed by using PANTHERgene ontological analysis server (http://pantherdb.org).17
Statistical AnalysisData have been presented as mean± s.d. The number ofreplicates has been indicated with the respective methods.Single factor paired one-tailed Student’s t-test was used forthe analysis of the significance of variations in loadingefficiency. Two-way ANOVA followed by Fischer’s post hocanalysis was used for the analysis of the significance of thevariations for all other experiments. The difference betweendifferent test and control groups was calculated by P-value.The groups with Po0.05 were considered as statisticallysignificantly different.
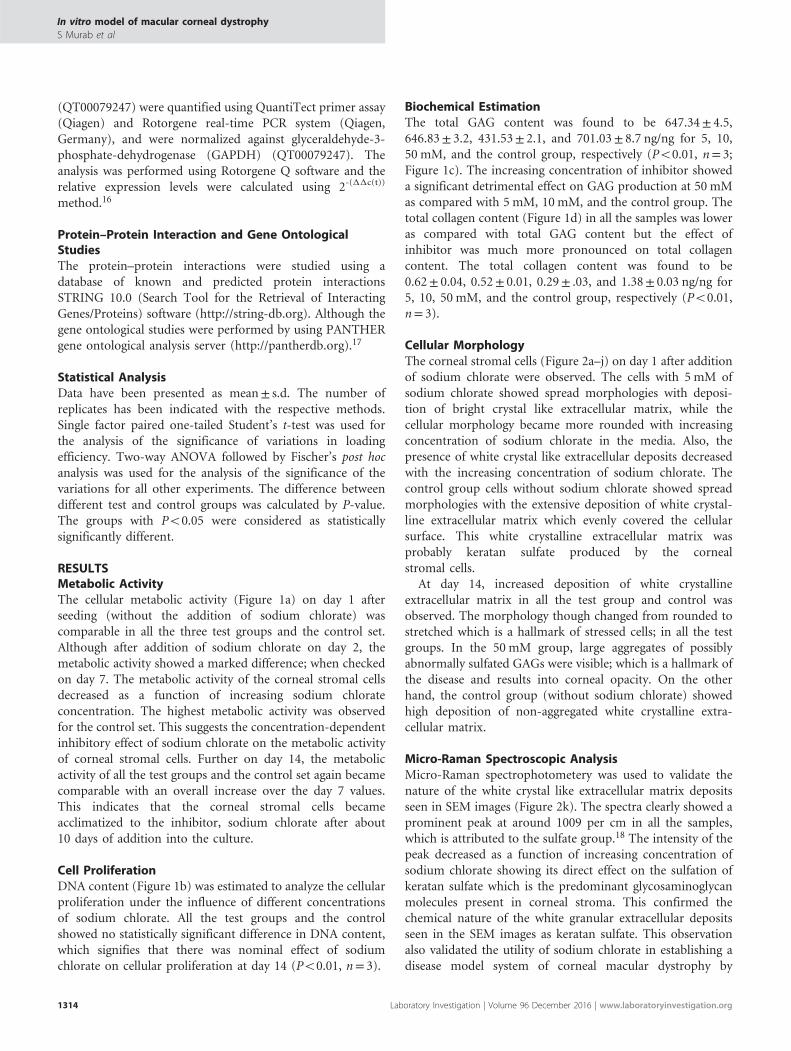
RESULTSMetabolic ActivityThe cellular metabolic activity (Figure 1a) on day 1 afterseeding (without the addition of sodium chlorate) wascomparable in all the three test groups and the control set.Although after addition of sodium chlorate on day 2, themetabolic activity showed a marked difference; when checkedon day 7. The metabolic activity of the corneal stromal cellsdecreased as a function of increasing sodium chlorateconcentration. The highest metabolic activity was observedfor the control set. This suggests the concentration-dependentinhibitory effect of sodium chlorate on the metabolic activityof corneal stromal cells. Further on day 14, the metabolicactivity of all the test groups and the control set again becamecomparable with an overall increase over the day 7 values.This indicates that the corneal stromal cells becameacclimatized to the inhibitor, sodium chlorate after about10 days of addition into the culture.
Cell ProliferationDNA content (Figure 1b) was estimated to analyze the cellularproliferation under the influence of different concentrationsof sodium chlorate. All the test groups and the controlshowed no statistically significant difference in DNA content,which signifies that there was nominal effect of sodiumchlorate on cellular proliferation at day 14 (Po0.01, n= 3).
Biochemical EstimationThe total GAG content was found to be 647.34± 4.5,646.83± 3.2, 431.53± 2.1, and 701.03± 8.7 ng/ng for 5, 10,50 mM, and the control group, respectively (Po0.01, n= 3;Figure 1c). The increasing concentration of inhibitor showeda significant detrimental effect on GAG production at 50 mMas compared with 5 mM, 10 mM, and the control group. Thetotal collagen content (Figure 1d) in all the samples was loweras compared with total GAG content but the effect ofinhibitor was much more pronounced on total collagencontent. The total collagen content was found to be0.62± 0.04, 0.52± 0.01, 0.29± .03, and 1.38± 0.03 ng/ng for5, 10, 50 mM, and the control group, respectively (Po0.01,n= 3).
Cellular MorphologyThe corneal stromal cells (Figure 2a–j) on day 1 after additionof sodium chlorate were observed. The cells with 5 mM ofsodium chlorate showed spread morphologies with deposi-tion of bright crystal like extracellular matrix, while thecellular morphology became more rounded with increasingconcentration of sodium chlorate in the media. Also, thepresence of white crystal like extracellular deposits decreasedwith the increasing concentration of sodium chlorate. Thecontrol group cells without sodium chlorate showed spreadmorphologies with the extensive deposition of white crystal-line extracellular matrix which evenly covered the cellularsurface. This white crystalline extracellular matrix wasprobably keratan sulfate produced by the cornealstromal cells.
At day 14, increased deposition of white crystallineextracellular matrix in all the test group and control wasobserved. The morphology though changed from rounded tostretched which is a hallmark of stressed cells; in all the testgroups. In the 50 mM group, large aggregates of possiblyabnormally sulfated GAGs were visible; which is a hallmark ofthe disease and results into corneal opacity. On the otherhand, the control group (without sodium chlorate) showedhigh deposition of non-aggregated white crystalline extra-cellular matrix.
Micro-Raman Spectroscopic AnalysisMicro-Raman spectrophotometery was used to validate thenature of the white crystal like extracellular matrix depositsseen in SEM images (Figure 2k). The spectra clearly showed aprominent peak at around 1009 per cm in all the samples,which is attributed to the sulfate group.18 The intensity of thepeak decreased as a function of increasing concentration ofsodium chlorate showing its direct effect on the sulfation ofkeratan sulfate which is the predominant glycosaminoglycanmolecules present in corneal stroma. This confirmed thechemical nature of the white granular extracellular depositsseen in the SEM images as keratan sulfate. This observationalso validated the utility of sodium chlorate in establishing adisease model system of corneal macular dystrophy by
In vitro model of macular corneal dystrophyS Murab et al
1314 Laboratory Investigation | Volume 96 December 2016 | www.laboratoryinvestigation.org
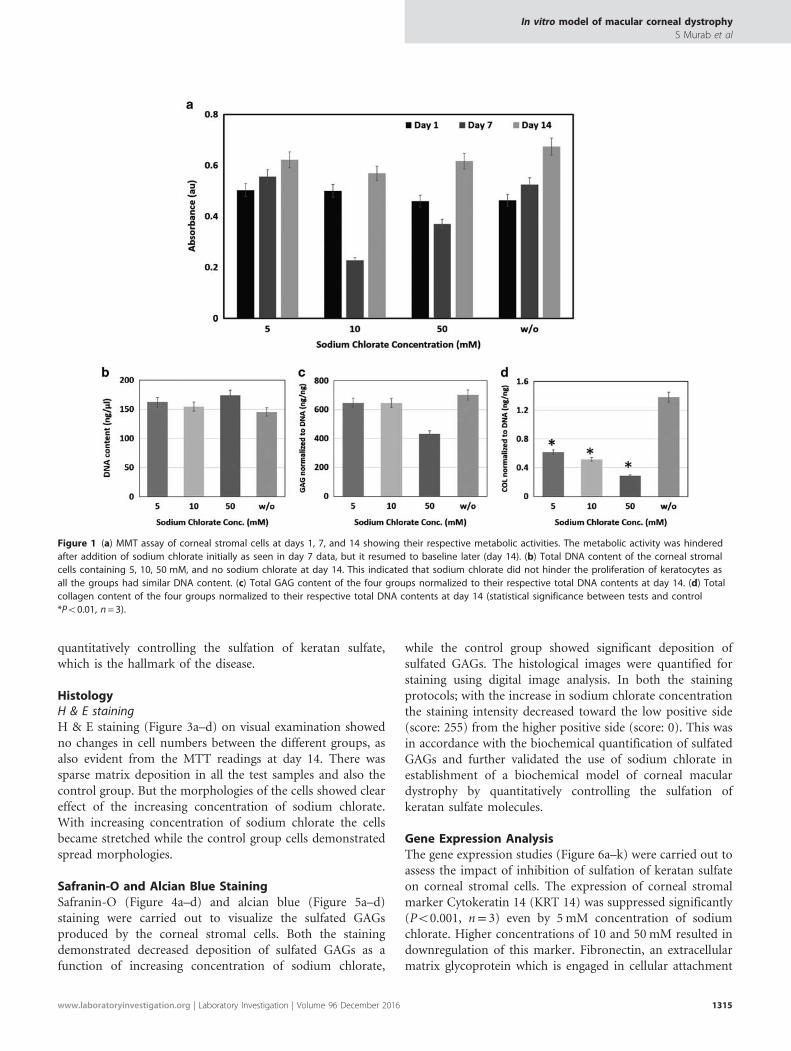
quantitatively controlling the sulfation of keratan sulfate,which is the hallmark of the disease.
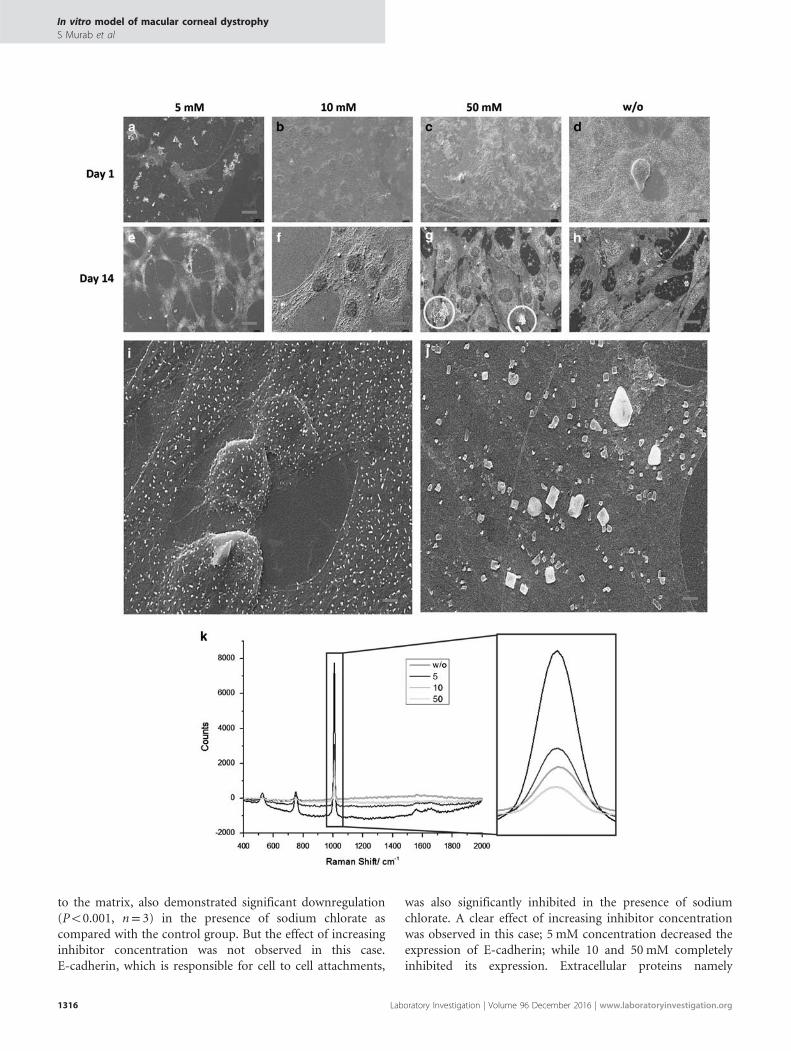
HistologyH & E stainingH & E staining (Figure 3a–d) on visual examination showedno changes in cell numbers between the different groups, asalso evident from the MTT readings at day 14. There wassparse matrix deposition in all the test samples and also thecontrol group. But the morphologies of the cells showed cleareffect of the increasing concentration of sodium chlorate.With increasing concentration of sodium chlorate the cellsbecame stretched while the control group cells demonstratedspread morphologies.
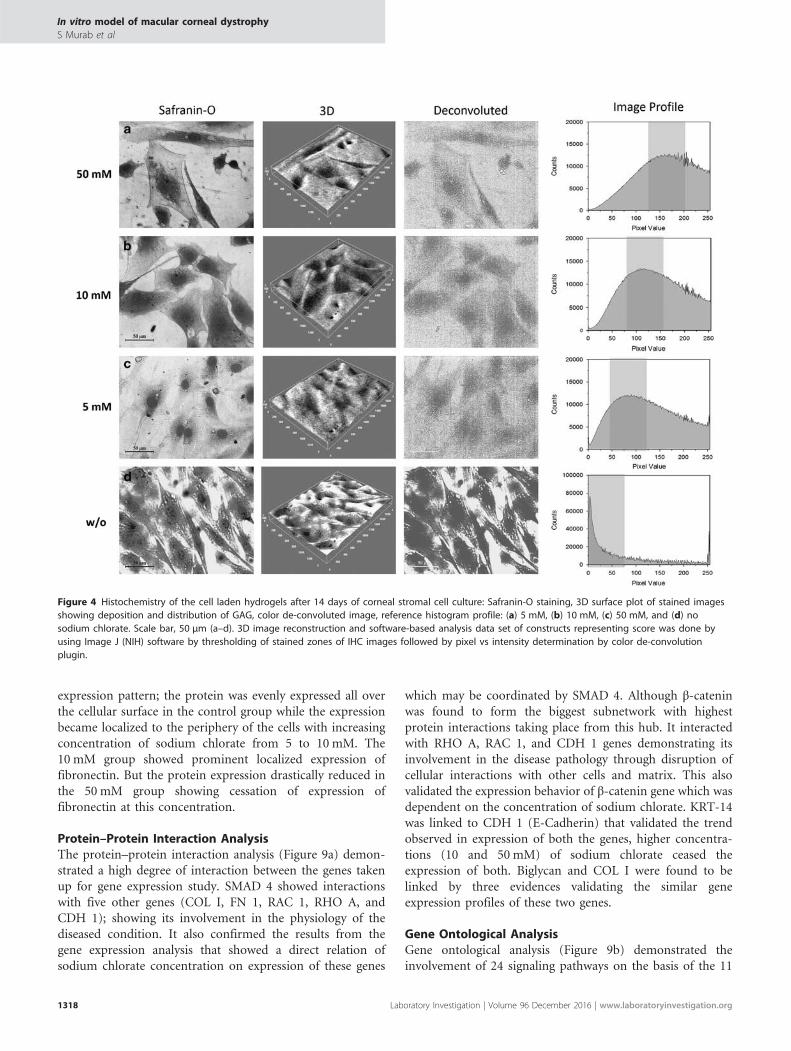
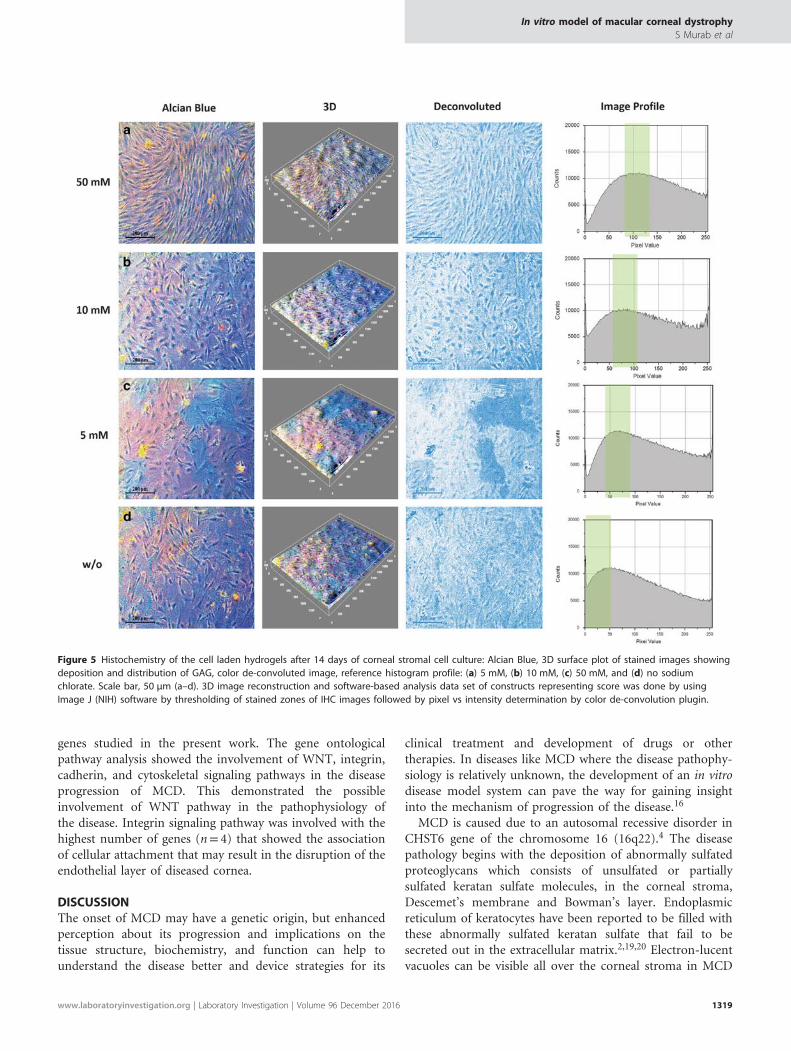
Safranin-O and Alcian Blue StainingSafranin-O (Figure 4a–d) and alcian blue (Figure 5a–d)staining were carried out to visualize the sulfated GAGsproduced by the corneal stromal cells. Both the stainingdemonstrated decreased deposition of sulfated GAGs as afunction of increasing concentration of sodium chlorate,
while the control group showed significant deposition ofsulfated GAGs. The histological images were quantified forstaining using digital image analysis. In both the stainingprotocols; with the increase in sodium chlorate concentrationthe staining intensity decreased toward the low positive side(score: 255) from the higher positive side (score: 0). This wasin accordance with the biochemical quantification of sulfatedGAGs and further validated the use of sodium chlorate inestablishment of a biochemical model of corneal maculardystrophy by quantitatively controlling the sulfation ofkeratan sulfate molecules.
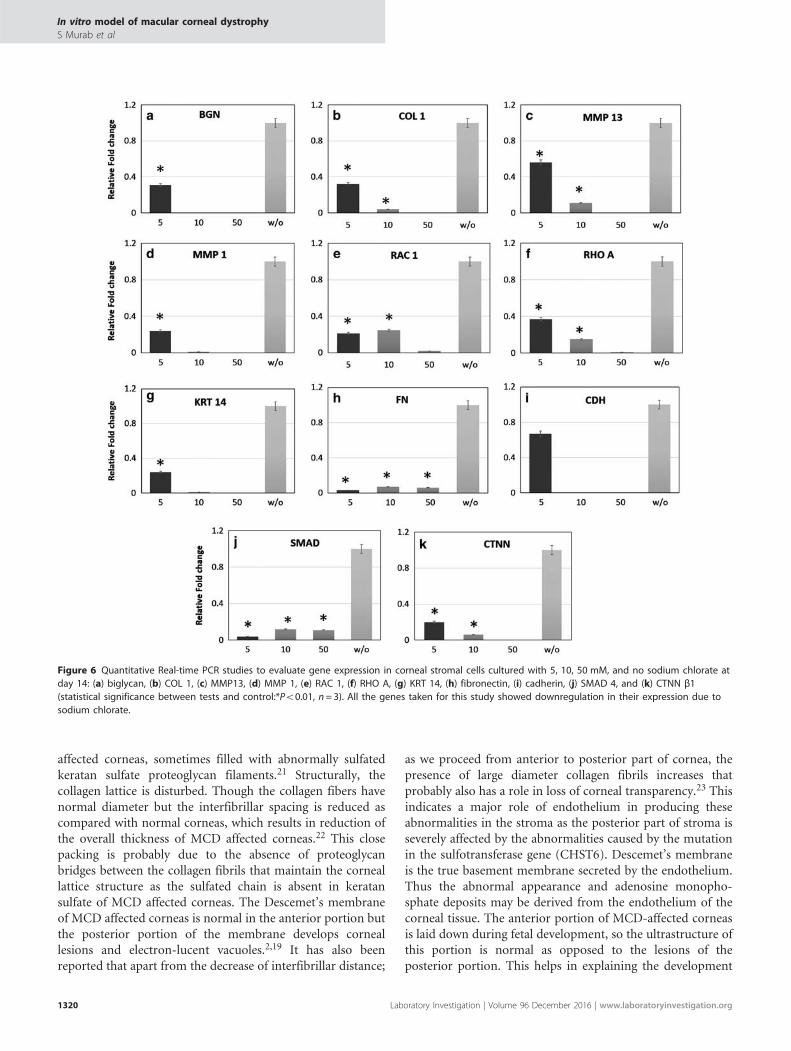
Gene Expression AnalysisThe gene expression studies (Figure 6a–k) were carried out toassess the impact of inhibition of sulfation of keratan sulfateon corneal stromal cells. The expression of corneal stromalmarker Cytokeratin 14 (KRT 14) was suppressed significantly(Po0.001, n= 3) even by 5 mM concentration of sodiumchlorate. Higher concentrations of 10 and 50 mM resulted indownregulation of this marker. Fibronectin, an extracellularmatrix glycoprotein which is engaged in cellular attachment
Figure 1 (a) MMT assay of corneal stromal cells at days 1, 7, and 14 showing their respective metabolic activities. The metabolic activity was hinderedafter addition of sodium chlorate initially as seen in day 7 data, but it resumed to baseline later (day 14). (b) Total DNA content of the corneal stromalcells containing 5, 10, 50 mM, and no sodium chlorate at day 14. This indicated that sodium chlorate did not hinder the proliferation of keratocytes asall the groups had similar DNA content. (c) Total GAG content of the four groups normalized to their respective total DNA contents at day 14. (d) Totalcollagen content of the four groups normalized to their respective total DNA contents at day 14 (statistical significance between tests and control*Po0.01, n= 3).
In vitro model of macular corneal dystrophyS Murab et al
www.laboratoryinvestigation.org | Laboratory Investigation | Volume 96 December 2016 1315
to the matrix, also demonstrated significant downregulation(Po0.001, n= 3) in the presence of sodium chlorate ascompared with the control group. But the effect of increasinginhibitor concentration was not observed in this case.E-cadherin, which is responsible for cell to cell attachments,
was also significantly inhibited in the presence of sodiumchlorate. A clear effect of increasing inhibitor concentrationwas observed in this case; 5 mM concentration decreased theexpression of E-cadherin; while 10 and 50 mM completelyinhibited its expression. Extracellular proteins namely
In vitro model of macular corneal dystrophyS Murab et al
1316 Laboratory Investigation | Volume 96 December 2016 | www.laboratoryinvestigation.org
biglycan and collagen type I also demonstrated a similar trendof inhibitor concentration on their expression patterns.Biglycan, which is a core protein of proteoglycans, demon-strated a downregulation in its expression as a result of 5 mMinhibitor concentration, while higher concentrations of 10and 50 mM inhibited its expression. COL I though showed asimilar trend but its expression ceased at 50 mM concentra-tion. RHO A and RAC 1 genes also showed inhibition becauseof sodium chlorate. The expression of RHO A decreased as afunction of increasing inhibitor concentration, while RAC 1showed a downregulation at all concentrations but not as afunction of increasing inhibitor concentration. Fibronectinshowed a concentration independent inhibition due tosodium chlorate while KRT 14 and E-cadherin bothdemonstrated a concentration-dependent gene expressioninhibition. Both the genes ceased to express at 10 and 50 mMconcentrations of sodium chlorate. To analyze the signalingpathways involved in the effect of sodium chlorate on cornealstromal cells, SMAD 4 from the SMAD-MAPK pathway andβ-catenin from the WNT pathway were studied. SMAD 4showed inhibition of its expression due to sodium chloratebut the expression was not a function of the increasinginhibitor concentration. Although β-catenin expressiondecreased as a function of increasing sodium chlorateconcentration demonstrating a direct involvement of WNT
pathway in the detrimental action caused by sodium chlorateon corneal stromal cells.
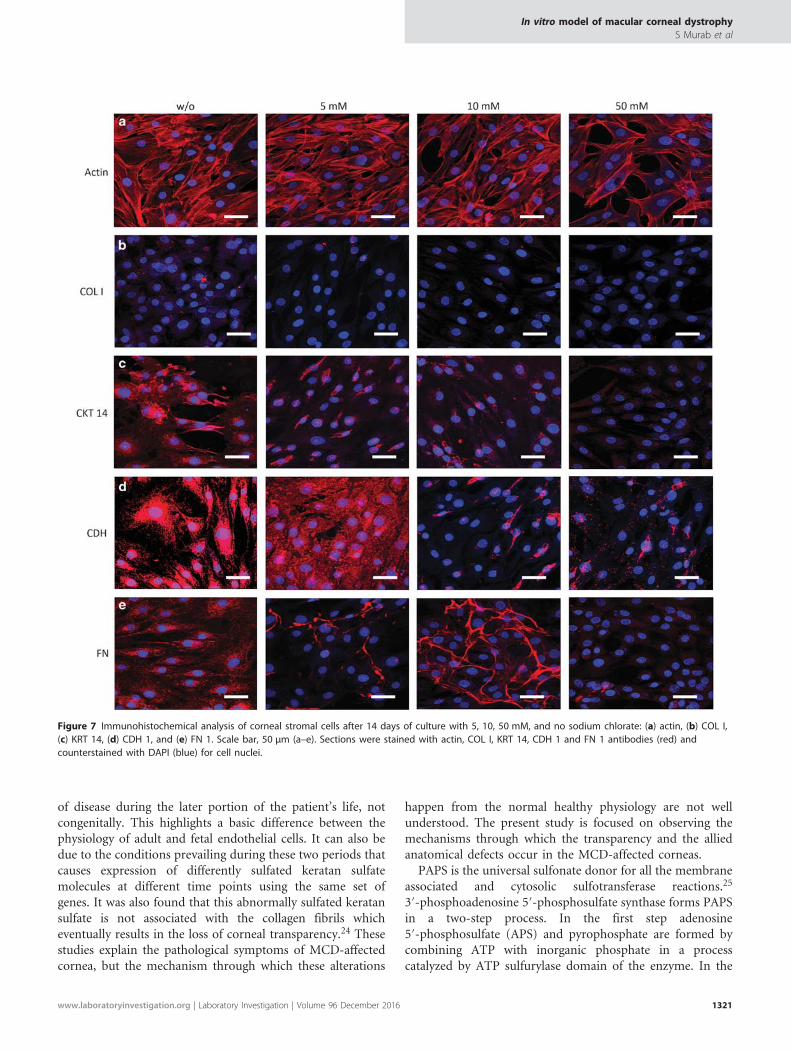
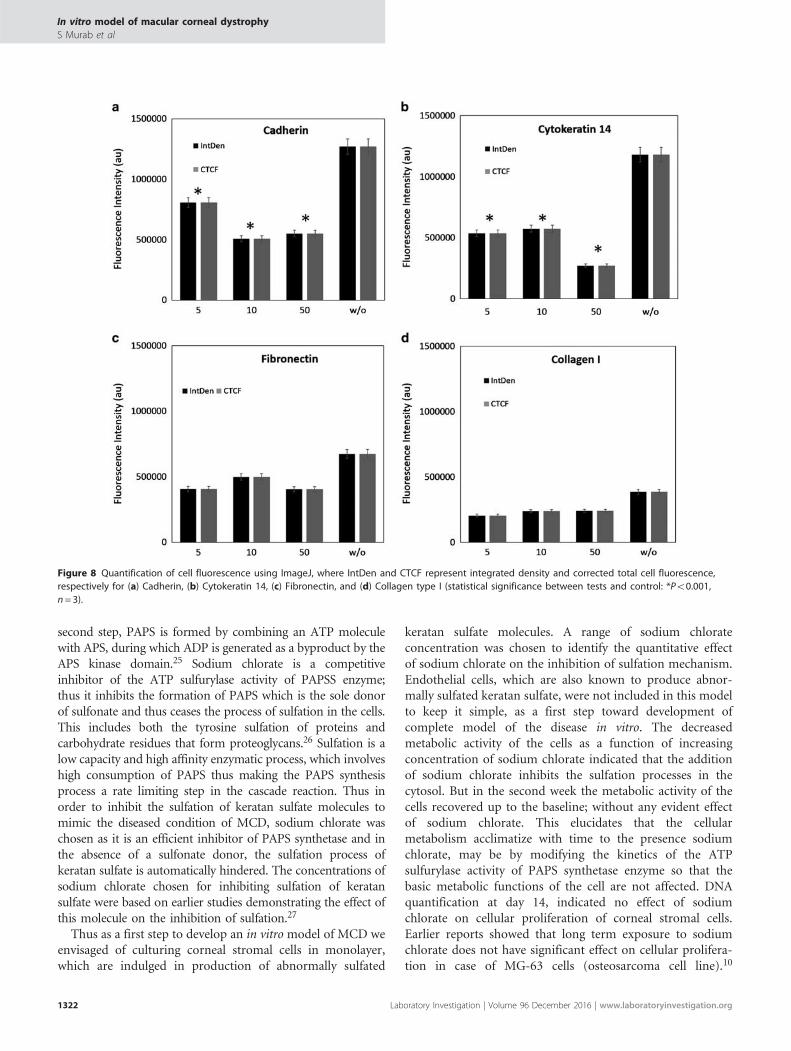
ImmunohistochemistryImmunohistochemistry (Figure 7a–e) and subsequent fluor-escence quantification (Figure 8a–d) was performed. Immu-nohistochemical staining confirmed the change inmorphology observed as a function of increasing sodiumchlorate concentration. The stretched actin cytoskeleton wasnoticed a function of increasing sodium chlorate concentra-tion. The control group without sodium chlorate showed cellswith relaxed actin cytoskeleton and spread morphologies,thus validating the H&E results. The immunostaining resultsshowed minimum expression of Collagen type I in all the testgroups and control, validating the gene expression studies andbiochemical estimation. Cytokeratin 14 expression wasdecreased as a function of increasing concentration of sodiumchlorate. In contrast, the control group of cells showedsignificant (Po0.001, n= 3) expression of Cytokeratin 14protein. E-Cadherin showed a diffused expression throughoutthe cellular surface in the control group. The test groupsshowed decreased expression of E-Cadherin as a function ofincreasing concentration of sodium chlorate. The expressionpattern also became localized as longitudinal patches that mayindicate the stress-induced changes in cellular attachment;because of sodium chlorate. Fibronectin showed a peculiar
Figure 2 SEM micrographs of corneal stromal cells treated with 5, 10, 50 mM, and no sodium chlorate at day 1 (a–d) and day 14 (e–h), respectively(scale bar, 10 μm). In Figure 1g, the circles highlight the aggregates of abnormally sulfated keratan sulfate that are the hallmark of MCD and causes lossof transparency of corneas. Magnified images of the keratan sulfate crystals deposited by the corneal stromal cells in the control group: (i) scale bar,3 μm, (j) scale bar, 1 μm. (k) Micro-Raman spectra of the four groups with 5 mM, 10 mM, 50 mm, and no sodium chlorate. The spectra show a clearpeak of sulfate at 1009 per cm. The peak intensity decreases with the increasing concentration of sodium chlorate in the culture demonstrating a clearinhibition of sulfation process in the corneal stromal cells due to sodium chlorate (inset shows a zoomed view of the four peaks for comparison).
Figure 3 H&E staining of the corneal stromal cells at day 14 with (a) 5 mM, (b) 10 mM, (c) 50 mM, and (d) no sodium chlorate. Scale bar, 50 μm (a–d).The increasing concentration of sodium chlorate showed a marked effect on the morphology of the corneal stromal cells as the cells started stretchingwith its increasing concentration. The matrix staining also decreased with the increasing concentration of sodium chlorate showing its negative effecton matrix production.
In vitro model of macular corneal dystrophyS Murab et al
www.laboratoryinvestigation.org | Laboratory Investigation | Volume 96 December 2016 1317
expression pattern; the protein was evenly expressed all overthe cellular surface in the control group while the expressionbecame localized to the periphery of the cells with increasingconcentration of sodium chlorate from 5 to 10 mM. The10 mM group showed prominent localized expression offibronectin. But the protein expression drastically reduced inthe 50 mM group showing cessation of expression offibronectin at this concentration.
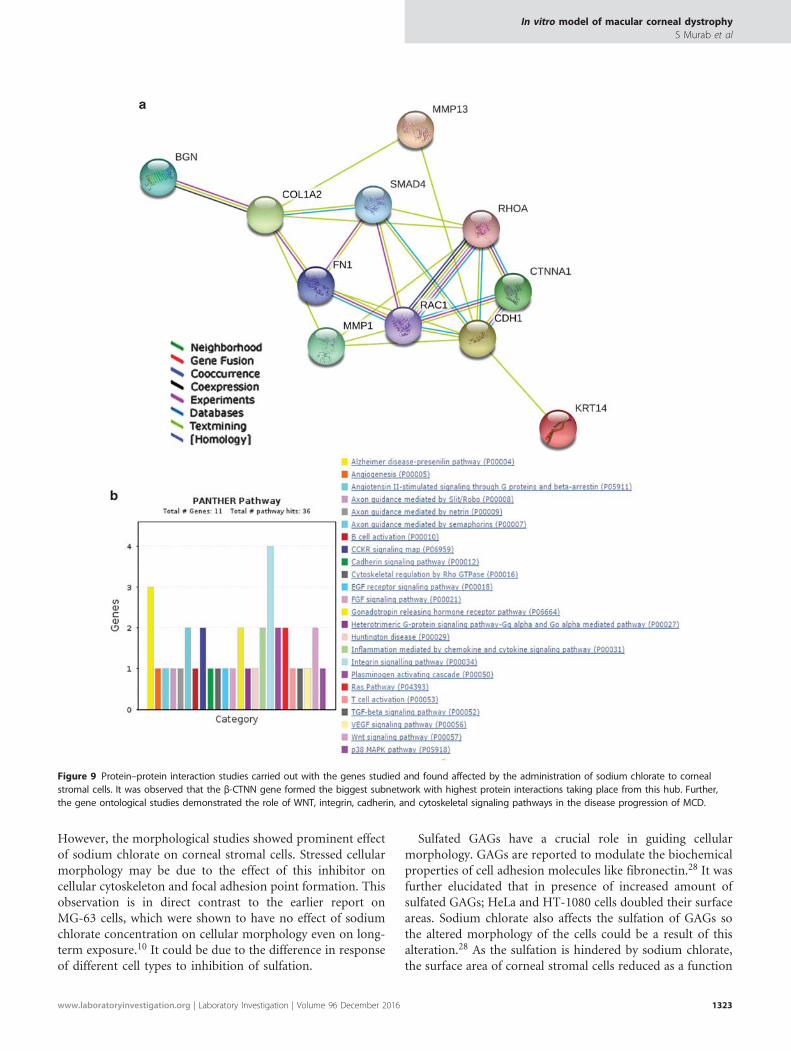
Protein–Protein Interaction AnalysisThe protein–protein interaction analysis (Figure 9a) demon-strated a high degree of interaction between the genes takenup for gene expression study. SMAD 4 showed interactionswith five other genes (COL I, FN 1, RAC 1, RHO A, andCDH 1); showing its involvement in the physiology of thediseased condition. It also confirmed the results from thegene expression analysis that showed a direct relation ofsodium chlorate concentration on expression of these genes
which may be coordinated by SMAD 4. Although β-cateninwas found to form the biggest subnetwork with highestprotein interactions taking place from this hub. It interactedwith RHO A, RAC 1, and CDH 1 genes demonstrating itsinvolvement in the disease pathology through disruption ofcellular interactions with other cells and matrix. This alsovalidated the expression behavior of β-catenin gene which wasdependent on the concentration of sodium chlorate. KRT-14was linked to CDH 1 (E-Cadherin) that validated the trendobserved in expression of both the genes, higher concentra-tions (10 and 50 mM) of sodium chlorate ceased theexpression of both. Biglycan and COL I were found to belinked by three evidences validating the similar geneexpression profiles of these two genes.
Gene Ontological AnalysisGene ontological analysis (Figure 9b) demonstrated theinvolvement of 24 signaling pathways on the basis of the 11
Figure 4 Histochemistry of the cell laden hydrogels after 14 days of corneal stromal cell culture: Safranin-O staining, 3D surface plot of stained imagesshowing deposition and distribution of GAG, color de-convoluted image, reference histogram profile: (a) 5 mM, (b) 10 mM, (c) 50 mM, and (d) nosodium chlorate. Scale bar, 50 μm (a–d). 3D image reconstruction and software-based analysis data set of constructs representing score was done byusing Image J (NIH) software by thresholding of stained zones of IHC images followed by pixel vs intensity determination by color de-convolutionplugin.
In vitro model of macular corneal dystrophyS Murab et al
1318 Laboratory Investigation | Volume 96 December 2016 | www.laboratoryinvestigation.org
genes studied in the present work. The gene ontologicalpathway analysis showed the involvement of WNT, integrin,cadherin, and cytoskeletal signaling pathways in the diseaseprogression of MCD. This demonstrated the possibleinvolvement of WNT pathway in the pathophysiology ofthe disease. Integrin signaling pathway was involved with thehighest number of genes (n= 4) that showed the associationof cellular attachment that may result in the disruption of theendothelial layer of diseased cornea.
DISCUSSIONThe onset of MCD may have a genetic origin, but enhancedperception about its progression and implications on thetissue structure, biochemistry, and function can help tounderstand the disease better and device strategies for its
clinical treatment and development of drugs or othertherapies. In diseases like MCD where the disease pathophy-siology is relatively unknown, the development of an in vitrodisease model system can pave the way for gaining insightinto the mechanism of progression of the disease.16
MCD is caused due to an autosomal recessive disorder inCHST6 gene of the chromosome 16 (16q22).4 The diseasepathology begins with the deposition of abnormally sulfatedproteoglycans which consists of unsulfated or partiallysulfated keratan sulfate molecules, in the corneal stroma,Descemet’s membrane and Bowman’s layer. Endoplasmicreticulum of keratocytes have been reported to be filled withthese abnormally sulfated keratan sulfate that fail to besecreted out in the extracellular matrix.2,19,20 Electron-lucentvacuoles can be visible all over the corneal stroma in MCD
Figure 5 Histochemistry of the cell laden hydrogels after 14 days of corneal stromal cell culture: Alcian Blue, 3D surface plot of stained images showingdeposition and distribution of GAG, color de-convoluted image, reference histogram profile: (a) 5 mM, (b) 10 mM, (c) 50 mM, and (d) no sodiumchlorate. Scale bar, 50 μm (a–d). 3D image reconstruction and software-based analysis data set of constructs representing score was done by usingImage J (NIH) software by thresholding of stained zones of IHC images followed by pixel vs intensity determination by color de-convolution plugin.
In vitro model of macular corneal dystrophyS Murab et al
www.laboratoryinvestigation.org | Laboratory Investigation | Volume 96 December 2016 1319
affected corneas, sometimes filled with abnormally sulfatedkeratan sulfate proteoglycan filaments.21 Structurally, thecollagen lattice is disturbed. Though the collagen fibers havenormal diameter but the interfibrillar spacing is reduced ascompared with normal corneas, which results in reduction ofthe overall thickness of MCD affected corneas.22 This closepacking is probably due to the absence of proteoglycanbridges between the collagen fibrils that maintain the corneallattice structure as the sulfated chain is absent in keratansulfate of MCD affected corneas. The Descemet’s membraneof MCD affected corneas is normal in the anterior portion butthe posterior portion of the membrane develops corneallesions and electron-lucent vacuoles.2,19 It has also beenreported that apart from the decrease of interfibrillar distance;
as we proceed from anterior to posterior part of cornea, thepresence of large diameter collagen fibrils increases thatprobably also has a role in loss of corneal transparency.23 Thisindicates a major role of endothelium in producing theseabnormalities in the stroma as the posterior part of stroma isseverely affected by the abnormalities caused by the mutationin the sulfotransferase gene (CHST6). Descemet’s membraneis the true basement membrane secreted by the endothelium.Thus the abnormal appearance and adenosine monopho-sphate deposits may be derived from the endothelium of thecorneal tissue. The anterior portion of MCD-affected corneasis laid down during fetal development, so the ultrastructure ofthis portion is normal as opposed to the lesions of theposterior portion. This helps in explaining the development
Figure 6 Quantitative Real-time PCR studies to evaluate gene expression in corneal stromal cells cultured with 5, 10, 50 mM, and no sodium chlorate atday 14: (a) biglycan, (b) COL 1, (c) MMP13, (d) MMP 1, (e) RAC 1, (f) RHO A, (g) KRT 14, (h) fibronectin, (i) cadherin, (j) SMAD 4, and (k) CTNN β1(statistical significance between tests and control:*Po0.01, n= 3). All the genes taken for this study showed downregulation in their expression due tosodium chlorate.
In vitro model of macular corneal dystrophyS Murab et al
1320 Laboratory Investigation | Volume 96 December 2016 | www.laboratoryinvestigation.org
of disease during the later portion of the patient’s life, notcongenitally. This highlights a basic difference between thephysiology of adult and fetal endothelial cells. It can also bedue to the conditions prevailing during these two periods thatcauses expression of differently sulfated keratan sulfatemolecules at different time points using the same set ofgenes. It was also found that this abnormally sulfated keratansulfate is not associated with the collagen fibrils whicheventually results in the loss of corneal transparency.24 Thesestudies explain the pathological symptoms of MCD-affectedcornea, but the mechanism through which these alterations
happen from the normal healthy physiology are not wellunderstood. The present study is focused on observing themechanisms through which the transparency and the alliedanatomical defects occur in the MCD-affected corneas.
PAPS is the universal sulfonate donor for all the membraneassociated and cytosolic sulfotransferase reactions.25
3′-phosphoadenosine 5′-phosphosulfate synthase forms PAPSin a two-step process. In the first step adenosine5′-phosphosulfate (APS) and pyrophosphate are formed bycombining ATP with inorganic phosphate in a processcatalyzed by ATP sulfurylase domain of the enzyme. In the
Figure 7 Immunohistochemical analysis of corneal stromal cells after 14 days of culture with 5, 10, 50 mM, and no sodium chlorate: (a) actin, (b) COL I,(c) KRT 14, (d) CDH 1, and (e) FN 1. Scale bar, 50 μm (a–e). Sections were stained with actin, COL I, KRT 14, CDH 1 and FN 1 antibodies (red) andcounterstained with DAPI (blue) for cell nuclei.
In vitro model of macular corneal dystrophyS Murab et al
www.laboratoryinvestigation.org | Laboratory Investigation | Volume 96 December 2016 1321
second step, PAPS is formed by combining an ATP moleculewith APS, during which ADP is generated as a byproduct by theAPS kinase domain.25 Sodium chlorate is a competitiveinhibitor of the ATP sulfurylase activity of PAPSS enzyme;thus it inhibits the formation of PAPS which is the sole donorof sulfonate and thus ceases the process of sulfation in the cells.This includes both the tyrosine sulfation of proteins andcarbohydrate residues that form proteoglycans.26 Sulfation is alow capacity and high affinity enzymatic process, which involveshigh consumption of PAPS thus making the PAPS synthesisprocess a rate limiting step in the cascade reaction. Thus inorder to inhibit the sulfation of keratan sulfate molecules tomimic the diseased condition of MCD, sodium chlorate waschosen as it is an efficient inhibitor of PAPS synthetase and inthe absence of a sulfonate donor, the sulfation process ofkeratan sulfate is automatically hindered. The concentrations ofsodium chlorate chosen for inhibiting sulfation of keratansulfate were based on earlier studies demonstrating the effect ofthis molecule on the inhibition of sulfation.27
Thus as a first step to develop an in vitro model of MCD weenvisaged of culturing corneal stromal cells in monolayer,which are indulged in production of abnormally sulfated
keratan sulfate molecules. A range of sodium chlorateconcentration was chosen to identify the quantitative effectof sodium chlorate on the inhibition of sulfation mechanism.Endothelial cells, which are also known to produce abnor-mally sulfated keratan sulfate, were not included in this modelto keep it simple, as a first step toward development ofcomplete model of the disease in vitro. The decreasedmetabolic activity of the cells as a function of increasingconcentration of sodium chlorate indicated that the additionof sodium chlorate inhibits the sulfation processes in thecytosol. But in the second week the metabolic activity of thecells recovered up to the baseline; without any evident effectof sodium chlorate. This elucidates that the cellularmetabolism acclimatize with time to the presence sodiumchlorate, may be by modifying the kinetics of the ATPsulfurylase activity of PAPS synthetase enzyme so that thebasic metabolic functions of the cell are not affected. DNAquantification at day 14, indicated no effect of sodiumchlorate on cellular proliferation of corneal stromal cells.Earlier reports showed that long term exposure to sodiumchlorate does not have significant effect on cellular prolifera-tion in case of MG-63 cells (osteosarcoma cell line).10
Figure 8 Quantification of cell fluorescence using ImageJ, where IntDen and CTCF represent integrated density and corrected total cell fluorescence,respectively for (a) Cadherin, (b) Cytokeratin 14, (c) Fibronectin, and (d) Collagen type I (statistical significance between tests and control: *Po0.001,n= 3).
In vitro model of macular corneal dystrophyS Murab et al
1322 Laboratory Investigation | Volume 96 December 2016 | www.laboratoryinvestigation.org
However, the morphological studies showed prominent effectof sodium chlorate on corneal stromal cells. Stressed cellularmorphology may be due to the effect of this inhibitor oncellular cytoskeleton and focal adhesion point formation. Thisobservation is in direct contrast to the earlier report onMG-63 cells, which were shown to have no effect of sodiumchlorate concentration on cellular morphology even on long-term exposure.10 It could be due to the difference in responseof different cell types to inhibition of sulfation.
Sulfated GAGs have a crucial role in guiding cellularmorphology. GAGs are reported to modulate the biochemicalproperties of cell adhesion molecules like fibronectin.28 It wasfurther elucidated that in presence of increased amount ofsulfated GAGs; HeLa and HT-1080 cells doubled their surfaceareas. Sodium chlorate also affects the sulfation of GAGs sothe altered morphology of the cells could be a result of thisalteration.28 As the sulfation is hindered by sodium chlorate,the surface area of corneal stromal cells reduced as a function
Figure 9 Protein–protein interaction studies carried out with the genes studied and found affected by the administration of sodium chlorate to cornealstromal cells. It was observed that the β-CTNN gene formed the biggest subnetwork with highest protein interactions taking place from this hub. Further,the gene ontological studies demonstrated the role of WNT, integrin, cadherin, and cytoskeletal signaling pathways in the disease progression of MCD.
In vitro model of macular corneal dystrophyS Murab et al
www.laboratoryinvestigation.org | Laboratory Investigation | Volume 96 December 2016 1323
of its increasing concentration. Syndecans, a family oftransmembrane heparan sulfate proteoglycans, regulate cel-lular morphology in mammary epithelial tumor cells.29
Introduction of a normal copy of syndecan gene in thetumor cells could recover their normal epithelial cellmorphology.29 This indicates that any alteration in thesulfated GAGs may cause a change in cellular morphologydirectly. Though in the present study we investigated theeffect of abnormal sulfation of keratan sulfate; but the effectof abnormal sulfation of other proteoglycans caused by thesulfation inhibitor cannot be avoided. The total sulfated GAGcontent as observed in the biochemical estimation; reduced asa function of increasing concentration of sodium chlorate inthe test groups, validating the use of this PAPS synthetaseinhibitor in creating MCD disease model. Raman micro-spectroscopy was to confirm the biochemical studies and thekeratan sulfate deposits seen in the SEM images, whichconfirmed the presence of keratan sulfate in all the samplesand the decreasing amount of sulfate with the increasingconcentration of sodium chlorate. Interestingly, the totalcollagen content also reduced with the increasing concentra-tion of sodium chlorate in the corneal stromal cells. Cornealstroma mainly contains collagen type I, thus indicating thatsodium chlorate has a negative effect of expression of collagentype I. Earlier it was shown that sodium chlorate enhancesexpression of collagen type II in chondrocytes.9
For gene expression studies, three sets of genes werechosen; related to cellular adhesion, extracellular matrixmodelling and signaling pathway for ECM production. Thesethree set of genes were chosen to assess the effect of inhibitionof keratan sulfate sulfation in generating the hallmark
pathological symptoms of MCD. Gene expression studiesdemonstrated a direct negative effect of sodium chlorate onthe expression of: extracellular matrix proteins (biglycan andcollagen type I), matrix remodeling enzymes (MMP I andMMP 13), focal adhesion proteins (RAC 1 and RHO A),cellular adhesion proteins (fibronectin and E-cadherin), andcorneal stromal cell marker (Cytokeratin 14). The expressionof Cytokeratin 14 reduced with the increasing concentrationof sodium chlorate, indicating a dedifferentiation or loss ofcorneal stromal phenotype in the cells.30 Although the controlgroup of cells expressed high levels of expression for themarker indicating their normal phenotype. Expression ofextracellular matrix proteins was also negatively affected bythe increasing concentration of sodium chlorate indicatingthe effect of poor sulfation on the expression of these genesincluding biglycan and collagen type I. Biglycan is a smallleucine rich proteoglycan (SLRP) whose expression isgenerally increased in diseased conditions of cornea such asbullous keratopathy, chronic edema and keratoconus.31 Butthe sulfation inhibition in the present model of MCD caused adecrease in its expression with the increasing concentration ofthe inhibitor. This indicates that production of all sulfatedGAGs including SLRPs is negatively affected by inhibition ofsulfation. This also validated the results from biochemicalestimations that indicated a decrease in total sulfated GAGcontent, with the increasing inhibitor concentration. Collagentype I gene expression further validated the biochemicalestimation that inhibition of sulfation causes a detrimentaleffect on its expression. Catabolic activities are also equallyimportant for the dynamic remodeling of the corneal tissue,thus the gene expression of MMP 1 and MMP 13 which are
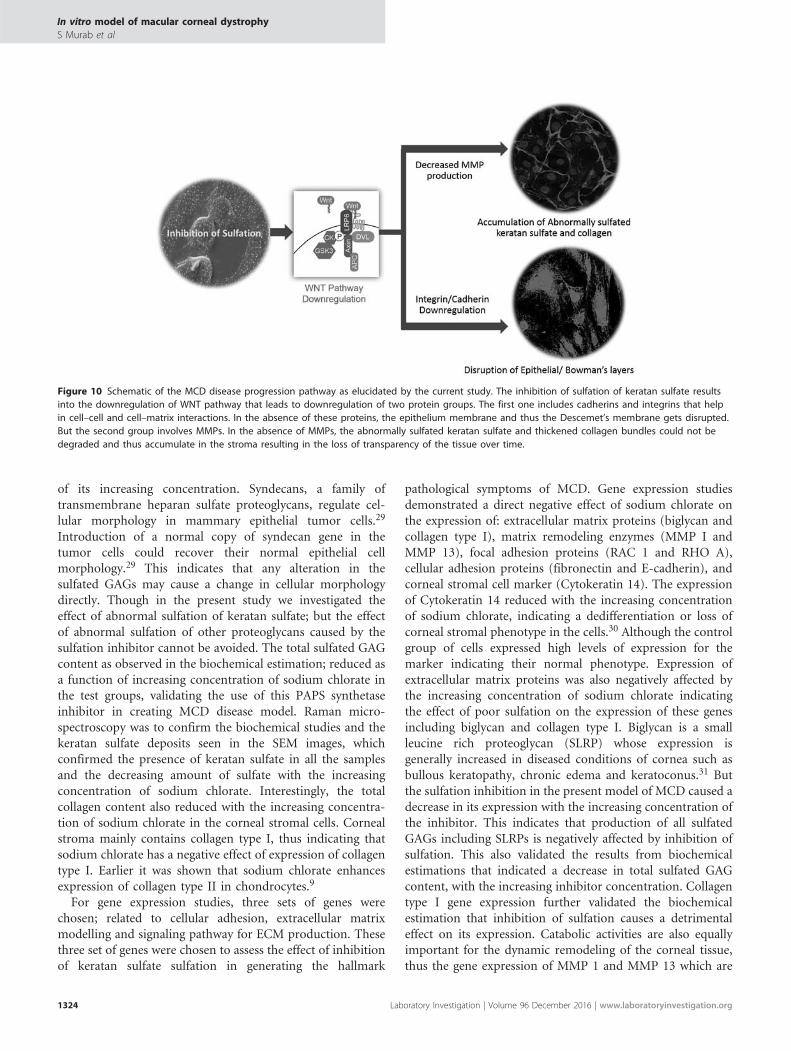
Figure 10 Schematic of the MCD disease progression pathway as elucidated by the current study. The inhibition of sulfation of keratan sulfate resultsinto the downregulation of WNT pathway that leads to downregulation of two protein groups. The first one includes cadherins and integrins that helpin cell–cell and cell–matrix interactions. In the absence of these proteins, the epithelium membrane and thus the Descemet’s membrane gets disrupted.But the second group involves MMPs. In the absence of MMPs, the abnormally sulfated keratan sulfate and thickened collagen bundles could not bedegraded and thus accumulate in the stroma resulting in the loss of transparency of the tissue over time.
In vitro model of macular corneal dystrophyS Murab et al
1324 Laboratory Investigation | Volume 96 December 2016 | www.laboratoryinvestigation.org
matrix metalloproteinases involved in collagen type Idegradation was studied. Both the genes are downregulatedas compared with the control group expressions showingnegative effect of the inhibitor on their expressions too. Thisis a very important finding regarding the progression of MCDas both the abnormally thick collagen bundles and abnor-mally sulfated proteoglycans; mainly keratan sulfate getsaccumulated in the diseased tissue. This can be a directimplication of the downregulation of these matrix remodelingenzymes which helps in degradation of both collagen andproteoglycans. MMP 1 (interstitial collagenase) is involved inthe degradation of all extracellular matrix proteins includingcollagen type I. It has been reported that MMP 1 activity isessential for the remodeling and migration of corneal stromalcells in the tissue.32 But MMP 13 (collagenase III) is involvedin the degradation of collagen type I. MMP 13 has beenreported to be involved in corneal remodeling after injury,indicating its requirement for the remodeling process.33 Thus,downregulation of MMP expression caused by the inhibitionof sulfation leads to accumulation of both abnormally sulfatedkeratan sulfate and abnormally thick collagen bundles in thecorneal stroma. These abnormal accumulations in the stromafinally lead to loss of corneal transparency.
Expression of RHO A and RAC 1 which are small G proteinsignaling molecules involved in integrin-mediated cell-substratum attachment34 was also downregulated by inhibi-tion of sulfation in the corneal stromal cells. RHO A showedconcentration-dependent downregulation but RAC 1 showeda concentration-independent downregulation. RHO A andRAC 1 are both involved in the formation of integrincomplexes that form the focal adhesion points where the cellsbind to fibronectin like ligands of the extracellular matrix andinduce cytoskeletal changes upstream that guide the cellularmorphology after attachment to the substratum. The down-regulation of these genes would directly result in the non-formation of focal complexes and thus poor attachment of thecells, which can explain the initial rounded morphology of thecorneal stromal cells in first week and later the stressedmorphologies in second week. Fibronectin helps in cellularattachment through integrin-mediated adhesionmechanism.35 It was also downregulated as an effect ofdecreased sulfation in the cells, while cadherin which isresponsible for the formation of cell to cell junctions36 wasalso downregulated due to the inhibition of sulfation in theMCD model tests. It has earlier been reported that inhibitionof sulfation causes downregulation of N-cadherin andfibronectin during chondrogenesis.9 All these results canexplain the pathological symptom of disrupted epithelial andbowman’s layer in the MCD-affected corneas. As all the cell–cell and cell–matrix adhesion molecules are downregulatedresulting in tissue disruption; as a result of the abnormalsulfation of keratan sulfate.
Finally, to assess through which signaling pathways thesegene expressions are being modulated we checked for theexpression of SMAD 4, which is involved in TGF β-SMAD
pathway and β-catenin, which is involved in WNT pathway.SMAD 4 showed a concentration-independent inhibition dueto sodium chlorate while β-catenin showed a concentration-dependent inhibition. This indicated that both the pathwaysare negatively affected because of inhibition of sulfation. GAGsulfation has a crucial role in WNT signaling, an alteration insulfation of GAGs causes diminished response to WNTsignaling in articular chondrocytes.37 WNT pathway is knownto have a crucial role in cellular adhesion through cadherinsand intergrins as also found in the protein–protein interactionstudies.38,39 Further, WNT pathway is known to involve in theinduction of MMP expression.40,41 Thus, the downregulationof WNT pathway by decreased sulfation of GAGs, directlyresults in decreased expression of MMPs, which was alsovalidated by the gene interaction studies that showed closeinteraction between these genes. The gene ontological analysisfurther indicated the major role of WNT pathway in thedisease progression of MCD (Figure 9). Subsequently, thereduced expression of MMP enzymes results into theaccumulation of abnormally sulfated GAGs and thick collagenbundles in the corneal stroma as they cannot be degraded.This ultimately results into progressive loss of cornealtransparency because of these accumulations. Thus therapieshelping in enhancing MMP production in MCD affectedcorneas or direct delivery of these enzymes into the MCD-affected corneas in the patients can be tested a potentialtherapy for the treatment of MCD.
Thus, the present study for the first time elucidated themechanism of deterioration of epithelial and Bowman’s layerof cornea, which is caused due to inhibition of integrin- andcadherin-mediated cell–cell and cell–matrix interactionsthrough deregulation of WNT pathway. The second andmain pathological sign of the disease; that is, accumulation ofabnormally sulfated keratan sulfate and thick collagen fibers iscaused due to the reduced production of MMP enzymes againdue to suppression of WNT pathway. Both these conditionsare a direct result of inhibition of sulfation of keratan sulfatein the corneal stromal cells. Thus, this in vitro model of MCDcould elucidate onset of the two most important pathologicalfeatures of MCD. The current model has its own limitations,such as monolayer culture system, non-specific inhibition ofGAG sulfation. In addition, we generated insights aboutexpression of specific genes only; while other genes might alsohave important roles in the pathophysiology of the disease.
This study is a first step toward establishment of abiomimetic in vitro disease model of MCD. Further studiesare needed to acquire knowledge of other genes that can playa part in the onset and progression of the disease. As nextstep, establishment of a 3D in vitro tissue engineered modelusing 3D bioprinting technique42,43 would help to simulatethe layered corneal structure with different cell typessimulating endothelial, stromal, and epithelial cell layers ofMCD-affected cornea. The study also highlights that twoimportant family of proteins MMPs and integrins/cadherinsneed to be targeted for development of therapies for treating
In vitro model of macular corneal dystrophyS Murab et al
www.laboratoryinvestigation.org | Laboratory Investigation | Volume 96 December 2016 1325
MCD. One strategy can be the direct delivery/administrationof MMPs into the MCD-affected corneas to dissolve theopacities as they occur during the progression of the disease,thus paving a way to cure MCD caused corneal blindness.
ACKNOWLEDGMENTSThis study was supported by intramural funding from IIT Delhi (High Impactproject) and funding from Department of Biotechnology, Government ofIndia (BT/PR5717/MED/32/244/2012 and BT/MB/Indo-US/VR/09/2013).
DISCLOSURE/CONFLICT OF INTERESTThe authors declare no conflict of interest.
1. Musch DC, Niziol LM, Stein JD, et al. Prevalence of corneal dystrophiesin the United States: Estimates from claims data. Investig OphthalmolVis Sci 2011;52:6959–6963.
2. Snip RC, Kenyon KR, Green WR. Macular corneal dystrophy:ultrastructural pathology of corneal endothelium and Descemet’smembrane. Invest Ophthalmol 1973;12:88–97.
3. Cheng J, Qi X, Zhao J, et al. Comparison of penetrating keratoplastyand deep lamellar keratoplasty for macular corneal dystrophy and riskfactors of recurrence. Ophthalmology 2013;120:34–39.
4. Akama TO, Nishida K, Nakayama J, et al. Macular corneal dystrophytype I and type II are caused by distinct mutations in a newsulphotransferase gene. Nat Genet 2000;26:237–241.
5. Cheng X, Pinsky PM. Mechanisms of self-organization for the collagenfibril lattice in the human cornea. J R Soc Interface 2013;10:20130512.
6. Knupp C, Pinali C, Lewis PN, et al. The architecture of the cornea andstructural basis of its transparency. Adv Protein Chem Struct Biol 2009;78:25–49.
7. Farrell RA, Hart RW. On the theory of the spatial organization ofmacromolecules in connective tissue. Bull Math Biophys 1969;31:727–760.
8. Müller LJ, Pels E, Schurmans LRHM, et al. A new three-dimensionalmodel of the organization of proteoglycans and collagen fibrils in thehuman corneal stroma. Exp Eye Res 2004;78:493–501.
9. Cho YR, Lee SJ, Jeon HB, et al. Under-sulfation by PAPS synthetaseinhibition modulates the expression of ECM molecules duringchondrogenesis. Biochem Biophys Res Commun 2004;323:769–775.
10. Kumarasuriyar A, Lee I, Nurcombe V, et al. De-sulfation of MG-63 cellglycosaminoglycans delays in vitro osteogenesis, up-regulatescholesterol synthesis and disrupts cell cycle and the actin cytoskeleton.J Cell Physiol 2009;219:572–583.
11. Greve H, Cully Z, Blumberg P, et al. Influence of chlorate onproteoglycan biosynthesis by cultured human fibroblasts. J BiolChem 1988;263:12886–12892.
12. Safaiyan F, Kolset SO, Prydz K, et al. Selective effects of sodium chloratetreatment on the sulfation of heparan sulfate. J Biol Chem 1999;274:36267–36273.
13. Chameettachal S, Murab S, Vaid R, et al. Effect of visco-elasticsilk-chitosan microcomposite scaffolds on matrix deposition andbiomechanical functionality for cartilage tissue engineering. J TissueEng Regen Med 2015.
14. Nara S, Chameettachal S, Midha S, et al. Preservation of biomacr-omolecular composition and ultrastructure of a decellularized corneausing a perfusion bioreactor. RSC Adv 2016;6:2225–2240.
15. Murab S, Samal J, Shrivastava A, et al. Glucosamine loaded injectablesilk-in-silk integrated system modulate mechanical properties inbovine ex-vivo degenerated intervertebral disc model. Biomaterials2015;55:64–83.
16. Murab S, Chameettachal S, Bhattacharjee M, et al. Matrix-embeddedcytokines to simulate osteoarthritis-like cartilage microenvironments.Tissue Eng Part A 2013;19:1733–1753.
17. Bhattacharjee M, Chawla S, Chameettachal S, et al. Role of chondroitinsulphate tethered silk scaffold in cartilaginous disc tissue regeneration.Biomed Mater 2016;11:025014.
18. Abedin MN, Bradley AT, Sharma SK, et al. Mineralogy and astrobiologydetection using laser remote sensing instrument. Appl Opt 2015;54:7598–7611.
19. Tremblay M, Dubé I. Macular dystrophy of the cornea. Ultrastructure oftwo cases. Can J Ophthalmol 1973;8:47–53.
20. Klintworth GK. Current concepts on the ultrastructural pathogenesis ofmacular and lattice corneal dystrophies. Birth Defects Orig Artic Ser1971;7:27–31.
21. Meek KM, Quantock AJ, Elliott GF, et al. Macular corneal dystrophy: themacromolecular structure of the stroma observed using electronmicroscopy and synchrotron X-ray diffraction. Exp Eye Res 1989;49:941–958.
22. Quantock AJ, Meek KM, Ridgway AE, et al. Macular corneal dystrophy:reduction in both corneal thickness and collagen interfibrillar spacing.Curr Eye Res 1990;9:393–398.
23. Palka BP, Sotozono C, Tanioka H, et al. Structural collagen alterations inmacular corneal dystrophy occur mainly in the posterior stroma. CurrEye Res 2010;35:580–586.
24. Lewis D, Davies Y, Nieduszynski IA, et al. Ultrastructural localization ofsulfated and unsulfated keratan sulfate in normal and macular cornealdystrophy type I. Glycobiology 2000;10:305–312.
25. Venkatachalam KV. Human 3’-phosphoadenosine 5'-phosphosulfate(PAPS) synthase: biochemistry, molecular biology and geneticdeficiency. IUBMB Life 2003;55:1–11.
26. Baeuerle PA, Huttner WB. Chlorate–a potent inhibitor of protein sulfationin intact cells. Biochem Biophys Res Commun 1986;141:870–877.
27. Keller KE, Bradley JM, Kelley MJ, et al. Effects of modifiers ofglycosaminoglycan biosynthesis on outflow facility in perfusionculture. Invest Ophthalmol Vis Sci 2008;49:2495–2505.
28. Klebe RJ, Escobedo L V, Bentley KL, et al. Regulation of cell motility,morphology, and growth by sulfated glycosaminoglycans. Cell MotilCytoskeleton 1986;6:273–281.
29. Leppä S, Mali M, Miettinen HM, et al. Syndecan expression regulatescell morphology and growth of mouse mammary epithelialtumor cells. Proc Natl Acad Sci USA 1992;89:932–936.
30. Nieto-Miguel T, Calonge M, de la Mata A, et al. A comparison of stemcell-related gene expression in the progenitor-rich limbal epitheliumand the differentiating central corneal epithelium. Mol Vis 2011;17:2102–2117.
31. Funderburgh JL, Hevelone ND, Roth MR, et al. Decorin and biglycan ofnormal and pathologic human corneas. Invest Ophthalmol Vis Sci1998;39:1957–1964.
32. Daniels JT, Limb GA, Saarialho-Kere U, et al. Human corneal epithelialcells require MMP-1 for HGF-mediated migration on collagen I. InvestOphthalmol Vis Sci 2003;44:1048–1055.
33. Ye HQ, Maeda M, Yu FS, et al. Differential expression ofMT1-MMP (MMP-14) and collagenase III (MMP-13) genes in normaland wounded rat corneas. Invest Ophthalmol Vis Sci 2000;41:2894–2899.
34. Fukata M, Nakagawa M, Kuroda S, et al. Cell adhesion and Rho smallGTPases. J Cell Sci 1999;112(Pt 2):4491–4500.
35. Pankov R. Fibronectin at a glance. J Cell Sci 2002;115:3861–3863.36. Van Roy F, Berx G. The cell-cell adhesion molecule E-cadherin. Cell Mol
Life Sci 2008;65:3756–3788.37. Shortkroff S, Yates KE. Alteration of matrix glycosaminoglycans
diminishes articular chondrocytes’ response to a canonical Wntsignal. Osteoarthritis Cartilage 2007;15:147–154.
38. Wu B, Crampton SP, Hughes CCW. Wnt signaling induces matrixmetalloproteinase expression and regulates T cell transmigration.Immunity 2007;26:227–239.
39. Lowy AM, Clements WM, Bishop J, et al. beta-Catenin/Wnt signalingregulates expression of the membrane type 3 matrix metallo-proteinase in gastric cancer. Cancer Res 2006;66:4734–4741.
40. Amin N, Vincan E. The Wnt signaling pathways and cell adhesion. FrontBiosci (Landmark Ed 2012;17:784–804.
41. Heuberger J, Birchmeier W. Interplay of cadherin-mediated celladhesion and canonical Wnt signaling. Cold Spring Harb PerspectBiol 2010;2:a002915.
42. Chameettachal S, Midha S, Ghosh S. Regulation of chondrogenesis andhypertrophy in silk fibroin-gelatin based 3D bioprinted constructs.ACS Biomater Sci Eng 2016;2:1450–1463.
43. Nara S, Chameettachal S, Ghosh S. Precise patterning of bio-polymers and cells by direct write technique. Mater Technol 2014;29:B10–B14.
In vitro model of macular corneal dystrophyS Murab et al
1326 Laboratory Investigation | Volume 96 December 2016 | www.laboratoryinvestigation.org