Embed Size (px)
Citation preview
2013
http://informahealthcare.com/ihtISSN: 0895-8378 (print), 1091-7691 (electronic)
Inhal Toxicol, 2013; 25(5): 243–256! 2013 Informa Healthcare USA, Inc. DOI: 10.3109/08958378.2013.777821
RESEARCH ARTICLE
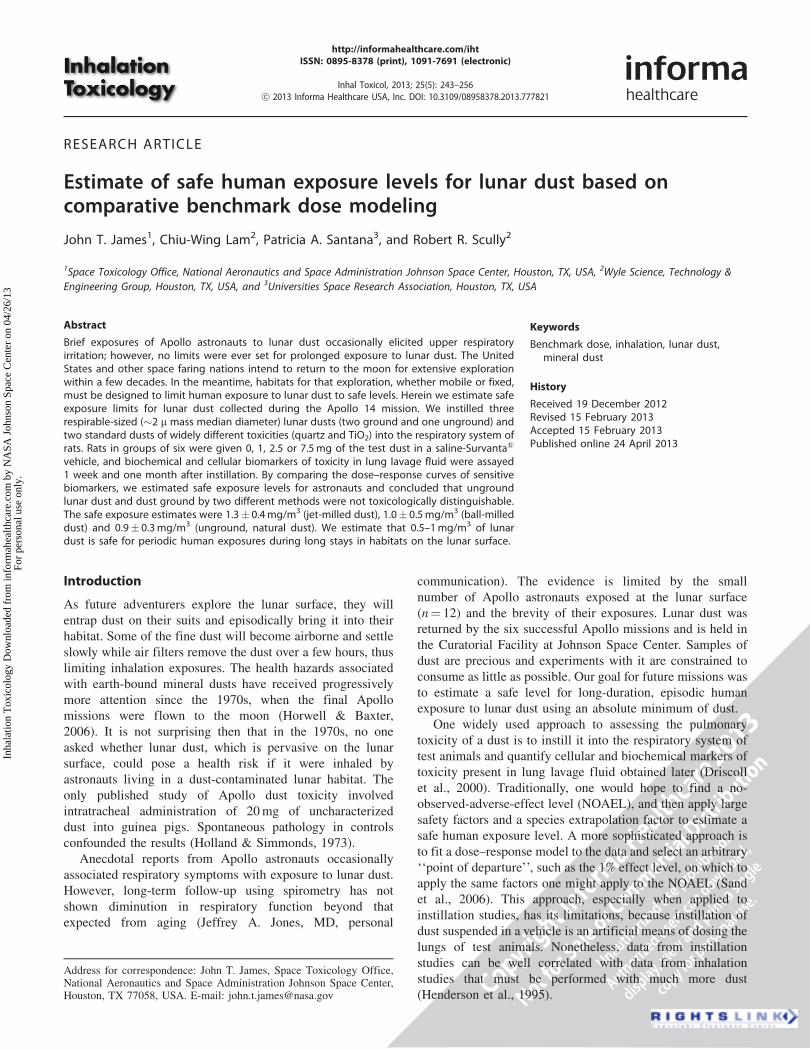
Estimate of safe human exposure levels for lunar dust based oncomparative benchmark dose modeling
John T. James1, Chiu-Wing Lam2, Patricia A. Santana3, and Robert R. Scully2
1Space Toxicology Office, National Aeronautics and Space Administration Johnson Space Center, Houston, TX, USA, 2Wyle Science, Technology &
Engineering Group, Houston, TX, USA, and 3Universities Space Research Association, Houston, TX, USA
Abstract
Brief exposures of Apollo astronauts to lunar dust occasionally elicited upper respiratoryirritation; however, no limits were ever set for prolonged exposure to lunar dust. The UnitedStates and other space faring nations intend to return to the moon for extensive explorationwithin a few decades. In the meantime, habitats for that exploration, whether mobile or fixed,must be designed to limit human exposure to lunar dust to safe levels. Herein we estimate safeexposure limits for lunar dust collected during the Apollo 14 mission. We instilled threerespirable-sized (�2 m mass median diameter) lunar dusts (two ground and one unground) andtwo standard dusts of widely different toxicities (quartz and TiO2) into the respiratory system ofrats. Rats in groups of six were given 0, 1, 2.5 or 7.5 mg of the test dust in a saline-Survanta�
vehicle, and biochemical and cellular biomarkers of toxicity in lung lavage fluid were assayed1 week and one month after instillation. By comparing the dose–response curves of sensitivebiomarkers, we estimated safe exposure levels for astronauts and concluded that ungroundlunar dust and dust ground by two different methods were not toxicologically distinguishable.The safe exposure estimates were 1.3� 0.4 mg/m3 (jet-milled dust), 1.0� 0.5 mg/m3 (ball-milleddust) and 0.9� 0.3 mg/m3 (unground, natural dust). We estimate that 0.5–1 mg/m3 of lunardust is safe for periodic human exposures during long stays in habitats on the lunar surface.
Keywords
Benchmark dose, inhalation, lunar dust,mineral dust
History
Received 19 December 2012Revised 15 February 2013Accepted 15 February 2013Published online 24 April 2013
Introduction
As future adventurers explore the lunar surface, they will
entrap dust on their suits and episodically bring it into their
habitat. Some of the fine dust will become airborne and settle
slowly while air filters remove the dust over a few hours, thus
limiting inhalation exposures. The health hazards associated
with earth-bound mineral dusts have received progressively
more attention since the 1970s, when the final Apollo
missions were flown to the moon (Horwell & Baxter,
2006). It is not surprising then that in the 1970s, no one
asked whether lunar dust, which is pervasive on the lunar
surface, could pose a health risk if it were inhaled by
astronauts living in a dust-contaminated lunar habitat. The
only published study of Apollo dust toxicity involved
intratracheal administration of 20 mg of uncharacterized
dust into guinea pigs. Spontaneous pathology in controls
confounded the results (Holland & Simmonds, 1973).
Anecdotal reports from Apollo astronauts occasionally
associated respiratory symptoms with exposure to lunar dust.
However, long-term follow-up using spirometry has not
shown diminution in respiratory function beyond that
expected from aging (Jeffrey A. Jones, MD, personal
communication). The evidence is limited by the small
number of Apollo astronauts exposed at the lunar surface
(n¼ 12) and the brevity of their exposures. Lunar dust was
returned by the six successful Apollo missions and is held in
the Curatorial Facility at Johnson Space Center. Samples of
dust are precious and experiments with it are constrained to
consume as little as possible. Our goal for future missions was
to estimate a safe level for long-duration, episodic human
exposure to lunar dust using an absolute minimum of dust.
One widely used approach to assessing the pulmonary
toxicity of a dust is to instill it into the respiratory system of
test animals and quantify cellular and biochemical markers of
toxicity present in lung lavage fluid obtained later (Driscoll
et al., 2000). Traditionally, one would hope to find a no-
observed-adverse-effect level (NOAEL), and then apply large
safety factors and a species extrapolation factor to estimate a
safe human exposure level. A more sophisticated approach is
to fit a dose–response model to the data and select an arbitrary
‘‘point of departure’’, such as the 1% effect level, on which to
apply the same factors one might apply to the NOAEL (Sand
et al., 2006). This approach, especially when applied to
instillation studies, has its limitations, because instillation of
dust suspended in a vehicle is an artificial means of dosing the
lungs of test animals. Nonetheless, data from instillation
studies can be well correlated with data from inhalation
studies that must be performed with much more dust
(Henderson et al., 1995).
Address for correspondence: John T. James, Space Toxicology Office,National Aeronautics and Space Administration Johnson Space Center,Houston, TX 77058, USA. E-mail: [email protected]
Inha
latio
n T
oxic
olog
y D
ownl
oade
d fr
om in
form
ahea
lthca
re.c
om b
y N
ASA
Joh
nson
Spa
ce C
ente
r on
04/
26/1
3Fo
r pe
rson
al u
se o
nly.

We have developed a new approach that avoids direct
application of ‘‘safety’’ factors, uses many biomarkers of
toxicity, optimizes dose–response modeling, anchors the
estimates to widely accepted permissible exposure levels
(PELs) for mineral dusts, and requires a minimum of dust for
the experimentation. Our basic assumption was that we could
find biomarkers in lung lavage fluid from rats given a single
dose of dust (measured in mg) with established PELs (TiO2
and quartz, measured in mg/m3) that were sensitive to the
large 50-fold difference in the PELs of these dusts. Given that
outcome with dusts of known toxicity, we could then scale the
biomarker responses in mg to dusts of unknown toxicity
(lunar dusts) to estimate where the ‘‘PEL’’ would be for the
dusts of unknown toxicity relative to the two known PELs.
Our approach is called ‘‘comparative benchmark-dose (BMD)
modeling’’. Using this approach, we were able to achieve a
cluster of safe exposure estimates (SEEs) from50.5 g of lunar
dust, and then discern whether the three types of dust
prepared from the parent lunar dust sample were toxicologic-
ally distinguishable. The SEEs are meant to be applied just
like a PEL would be applied to exposures of industrial
workers; they are time weighted averages for the 8 h after
lunar dust is brought into the habitat and the crew is exposed
until the filters remove the dust to undetectable levels.
Methods
Laboratory animals
Fischer 344 male rats (200–250 g) were housed in an
AAALAC-approved animal facility at the National Institute
of Occupational Safety and Health (NIOSH) in Morgantown,
WV. The rats had free access to water and food. The animals
were allowed to acclimate for at least 1 week before they were
used in experiments. The guidelines of the NIOSH
Institutional Animal Care and Use Committee and the
approved test protocol were followed.
Samples of test dusts
To obtain a respirable-sized fraction of unground lunar dust
(LDug) from the parent sample, a fine dust fraction was
aerodynamically separated from 200 g of Apollo 14 lunar
regolith from the Fra Mauro formation (14003,96) in
ultrapure nitrogen (up-N) (Cooper et al., 2010). The dust
stream was allowed to pass through a cyclone separator
designed for rodent studies (CH Technologies, Westwood,
NJ). Proper choice of nitrogen flow rate (10 L/min) caused the
coarser dust grains to be retained in the cyclone. The effluent
aerosols of fine dust of respirable sizes were captured on a
0.05mm Nuclepore filter. The particle size distribution was
determined by the Microtrac laser-scattering technique. The
mass median diameter (MMD) was 2.1 (þ0.6/�0.9) mm.
A portion of a coarser lunar dust that was captured in the
cyclone was jet milled (LDjm) or ball milled (LDbm) to
smaller size in up-N. Coarse particles in the ball mill were
subjected to violent and rapid crushing by the zirconia balls.
In the jet mill, the collisions between the particles in the
ultrapure nitrogen stream led to formation of finer dust
particles. The resultant products were then subjected to
further size separation in up-N as described above. The MMD
of the jet milled dust was 2.5 (þ1.0/�0.7) mm; the MMD for
the ball milled sample was 1.8 (þ0.5/�0.9) mm. The purpose
of grinding the dust was to create freshly activated surfaces on
the dust as a means of simulating the effects of micrometeor-
ite impacts causing dust fragmentation, with its possible
formation of numerous ‘‘dangling bonds’’ from the formation
of unsatisfied valence shells and presumed activation of dust
at the lunar surface (McKay et al., 1991; Papike et al., 1991).
Because the moon has no atmosphere, surface activation can
persist indefinitely until further impacts melt and agglutinate
the dust. The mineral composition of all three dusts was
similar, having major components as follows: SiO2 (48%),
Al2O3 (19%), CaO (12%), FeO (8%), MgO (7%) and
TiO2 (2%).
The toxic reference dust, quartz (Qz), crystalline silica
(Min-U-Sil 5), was obtained from U.S. Silica (Berkeley
Springs, WV). The dust had an MMD of 1.6 mm, and particles
with diameter less than 5 mm account for 96% of the dust by
weight. The low-toxicity reference dust, TiO2 (rutile pigment
R-100, consisting of �99 wt% TiO2, �1 wt% alumina), was a
product of DuPont Company (Newark, DE) and a gift from
David Warheit of DuPont. The average primary particle size
of this dust was about 0.3 mm, which is smaller than the other
dusts; however, this is a size upon which the PEL for TiO2 is
applied. Thus, this dust fits the needs we have for this
experiment – it is tied to a specific PEL. Reference dusts were
used without further treatment.
Intratracheal instillation of dusts
All dust preparations were suspended in a saline-10%
Survanta� medium (Abbott Nutrition, Columbus, OH),
which was essential for effective suspension of the hydro-
phobic lunar dusts. Groups of six anesthetized rats were each
instilled with 0.4 ml of the vehicle yielding doses of 0, 1, 2.5
or 7.5 mg of dust per rat.
Collection of bronchoalveolar lavage fluid
To study biomarkers of toxicity in the bronchoalveolar lavage
fluid (BALF), rats were deeply anesthetized with an overdose
of Sleepaway (26% sodium pentobarbital, 7.8% isopropyl
alcohol and 20.7% propylene glycol) (Fort Dodge Animal
Health, Fort Dodge, IA) at 1 or 4 weeks after the dust
instillation. Blood samples were collected by cardiac punc-
ture; then the vena cava was cut to exsanguinate the rat. The
lung was lavaged with 6 ml of phosphate-buffered saline
(PBS) and then was further washed five times with 8 ml of
PBS, for a total subsequent lavage fluid volume of 40 ml. The
first lavage sample was centrifuged, and its supernatant was
used for measuring the acellular BALF biomarkers. The cell
pellets of the first and subsequent lavages were combined and
suspended in 1 ml of HEPES-buffered solution for assessment
of cell numbers and differentials.
Assessment of biochemical components of the BALF
Albumin in BALF was determined according to a Sigma
Diagnostics method utilizing the reaction of albumin with
bromcresol green. The reaction product was then measured
with a spectrophotometer at 628 nm and quantified against
known concentrations of bovine serum albumin. Lactate
244 J. T. James et al. Inhal Toxicol, 2013; 25(5): 243–256
Inha
latio
n T
oxic
olog
y D
ownl
oade
d fr
om in
form
ahea
lthca
re.c
om b
y N
ASA
Joh
nson
Spa
ce C
ente
r on
04/
26/1
3Fo
r pe
rson
al u
se o
nly.
dehydrogenase (LDH) activity was determined by the oxida-
tion of lactate coupled to the reduction of NADþ at 340 nm
over time. Measurements were performed with a Cobas c111
analyzer (Roche Diagnostics, Indianapolis, IN). Cytokine
protein concentrations were determined with enzyme-linked
immunosorbent assay (ELISA) kits that were specifically
used to identify MPC-1, TNF-a, IL-1b, IL-6 and IL-10
(Biosource International, Camarillo, CA). The results of this
colorimetric assay were obtained with a Spectramax 250-plate
spectrophotometer using Softmax Pro 2.6 software
(Molecular Devices Corp., Sunnyvale, CA). The samples
were analyzed using a Beckman/Olympus AU480� chemistry
analyzer (Marietta, GA). All BALF assays followed NIOSH
standard protocols.
Assessment of BAL cells
The total numbers of bronchoalveolar lavage cells were
counted using a Coulter Counter equipped with a Channelizer
(model Zb, Coulter Electronics, Hialeah, FL). Cell differen-
tials were performed by visually counting 300 cells after
making Cytospin preparations of microscope slides (Shandon
Cytospin II, Shandon Inc., Pittsburgh, PA) and performing
Wright-Giemsa staining (Hema-Tec 2000, Bayer Corp.,
Elkhart, IN). The number of macrophages and neutrophils
was obtained by multiplying the total number of cells by the
percentage of macrophages or neutrophils, respectively.
Zymosan-stimulated chemiluminescence produced byalveolar macrophages
The chemiluminescence of alveolar macrophages (AMs) was
assayed on AMs isolated from BALF of the dust-treated rats.
The assay utilizes an un-opsonized zymosan solution
(Saccharomyces cerevisiae cell wall preparation [Sigma-
Aldrich�, St. Louis, MO]) to stimulate degranulation and
release of reactive oxygen and reactive nitrogen species
(predominantly nitric oxide) selectively from the macro-
phages. Thus zymosan A was suspended in HEPES buffered
medium in a concentration of 20 mg/ml and the suspension
was heated in boiling water bath for 5 min. It was then
centrifuged at 1500 rpm for 5 min to remove debris. Luminol
(5-amino-2,3-dihydro-1,4-phthalazinedione [Sigma-Aldrich�,
St. Louis, MO]) was dissolved in dimethylsulfoxide (ATCC,
Manassas, VA) to produce a solution of 10 mg/ml. The
concentrated luminal solution was diluted with HEPES buffer
to yield a working luminol solution of 0.4 mg/ml. And, 0.5 ml
of aliquot of AM suspension containing about 1.0� 106 cells
was incubated at 37 �C for 10 min for measuring the resting
stage of the cells (blank). Luminol solution was added to
achieve a final concentration of 0.08 mg/ml with a total
volume of 2 ml. The resultant chemiluminescence was
determined with an automated luminometer (Berthold
AutoLumat Plus LB 953, Gaithersburg, MD) set to collect
light from 390 to 620 nm for 15 min. The integral of counts
per minute (cpm) per cell versus time was calculated, and net
signal was determined by subtracting cpm for blank.
Statistical analysis and BMD modeling of biomarkers
The dose–response data obtained from each biomarker at 1
and 4 weeks were inspected to identify the biomarkers that
were sensitive to the 50-fold difference in the PELs for the
standard respirable-size dusts, TiO2 and quartz. The PELs for
the respirable fractions of these dusts are 5 and 0.1 mg/m3,
respectively (U.S. Department of Labor, 2012). Dose–
response profiles suitable for modeling were required to be
monotonically increasing. If the dose–response curves for the
standard dusts appeared suitable, data were screened to
remove any outlier values according to two procedures. In
one, we used commercial software (Stata, 2012) for a ‘‘robust
regression’’ fit to the data, not including the control data.
Control data were not included because the dispersion of
biomarker data from controls was typically much less than the
dispersion in data from animals receiving dust. We iterated
upon an exclusion value of 50.25. In the second procedure,
values greater than 2 SD from the mean value of the six data
points were excluded. Of the 162 data points that were
available for useful comparisons, the 2-SD exclusion rejected
four points, all associated with one rat 4 weeks after exposure
to TiO2, whereas the robust regression exclusion rejected
many more points, and was used only once to derive a
plausible SEE (4 week macrophage data). Further elaboration
of the statistical analysis is shown in Figure 1.
Targeting only the sensitive biomarkers, we attempted to
model the data using BMD software from the Environmental
Protection Agency (EPA, Version 2.1.2). Five models for
continuous-type data were available in the software package.
Variables modeled were those for which there were signifi-
cant dose-related responses. If the variance was found to be
non-homogeneous then dose-dependent variance was applied
by the model for curve fitting. The best model was chosen for
each dust on the basis of assessments of goodness of fit,
values of scaled residuals of interest, and Akaike information
criterion or the model with the lowest BMDL (when the range
of BMDL estimates was greater than a factor of 3, some
model dependence is assumed). The software predicted the
weight of dust (mg) that would result in a 1-SD increase in
biomarker response over the control mean, which is the
default approach in the EPA software. A biomarker was
deemed acceptable if [log BMD1SD (TiO2) – log BMD1SD
(Quartz)] was greater than 1.0.
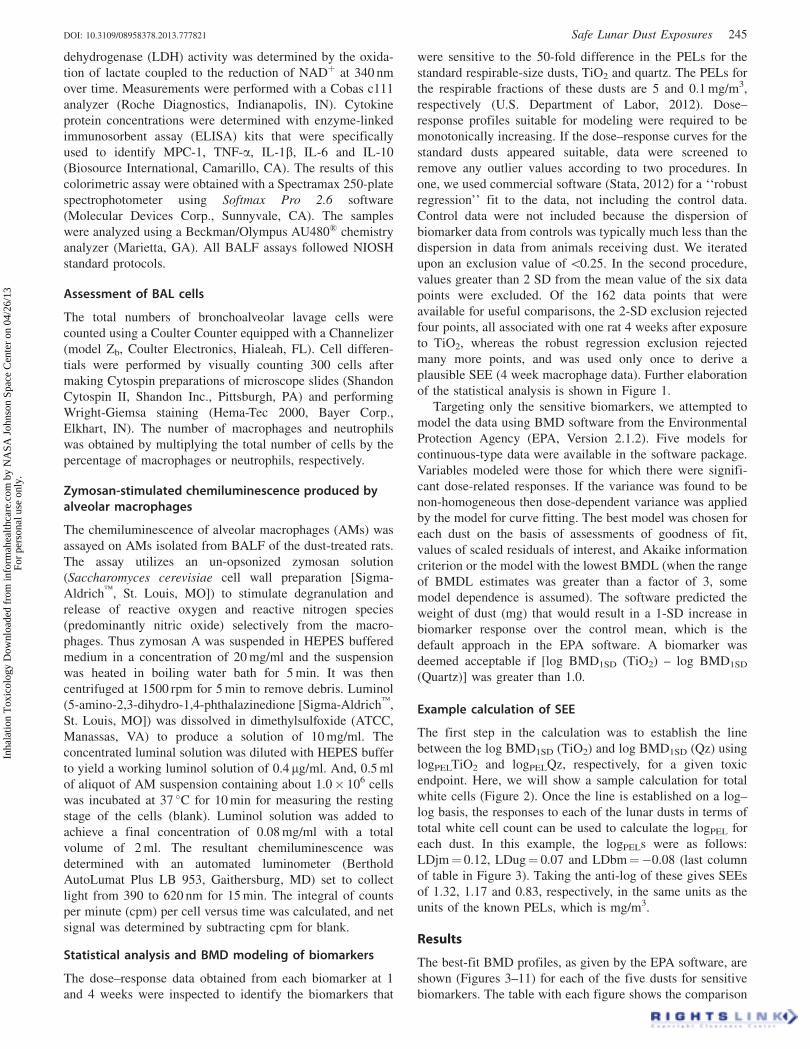
Example calculation of SEE
The first step in the calculation was to establish the line
between the log BMD1SD (TiO2) and log BMD1SD (Qz) using
logPELTiO2 and logPELQz, respectively, for a given toxic
endpoint. Here, we will show a sample calculation for total
white cells (Figure 2). Once the line is established on a log–
log basis, the responses to each of the lunar dusts in terms of
total white cell count can be used to calculate the logPEL for
each dust. In this example, the logPELs were as follows:
LDjm¼ 0.12, LDug¼ 0.07 and LDbm¼�0.08 (last column
of table in Figure 3). Taking the anti-log of these gives SEEs
of 1.32, 1.17 and 0.83, respectively, in the same units as the
units of the known PELs, which is mg/m3.
Results
The best-fit BMD profiles, as given by the EPA software, are
shown (Figures 3–11) for each of the five dusts for sensitive
biomarkers. The table with each figure shows the comparison
DOI: 10.3109/08958378.2013.777821 Safe Lunar Dust Exposures 245
Inha
latio
n T
oxic
olog
y D
ownl
oade
d fr
om in
form
ahea
lthca
re.c
om b
y N
ASA
Joh
nson
Spa
ce C
ente
r on
04/
26/1
3Fo
r pe
rson
al u
se o
nly.

on a linearized logarithmical scale in order to estimate the
SEEs for the three lunar dusts from the known PELs of the
reference dusts. Data in Table 1 show a statistical difference
between jet-milled and unground dust, but the difference in
SEEs, 1.3 versus 0.9 mg/m3, respectively, is not considered
toxicologically significant.
Discussion
This is a powerful new approach to estimate safe exposure
levels for humans who could be exposed to mineral dust. It is
‘‘anchored’’ on either end by two PELs based on large
amounts of data and considerable expert opinion, on what the
safe human exposure levels should be. Quartz is among the
most toxic of mineral dusts, and TiO2 is among the least toxic.
Their respective PELs have been applied for years as a safety
measure to control exposures of Earth-based workers.
By anchoring our approach to these human exposure values,
we have avoided having to apply large uncertainty factors
to an arbitrary point of departure. Furthermore, we antici-
pate that astronaut exposures will be much like those of
ground-based workers. Astronauts may be exposed to dust for
a few hours when they return to their habitat on ‘‘weekdays’’
until the air revitalization system purifies the air. This is
similar to industrial workers’ exposure. Astronauts, like
industrial workers, will have weekends off, and this will
mean no scheduled work outside the habitat and no new dust
in the habitat.
This approach also achieves efficacy by making use of a
wide array of quantitative biomarkers of dust-induced lung
cell injury. Among this large array of biomarkers, we
expected to find several that were exquisitely sensitive to
the differences in toxicity of the two standard dusts. In fact,
five biomarkers met our criterion for acceptable sensitivity
{[log BMD1SD (TiO2) – log BMD1SD (Qz)] was greater than
1.0} at 1 week, 4 weeks or both times after instillation.
Several biomarkers failed because TiO2 elicited no convin-
cing dose response. Other biomarker profiles failed because
the only dust that elicited a biomarker response was quartz.
Our approach also gained power because it depended on
the entire dose–response curve instead of extrapolation below
a single-value NOAEL, which has commonly been used as a
Figure 2. The relationship between theresponses for total white cells 1 week afterdosing is given along a log–log line definedby TiO2 and Qz responses. Responses to thelunar dusts are shown on this line accordingto the total-white-cell count they elicited. TheBMD1SD for each dust is shown next to thedust label as follows: LDjm (jet-milled dust),LDug (unground dust) and LDbm (ball-milled dust). The equation of the log–log lineis as follows: slope¼ 1.396393 and intercept�0.14609.
Figure
No
Yes
Normal Distribu�on? (test residuals from a linear
Regression with the Shapiro-Wilk test)
Homogeneity of Variance? (Bartle�’s Test Levene’s Test)
Selec�onTest
Difference among Dose Group Means
Post Hoc TestIden�fy Dose Groups that
differ
Analysis of Variance
Kruskal-Wallis
Bonferroni
Pair-wise Rank Sum (threshold 0.05 /
Number of pairs tested)
Benchmark Dose
Analysis
Figure 1. Statistical analyses were performed using Stata (version 12) (StataCorp, College Station, TX). In order to determine if conditions necessaryfor the application of analysis of variance were met, normality of distribution was assessed by testing residuals from a linear regression with theShapiro–Wilk test (Swilk), and homogeneity of variance was assessed both with Bartlett’s test and with a more robust method (robvar) based uponLevene’s test. If conditions were appropriate, then testing of treatment means was performed with one way analysis of variance and post-hoc testing wasaccomplished by the method of Bonferroni. If either of the conditions for parametric testing were not satisfied then the nonparametric method ofKruskal–Wallis was utilized to test for difference among treatment groups and post-hoc testing was accomplished by pair-wise rank sum test and thethreshold for significance was taken as p50.5/number of pairs tested.
246 J. T. James et al. Inhal Toxicol, 2013; 25(5): 243–256
Inha
latio
n T
oxic
olog
y D
ownl
oade
d fr
om in
form
ahea
lthca
re.c
om b
y N
ASA
Joh
nson
Spa
ce C
ente
r on
04/
26/1
3Fo
r pe
rson
al u
se o
nly.
point of departure on which various uncertainty factors are
applied. NOAELs are very sensitive to the number of test
subjects, the choice of dose intervals, and the choice of dose
ranges. By using comparative BMD1SD values, we avoided
limitations associated with using the NOAELs as a point of
departure. BMD modeling of dose–response data has been
developed and refined by the EPA over many years, but
toxicity data in the literature have typically not been obtained
with BMD analysis in mind as a tool to be used in directly
setting a safe exposure level. For example, of 19 volatile
compounds reviewed for setting safe astronaut exposures, data
suitable for benchmark–dose analysis were available for only
three (National Research Council, 2008). Our experiments
were designed a priori to facilitate BMD analyses.
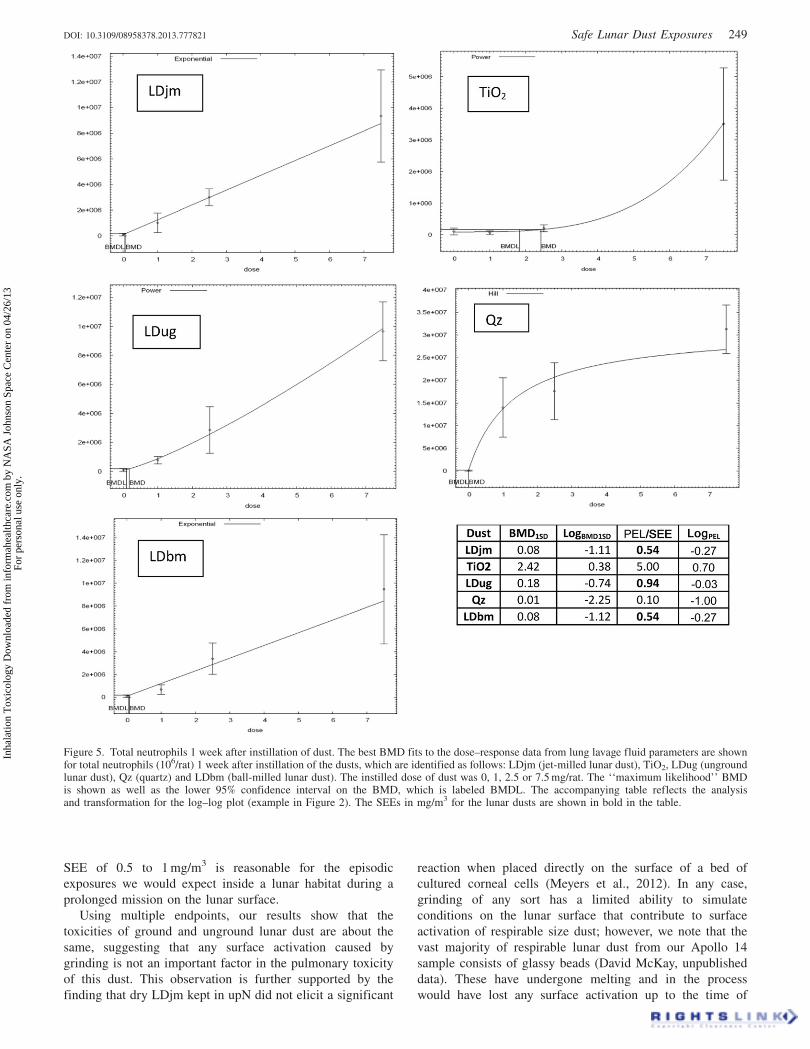
Figure 3. Total white cells 1 week after dust instillation and table showing calculations to estimate SEEs. The best BMD fits to the dose–response datafrom lung lavage fluid parameters are shown for total white cells (106/rat) 1 week after instillation of the dusts, which are identified as follows: LDjm(jet-milled lunar dust), TiO2, LDug (unground lunar dust), Qz (quartz) and LDbm (ball-milled lunar dust). The instilled dose of dust was 0, 1, 2.5 or7.5 mg/rat. The ‘‘maximum likelihood’’ BMD is shown as well as the lower 95% confidence interval on the BMD, which is labeled BMDL. Theaccompanying table reflects the analysis and transformation for the log–log plot (Figure 2). The SEEs in mg/m3 for the lunar dusts are shown in bold inthe table.
DOI: 10.3109/08958378.2013.777821 Safe Lunar Dust Exposures 247
Inha
latio
n T
oxic
olog
y D
ownl
oade
d fr
om in
form
ahea
lthca
re.c
om b
y N
ASA
Joh
nson
Spa
ce C
ente
r on
04/
26/1
3Fo
r pe
rson
al u
se o
nly.
Use of a common set of control data and a common set of
experimental parameters also adds strength to the analyses.
When comparing the toxicities of dusts, one typically faces a
collection of data from various laboratories, on various
species, with various endpoints, and with various exposure
regimens. All of these potentially confounding factors are
removed by using data from a single study obtained
simultaneously and using the same set of control data for
each biomarker. Our data on the selected biomarkers support
the conclusion that the three lunar dusts are toxicologically
indistinguishable (Table 1). The lowest SEEs were just above
0.5 mg/m3, and the averages were near 1 mg/m3; therefore, a
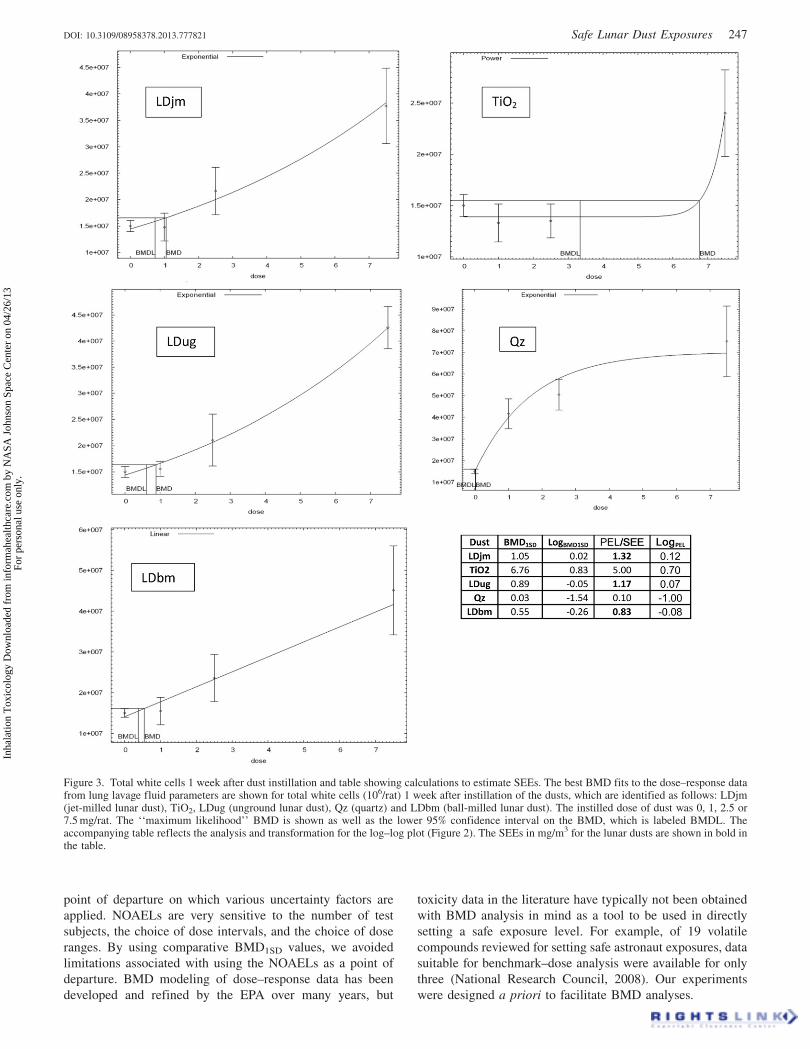
Figure 4. Total white cells 4 weeks after instillation of dust. The best BMD fits to the dose–response data from lung lavage fluid parameters are shownfor total white cells (106/rat) 4 weeks after instillation of the dusts, which are identified as follows: LDjm (jet-milled lunar dust), TiO2, LDug (ungroundlunar dust), Qz (quartz) and LDbm (ball-milled lunar dust). The instilled dose of dust was 0, 1, 2.5 or 7.5 mg/rat. The ‘‘maximum likelihood’’ BMD isshown as well as the lower 95% confidence interval on the BMD, which is labeled BMDL. The accompanying table reflects the analysis andtransformation for the log–log plot (example in Figure 2). The SEEs in mg/m3 for the lunar dusts are shown in bold in the table.
248 J. T. James et al. Inhal Toxicol, 2013; 25(5): 243–256
Inha
latio
n T
oxic
olog
y D
ownl
oade
d fr
om in
form
ahea
lthca
re.c
om b
y N
ASA
Joh
nson
Spa
ce C
ente
r on
04/
26/1
3Fo
r pe
rson
al u
se o
nly.
SEE of 0.5 to 1 mg/m3 is reasonable for the episodic
exposures we would expect inside a lunar habitat during a
prolonged mission on the lunar surface.
Using multiple endpoints, our results show that the
toxicities of ground and unground lunar dust are about the
same, suggesting that any surface activation caused by
grinding is not an important factor in the pulmonary toxicity
of this dust. This observation is further supported by the
finding that dry LDjm kept in upN did not elicit a significant
reaction when placed directly on the surface of a bed of
cultured corneal cells (Meyers et al., 2012). In any case,
grinding of any sort has a limited ability to simulate
conditions on the lunar surface that contribute to surface
activation of respirable size dust; however, we note that the
vast majority of respirable lunar dust from our Apollo 14
sample consists of glassy beads (David McKay, unpublished
data). These have undergone melting and in the process
would have lost any surface activation up to the time of
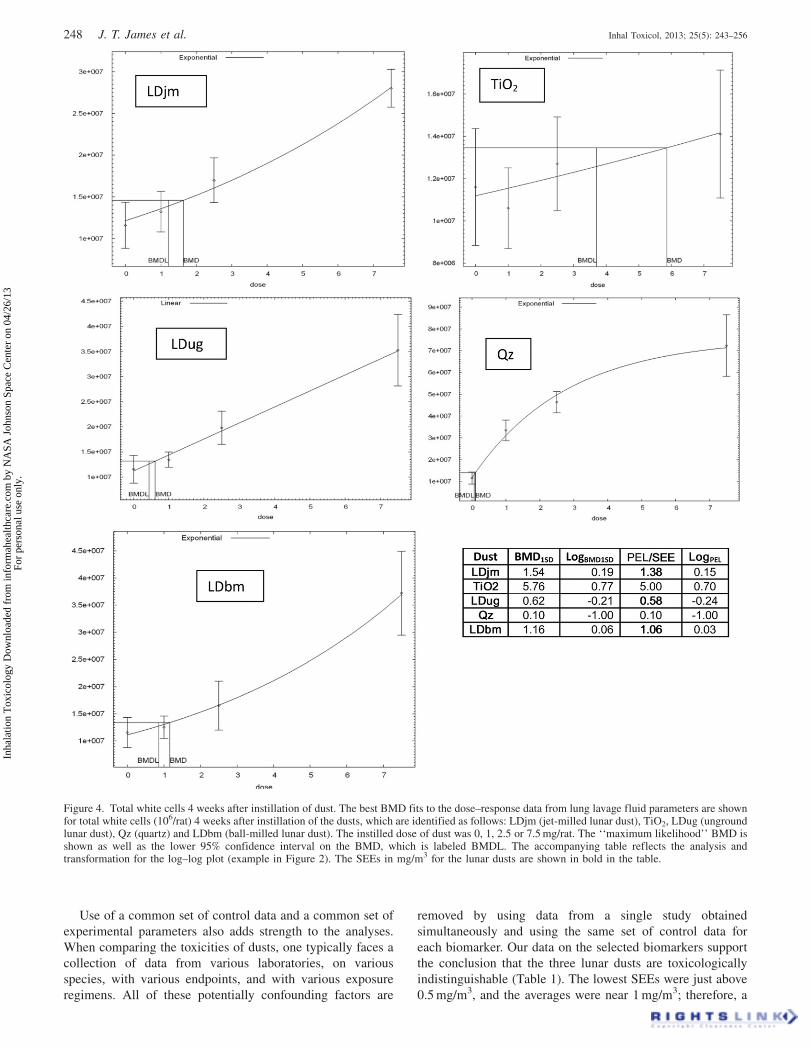
Figure 5. Total neutrophils 1 week after instillation of dust. The best BMD fits to the dose–response data from lung lavage fluid parameters are shownfor total neutrophils (106/rat) 1 week after instillation of the dusts, which are identified as follows: LDjm (jet-milled lunar dust), TiO2, LDug (ungroundlunar dust), Qz (quartz) and LDbm (ball-milled lunar dust). The instilled dose of dust was 0, 1, 2.5 or 7.5 mg/rat. The ‘‘maximum likelihood’’ BMDis shown as well as the lower 95% confidence interval on the BMD, which is labeled BMDL. The accompanying table reflects the analysisand transformation for the log–log plot (example in Figure 2). The SEEs in mg/m3 for the lunar dusts are shown in bold in the table.
DOI: 10.3109/08958378.2013.777821 Safe Lunar Dust Exposures 249
Inha
latio
n T
oxic
olog
y D
ownl
oade
d fr
om in
form
ahea
lthca
re.c
om b
y N
ASA
Joh
nson
Spa
ce C
ente
r on
04/
26/1
3Fo
r pe
rson
al u
se o
nly.
the melt. The question of how important surface activation
might be has by no means been completely settled, but the
weight of evidence favors no more than a small secondary
effect from such activation, which is likely to be rapidly
dissipated when the dust encounters a humid, oxygen-rich
environment in which astronauts will be living on the lunar
surface.
The estimate presented here is based on initial data
obtained on a limited amount of lunar dust from a specific
location on the lunar surface. The present estimate should be
applied with caution to lunar dust from other locations on the
moon and is subject to refinement as more data become
available. The finest dust at the lunar surface is continuously,
but very slowly redistributed so that there is some mixing of
the dust at the surface; however, dust below the surface or in
exotic locations, such as permanently dark crater floors, may
be much different in physical and chemical properties and
have different toxicological properties.
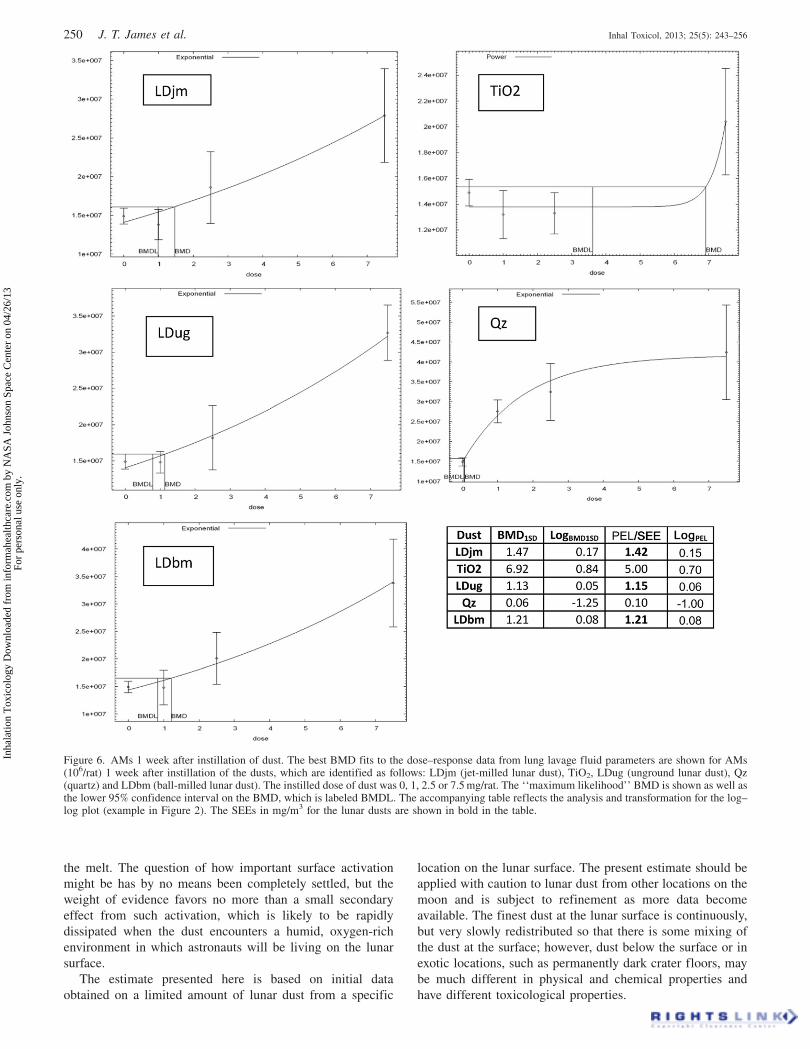
Figure 6. AMs 1 week after instillation of dust. The best BMD fits to the dose–response data from lung lavage fluid parameters are shown for AMs(106/rat) 1 week after instillation of the dusts, which are identified as follows: LDjm (jet-milled lunar dust), TiO2, LDug (unground lunar dust), Qz(quartz) and LDbm (ball-milled lunar dust). The instilled dose of dust was 0, 1, 2.5 or 7.5 mg/rat. The ‘‘maximum likelihood’’ BMD is shown as well asthe lower 95% confidence interval on the BMD, which is labeled BMDL. The accompanying table reflects the analysis and transformation for the log–log plot (example in Figure 2). The SEEs in mg/m3 for the lunar dusts are shown in bold in the table.
250 J. T. James et al. Inhal Toxicol, 2013; 25(5): 243–256
Inha
latio
n T
oxic
olog
y D
ownl
oade
d fr
om in
form
ahea
lthca
re.c
om b
y N
ASA
Joh
nson
Spa
ce C
ente
r on
04/
26/1
3Fo
r pe
rson
al u
se o
nly.
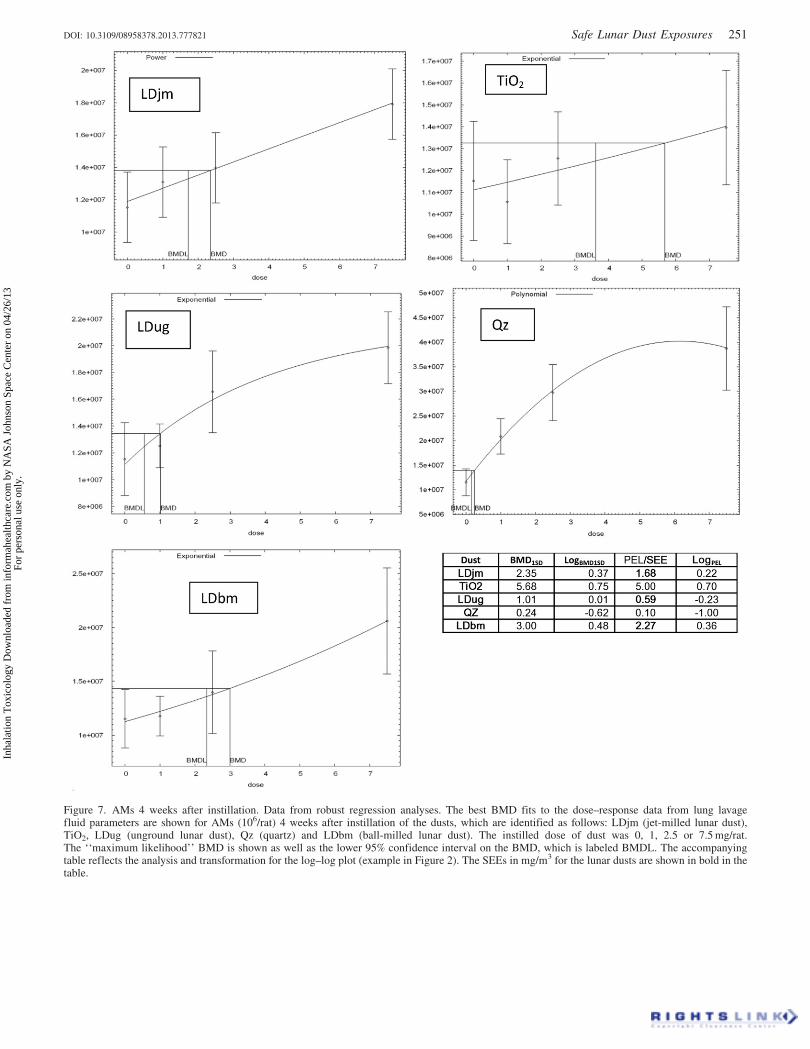
Figure 7. AMs 4 weeks after instillation. Data from robust regression analyses. The best BMD fits to the dose–response data from lung lavagefluid parameters are shown for AMs (106/rat) 4 weeks after instillation of the dusts, which are identified as follows: LDjm (jet-milled lunar dust),TiO2, LDug (unground lunar dust), Qz (quartz) and LDbm (ball-milled lunar dust). The instilled dose of dust was 0, 1, 2.5 or 7.5 mg/rat.The ‘‘maximum likelihood’’ BMD is shown as well as the lower 95% confidence interval on the BMD, which is labeled BMDL. The accompanyingtable reflects the analysis and transformation for the log–log plot (example in Figure 2). The SEEs in mg/m3 for the lunar dusts are shown in bold in thetable.
DOI: 10.3109/08958378.2013.777821 Safe Lunar Dust Exposures 251
Inha
latio
n T
oxic
olog
y D
ownl
oade
d fr
om in
form
ahea
lthca
re.c
om b
y N
ASA
Joh
nson
Spa
ce C
ente
r on
04/
26/1
3Fo
r pe
rson
al u
se o
nly.
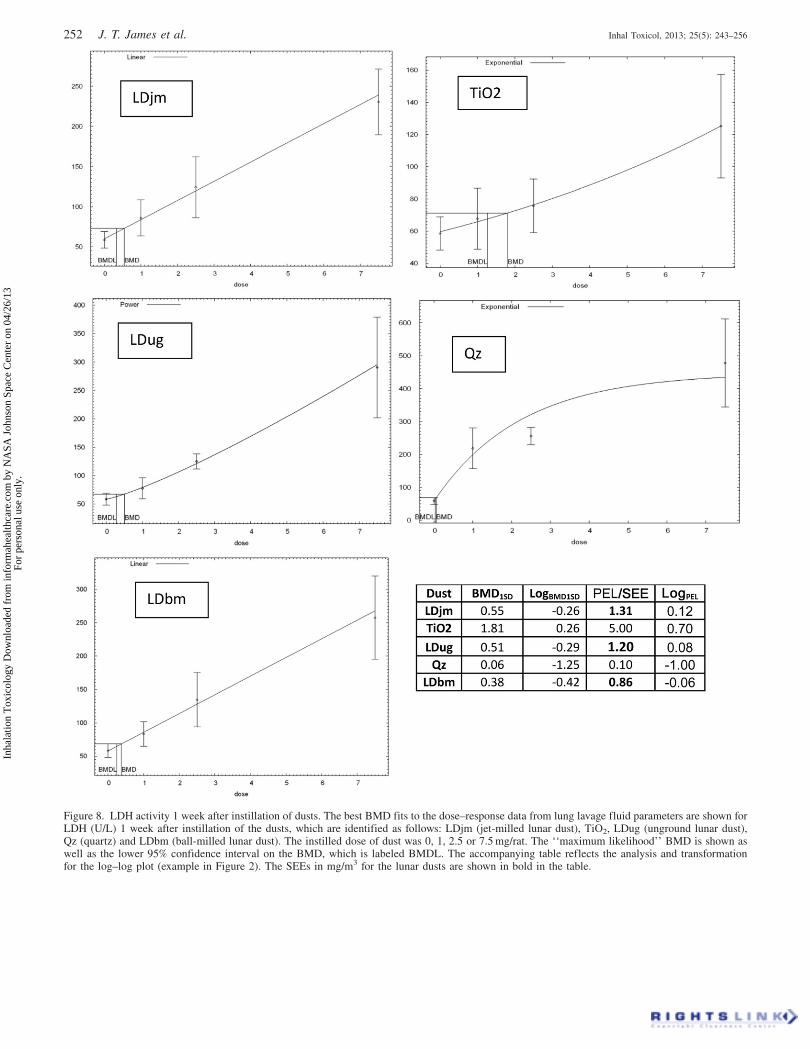
Figure 8. LDH activity 1 week after instillation of dusts. The best BMD fits to the dose–response data from lung lavage fluid parameters are shown forLDH (U/L) 1 week after instillation of the dusts, which are identified as follows: LDjm (jet-milled lunar dust), TiO2, LDug (unground lunar dust),Qz (quartz) and LDbm (ball-milled lunar dust). The instilled dose of dust was 0, 1, 2.5 or 7.5 mg/rat. The ‘‘maximum likelihood’’ BMD is shown aswell as the lower 95% confidence interval on the BMD, which is labeled BMDL. The accompanying table reflects the analysis and transformationfor the log–log plot (example in Figure 2). The SEEs in mg/m3 for the lunar dusts are shown in bold in the table.
252 J. T. James et al. Inhal Toxicol, 2013; 25(5): 243–256
Inha
latio
n T
oxic
olog
y D
ownl
oade
d fr
om in
form
ahea
lthca
re.c
om b
y N
ASA
Joh
nson
Spa
ce C
ente
r on
04/
26/1
3Fo
r pe
rson
al u
se o
nly.
A relatively small number of animals per group were
used to respect the legal mandate to involve the minimal
number of animals expected to yield satisfactory scientific
results. In hindsight, our choice of six animals per group was
appropriate. However, any results like ours, which are based
on statistical analyses, could always be improved by using a
larger group of test animals. The maximal amount of
confidence in the results must be tempered with the reality
of maintaining minimal use of animals. Furthermore, hind-
sight shows that dose selection could have been improved to
generate better sets of comparative dose–response curves.
For example, the amount of quartz instilled could have been
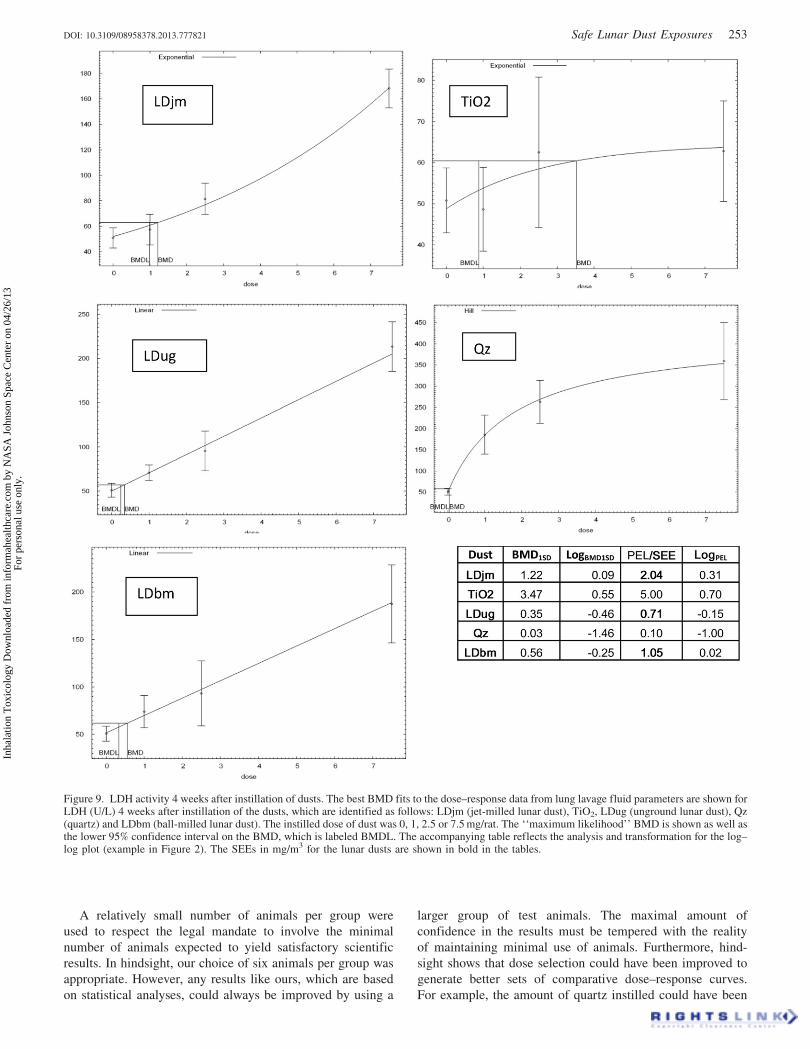
Figure 9. LDH activity 4 weeks after instillation of dusts. The best BMD fits to the dose–response data from lung lavage fluid parameters are shown forLDH (U/L) 4 weeks after instillation of the dusts, which are identified as follows: LDjm (jet-milled lunar dust), TiO2, LDug (unground lunar dust), Qz(quartz) and LDbm (ball-milled lunar dust). The instilled dose of dust was 0, 1, 2.5 or 7.5 mg/rat. The ‘‘maximum likelihood’’ BMD is shown as well asthe lower 95% confidence interval on the BMD, which is labeled BMDL. The accompanying table reflects the analysis and transformation for the log–log plot (example in Figure 2). The SEEs in mg/m3 for the lunar dusts are shown in bold in the tables.
DOI: 10.3109/08958378.2013.777821 Safe Lunar Dust Exposures 253
Inha
latio
n T
oxic
olog
y D
ownl
oade
d fr
om in
form
ahea
lthca
re.c
om b
y N
ASA
Joh
nson
Spa
ce C
ente
r on
04/
26/1
3Fo
r pe
rson
al u
se o
nly.
three-fold lower and the amount of TiO2 three-fold higher to
improve BMD modeling.
A single bolus dose of dust delivered into a rat in a vehicle
has a limited ability to reveal long-term toxicity of that dust if
it were inhaled for months or years by humans. However, we
have selected biomarkers that are known to be associated with
lung injury in rats and show high sensitivity to the known
differences in long-term toxicity of TiO2 and Quartz in
humans. Furthermore, we have followed these markers for a
month after instillation into rats to determine the persistence
of biomarker changes. The markers are reflective of cell
damage (LDH) or inflammation (cell counts), which are
harbingers of pathological changes, but are not of themselves
pathological changes.
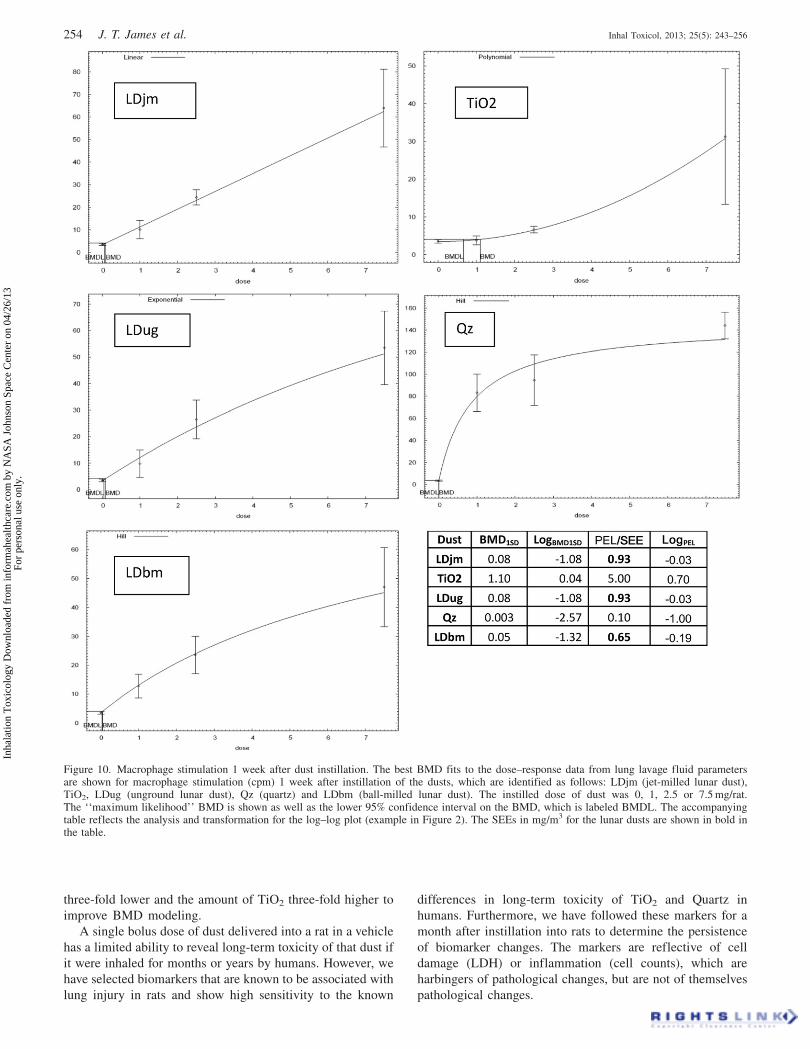
Figure 10. Macrophage stimulation 1 week after dust instillation. The best BMD fits to the dose–response data from lung lavage fluid parametersare shown for macrophage stimulation (cpm) 1 week after instillation of the dusts, which are identified as follows: LDjm (jet-milled lunar dust),TiO2, LDug (unground lunar dust), Qz (quartz) and LDbm (ball-milled lunar dust). The instilled dose of dust was 0, 1, 2.5 or 7.5 mg/rat.The ‘‘maximum likelihood’’ BMD is shown as well as the lower 95% confidence interval on the BMD, which is labeled BMDL. The accompanyingtable reflects the analysis and transformation for the log–log plot (example in Figure 2). The SEEs in mg/m3 for the lunar dusts are shown in bold inthe table.
254 J. T. James et al. Inhal Toxicol, 2013; 25(5): 243–256
Inha
latio
n T
oxic
olog
y D
ownl
oade
d fr
om in
form
ahea
lthca
re.c
om b
y N
ASA
Joh
nson
Spa
ce C
ente
r on
04/
26/1
3Fo
r pe
rson
al u
se o
nly.
Conclusions
We have demonstrated that comparative BMD modeling
facilitates estimation of safe exposure levels for lunar dust
while using a minimal quantity of dust. Our study offers the
first evidence-based estimate of safe exposure levels to lunar
dust during long stays on the lunar surface. To achieve this,
we used a new method, which we call ‘‘comparative BMD
modeling’’, on multiple indices of toxicity derived from lung
lavage fluid. Although our study was conducted in rats, by
anchoring the indices to human PELs, we have shown direct
relevance to protection of human explorers as they live and
work on the lunar surface for decades to come.
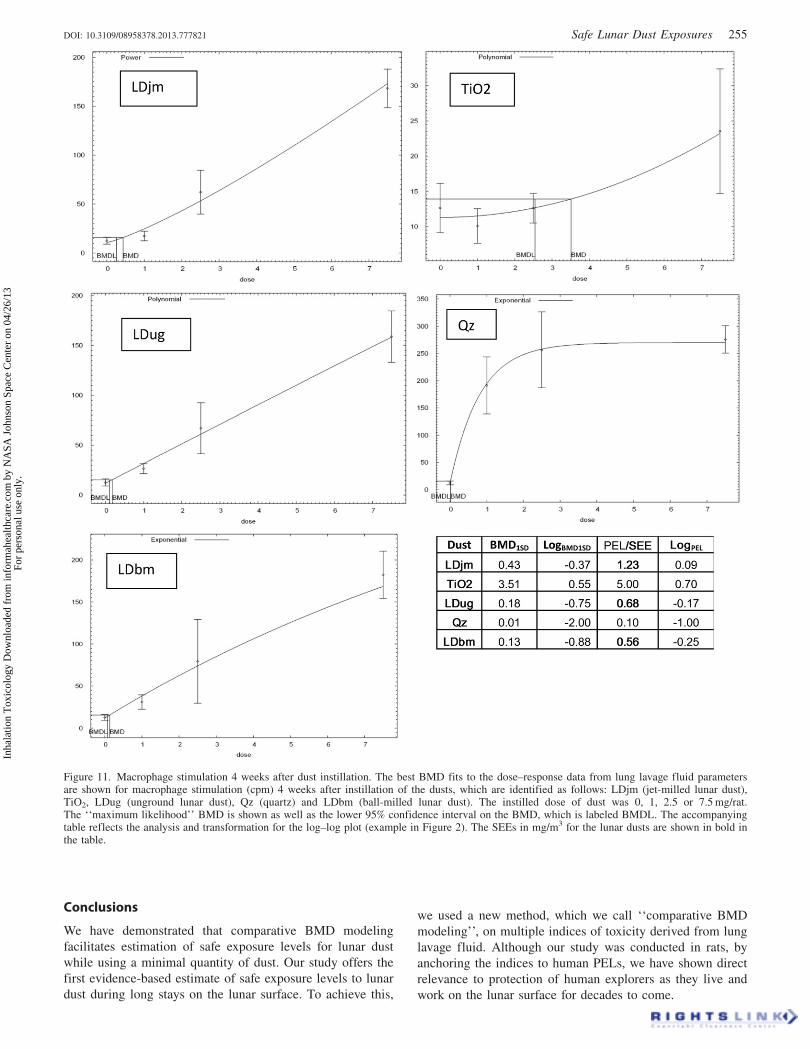
Figure 11. Macrophage stimulation 4 weeks after dust instillation. The best BMD fits to the dose–response data from lung lavage fluid parametersare shown for macrophage stimulation (cpm) 4 weeks after instillation of the dusts, which are identified as follows: LDjm (jet-milled lunar dust),TiO2, LDug (unground lunar dust), Qz (quartz) and LDbm (ball-milled lunar dust). The instilled dose of dust was 0, 1, 2.5 or 7.5 mg/rat.The ‘‘maximum likelihood’’ BMD is shown as well as the lower 95% confidence interval on the BMD, which is labeled BMDL. The accompanyingtable reflects the analysis and transformation for the log–log plot (example in Figure 2). The SEEs in mg/m3 for the lunar dusts are shown in bold inthe table.
DOI: 10.3109/08958378.2013.777821 Safe Lunar Dust Exposures 255
Inha
latio
n T
oxic
olog
y D
ownl
oade
d fr
om in
form
ahea
lthca
re.c
om b
y N
ASA
Joh
nson
Spa
ce C
ente
r on
04/
26/1
3Fo
r pe
rson
al u
se o
nly.
Acknowledgements
We thank David McKay and Bonnie Cooper of Johnson Space
Center (JSC) for preparation of the lunar dusts, Alan H.
Feiveson of JSC for statistical consulting, Jon Rask of Ames
Research Center for excellent technical assistance, Vincent
Castranova for welcoming us to work in his laboratory at the
NIOSH and Patti C. Erdely, Terrence G. Meighan, Mark
Barger and Shih-Houng Young of the NIOSH for technical
expertise. We thank Jane Krauhs for editorial assistance and
Cynthia Bush for graphics assistance.
Declaration of interest
This work was supported by the Human Research Program of
the NASA. The estimates provided herein should not be
construed as official NASA standards. The conclusions are
those of the authors alone, and we report no conflicts of
interest.
References
Cooper BL, McKay DS, Taylor LA, et al. (2010). Extracting respirableparticles from lunar regolith for toxicology studies. In: Song G,Malla RB (eds.) Proceedings of the 12th international conference onengineering, science, construction, and operations in challengingenvironments, Reston: American Society of Civil Engineers, 66–73.
Driscoll KE, Costa DL, Hatch G, et al. (2000). Intratracheal instillationas an exposure technique for the evaluation of respiratory tracttoxicity: uses and limitations. Toxicol Sci 55:24–35.
Henderson RF, Driscoll KE, Harkema JR, et al. (1995). A comparison ofthe inflammatory response of the lung to inhaled versus instilledparticles in F344 rats. Fundam Appl Toxicol 24:183–97.
Holland JM, Simmonds RC. (1973). The mammalian response to lunarparticulates. Space Life Sci 4:97–109.
Horwell CJ, Baxter PJ. (2006). The rerspiratory health hazards ofvolcanic ash: a review for volcanic risk mitigation. Bull Volcanol 69:1–24.
McKay DS, Heiken G, Basu A, et al. (1991). The lunar regolith. In:Heiken G, Vaniman D, French BM (eds.) Lunar sourcebook: a user’sguide to the moon. Houston, TX: Lunar Planetary Institute, 285–356.
Meyers VE, Garcia HD, Monds K, et al. (2012). Ocular toxicity ofauthentic lunar dust. BMC Ophthalmol 12:26–32.
National Research Council. (2008). Spacecraft maximum allowableconcentrations for selected airborne contaminants (vol. 5).Washington, DC: National Academies Press.
Papike JJ, Taylor LA, Simon S. (1991). Lunar minerals. In: Heiken G,Vaniman D, French BM (eds.) Lunar sourcebook: a user’s guide to themoon. Houston, TX: Lunar Planetary Institute, 121–81.
Sand S, von Rosen D, Victorin K, Filipsson AF. (2006). Identification ofa critical dose level for risk assessment: developments in benchmarkdose analysis of continuous endpoints. Toxicol Sci 90:241–51.
Stata. Available from: http://www.stata.com/ [last accessed: 6 Dec 2012].U.S. Department of Labor. Available from: http://www.osha.gov/dts/
chemicalsampling/data/CH_272100.html; http://www.osha.gov/pls/oshaweb/owadisp.show_document?p_table¼standards&p_id¼9994[last accessed: 6 Dec 2012].
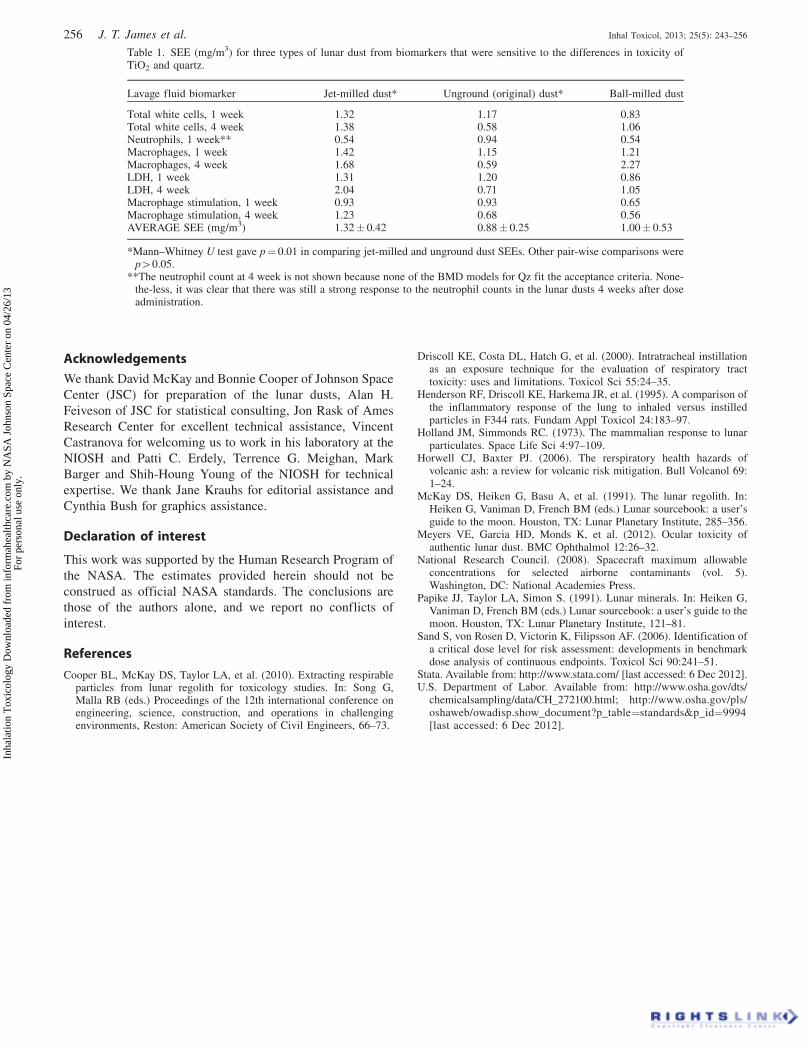
Table 1. SEE (mg/m3) for three types of lunar dust from biomarkers that were sensitive to the differences in toxicity ofTiO2 and quartz.
Lavage fluid biomarker Jet-milled dust* Unground (original) dust* Ball-milled dust
Total white cells, 1 week 1.32 1.17 0.83Total white cells, 4 week 1.38 0.58 1.06Neutrophils, 1 week** 0.54 0.94 0.54Macrophages, 1 week 1.42 1.15 1.21Macrophages, 4 week 1.68 0.59 2.27LDH, 1 week 1.31 1.20 0.86LDH, 4 week 2.04 0.71 1.05Macrophage stimulation, 1 week 0.93 0.93 0.65Macrophage stimulation, 4 week 1.23 0.68 0.56AVERAGE SEE (mg/m3) 1.32� 0.42 0.88� 0.25 1.00� 0.53
*Mann–Whitney U test gave p¼ 0.01 in comparing jet-milled and unground dust SEEs. Other pair-wise comparisons werep40.05.
**The neutrophil count at 4 week is not shown because none of the BMD models for Qz fit the acceptance criteria. None-the-less, it was clear that there was still a strong response to the neutrophil counts in the lunar dusts 4 weeks after doseadministration.
256 J. T. James et al. Inhal Toxicol, 2013; 25(5): 243–256
Inha
latio
n T
oxic
olog
y D
ownl
oade
d fr
om in
form
ahea
lthca
re.c
om b
y N
ASA
Joh
nson
Spa
ce C
ente
r on
04/
26/1
3Fo
r pe
rson
al u
se o
nly.