Embed Size (px)
Citation preview
1
Estimating connectivity in marine populations: an empirical evaluation of assignment tests and parentage analysis under different gene flow scenarios P. SAENZ-AGUDELO1, G. P. JONES2, S. R. THORROLD3 and S. PLANES1 1Laboratoire Écosystèmes Aquatiques Tropicaux et Méditerranéens UMR 5244 CNRS-EPHE-UPVD, Université de Perpignan 66860 Perpignan Cedex, 2School of Marine and Tropical Biology, and ARC Centre of Excellence for Coral Reef Studies, James Cook University, Townsville, 4811, Queensland, Australia, 3Biology Department MS # 50, Woods Hole Oceanographic Institution, Woods Hole, MA 02543, USA Keywords: Assignment tests, coral-reef ecology, connectivity, larval dispersal, marine protected areas, metapopulation, microsatellites, parentage analysis, self-recruitment Correspondance: Serge Planes, Laboratoire Écosystèmes Aquatiques Tropicaux et Méditerranéens, UMR 5244 CNRS-EPHE-UPVD, Université de Perpignan, 66860 Perpignan Cedex, Fax: +33 4 68 50 36 86, E-Mail : [email protected] Running title: Estimating connectivity in marine populations
brought to you by COREView metadata, citation and similar papers at core.ac.uk
provided by Woods Hole Open Access Server
2
Abstract The application of spatially explicit models of population dynamics to fisheries management and the design marine reserves network systems has been limited due to a lack of empirical estimates of larval dispersal. Here we compared assignment tests and parentage analysis for examining larval retention and connectivity under two different gene flow scenarios using panda clownfish (Amphiprion polymnus) in Papua New Guinea. A metapopulation of panda clownfish in Bootless Bay with little or no genetic differentiation among 5 spatially discrete locations separated by 2-6kmprovided the high gene flow scenario. The low gene flow scenario compared the Bootless Bay metapopulation with a genetically distinct population (Fst = 0.1) located at Schumann Island, New Britain, 1,500km to the north-east. We used assignment tests and parentage analysis based on microsatellite DNA data to identify natal origins of 177 juveniles in Bootless Bay and 73 juveniles at Schumann Island. At low rates of gene flow, assignment tests correctly classified juveniles to their source population. On the other hand, parentage analysis led to an overestimate of self-recruitment within the two populations due to the significant deviation from panmixia when both populations were pooled. At high gene flow (within Bootless Bay), assignment tests underestimated self-recruitment and connectivity among subpopulations, and grossly overestimated self-recruitment within the overall metapopulation. However, the assignment tests did identify immigrants from distant (genetically distinct) populations. Parentage analysis clearly provided the most accurate estimates of connectivity in situations of high gene flow.
3
Introduction Marine coastal habitats are often discontinuous and species distributions can be fragmented into spatially discrete populations. The dynamics of these populations can potentially be influenced by self-recruitment or local retention of juveniles within populations, and by connectivity, the degree to which these populations are linked by dispersal (Sale et al., 2005; Warner, Cowen, 2002). Levels of self-recruitment within and connectivity among populations on ecological time-scales are key factors affecting the persistence of marine metapopulations and their resilience to local disturbance (Armsworth, 2002; Hastings, Botsford, 2006; James et al., 2002). Optimal design of spatially explicit management strategies for marine species, including marine protected areas (MPAs), is also contingent on the extent of population connectivity (Hastings, Botsford, 2003; Lockwood et al., 2002; Sale et al., 2005). In benthic-oriented marine species which are often relatively sedentary as adults, population connectivity largely occurs during a larval phase that extends from reproduction to the completion of the settlement process (Cowen et al., 2007). While an increasing number of methods for estimating population exchange on ecological time-scales are available, the accuracy of the different methods and the degree of concordance among them are seldom known. Population genetics is the most widely used approach for making inferences about dispersal and connectivity in marine organisms (Hellberg, 2007; Planes, 2002; Van Oppen, Gates, 2006). Estimates of connectivity based on gene flow have also being used to inform the design of marine protected area networks (e.g. Palumbi, 2003). However, while clearly a suitable tool for measuring gene flow on evolutionary time-scales, population genetics cannot always distinguish between contemporary and historical gene flow. Standard estimates of migration among populations are increasingly inaccurate at scales where there may be limited population differentiation (Hedgecock et al., 2007). Estimates of dispersal also rely heavily on theoretical models of population structure, such as Wright’s island model, which are based on many assumptions that may often be violated in natural populations (Hedgecock et al., 2007). Given that successful management may be reliant on good estimates of population exchange between local populations and successive generations, the accuracy of different approaches needs to be evaluated. The recent proliferation of molecular and statistical tools has led to the application of genetic tools to provide direct estimates of connectivity in marine populations (Manel et al., 2003). These genetic approaches focus on the assignment of individuals to populations of origin (assignment methods) (Carreras-Carbonell et al., 2007; Underwood et al., 2007) or to specific parents (parentage analysis).(Castro et al., 2006; Gerber et al., 2000; Jones et al., 2005; Rodzen et al., 2004) Direct estimates of retention and connectivity using assignment tests or parentage analysis can be applied using hypervariable molecular markers such as microsatellites. In assignment methods, an individual is assigned to the most likely source population, based on the expected frequency of its multilocus genotype in various putative sources. The typical assumptions of this approach are that all potential source populations are defined in advance, sampled randomly and do not depart from Hardy-Weinberg or linkage equilibrium. Newer statistical approaches that use maximum likelihood and Bayesian methods involve fewer assumptions and provide higher assignment accuracy (Manel et al., 2005). While it has also been suggested that these approaches are more effective when migration is low (Nm < 5) (Waples, Gaggiotti, 2006) and consequently genetic structure is high (Underwood et al., 2007), the accuracy of assignment techniques at identifying natal origins at small spatial scales has rarely been examined.
4
In parentage analysis, individuals are assigned to one single parent or parent pair usually using a likelihood-based approach to select the most likely parent from a pool of potential parents (Jones, Ardren, 2003). The main constrain of this approach is that parental allocation success declines dramatically as the proportion of sampled candidate parents drop (Marshall et al., 1998). However, methods have recently been developed that allow to deal with incomplete sampling (Duchesne et al., 2005; Gerber et al., 2003). In addition, parentage analysis assumes that there is random mating in the population. This assumption of panmixia is often violated in wild populations at larger spatial scales, but to our knowledge no empirical studies have tested for the consequences of this violation when parentage models are used to study natural populations. Coral reef environments are extremely patchy and resident populations of reef fishes can be spatially segregated at small spatial scales, from kilometres to 10’s of kilometres (Hellberg, 2007). Although fishes have pelagic larval durations that may last weeks to months, recent empirical evidence suggests a high degree of local retention of larvae (Almany et al., 2007; Jones et al., 1999; Jones et al., 2005; Paris, Cowen, 2004; Swearer et al., 1999). Standard population genetic techniques vary in their ability to estimate self-recruitment and connectivity at these small spatial scales (Planes, 2002), and the application of assignment tests and parentage analysis has been limited (Baums et al., 2005; Gerlach et al., 2007; Underwood et al., 2007). Jones et al. (2005) directly estimated levels of self-recruitment in a clownfish by combining parentage analysis and chemical tagging and found similar results with the two methods. More interestingly, they highlighted that parentage analysis can provide high resolution connectivity information and direct estimates of dispersal distances at the individual level. However, while promising, the effects of violations in model assumptions require further investigation. The aim of this study was to evaluate and compare estimates of self-recruitment and connectivity from assignment tests and parentage analysis under two different scenarios of gene flow. First, we considered a high gene flow scenario using genetic data from five spatially discrete subpopulations of the panda clownfish Amphiprion polymnus in Bootless Bay, Papua New Guinea. Then, we considered a low gene flow scenario by adding a data set from a genetically distinct population (Schumann Island) located more than 1,500 km away in the Bismark Sea (Jones et al. 2005). As dispersal between the two locations is extremely unlikely, pooling the two locations provided a means to evaluate the effect of violating the assumption of a panmitic population when classifying parent-offspring relationships. Materials and methods Study species and site The panda clownfish (Amphiprion polymnus) is a southeast Asian endemic fish that lives in close association with discrete aggregations of two species of anemones (Stichodactyla hadonni and Heteractis crispa) that occupy sandy habitats associated with coral reefs (Fautin & Allen 1992). Each anemone is usually occupied by one breeding pair and up to eight smaller subadults and juveniles. The female (the largest individual) lays demersal eggs on the upper surface of shells or dead coral next to the anemone. The embryos develop over a period of 6-7days before hatching (Fautin, Allen, 1992) and late stage larvae settle into anemones after a pelagic larval phase lasting 9-12 days (Thresher et al., 1989).
5
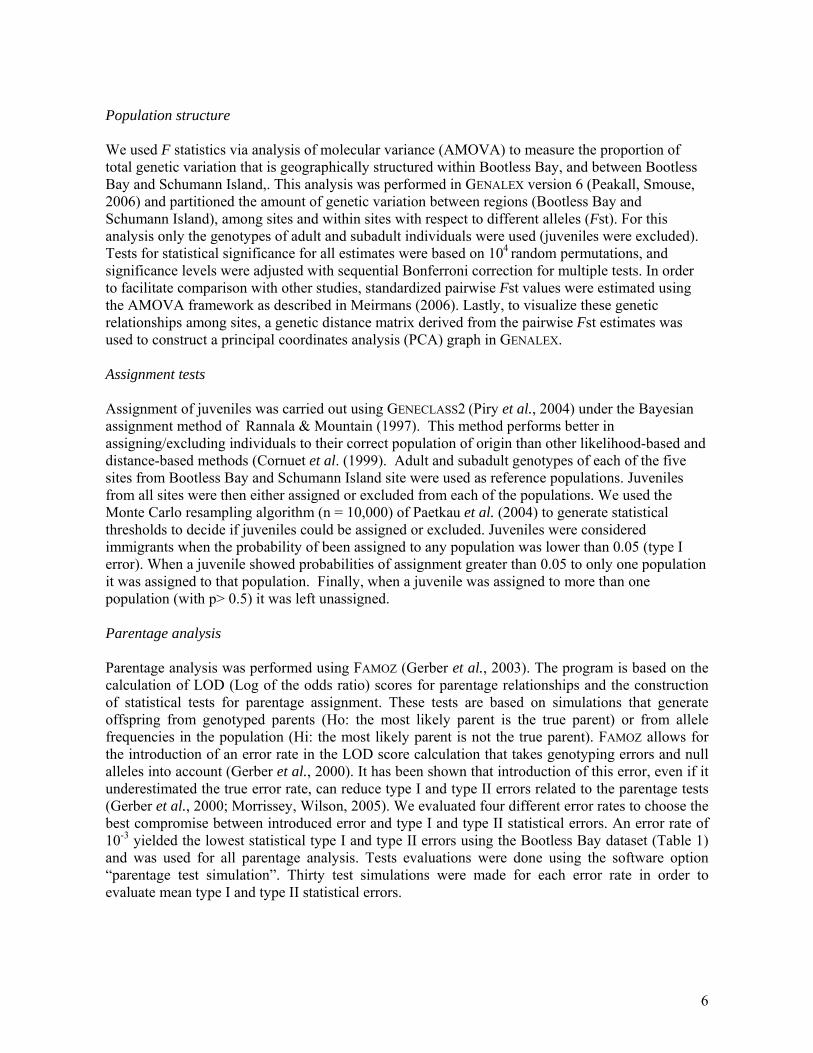
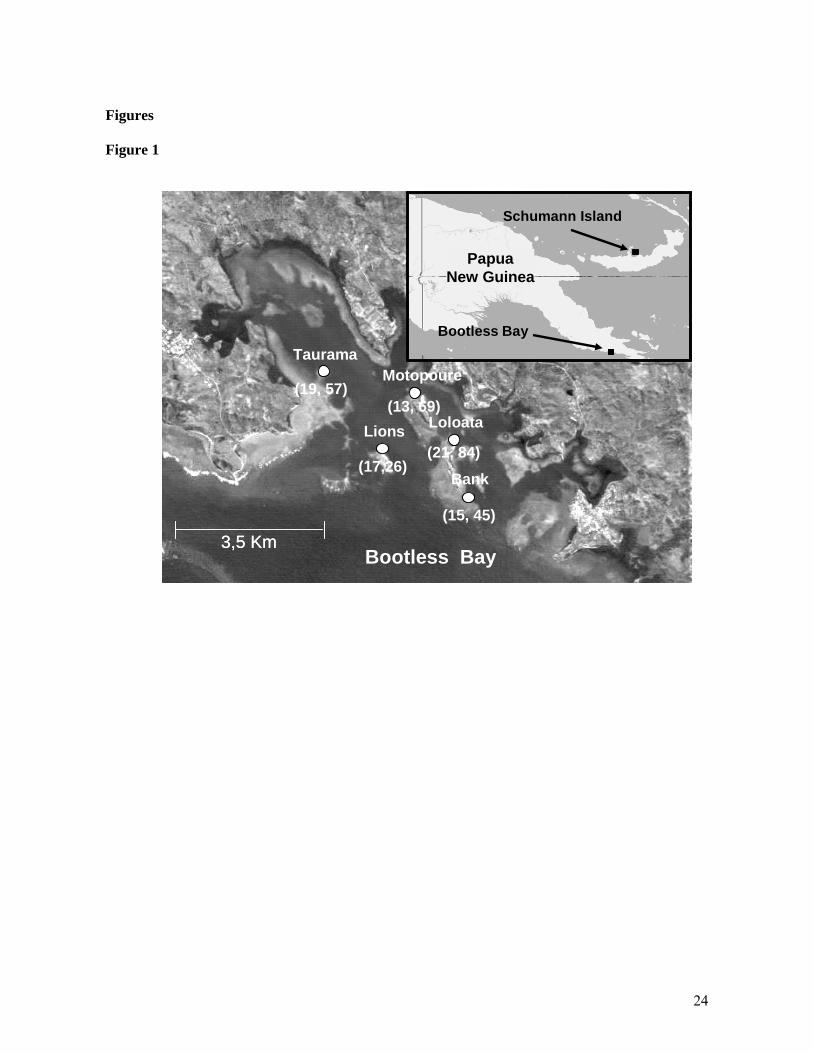
We used genetic data from two separate population systems in Papua New Guinea. The first system was located at Bootless Bay, nearby Port Moresby (Figure 1) and consisted of a metapopulation of five discrete subpopulations with no individuals found in adjacent sand or coral habitats. Each population was confined to a discrete ~1ha patch of shallow sand and sea grass separated from the other subpopulations by 2 to 6 km. At each site an exhaustive search for all anemones colonised by A. polymnus was made. A total of 85 anemones and 281 adult and subadult A. polymnus were distributed among the five subpopulations (Figure 1). The second system was located at Schumann Island (Kimbe Bay, New Britain) over 1500 km to the north east of Bootless Bay. Genetic data from Schumann Island published by Jones et al. (2005) was used to compare the utility of assignment tests and parentage analysis to correctly assign juveniles to geographically distant populations. The Schumann Island population consisted of 40 anemones and 85 adult A. polymnus confined to a 1km2 sand flat adjacent to the island. Sampling and genotyping A total of 458 individuals (281 adults and subadults and 177 juveniles), representing between approximately 85 and 95% of each of the subpopulations, were sampled after extensive searches at each of the five sites. All resident fish (adult and sub-adult individuals) from the five sites were sampled in December 2005. Each individual was captured on SCUBA using hand nets, fin clipped underwater on site, and then released on the same anemone as captured. All juveniles present at each anemone were captured in December 2005, and at three additional times (January, April, and June 2006). All samples were preserved in 95% ethanol and returned to the laboratory for subsequent genetic analyses. The genetic data set for Schumann Island comprised 158 individuals (85 adults and 73 juveniles). Adults were fin-clipped in June 2003, and all juveniles settling over a three-months period between August-October 2003 were sampled (see Jones et al. 2005 for details). Details of genotyping procedure are described in (Quenouille et al., 2004). After DNA extraction, 3 multiplex polymerase chain reactions (PCRs) were performed per individual, using fluorescently-labelled primers to process 11 microsatellite loci containing a mixture of dimer and tetramer repeats. PCR products were processed on a Beckman Coulter sequencer CEQ 8000 Genetic Analysis System and the resulting electropherograms were scored manually. Uncertainties were resolved by reamplification and comparison. Alleles were scored as PCR product size in base pairs. None of the 637 individuals screened shared the same diploid genotype. Allelic frequencies, allelic patterns and expected heterozyosities under Hardy Weinberg equilibrium were calculated in GENALEX version 6 (Peakall, Smouse, 2006). Tests for Hardy-Weinberg and linkage disequilibrium were conducted using GENEPOP 3.4. (Raymond, Rousset, 1995) and significance levels were adjusted with sequential Bonferroni corrections for multiple tests with p< 0.05. A table describing the number of samples, number of alleles, observed and expected heterozygosity for each adult and juvenile group of the ten other loci are shown in the supplementary data (Table 1). While heterozygote deficits were present in at least one site at 3 of the 10 remaining loci, consistent heterozygote deficits were detected across all sites only for one locus (loc 2). This deficit suggested the presence of null alleles and consequently this locus was also excluded from all subsequent analysis. All 9 remaining loci were considered statistically independent since no linkage disequilibrium between loci pairs was observed after Bonferroni correction. One locus was excluded because of difficulties during genotyping.
6
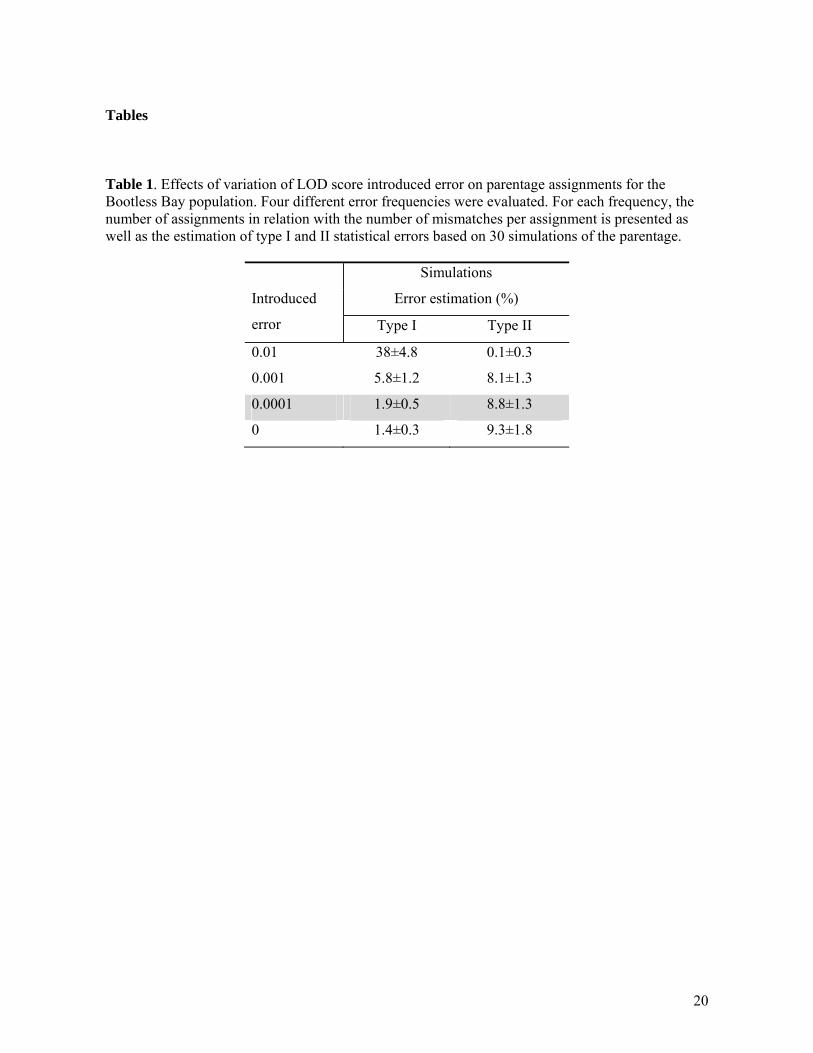
Population structure We used F statistics via analysis of molecular variance (AMOVA) to measure the proportion of total genetic variation that is geographically structured within Bootless Bay, and between Bootless Bay and Schumann Island,. This analysis was performed in GENALEX version 6 (Peakall, Smouse, 2006) and partitioned the amount of genetic variation between regions (Bootless Bay and Schumann Island), among sites and within sites with respect to different alleles (Fst). For this analysis only the genotypes of adult and subadult individuals were used (juveniles were excluded). Tests for statistical significance for all estimates were based on 104 random permutations, and significance levels were adjusted with sequential Bonferroni correction for multiple tests. In order to facilitate comparison with other studies, standardized pairwise Fst values were estimated using the AMOVA framework as described in Meirmans (2006). Lastly, to visualize these genetic relationships among sites, a genetic distance matrix derived from the pairwise Fst estimates was used to construct a principal coordinates analysis (PCA) graph in GENALEX. Assignment tests Assignment of juveniles was carried out using GENECLASS2 (Piry et al., 2004) under the Bayesian assignment method of Rannala & Mountain (1997). This method performs better in assigning/excluding individuals to their correct population of origin than other likelihood-based and distance-based methods (Cornuet et al. (1999). Adult and subadult genotypes of each of the five sites from Bootless Bay and Schumann Island site were used as reference populations. Juveniles from all sites were then either assigned or excluded from each of the populations. We used the Monte Carlo resampling algorithm (n = 10,000) of Paetkau et al. (2004) to generate statistical thresholds to decide if juveniles could be assigned or excluded. Juveniles were considered immigrants when the probability of been assigned to any population was lower than 0.05 (type I error). When a juvenile showed probabilities of assignment greater than 0.05 to only one population it was assigned to that population. Finally, when a juvenile was assigned to more than one population (with p> 0.5) it was left unassigned. Parentage analysis Parentage analysis was performed using FAMOZ (Gerber et al., 2003). The program is based on the calculation of LOD (Log of the odds ratio) scores for parentage relationships and the construction of statistical tests for parentage assignment. These tests are based on simulations that generate offspring from genotyped parents (Ho: the most likely parent is the true parent) or from allele frequencies in the population (Hi: the most likely parent is not the true parent). FAMOZ allows for the introduction of an error rate in the LOD score calculation that takes genotyping errors and null alleles into account (Gerber et al., 2000). It has been shown that introduction of this error, even if it underestimated the true error rate, can reduce type I and type II errors related to the parentage tests (Gerber et al., 2000; Morrissey, Wilson, 2005). We evaluated four different error rates to choose the best compromise between introduced error and type I and type II statistical errors. An error rate of 10-3 yielded the lowest statistical type I and type II errors using the Bootless Bay dataset (Table 1) and was used for all parentage analysis. Tests evaluations were done using the software option “parentage test simulation”. Thirty test simulations were made for each error rate in order to evaluate mean type I and type II statistical errors.
7
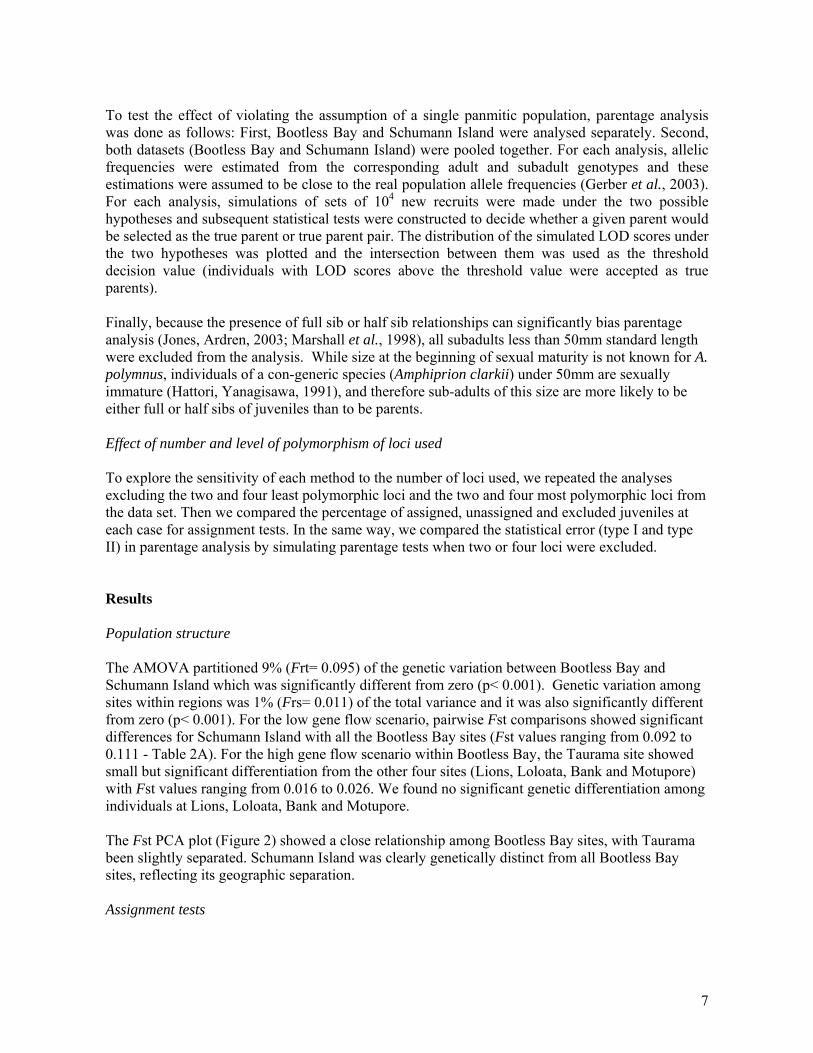
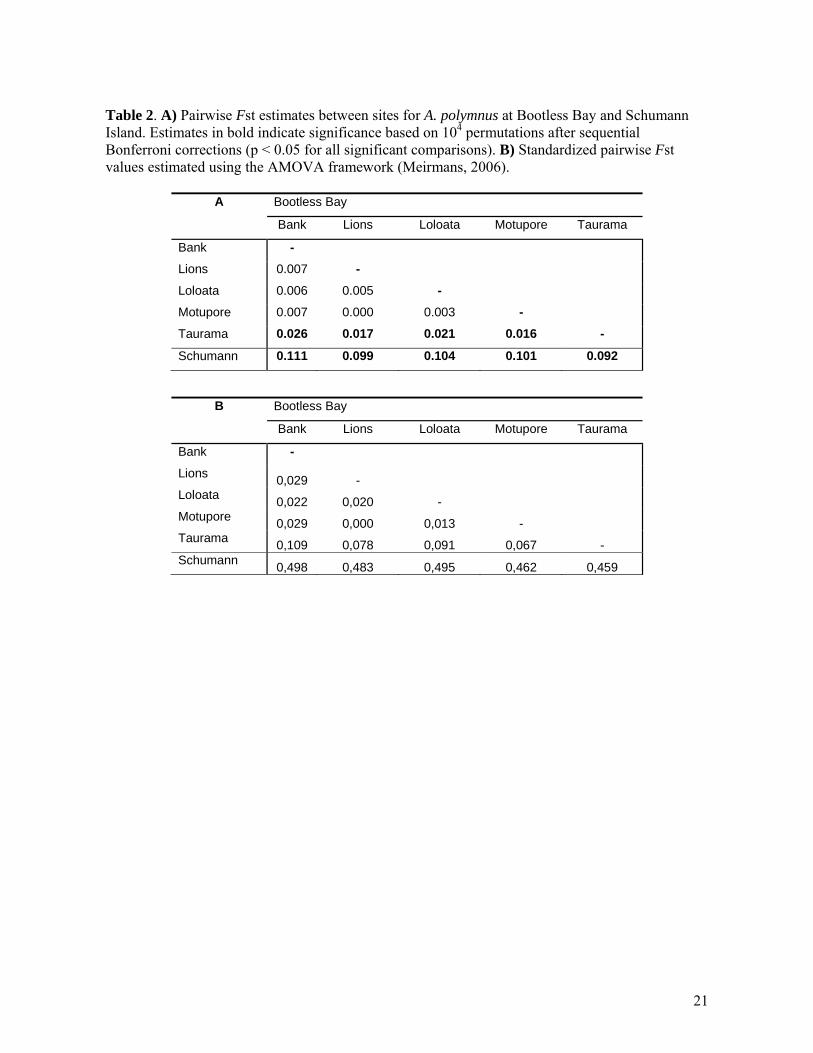
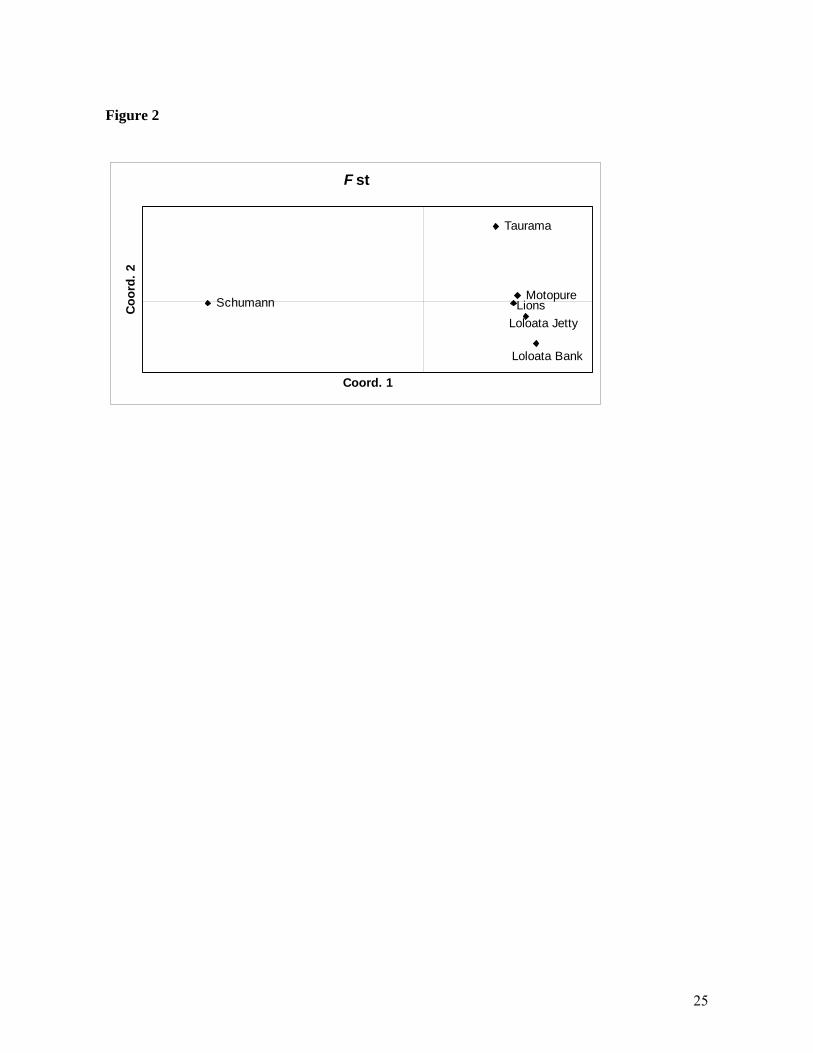
To test the effect of violating the assumption of a single panmitic population, parentage analysis was done as follows: First, Bootless Bay and Schumann Island were analysed separately. Second, both datasets (Bootless Bay and Schumann Island) were pooled together. For each analysis, allelic frequencies were estimated from the corresponding adult and subadult genotypes and these estimations were assumed to be close to the real population allele frequencies (Gerber et al., 2003). For each analysis, simulations of sets of 104 new recruits were made under the two possible hypotheses and subsequent statistical tests were constructed to decide whether a given parent would be selected as the true parent or true parent pair. The distribution of the simulated LOD scores under the two hypotheses was plotted and the intersection between them was used as the threshold decision value (individuals with LOD scores above the threshold value were accepted as true parents). Finally, because the presence of full sib or half sib relationships can significantly bias parentage analysis (Jones, Ardren, 2003; Marshall et al., 1998), all subadults less than 50mm standard length were excluded from the analysis. While size at the beginning of sexual maturity is not known for A. polymnus, individuals of a con-generic species (Amphiprion clarkii) under 50mm are sexually immature (Hattori, Yanagisawa, 1991), and therefore sub-adults of this size are more likely to be either full or half sibs of juveniles than to be parents. Effect of number and level of polymorphism of loci used To explore the sensitivity of each method to the number of loci used, we repeated the analyses excluding the two and four least polymorphic loci and the two and four most polymorphic loci from the data set. Then we compared the percentage of assigned, unassigned and excluded juveniles at each case for assignment tests. In the same way, we compared the statistical error (type I and type II) in parentage analysis by simulating parentage tests when two or four loci were excluded. Results Population structure The AMOVA partitioned 9% (Frt= 0.095) of the genetic variation between Bootless Bay and Schumann Island which was significantly different from zero (p< 0.001). Genetic variation among sites within regions was 1% (Frs= 0.011) of the total variance and it was also significantly different from zero (p< 0.001). For the low gene flow scenario, pairwise Fst comparisons showed significant differences for Schumann Island with all the Bootless Bay sites (Fst values ranging from 0.092 to 0.111 - Table 2A). For the high gene flow scenario within Bootless Bay, the Taurama site showed small but significant differentiation from the other four sites (Lions, Loloata, Bank and Motupore) with Fst values ranging from 0.016 to 0.026. We found no significant genetic differentiation among individuals at Lions, Loloata, Bank and Motupore. The Fst PCA plot (Figure 2) showed a close relationship among Bootless Bay sites, with Taurama been slightly separated. Schumann Island was clearly genetically distinct from all Bootless Bay sites, reflecting its geographic separation. Assignment tests
8
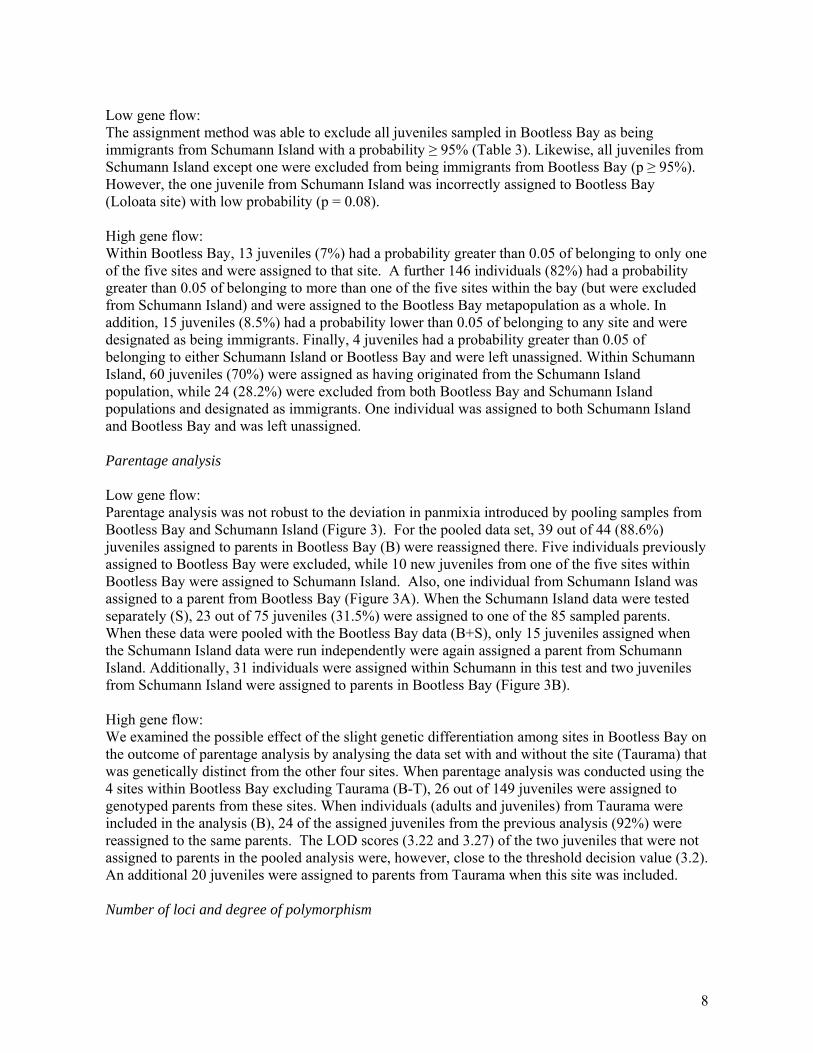
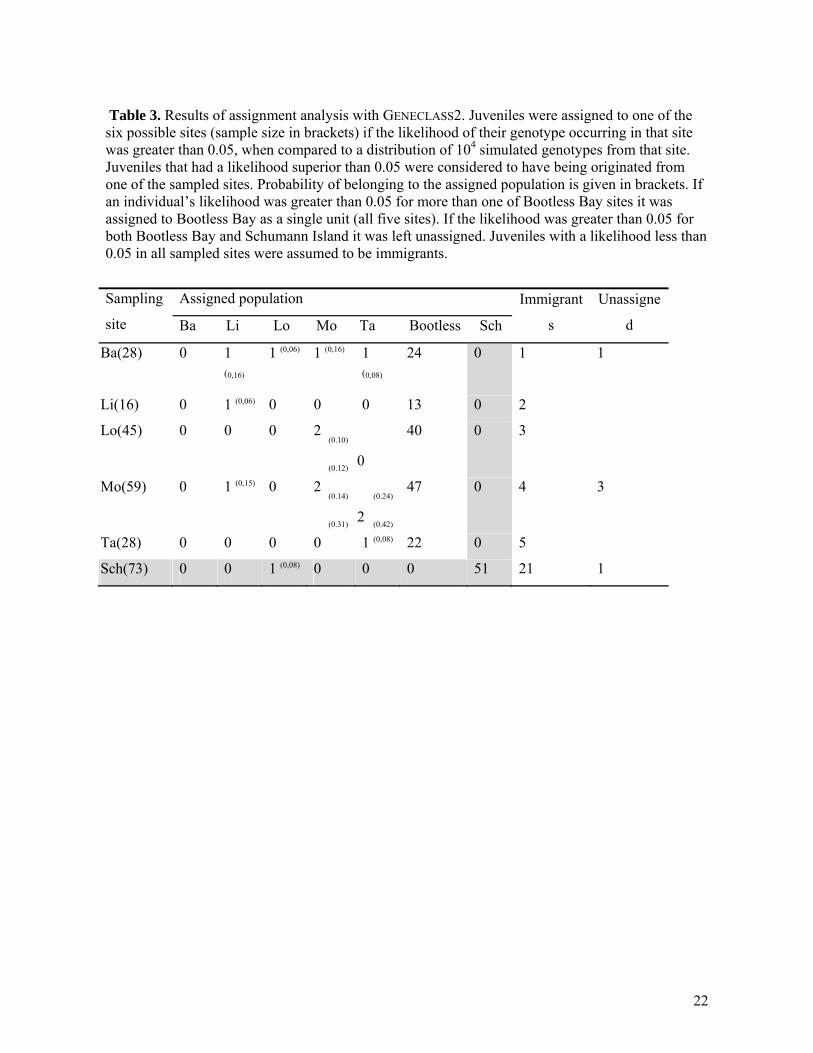
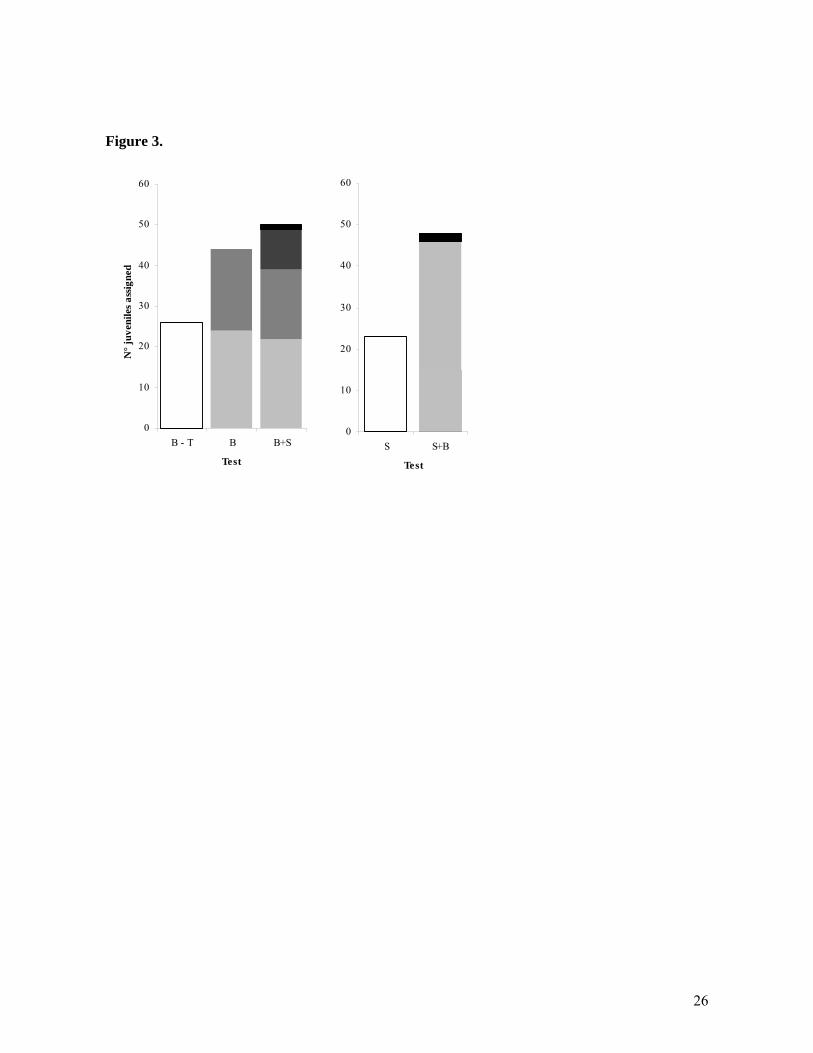
Low gene flow: The assignment method was able to exclude all juveniles sampled in Bootless Bay as being immigrants from Schumann Island with a probability ≥ 95% (Table 3). Likewise, all juveniles from Schumann Island except one were excluded from being immigrants from Bootless Bay (p ≥ 95%). However, the one juvenile from Schumann Island was incorrectly assigned to Bootless Bay (Loloata site) with low probability (p = 0.08). High gene flow: Within Bootless Bay, 13 juveniles (7%) had a probability greater than 0.05 of belonging to only one of the five sites and were assigned to that site. A further 146 individuals (82%) had a probability greater than 0.05 of belonging to more than one of the five sites within the bay (but were excluded from Schumann Island) and were assigned to the Bootless Bay metapopulation as a whole. In addition, 15 juveniles (8.5%) had a probability lower than 0.05 of belonging to any site and were designated as being immigrants. Finally, 4 juveniles had a probability greater than 0.05 of belonging to either Schumann Island or Bootless Bay and were left unassigned. Within Schumann Island, 60 juveniles (70%) were assigned as having originated from the Schumann Island population, while 24 (28.2%) were excluded from both Bootless Bay and Schumann Island populations and designated as immigrants. One individual was assigned to both Schumann Island and Bootless Bay and was left unassigned. Parentage analysis Low gene flow: Parentage analysis was not robust to the deviation in panmixia introduced by pooling samples from Bootless Bay and Schumann Island (Figure 3). For the pooled data set, 39 out of 44 (88.6%) juveniles assigned to parents in Bootless Bay (B) were reassigned there. Five individuals previously assigned to Bootless Bay were excluded, while 10 new juveniles from one of the five sites within Bootless Bay were assigned to Schumann Island. Also, one individual from Schumann Island was assigned to a parent from Bootless Bay (Figure 3A). When the Schumann Island data were tested separately (S), 23 out of 75 juveniles (31.5%) were assigned to one of the 85 sampled parents. When these data were pooled with the Bootless Bay data (B+S), only 15 juveniles assigned when the Schumann Island data were run independently were again assigned a parent from Schumann Island. Additionally, 31 individuals were assigned within Schumann in this test and two juveniles from Schumann Island were assigned to parents in Bootless Bay (Figure 3B). High gene flow: We examined the possible effect of the slight genetic differentiation among sites in Bootless Bay on the outcome of parentage analysis by analysing the data set with and without the site (Taurama) that was genetically distinct from the other four sites. When parentage analysis was conducted using the 4 sites within Bootless Bay excluding Taurama (B-T), 26 out of 149 juveniles were assigned to genotyped parents from these sites. When individuals (adults and juveniles) from Taurama were included in the analysis (B), 24 of the assigned juveniles from the previous analysis (92%) were reassigned to the same parents. The LOD scores (3.22 and 3.27) of the two juveniles that were not assigned to parents in the pooled analysis were, however, close to the threshold decision value (3.2). An additional 20 juveniles were assigned to parents from Taurama when this site was included. Number of loci and degree of polymorphism
9
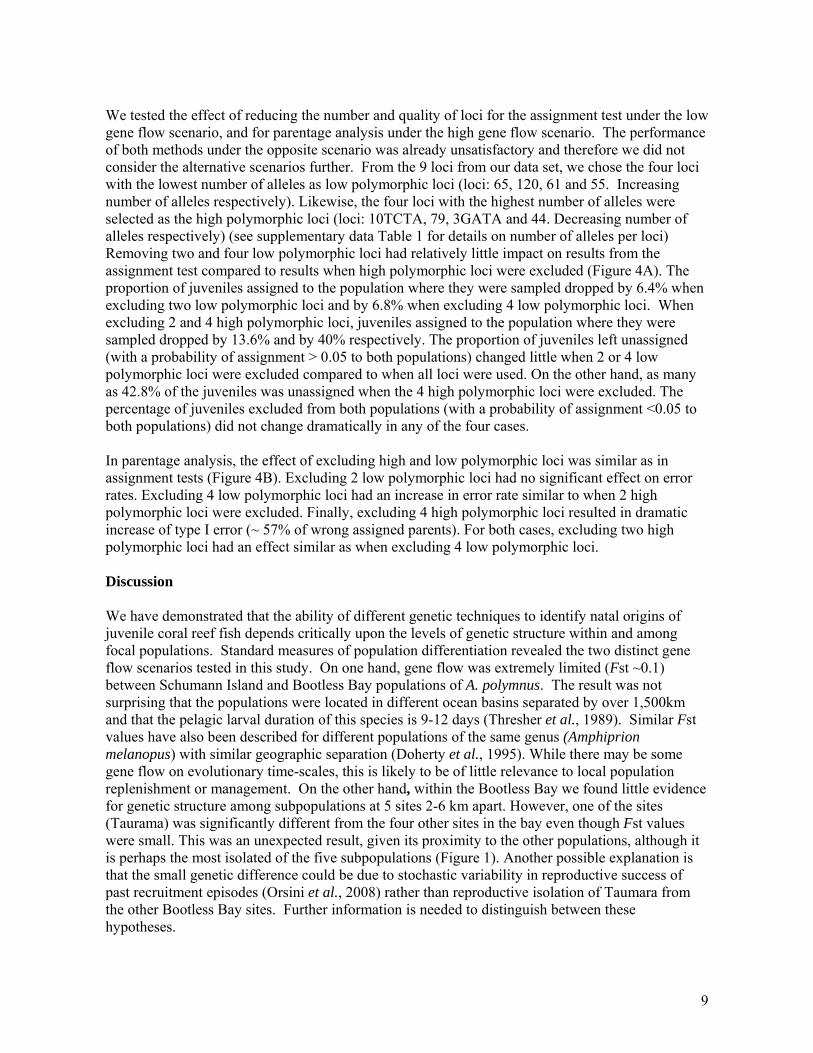
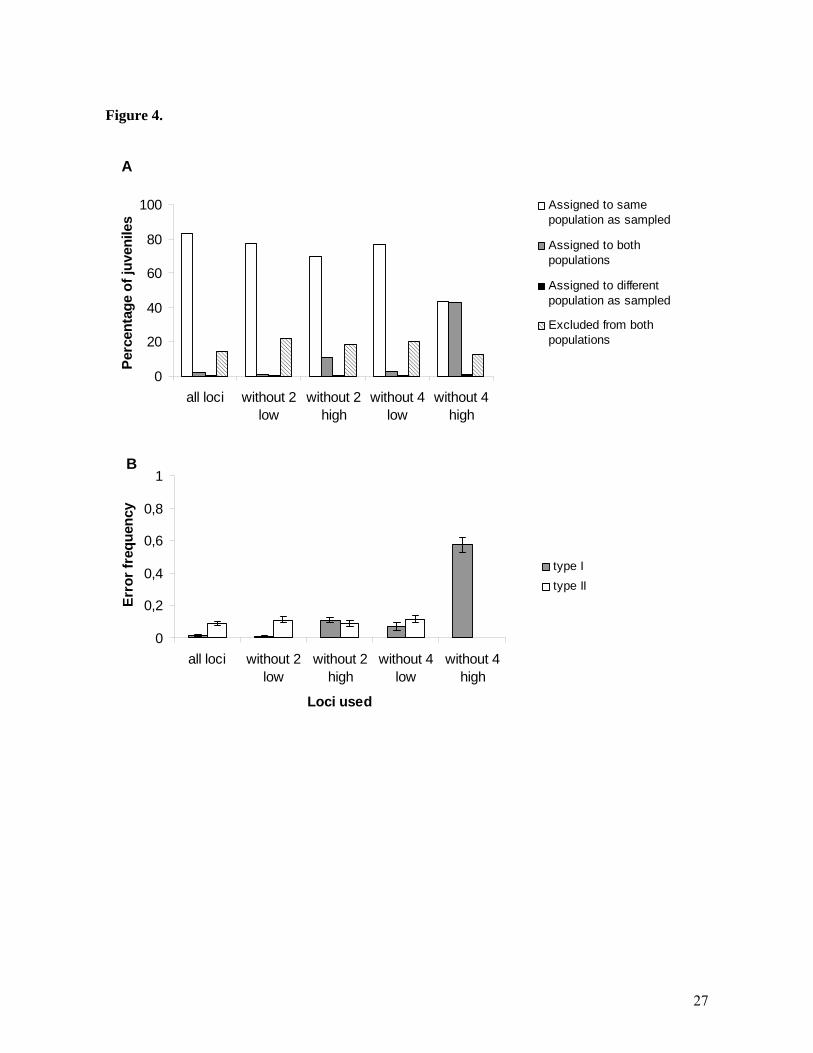
We tested the effect of reducing the number and quality of loci for the assignment test under the low gene flow scenario, and for parentage analysis under the high gene flow scenario. The performance of both methods under the opposite scenario was already unsatisfactory and therefore we did not consider the alternative scenarios further. From the 9 loci from our data set, we chose the four loci with the lowest number of alleles as low polymorphic loci (loci: 65, 120, 61 and 55. Increasing number of alleles respectively). Likewise, the four loci with the highest number of alleles were selected as the high polymorphic loci (loci: 10TCTA, 79, 3GATA and 44. Decreasing number of alleles respectively) (see supplementary data Table 1 for details on number of alleles per loci) Removing two and four low polymorphic loci had relatively little impact on results from the assignment test compared to results when high polymorphic loci were excluded (Figure 4A). The proportion of juveniles assigned to the population where they were sampled dropped by 6.4% when excluding two low polymorphic loci and by 6.8% when excluding 4 low polymorphic loci. When excluding 2 and 4 high polymorphic loci, juveniles assigned to the population where they were sampled dropped by 13.6% and by 40% respectively. The proportion of juveniles left unassigned (with a probability of assignment > 0.05 to both populations) changed little when 2 or 4 low polymorphic loci were excluded compared to when all loci were used. On the other hand, as many as 42.8% of the juveniles was unassigned when the 4 high polymorphic loci were excluded. The percentage of juveniles excluded from both populations (with a probability of assignment <0.05 to both populations) did not change dramatically in any of the four cases. In parentage analysis, the effect of excluding high and low polymorphic loci was similar as in assignment tests (Figure 4B). Excluding 2 low polymorphic loci had no significant effect on error rates. Excluding 4 low polymorphic loci had an increase in error rate similar to when 2 high polymorphic loci were excluded. Finally, excluding 4 high polymorphic loci resulted in dramatic increase of type I error (~ 57% of wrong assigned parents). For both cases, excluding two high polymorphic loci had an effect similar as when excluding 4 low polymorphic loci. Discussion We have demonstrated that the ability of different genetic techniques to identify natal origins of juvenile coral reef fish depends critically upon the levels of genetic structure within and among focal populations. Standard measures of population differentiation revealed the two distinct gene flow scenarios tested in this study. On one hand, gene flow was extremely limited (Fst ~0.1) between Schumann Island and Bootless Bay populations of A. polymnus. The result was not surprising that the populations were located in different ocean basins separated by over 1,500km and that the pelagic larval duration of this species is 9-12 days (Thresher et al., 1989). Similar Fst values have also been described for different populations of the same genus (Amphiprion melanopus) with similar geographic separation (Doherty et al., 1995). While there may be some gene flow on evolutionary time-scales, this is likely to be of little relevance to local population replenishment or management. On the other hand, within the Bootless Bay we found little evidence for genetic structure among subpopulations at 5 sites 2-6 km apart. However, one of the sites (Taurama) was significantly different from the four other sites in the bay even though Fst values were small. This was an unexpected result, given its proximity to the other populations, although it is perhaps the most isolated of the five subpopulations (Figure 1). Another possible explanation is that the small genetic difference could be due to stochastic variability in reproductive success of past recruitment episodes (Orsini et al., 2008) rather than reproductive isolation of Taumara from the other Bootless Bay sites. Further information is needed to distinguish between these hypotheses.
10
Low gene flow scenario We expected the assignment test to perform well when classifying individuals from well differentiated populations given previous results from simulated data (Cornuet et al., 1999; Waples, Gaggiotti, 2006) and from empirical studies on populations with strong genetic differentiation (Underwood et al., 2007). Our assignment tests between Bootless Bay and Schumann island populations also support this conclusion. Out of 244 juveniles classified, almost all were assigned to the regional population where they were collected. Only one juvenile from Schumann Island was assigned to the Bootless Bay population, although the assignment probability of this juvenile was fairly low (0.08) and close to the decision threshold (0.05). Given the distance between the populations, we consider this individual to be wrongly assigned by the test. Alternatively, parentage analysis was not robust to the deviation in panmixia that results from assigning parentage across two differentiated populations. When pooling both populations together, the proportion of parents assigned by both tests (each population separately and both populations pooled) was relatively low (89.6% for Bootless Bay and only 65.2% for Schumann Island). Also, a considerable number of juveniles that were not assigned when the test was done within each population were assigned when the two populations were pooled (20% at Bootless Bay and 67% at Schumann Island). These new assignments were mostly to parents in the same population as the juveniles were collected in, although 3 juveniles were also assigned to parents in the other population. Given that levels of self-recruitment at Schumann have independently been confirmed in larval tagging studies (Jones et al. 2005), these additional parent-offspring relationships are most likely errors. Parentage analysis assumes that all offspring and parents in the data set belong to the same population and LOD scores are estimated using this population’s allele frequencies (Gerber et al., 2000). Our results show clearly that significant changes in allele frequencies have major effects on parentage assignments. It is noteworthy that in our study, changes in allele frequencies on parentage assignments increased the number of wrong assignments in higher proportions than they excluded correct assignments (considering that almost all assignments obtained under each separate test were correct). These results suggest that parentage analysis is not appropriate for low gene flow scenarios, where analytical methods such as assignment tests appear to have greater utility. High gene flow scenario The degree of population differentiation in Bootless Bay was clearly insufficient for assignment tests to discriminate among subpopulations. The tests failed to assign most of the juveniles to any one of the five subpopulations. Only a small number of individuals were assigned to only one of the sites (13 juveniles) compared to the number of juveniles assigned to at least two sites within the bay (146). Overall, the numbers of recruits assigned to the Bootless Bay metapopulation and to Schumann Island were gross overestimates relative to the parentage analysis. In Bootless Bay, given that Taurama had a small but significant genetic signal, we expected that assignments probabilities from or to this site would be greater than to the other sites. However, we found no difference between the assignment probabilities from juveniles assigned to Taurama and juveniles assigned to the other four sites. Also, from the 13 juveniles assigned to only one site, only three were assigned to the same site as the juveniles assigned by parentage analysis at this level.
11
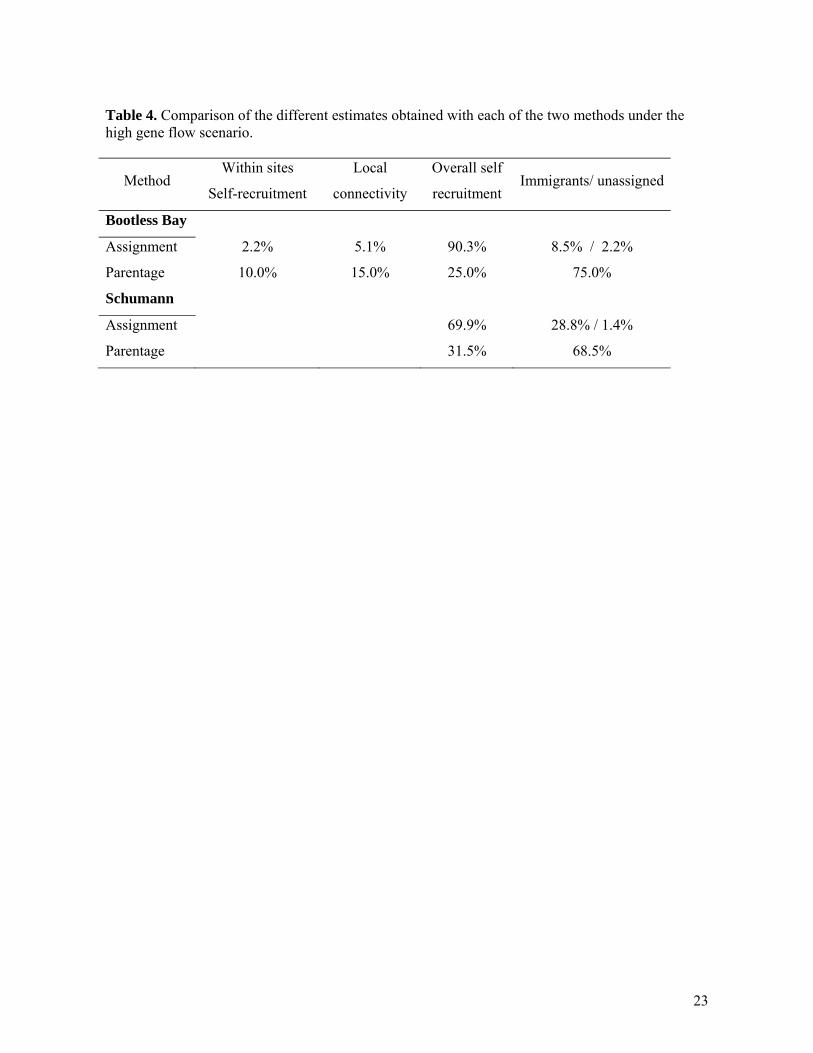
The level of accuracy of assignment tests in our study may be lower than those recorded in the literature. For example, using simulated data Cornuet et al. (1999) showed that Fst values as low as 0.01 could yield to ~ 40% accurate assignment with this method. Carreras-Carbonell et al. (2007) using microsatellite data on Tripterygion delaisi in the NW Mediterranean Sea had a similar problem when attempting to assign individuals to populations that were not genetically different, leaving ~30% of fish with unknown origins unassigned. Parentage analysis can be considered as the method of choice for estimating retention and connectivity in small, spatially discrete, but genetically similar populations. Unlike assignment tests, they produce high-resolution patterns of self-recruitment and dispersal, and estimates of self-recruitment that have been independently tested in A. polymnus using larval marking (Jones et al. 2005). Although local genetic heterogeneity was a potential problem, the slight modification of allele frequencies caused by including and excluding the most genetically distinct site at Bootless Bay (Taurama) had little effect on our estimates of parentage within the four other subpopulations. Results for two juveniles apparently produced by parents from Bootless Bay when the analysis was done without Taurama were reversed when Taurama was included. These individuals had LOD scores close to the threshold value and therefore the probability that the identified parent is the right parent is just slightly superior to that of identifying a wrong parent from the population by chance. There were also missing alleles in the genotypes of these juveniles and we therefore suspect that changes in allele frequencies when including Taurama in the analysis had no significant consequences. This is encouraging because evidence of genetic structure at fine-spatial scale is more common than previously thought in natural populations (Fredsted et al., 2005; Neville et al., 2006; Zamudio, Wieczorek, 2007). The overall levels of self-recruitment and immigration for the two populations as estimated by assignment tests and parentage analysis were very different (Table 4). Assignment tests found 159 juveniles (90.3%) were returning to Bootless Bay populations, and in Schumann Island the self-recruitment estimate was 70%. Parentage analysis, on the other hand, generated self-recruitment estimates of 25% and 31.5% in Bootless Bay and Schuman Island populations, respectively. We believe that estimations of recruitment at this scale based on assignment tests should be treated with caution. When estimating recruitment in marine environments at an ecological level with genetic tools, we assume that the genetic population is larger and extends further than the demographic population under study. Hispersal can maintain genetic homogeneity over relatively large distances (Fauvelot & Planes, 2002) and assignment tests may classify juveniles from the larger genetic population to the local population of interest. The discrepancy between self-recruitment estimates from assignment tests and parentage analysis for Bootless Bay and Schumann Island suggests that close to 65% and 40% respectively of juveniles assigned by GENECLASS2 originated from nearby, genetically similar populations. It is also possible that our parentage analysis has underestimated self-recruitment, because other members of the local populations have yet to be discovered. Other studies of clownfish have shown estimates of self-recruitment as high as 60% (Almany et al., 2007). The assignment method performed by GENECLASS2 has the advantage that it takes in to account the possibility of not having sampled all potential populations (Piry et al., 2004). Using this procedure, we found that 8.5% of the new recruits sampled in Bootless Bay and 28.2% of new recruits from Schumann Island came from distinct genetic populations that we failed to characterize. Even if the origin of these juveniles cannot be established, the fact that they were excluded from all sampled populations means that their population of origin is likely to be distant and genetically distinct from the other incorrectly classified individuals, which are likely to have dispersed from nearby
12
populations. The genetically distinct individuals could have travelled long distances before settling on the anemones and therefore correspond to the tail of the distribution of recruitment versus geographic distance. As this information cannot be obtained using parentage analysis, assignment tests may represent a useful technique for defining the tail end of the dispersal kernel. The complementary use of the two techniques may be the best way to define the dispersal kernel as a whole. Number and polymorphism of loci used Simulation studies have shown that for a given level of differentiation adding loci usually improves the ability to assign individuals correctly among populations (Cornuet et al., 1999; Waples, Gaggiotti, 2006). We found that the quality of loci had a more significant effect than simply the number of loci used. Simulation results have shown that low polymorphic loci produced less accurate assignments than high polymorphic ones (Waples, Gaggiotti, 2006), and our results confirmed this situation. This is not surprising since high levels of polymorphism are related to high mutation rates. As gene flow increases, highly polymorphic loci are more informative because new alleles are constantly being generated within subpopulations and shorter times of isolation are needed to detect small population differentiation. At the same time, in parentage analysis, exclusion probabilities are strongly conditioned by the genotypes of the reported relatives, by the frequency of alleles and by the number of loci (Jamieson, Taylor, 1997). These exclusion probabilities increase with the number of loci used and their level of polymorphism. In our study, parentage error rates increased more when high polymorphic loci were excluded than they did when low polymorphic ones were excluded, demonstrating again that quality of the loci used is more important than quantity. Conclusions While assignment tests perform well at spatial scales over which populations show large genetic differentiation, parentage analysis appears to be a better choice for estimating dispersal at smaller scales among genetically similar populations. Using genetic methods such as assignment tests when trying to measure connectivity at ecologically relevant scales where migration is high enough to maintain genetic homogeneity remains challenging because these methods still have relatively little power under this circumstances. Parentage analysis on the other hand performs well in conditions of high gene flow. However, incomplete sampling of potential parents can be a major drawback. New likelihood approaches such as the one used in this study need further evaluation to assess this problem. Both techniques appear to lead to overestimates of self-recruitment when applied at scales over which assumptions of the approaches are violated. As parentage analysis appears to be robust to small deviations from panmixia, there may be some intermediate level of differentiation at which both techniques provide useful results. Parentage becomes increasingly difficult to apply as the scale of the study and size of the population increases because the accuracy of assignments relies heavily on the fraction of potential parents sampled. However, more research is needed to explore these new likelihood based parentage methods to quantify their performance under different parental sampling scenarios. Ultimately, a combination of both parentage and assignment tests may be the best way to fully describe dispersal kernels and estimate the scale of demographically important connectivity in marine populations. Acknowledgements

13
We thank V. Messmer, V. Thompson, R. Evans, M. Srinivasan,J. Claydon, P. Mantel, S. Neale, and J. Logo for assistance in the field. ARC Centre of Excellence, the National Science Foundation (OCE 0424688), the Coral Reef Initiatives for the Pacific (CRISP), the TOTAL Foundation, Populations Fractionées et Insulaires (PPF EPHE) and GEF/World bank’s CRTR program (Connectivity working group) for financial support. Mahonia Na Dari, Walindi Plantation Resort and Loloata Island resort for logistic support. Special thanks to Max Benjamin, Dik Knight and three anonymous reviewers for useful comments.
14
References
Almany GR, Berumen ML, Thorrold SR, Planes S, Jones GP (2007) Local replenishment of coral reef fish populations in a marine reserve. Science 316, 742-744.
Armsworth PR (2002) Recruitment limitation, population regulation, and larval connectivity in reef fish metapopulations. Ecology 83, 1092-1104.
Baums IB, Miller MW, Hellberg ME (2005) Regionally isolated populations of an imperiled Caribbean coral, Acropora palmata. Molecular Ecology 14, 1377-1390.
Carreras-Carbonell J, Macpherson E, Pascual M (2007) High self-recruitment levels in a Mediterranean littoral fish population revealed by microsatellite markers. Marine Biology 151, 719-727.
Castro J, Pino A, Hermida M, et al. (2006) A microsatellite marker tool for parentage analysis in Senegal sole (Solea senegalensis): Genotyping errors, null alleles and conformance to theoretical assumptions. Aquaculture 261, 1194-1203.
Cornuet J-M, Piry S, Luikart G, Estoup A, Solignac M (1999) New Methods Employing Multilocus Genotypes to Select or Exclude Populations as Origins of Individuals. Genetics 153, 1989-2000.
Cowen RK, Gawarkiewicz G, Pineda J, Thorrold SR, Werner F (2007) Population connectivity in marine systems. An overview. Oceanography 20, 14-21.
Doherty PJ, Planes S, Mather P (1995) Gene flow and larval duration in seven species of fish from the great barrier reef. Ecology 76, 2373-2391.
Duchesne P, Castric T, Bernatchez L (2005) PASOS (parental allocation of singles in open systems): a computer program for individual parental allocation with missing parents. Molecular Ecology Notes 5, 701-704.
Fautin DC, Allen GR (1992) Field guide to anemonefishes and their host sea anemones Western Australia Museum, Perth.
Fauvelot C, Planes S (2002) Understanding origins of present-day genetic structure in marine fish: biologically or historically driven patterns? Marine Biology 141, 773-788.
15
Fredsted T, Pertoldi C, Schierup MH, Kappeler PM (2005) Microsatellite analyses reveal fine-scale genetic structure in grey mouse lemurs (Microcebus murinus). Molecular ecology 14, 2363-2372.
Gerber S, Chabrier P, Kremer A (2003) FAMOZ: a software for parentage analysis using dominant, codominant and uniparentally inherited markers. Molecular ecology notes 3, 479-481.
Gerber S, Mariette S, Streiff R, Bodenes C, Kremer A (2000) Comparison of microsatellites and amplified fragment length polymorphism markers for parentage analysis. Molecular Ecology 9, 1037-1048.
Gerlach G, Atema J, Kingsford MJ, Black KP, Miller-Sims V (2007) Smelling home can prevent dispersal of reef fish larvae. Proceedings of the National Academy of Sciences 104, 858-863.
Hastings A, Botsford LW (2003) Comparing designs of marine reserves for fisheries and for biodiversity. Ecological Applications 13, S65-70.
Hastings A, Botsford LW (2006) Persistence of spatial populations depends on returning home. Proceedings of the National Academy of Sciences 103, 6067-6072.
Hattori A, Yanagisawa Y (1991) Life-history pathways in relation to gonadal sex differentiation in the anemonefish, Amphiprion clarkii, in temperate waters of Japan. Environmental Biology of Fishes 31, 139-155.
Hedgecock D, Barber PH, Edmands S (2007) Genetic approaches to measuring connectivity. Oceanography 20, 70-79.
Hellberg M (2007) Footprints on water: the genetic wake of dispersal among reefs. Coral Reefs 26, 463-473.
James MK, Armsworth PR, Mason LB, Bode L (2002) The structure of reef fish metapopulations: modelling larval dispersal and retention patterns. Proceedings of the Royal Society of London Series B-Biology Sciences 269, 2079-2086.
Jamieson A, Taylor SS (1997) Comparisons of three probability formulae for parentage exclusion. Animal Genetics 28, 397-400.
Jones AG, Ardren WR (2003) Methods of parentage analysis in natural populations. Molecular Ecology 12, 2511-2523.
16
Jones GP, Milicich MJ, Emslie MJ, Lunow C (1999) Self-recruitment in a coral reef fish population. Nature 402, 802-804.
Jones GP, Planes S, Thorrold SR (2005) Coral reef fish larvae settle close to home. Current Biology 15, 1314-1318.
Levin LA (2006) Recent progress in understanding larval dispersal: new directions and digressions. Integrative and Comparative Biology 46, 282-297.
Lockwood DR, Hastings A, Botsford LW (2002) The effects of dispersal patterns on marine reserves: does the tail wag the dog? Theoretical Population Biology 61, 297-309.
Manel S, Gaggiotti OE, Waples RS (2005) Assignment methods: matching biological questions with appropriate techniques. Trends in Ecology & Evolution 20, 136-142.
Manel S, Schwartz MK, Luikart G, Taberlet P (2003) Landscape genetics: combining landscape ecology and population genetics. Trends in Ecology & Evolution 18, 189-197.
Marshall TC, Slate J, Kruuk LEB, Pemberton JM (1998) Statistical confidence for likelihood-based paternity inference in natural populations. Molecular Ecology 7, 639-655.
Meirmans PG (2006) Using the AMOVA framework to estimate a standardized genetic differentiation measure. Evolution 60, 2399-2402.
Morrissey MB, Wilson AJ (2005) The potential costs of accounting for genotypic errors in molecular parentage analyses. Molecular Ecology 14, 4111-4121.
Neville HM, Isaak DJ, Dunham JB, Thurow RF, Rieman BE (2006) Fine-scale natal homing and localized movement as shaped by sex and spawning habitat in Chinook salmon: insights from spatial autocorrelation analysis of individual genotypes. Molecular ecology 15, 4589-4602.
Orsini L, Corander J, Alasentie A, Hanski I (2008) Genetic spatial structure in a butterfly metapopulation correlates better with past than present demographic structure. Molecular ecology 17, 2629-2642.
Paetkau D, Slade R, Burden M, Estoup A (2004) Genetic assignment methods for the direct, real-time estimation of migration rate: a simulation-based exploration of accuracy and power. Molecular ecology 13, 55-65.
17
Palumbi SR (2003) Population genetics, demographic connectivity, and the design of marine reserves. Ecological applications 13, 146-158.
Paris CB, Cowen RK (2004) Direct evidence of a biophysical retention mechanism for coral reef fish larvae. Limnology and Oceanography 49, 1964-1979.
Peakall ROD, Smouse PE (2006) GENALEX 6: genetic analysis in Excel. Population genetic software for teaching and research. Molecular Ecology Notes 6, 288-295.
Piry S, Alapetite A, Cornuet JM, et al. (2004) GENECLASS2: A Software for Genetic Assignment and First-Generation Migrant Detection. Journal of heredity 95, 536-539.
Planes S (2002) Biogeography and larval dispersal inferred from population genetic analysis. In: Coral Reef Fishes. Dynamics and Diversity in a Complex Ecosystem (ed. Sale P), pp. 201-220. Academic Press, San Diego.
Quenouille B, Bouchenak-Khelladi Y, Hervet C, Planes S (2004) Eleven microsatellite loci for the saddleback clownfish Amphiprion polymnus. Molecular Ecology Notes 4, 291-293.
Rannala B, Mountain JL (1997) Detecting immigration by using multilocus genotypes. Proceedings of the National Academy of Sciences 94, 9197-9201.
Raymond M, Rousset F (1995) GENEPOP (Version 1.2): Population Genetics Software for Exact Tests and Ecumenicism. Journal of Heredity 86, 248-249.
Rodzen JA, Famula TR, May B (2004) Estimation of parentage and relatedness in the polyploid white sturgeon (Acipenser transmontanus) using a dominant marker approach for duplicated microsatellite loci. Aquaculture 232, 165-182.
Sale PF, Cowen RK, Danilowicz BS, et al. (2005) Critical science gaps impede use of no-take fishery reserves. Trends in Ecology and Evolution 20, 74-80.
Swearer SE, Caselle JE, Lea DW, Warner RR (1999) Larval retention and recruitment in an island population of a coral-reef fish. Nature 402, 799-802.
Thresher RE, Colin PL, Bell L (1989) Planktonic duration, distribution and population structure of Western and Central Pacific Damselfishes (Pomacentridae). Copeia 1989, 420-434.
18
Underwood JN, Smith LD, Van Oppen MJH, Gilmour JP (2007) Multiple scales of genetic connectivity in a brooding coral on isolated reefs following catastrophic bleaching. Molecular ecology 16, 771-784.
Van Oppen MJH, Gates RD (2006) Conservation genetics and the resilience of reef-building corals. Molecular Ecology 15, 3863-3883.
Waples RS, Gaggiotti O (2006) What is a population? An empirical evaluation of some genetic methods for identifying the number of gene pools and their degree of connectivity. Molecular ecology 15, 1419-1439.
Warner RR, Cowen RK (2002) Local retention of production in marine populations: evidence, mechanisms and consequences. Bulletin of Marine Science 70S, 245-249.
Zamudio KR, Wieczorek AM (2007) Fine-scale spatial genetic structure and dispersal among spotted salamander (Ambystoma maculatum) breeding populations. Molecular ecology 16, 257-274.

19
Figure legends: Figure 1. Satellite image showing the sites of five subpopulations of Amphiprion polymnus within Bootless Bay. The number of anemones and A.polymnus (adult and subadult) at each site are indicated in brackets. Inset: Location of Bootless Bay and Schumann Island study locations in Papua New Guinea, Figure 2. Plots of principal coordinate analysis calculated in GENALEX from standardized distance matrix of pairwise Fst estimates between sites: the first two axes explain 99% of variation. Figure 3. Parentage analysis results using FAMOZ software. A) Number of juveniles assigned in Bootless Bay when the test was done using genotypes from Bootless Bay excluding Taurama (B-T), Bootless Bay all sites (B) and Bootless Bay and Schumann Island (B+S). Columns show assignments divided in to five categories: (i) Juveniles assigned when test was done excluding Taurama B-T (white fill). (ii) Juveniles reassigned within the four previous sites when Taurama was included (B) (squared fill). (iii) New juveniles assigned to/from Taurama (gray fill). (iv) New assignments within the four sites dataset that were not reassigned when Taurama was included in the test (dashed fill). (v) Juveniles from Schumann Island assigned to Bootless Bay (black fill). B) Juveniles assigned when the test was done using genotypes from Schumann Island alone (S), and Schumann Island and Bootless Bay (S+B). (i) Juveniles assigned when test was done only with S (white fill). (ii) Juveniles reassigned within S when Bootless Bay was included (gray fill). (iv) New assignments within Schumann that were not assigned in test S (dashed fill). (v) Juveniles from Bootless Bay assigned to Schumann Island (black fill). Figure 4. A) Assignment test results under the low gene flow scenario (Bootless Bay vs. Schumann Island) using different sets. B) Parentage analysis error rate estimates under the high gene flow scenario using different sets of loci (estimated by test simulations in Famoz for each case). The lines on each bar represent the standard deviation after 30 test simulation replicates. The different sets of loci used were: 2 low = two lowest polymorphic loci (loci 120 and 65). 4 low = four lowest polymorphic loci (loci 120, 65, 55 and 61). 2 high = two highest polymorphic loci (loci 10TCTA and 79). 4 high = four highest polymorphic loci (10TCTA, 79, 3GATA and 44).
20
Tables Table 1. Effects of variation of LOD score introduced error on parentage assignments for the Bootless Bay population. Four different error frequencies were evaluated. For each frequency, the number of assignments in relation with the number of mismatches per assignment is presented as well as the estimation of type I and II statistical errors based on 30 simulations of the parentage.
Simulations
Introduced
error
Error estimation (%)
Type I Type II
0.01 38±4.8 0.1±0.3
0.001 5.8±1.2 8.1±1.3
0.0001 1.9±0.5 8.8±1.3
0 1.4±0.3 9.3±1.8
21
Table 2. A) Pairwise Fst estimates between sites for A. polymnus at Bootless Bay and Schumann Island. Estimates in bold indicate significance based on 104 permutations after sequential Bonferroni corrections (p < 0.05 for all significant comparisons). B) Standardized pairwise Fst values estimated using the AMOVA framework (Meirmans, 2006).
A Bootless Bay
Bank Lions Loloata Motupore Taurama
Bank -
Lions 0.007 -
Loloata 0.006 0.005 -
Motupore 0.007 0.000 0.003 -
Taurama 0.026 0.017 0.021 0.016 -
Schumann 0.111 0.099 0.104 0.101 0.092
B Bootless Bay
Bank Lions Loloata Motupore Taurama
Bank -
Lions 0,029 -
Loloata 0,022 0,020 -
Motupore 0,029 0,000 0,013 -
Taurama 0,109 0,078 0,091 0,067 -
Schumann 0,498 0,483 0,495 0,462 0,459
22
Table 3. Results of assignment analysis with GENECLASS2. Juveniles were assigned to one of the six possible sites (sample size in brackets) if the likelihood of their genotype occurring in that site was greater than 0.05, when compared to a distribution of 104 simulated genotypes from that site. Juveniles that had a likelihood superior than 0.05 were considered to have being originated from one of the sampled sites. Probability of belonging to the assigned population is given in brackets. If an individual’s likelihood was greater than 0.05 for more than one of Bootless Bay sites it was assigned to Bootless Bay as a single unit (all five sites). If the likelihood was greater than 0.05 for both Bootless Bay and Schumann Island it was left unassigned. Juveniles with a likelihood less than 0.05 in all sampled sites were assumed to be immigrants.
Sampling
site
Assigned population Immigrant
s
Unassigne
d Ba Li Lo Mo Ta Bootless Sch
Ba(28) 0 1 (0,16)
1 (0,06) 1 (0,16) 1 (0,08)
24 0 1 1
Li(16) 0 1 (0,06) 0 0 0 13 0 2
Lo(45) 0 0 0 2
(0.10)
(0.12) 0
40 0 3
Mo(59) 0 1 (0,15) 0 2
(0.14)
(0.31) 2
(0.24)
(0.42)
47 0 4 3
Ta(28) 0 0 0 0 1 (0,08) 22 0 5
Sch(73) 0 0 1 (0,08) 0 0 0 51 21 1
23
Table 4. Comparison of the different estimates obtained with each of the two methods under the high gene flow scenario.
Method Within sites
Self-recruitment
Local
connectivity
Overall self
recruitment Immigrants/ unassigned
Bootless Bay
Assignment 2.2% 5.1% 90.3% 8.5% / 2.2%
Parentage 10.0% 15.0% 25.0% 75.0%
Schumann
Assignment 69.9% 28.8% / 1.4%
Parentage 31.5% 68.5%
24
Figures Figure 1
3,5 Km
PapuaNew Guinea
Bootless Bay
Schumann Island
Bootless Bay
Taurama
Lions
Motopoure
Loloata
Bank
(19, 57) (13, 69)
(17,26)(21, 84)
(15, 45)
3,5 Km3,5 Km
PapuaNew Guinea
Bootless Bay
Schumann Island
PapuaNew Guinea
Bootless Bay
Schumann Island
Bootless Bay
Taurama
Lions
Motopoure
Loloata
Bank
(19, 57) (13, 69)
(17,26)(21, 84)
(15, 45)
25
Figure 2
F st
Schumann
Taurama
Motopure
Loloata Jetty
Lions
Loloata Bank
Coord. 1
Co
ord
. 2
26
Figure 3.
0
10
20
30
40
50
60
S S+B
Test
0
10
20
30
40
50
60
B - T B B+S
Test
N°
juve
nile
s as
sign
ed
27
Figure 4.
A
0
20
40
60
80
100
all loci without 2low
without 2high
without 4low
without 4high
Per
cen
tag
e o
f ju
ven
iles
Assigned to samepopulation as sampled
Assigned to bothpopulations
Assigned to differentpopulation as sampled
Excluded from bothpopulations
B
0
0,2
0,4
0,6
0,8
1
all loci without 2low
without 2high
without 4low
without 4high
Loci used
Err
or
freq
uen
cy
type I
type II