Embed Size (px)
Citation preview
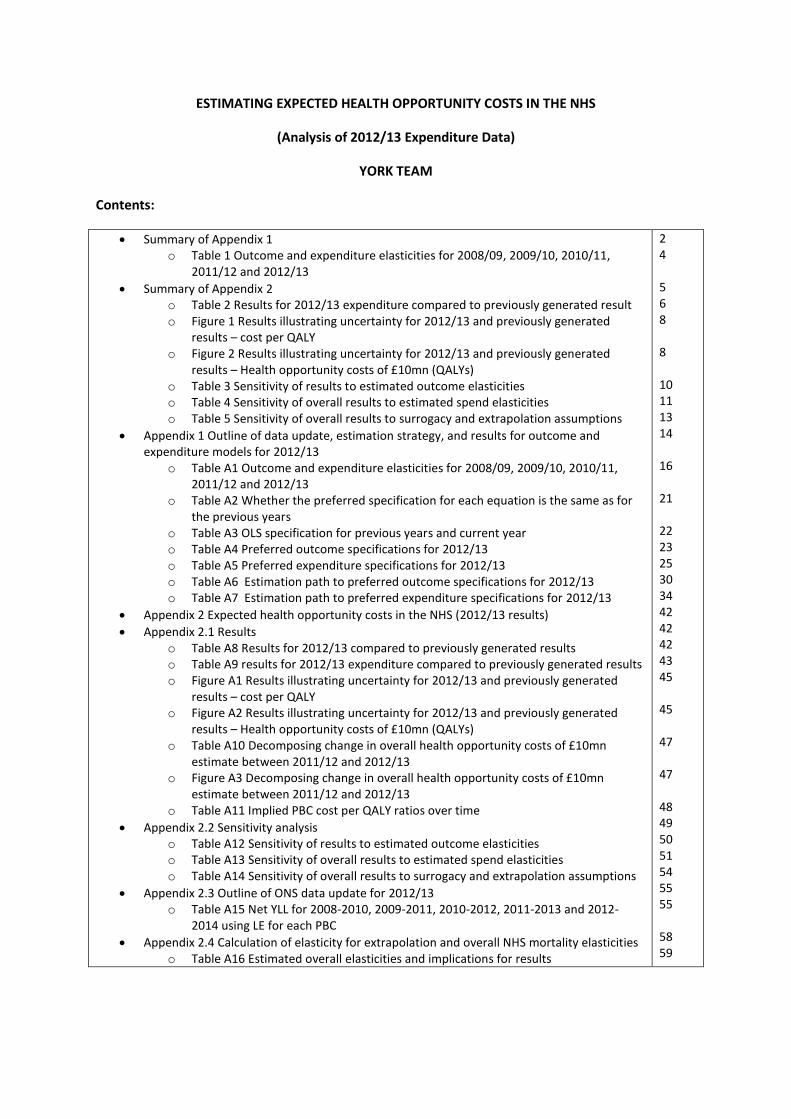
ESTIMATING EXPECTED HEALTH OPPORTUNITY COSTS IN THE NHS
(Analysis of 2012/13 Expenditure Data)
YORK TEAM
Contents:
Summary of Appendix 1 o Table 1 Outcome and expenditure elasticities for 2008/09, 2009/10, 2010/11,
2011/12 and 2012/13
Summary of Appendix 2 o Table 2 Results for 2012/13 expenditure compared to previously generated result o Figure 1 Results illustrating uncertainty for 2012/13 and previously generated
results – cost per QALY o Figure 2 Results illustrating uncertainty for 2012/13 and previously generated
results – Health opportunity costs of £10mn (QALYs) o Table 3 Sensitivity of results to estimated outcome elasticities o Table 4 Sensitivity of overall results to estimated spend elasticities o Table 5 Sensitivity of overall results to surrogacy and extrapolation assumptions
Appendix 1 Outline of data update, estimation strategy, and results for outcome and expenditure models for 2012/13
o Table A1 Outcome and expenditure elasticities for 2008/09, 2009/10, 2010/11, 2011/12 and 2012/13
o Table A2 Whether the preferred specification for each equation is the same as for the previous years
o Table A3 OLS specification for previous years and current year o Table A4 Preferred outcome specifications for 2012/13 o Table A5 Preferred expenditure specifications for 2012/13 o Table A6 Estimation path to preferred outcome specifications for 2012/13 o Table A7 Estimation path to preferred expenditure specifications for 2012/13
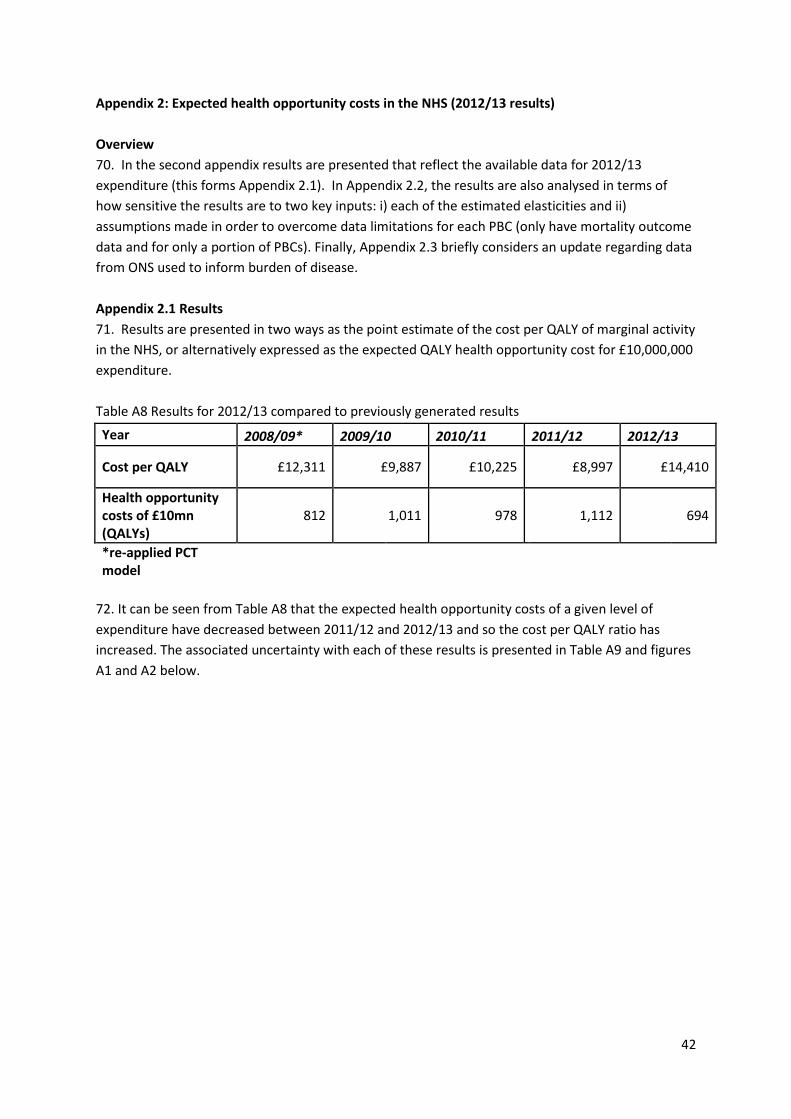
Appendix 2 Expected health opportunity costs in the NHS (2012/13 results)
Appendix 2.1 Results o Table A8 Results for 2012/13 compared to previously generated results o Table A9 results for 2012/13 expenditure compared to previously generated results o Figure A1 Results illustrating uncertainty for 2012/13 and previously generated
results – cost per QALY o Figure A2 Results illustrating uncertainty for 2012/13 and previously generated
results – Health opportunity costs of £10mn (QALYs) o Table A10 Decomposing change in overall health opportunity costs of £10mn
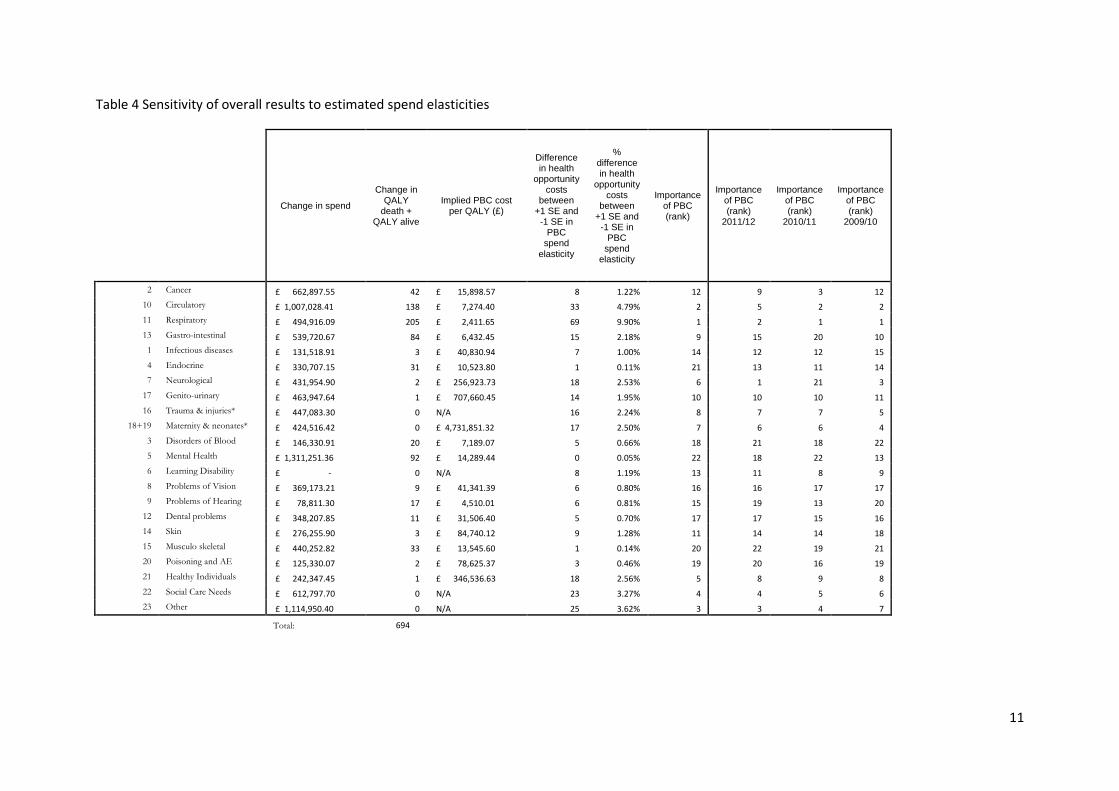
estimate between 2011/12 and 2012/13 o Figure A3 Decomposing change in overall health opportunity costs of £10mn
estimate between 2011/12 and 2012/13 o Table A11 Implied PBC cost per QALY ratios over time
Appendix 2.2 Sensitivity analysis o Table A12 Sensitivity of results to estimated outcome elasticities o Table A13 Sensitivity of overall results to estimated spend elasticities o Table A14 Sensitivity of overall results to surrogacy and extrapolation assumptions
Appendix 2.3 Outline of ONS data update for 2012/13 o Table A15 Net YLL for 2008-2010, 2009-2011, 2010-2012, 2011-2013 and 2012-
2014 using LE for each PBC
Appendix 2.4 Calculation of elasticity for extrapolation and overall NHS mortality elasticities o Table A16 Estimated overall elasticities and implications for results
2 4 5 6 8 8 10 11 13 14 16 21 22 23 25 30 34 42 42 42 43 45 45 47 47 48 49 50 51 54 55 55 58 59
Summary
This document comprises of two appendices:
Summary of Appendix 1: Outline of data update, estimation strategy, and results for outcome and
expenditure models for 2012/13
Starting point: the 2011/12 specification
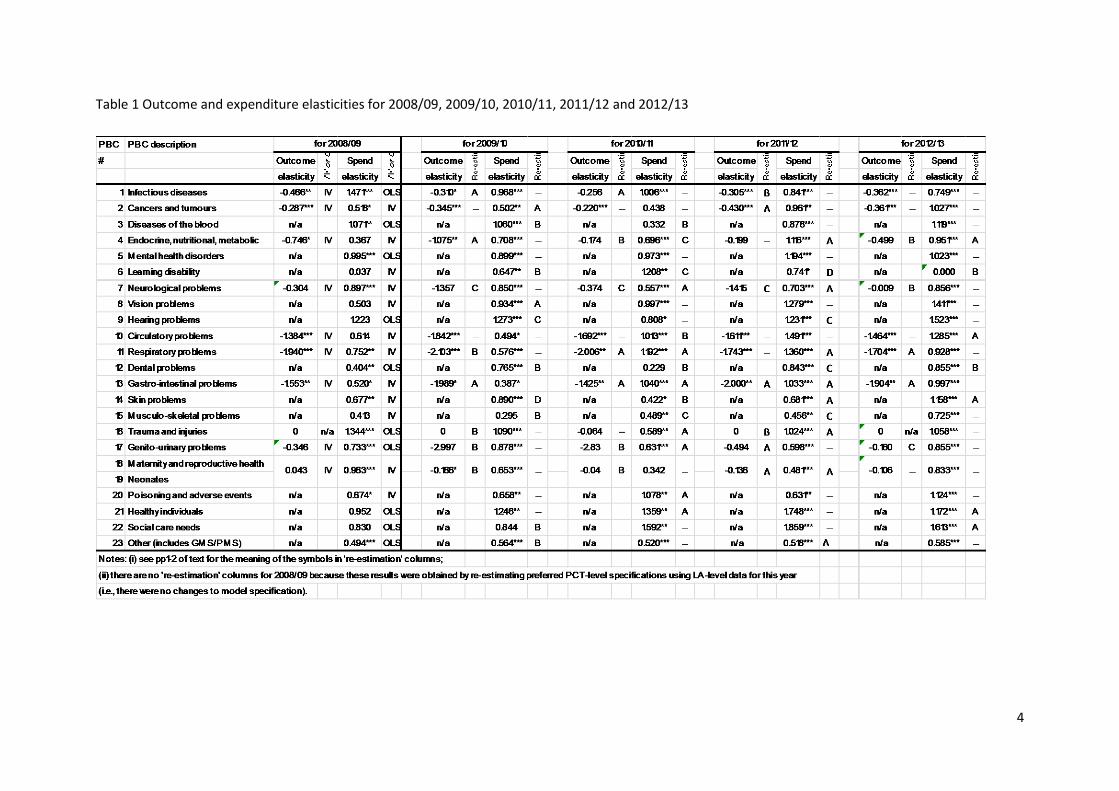
1. Identify the preferred specification for the outcome and expenditure equation for each
programme budget category (PBC) for 2011/12. The outcome and expenditure elasticities
generated by these specifications are shown in Table 1.
Re-estimate the 2011/12 specifications using updated data
2. The 2011/12 specifications have been derived using a combination PCT-level data mapped to LA-
level and direct LA-level data. Update PCT-level data to 2012/13 and put updated PCT-level data
through the appropriate mapper to obtain LA-level data. This will include updating and mapping:
● the PB expenditure data from 2011/12 to 2012/13
● the raw population, unified weighted population, and MFF estimates used and
implied from the 2012/13 DH resource allocation exposition book
● PB specific indices of need (eg infectious diseases, mental health, maternity) from
the DH resource allocation exposition book (where possible).
The PB specific disease prevalence rates as extracted from the HSCIC’s QOF database are reported
for 2012/13 at CCG-level and not PCT-level. Therefore we use values for the previous year
(2011/12); these were reported at PCT-level.
3. Obtain LA-level statistics for those variables that are reported at this unit of analysis. This will
involve updating LA-level data for 2011/12 to 2012/13. This will include updating:
● mortality data for 2011/12/13 with data for 2012/13/14.
Ideally, we should like to update the Census-based variables for 2011 to 2012, but values for the
latter year are not available. Here we use values for 2011 (i.e., values obtained by the Census for
that year). This approach (i.e., using the most recent census value) is identical to the one adopted in
previous work where we did not have two Census values (eg for 2001 and 2011) to interpolate
between.
Estimation strategy for 2012/13: same as for 2011/12
4. Having updated all data (where possible), use the preferred specification for 2011/12 to re-
estimate each outcome and expenditure equation for 2012/13.
5. If this re-estimation produces a result which (a) passes the appropriate statistical tests and (b)
generates coefficients in line with theoretical priors, use this result as our preferred result for
2012/13. This rule is applied to cases where the preferred specification for 2011/12 is either IV or
OLS. If this re-estimation produces an acceptable result, the resulting elasticity shown in Table 1 has
a ‘--‘ in the next column.
6. If the re-estimation produces a result which does not pass tests/have coefficients in line with
priors, re-estimate the equation having adjusted the specification as suggested by the initial result.
So, for example, if the initial estimation implies the presence of weak instruments and one of the
instruments is insignificant in the first-stage regression, try re-estimating the equation without the
insignificant instrument. And if, for example, one of the regressors in the second-stage regression
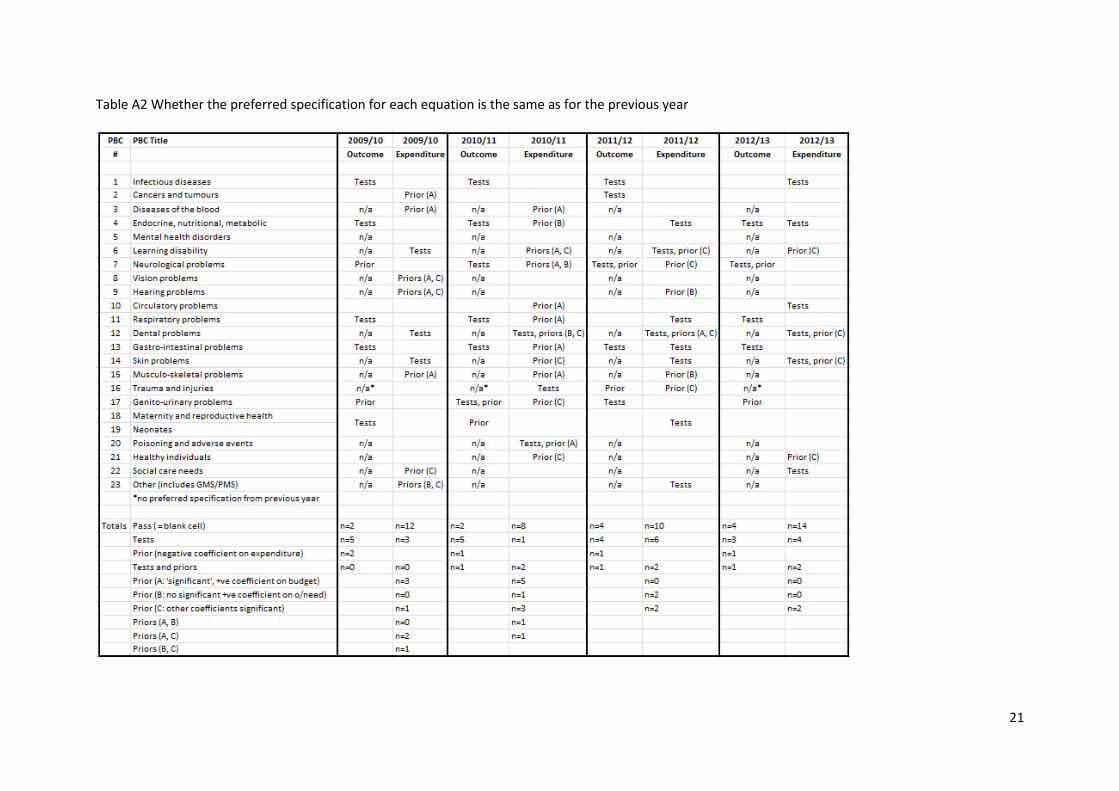
is insignificant, try re-estimating without it. If this re-estimation produces an acceptable result, the
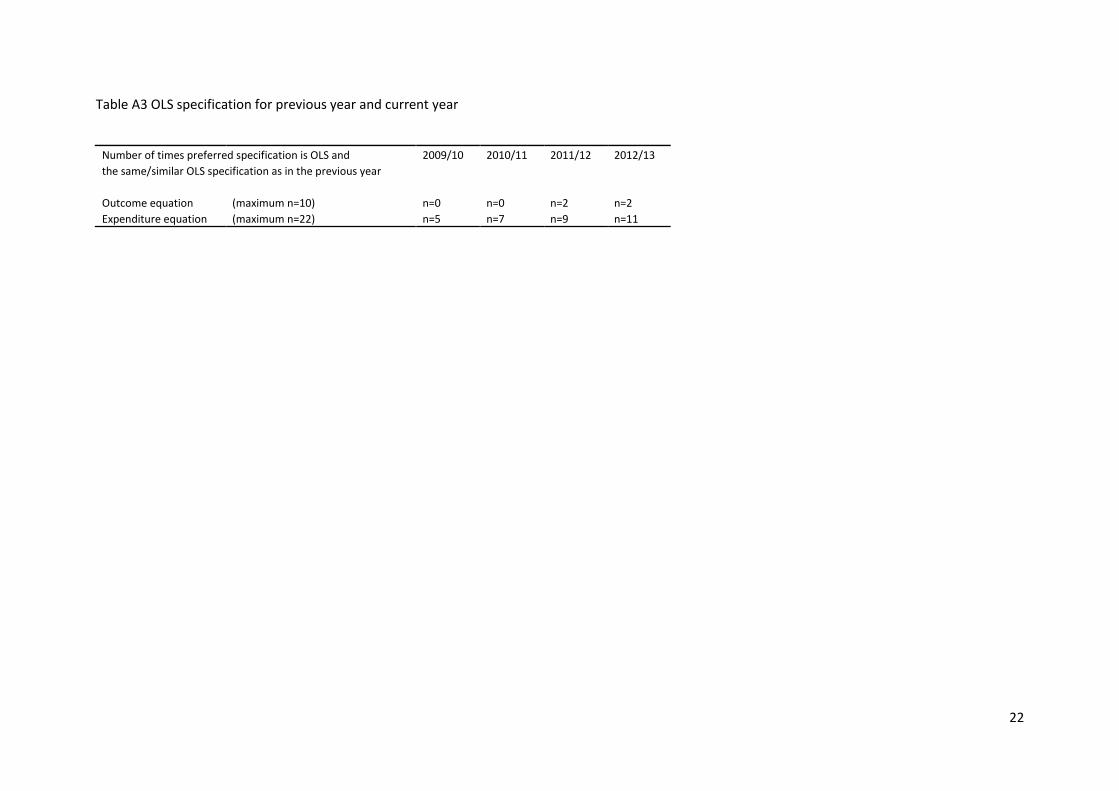
resulting elasticity shown in Table 1 has an ‘A‘ in the next column.
7. If a relatively minor adjustment to the 2011/12 specification does not generate a statistically and
theoretically acceptable result, re-derive the IV equation to be estimated (again, this applies to cases
where the preferred specification for 2011/12 is either IV or OLS). That is, use OLS with backward
stepwise regression to identify relevant covariates to be included in the second-stage regression
having forced in the relevant variables throughout. For the outcome equation we force in own
programme expenditure, and for the expenditure equation the other programme need variable and
the total budget term are forced in throughout the stepwise procedure.
8. Having identified relevant covariates for the second-stage regression, again use stepwise
backward regression to identify relevant instruments for the first-stage conditioning on the
covariates for the second-stage identified above. In other words, these second-stage covariates are
forced in throughout stepwise procedure to identify relevant instruments.
9. Having identified covariates for the second-stage (in 7 above) and instruments for the first-stage
(in 8 above), re-estimate the IV specification equation using these two sets of variables. If the
endogeneity test suggests that a variable (eg own programme expenditure in the outcome equation)
is clearly not endogenous then re-estimate using OLS. If this re-estimation produces an acceptable
result, the resulting elasticity shown in Table 1 has a ‘B‘ in the next column.
10. If the above re-estimation approach produces a result which does not pass tests/have
coefficients in line with priors, re-estimate the equation having adjusted the specification as
suggested by the initial result (for example, if the result fails the misspecification test try adding the
squared value of one of the regressors to the specification). If this re-estimation produces an
acceptable result, the resulting elasticity shown in Table 1 has a ‘C‘ in the next column.
11. If all of the above approaches fail to produce an acceptable result, consider excluding PCTs with
extreme values of expenditure per person. Only explore this option for programmes with small
amounts of expenditure and/or mortality. If this re-estimation approach produces an acceptable
result, the resulting elasticity shown in Table 1 has a ‘D’ in the next column.
12. The estimation strategy outlined above generated the outcome and expenditure elasticities for
2012/13 shown in Table 1.
13. The full result [IV (second-stage) or OLS] associated with each elasticity reported in Table 1 can
be found in Table A3 (for the outcome equations) and Table A4 (for the expenditure equations) in
the appendix.
14. The full estimation path for each result (starting with the re-estimation of the 2011/12
specification with updated data) can be found in Table A5 (for the outcome equations) and Table A6
(for the expenditure equations) in the appendix.
4
Table 1 Outcome and expenditure elasticities for 2008/09, 2009/10, 2010/11, 2011/12 and 2012/13
5
Summary of Appendix 2: Expected health opportunity costs in the NHS (2012/13 results)
Overview
15. In the second appendix results are presented that reflect the available data for 2012/13
expenditure (this forms Appendix 2.1). In Appendix 2.2, the results are also analysed in terms of
how sensitive the results are to two key inputs: i) each of the estimated elasticities and ii)
assumptions made in order to overcome data limitations for each PBC (only have mortality outcome
data and for only a portion of PBCs). Finally, Appendix 2.3 briefly considers an update regarding data
from ONS used to inform burden of disease.
Results
16. Results are presented in two ways as the point estimate of the cost per QALY of marginal activity
in the NHS, or alternatively expressed as the expected QALY health opportunity cost for £10,000,000
expenditure.
6
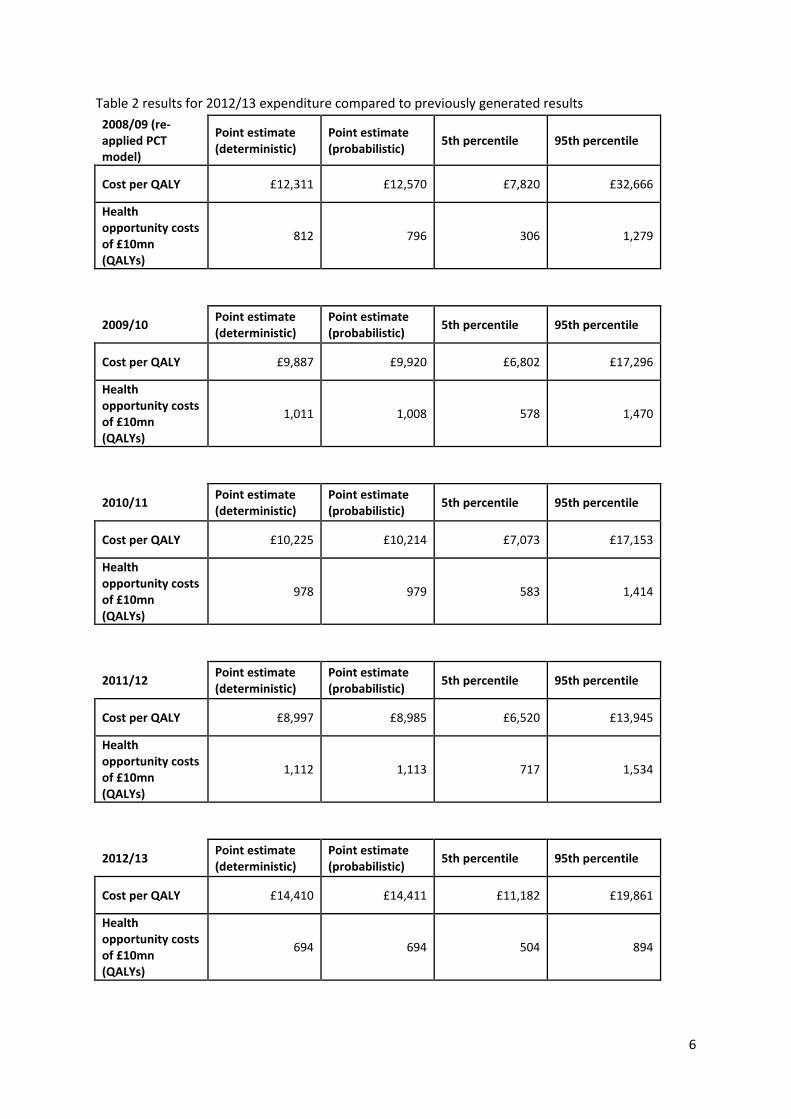
Table 2 results for 2012/13 expenditure compared to previously generated results
2008/09 (re-applied PCT model)
Point estimate (deterministic)
Point estimate (probabilistic)
5th percentile 95th percentile
Cost per QALY £12,311 £12,570 £7,820 £32,666
Health opportunity costs of £10mn (QALYs)
812 796 306 1,279
2009/10
Point estimate (deterministic)
Point estimate (probabilistic)
5th percentile 95th percentile
Cost per QALY £9,887 £9,920 £6,802 £17,296
Health opportunity costs of £10mn (QALYs)
1,011 1,008 578 1,470
2010/11
Point estimate (deterministic)
Point estimate (probabilistic)
5th percentile 95th percentile
Cost per QALY £10,225 £10,214 £7,073 £17,153
Health opportunity costs of £10mn (QALYs)
978 979 583 1,414
2011/12
Point estimate (deterministic)
Point estimate (probabilistic)
5th percentile 95th percentile
Cost per QALY £8,997 £8,985 £6,520 £13,945
Health opportunity costs of £10mn (QALYs)
1,112 1,113 717 1,534
2012/13
Point estimate (deterministic)
Point estimate (probabilistic)
5th percentile 95th percentile
Cost per QALY £14,410 £14,411 £11,182 £19,861
Health opportunity costs of £10mn (QALYs)
694 694 504 894

7
It can be seen from Table 2 that the expected health opportunity costs of a change in expenditure
have decreased slightly between 2011/12 and 2012/13 and so the cost per QALY ratio has risen. The
health opportunity costs of £10mn are greater than those estimated using 2008/9 data with the re-
applied specifications from the PCT model. In this table, the uncertainty associated with these
estimates is shown and it can be judged to what extent any changes in the point estimate between
years should be interpreted as a signal of any trend. From Table 2 it is hard to conclude that there is
a significant change in the health opportunity costs of £10mn expenditure, since there is a great deal
of overlap between the 90% confidence intervals of the years shown.
8
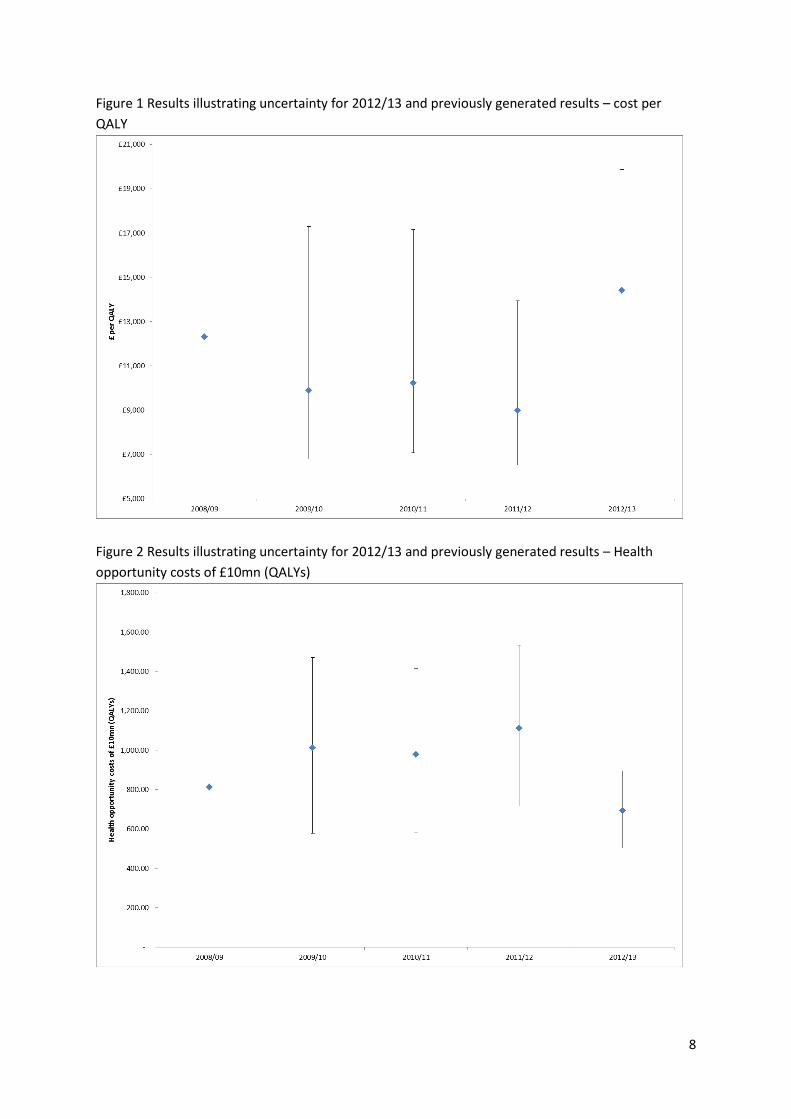
Figure 1 Results illustrating uncertainty for 2012/13 and previously generated results – cost per
QALY
Figure 2 Results illustrating uncertainty for 2012/13 and previously generated results – Health
opportunity costs of £10mn (QALYs)
9
17. The results contained within Table 2 are also represented graphically in Figures 1 and 2. The
confidence intervals are presented for results pertaining to 2009/10 elasticities, 2010/11 elasticities,
2011/12 elasticities and 2012/13 elasticities, but not for 2008/9 elasticities. The reason for this is
that the specifications used for 2009/10, 2010/11, 2011/12 and 2012/13 equations were adjusted if
a re-application of the previous year’s specifications resulted in poor statistical performance (see
Appendix 1). The specification of the 2008/9 models, however, were directly taken from Claxton et
al. (2015) where there were two key differences: analysis was at PCT and not LA level and census
variables used 2001 values not 2008 values (calculated by interpolation between 2001 and 2011
census data). As such, the specification in the 2008/9 models may not have passed all statistical
performance tests once moved to LA level and the instruments were updated to 2008 values (e.g
2008/9 specification may possess weak instruments that lead to imprecise coefficient estimation).
18. It can also be seen from Figures 1 and 2 that while the confidence interval is far from
symmetrically distributed around the point estimate of the cost per QALY ratio in Figure 1 (where
uncertainty is reflected in the denominator), when expressed as health opportunity costs per £10mn
then the distribution of uncertainty is much more symmetric in Figure 2 (uncertainty is reflected in
the numerator).
Sensitivity analysis
19. Appendix 2.2 details three sensitivity analyses that were performed. The first two concerned the
elasticities that were econometrically estimated for each of the PBCs. In the first case each of the
estimated PBC outcome elasticities are varied by +/- 1 standard error. Then, the difference between
the two resulting opportunity costs is presented. When this is larger, this implies that the overall
resulting estimate of health opportunity costs is more sensitive to the outcome elasticity under
consideration. The same procedure is then carried out for each of the PBC expenditure elasticities.
The results of these sensitivity analyses are reported in Tables 3 and 4, with analysis and
interpretation found in Appendix 2.2.
10
Table 3 Sensitivity of results to estimated outcome elasticities
Change in spend
Change in QALY
death + QALY alive
Implied PBC cost per QALY (£)
Difference in health
opportunity costs
between +1 SE and
-1 SE in PBC
outcome
elasticity
% difference in health
opportunity costs
between +1 SE and
-1 SE in PBC
outcome elasticity
Importance of PBC (rank)
Importance of PBC (rank)
2011/12
Importance of PBC (rank)
2010/11
Importance of PBC (rank)
2009/10
2 Cancer £ 662,897.55 42 £ 15,898.57 52 7.48% 5 5 7 7
10 Circulatory £ 1,007,028.41 138 £ 7,274.40 88 12.71% 3 3 3 3
11 Respiratory £ 494,916.09 205 £ 2,411.65 134 19.31% 1 2 1 2
13 Gastro-intestinal £ 539,720.67 84 £ 6,432.45 96 13.85% 2 4 4 4
1 Infectious diseases £ 131,518.91 3 £ 40,830.94 2 0.27% 8 8 8 8
4 Endocrine £ 330,707.15 31 £ 10,523.80 46 6.59% 6 6 6 5
7 Neurological £ 431,954.90 2 £ 256,923.73 73 10.54% 4 1 2 1
17 Genito-urinary £ 463,947.64 1 £ 707,660.45 11 1.57% 7 7 5 6
16 Trauma & injuries* £ 447,083.30 0 N/A - - - - - -
18+19 Maternity & neonates* £ 424,516.42 0 £ 4,731,851.32 0 0.03% 9 9 9 9
3 Disorders of Blood £ 146,330.91 20 £ 7,189.07 - - - - - -
5 Mental Health £ 1,311,251.36 92 £ 14,289.44 - - - - - -
6 Learning Disability £ - 0 N/A - - - - - -
8 Problems of Vision £ 369,173.21 9 £ 41,341.39 - - - - - -
9 Problems of Hearing £ 78,811.30 17 £ 4,510.01 - - - - - -
12 Dental problems £ 348,207.85 11 £ 31,506.40 - - - - - -
14 Skin £ 276,255.90 3 £ 84,740.12 - - - - - -
15 Musculo skeletal £ 440,252.82 33 £ 13,545.60 - - - - - -
20 Poisoning and AE £ 125,330.07 2 £ 78,625.37 - - - - - -
21 Healthy Individuals £ 242,347.45 1 £ 346,536.63 - - - - - -
22 Social Care Needs £ 612,797.70 0 N/A - - - - - -
23 Other £ 1,114,950.40 0 N/A - - - - - -
Total: 694
11
Table 4 Sensitivity of overall results to estimated spend elasticities
Change in spend
Change in QALY
death + QALY alive
Implied PBC cost per QALY (£)
Difference in health
opportunity costs
between +1 SE and
-1 SE in PBC
spend
elasticity
% difference in health
opportunity costs
between +1 SE and
-1 SE in PBC
spend elasticity
Importance of PBC (rank)
Importance of PBC (rank)
2011/12
Importance of PBC (rank)
2010/11
Importance of PBC (rank)
2009/10
2 Cancer £ 662,897.55 42 £ 15,898.57 8 1.22% 12 9 3 12
10 Circulatory £ 1,007,028.41 138 £ 7,274.40 33 4.79% 2 5 2 2
11 Respiratory £ 494,916.09 205 £ 2,411.65 69 9.90% 1 2 1 1
13 Gastro-intestinal £ 539,720.67 84 £ 6,432.45 15 2.18% 9 15 20 10
1 Infectious diseases £ 131,518.91 3 £ 40,830.94 7 1.00% 14 12 12 15
4 Endocrine £ 330,707.15 31 £ 10,523.80 1 0.11% 21 13 11 14
7 Neurological £ 431,954.90 2 £ 256,923.73 18 2.53% 6 1 21 3
17 Genito-urinary £ 463,947.64 1 £ 707,660.45 14 1.95% 10 10 10 11
16 Trauma & injuries* £ 447,083.30 0 N/A 16 2.24% 8 7 7 5
18+19 Maternity & neonates* £ 424,516.42 0 £ 4,731,851.32 17 2.50% 7 6 6 4
3 Disorders of Blood £ 146,330.91 20 £ 7,189.07 5 0.66% 18 21 18 22
5 Mental Health £ 1,311,251.36 92 £ 14,289.44 0 0.05% 22 18 22 13
6 Learning Disability £ - 0 N/A 8 1.19% 13 11 8 9
8 Problems of Vision £ 369,173.21 9 £ 41,341.39 6 0.80% 16 16 17 17
9 Problems of Hearing £ 78,811.30 17 £ 4,510.01 6 0.81% 15 19 13 20
12 Dental problems £ 348,207.85 11 £ 31,506.40 5 0.70% 17 17 15 16
14 Skin £ 276,255.90 3 £ 84,740.12 9 1.28% 11 14 14 18
15 Musculo skeletal £ 440,252.82 33 £ 13,545.60 1 0.14% 20 22 19 21
20 Poisoning and AE £ 125,330.07 2 £ 78,625.37 3 0.46% 19 20 16 19
21 Healthy Individuals £ 242,347.45 1 £ 346,536.63 18 2.56% 5 8 9 8
22 Social Care Needs £ 612,797.70 0 N/A 23 3.27% 4 4 5 6
23 Other £ 1,114,950.40 0 N/A 25 3.62% 3 3 4 7
Total: 694
12
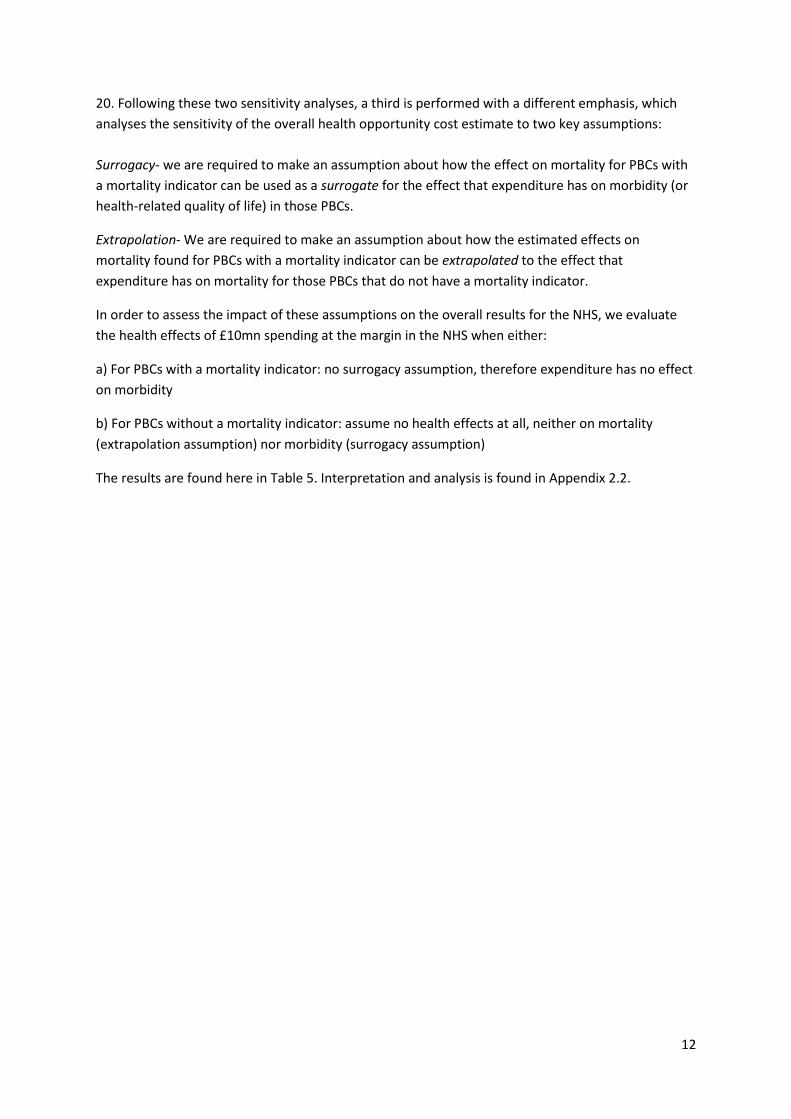
20. Following these two sensitivity analyses, a third is performed with a different emphasis, which
analyses the sensitivity of the overall health opportunity cost estimate to two key assumptions:
Surrogacy- we are required to make an assumption about how the effect on mortality for PBCs with
a mortality indicator can be used as a surrogate for the effect that expenditure has on morbidity (or
health-related quality of life) in those PBCs.
Extrapolation- We are required to make an assumption about how the estimated effects on
mortality found for PBCs with a mortality indicator can be extrapolated to the effect that
expenditure has on mortality for those PBCs that do not have a mortality indicator.
In order to assess the impact of these assumptions on the overall results for the NHS, we evaluate
the health effects of £10mn spending at the margin in the NHS when either:
a) For PBCs with a mortality indicator: no surrogacy assumption, therefore expenditure has no effect
on morbidity
b) For PBCs without a mortality indicator: assume no health effects at all, neither on mortality
(extrapolation assumption) nor morbidity (surrogacy assumption)
The results are found here in Table 5. Interpretation and analysis is found in Appendix 2.2.

13
Table 5 Sensitivity of overall results to surrogacy and extrapolation assumptions
Change in spend Change in
QALY death
Change in QALY alive
Health opportunity costs
sensitivity to mortality/morbidity
assumption (%)
Importance of PBC (rank)
Importance of PBC (rank)
2011/12
Importance of PBC (rank)
2010/11
Importance of PBC (rank)
2009/10
2 Cancer £ 662,897.55 39 3 -0.43% 12 12 18 16
10 Circulatory £ 1,007,028.41 97 42 -6.00% 4 5 4 5
11 Respiratory £ 494,916.09 11 194 -27.93% 1 1 1 2
13 Gastro-intestinal £ 539,720.67 32 52 -7.51% 3 4 3 6
1 Infectious diseases £ 131,518.91 1 2 -0.36% 13 15 14 13
4 Endocrine £ 330,707.15 2 30 -4.26% 6 10 11 4
7 Neurological £ 431,954.90 0 2 -0.24% 14 2 5 1
17 Genito-urinary £ 463,947.64 0 1 -0.07% 17 18 10 10
16 Trauma & injuries* £ 447,083.30 0 0 0.00% - - - -
18+19 Maternity & neonates* £ 424,516.42 0 0 0.00% 18 19 19 19
3 Disorders of Blood £ 146,330.91 1 19 -2.93% 7 7 9 7
5 Mental Health £ 1,311,251.36 8 84 -13.22% 2 3 2 3
6 Learning Disability £ - 0 0 0.00% 19 13 12 15
8 Problems of Vision £ 369,173.21 0 9 -1.29% 10 11 8 12
9 Problems of Hearing £ 78,811.30 0 17 -2.52% 8 8 7 8
12 Dental problems £ 348,207.85 0 11 -1.59% 9 9 13 11
14 Skin £ 276,255.90 1 2 -0.47% 11 14 16 14
15 Musculo skeletal £ 440,252.82 2 31 -4.68% 5 6 6 9
20 Poisoning and AE £ 125,330.07 0 1 -0.23% 15 17 15 17
21 Healthy Individuals £ 242,347.45 0 1 -0.10% 16 16 17 18
22 Social Care Needs £ 612,797.70 0 0 0.00% - - - -
23 Other £ 1,114,950.40 0 0 0.00% - - - -
Total: 194 500
Total change in QALY death + QALY alive
694
14
Appendix 1: Outline of data update, estimation strategy, and results for outcome and expenditure
models for 2012/13
Starting point: the 2011/12 specification
21. Identify the preferred specification for the outcome and expenditure equation for each
programme budget category (PBC) for 2011/12. The outcome and expenditure elasticities
generated by these specifications are shown in Table A1.
Re-estimate the 2011/12 specifications using updated data
22. The 2011/12 specifications have been derived using a combination PCT-level data mapped to LA-
level and direct LA-level data. Update PCT-level data to 2012/13 and put updated PCT-level data
through the appropriate mapper to obtain LA-level data. This will include updating and mapping:
● the PB expenditure data from 2011/12 to 2012/13
● the raw population, unified weighted population, and MFF estimates used and
implied from the 2012/13 DH resource allocation exposition book
● PB specific indices of need (eg infectious diseases, mental health, maternity) from
the DH resource allocation exposition book (where possible).
The PB specific disease prevalence rates as extracted from the HSCIC’s QOF database are reported
for 2012/13 at CCG-level and not PCT-level. Therefore we use values for the previous year
(2011/12); these were reported at PCT-level.
23. Obtain LA-level statistics for those variables that are reported at this unit of analysis. This will
involve updating LA-level data for 2011/12 to 2012/13. This will include updating:
● mortality data for 2011/12/13 with data for 2012/13/14.
Ideally, we should like to update the Census-based variables for 2011 to 2012, but values for the
latter year are not available. Here we use values for 2011 (i.e., values obtained by the Census for
that year). This approach (i.e., using the most recent census value) is identical to the one adopted in
previous work where we did not have two Census values (eg for 2001 and 2011) to interpolate
between.
Estimation strategy for 2012/13: same as for 2011/12
24. Having updated all data (where possible), use the preferred specification for 2011/12 to re-
estimate each outcome and expenditure equation for 2012/13.
25. If this re-estimation produces a result which (a) passes the appropriate statistical tests and (b)
generates coefficients in line with theoretical priors, use this result as our preferred result for
2012/13. This rule is applied to cases where the preferred specification for 2011/12 is either IV or
OLS. If this re-estimation produces an acceptable result, the resulting elasticity shown in Table A1
has a ‘--‘ in the next column.
26. If the re-estimation produces a result which does not pass tests/have coefficients in line with
priors, re-estimate the equation having adjusted the specification as suggested by the initial result.
15
So, for example, if the initial estimation implies the presence of weak instruments and one of the
instruments is insignificant in the first-stage regression, try re-estimating the equation without the
insignificant instrument. And if, for example, one of the regressors in the second-stage regression
is insignificant, try re-estimating without it. If this re-estimation produces an acceptable result, the
resulting elasticity shown in Table A1 has an ‘A‘ in the next column.
27. If a relatively minor adjustment to the 2011/12 specification does not generate a statistically
and theoretically acceptable result, re-derive the IV equation to be estimated (again, this applies to
cases where the preferred specification for 2011/12 is either IV or OLS). That is, use OLS with
backward stepwise regression to identify relevant covariates to be included in the second-stage
regression having forced in the relevant variables throughout. For the outcome equation we force in
own programme expenditure, and for the expenditure equation the other programme need variable
and the total budget term are forced in throughout the stepwise procedure.
28. Having identified relevant covariates for the second-stage regression, again use stepwise
backward regression to identify relevant instruments for the first-stage conditioning on the
covariates for the second-stage identified above. In other words, these second-stage covariates are
forced in throughout stepwise procedure to identify relevant instruments.
29. Having identified covariates for the second-stage (in 27 above) and instruments for the first-
stage (in 28 above), re-estimate the IV specification equation using these two sets of variables. If the
endogeneity test suggests that a variable (eg own programme expenditure in the outcome equation)
is clearly not endogenous then re-estimate using OLS. If this re-estimation produces an acceptable
result, the resulting elasticity shown in Table A1 has a ‘B‘ in the next column.
30. If the above re-estimation approach produces a result which does not pass tests/have
coefficients in line with priors, re-estimate the equation having adjusted the specification as
suggested by the initial result (for example, if the result fails the misspecification test try adding the
squared value of one of the regressors to the specification). If this re-estimation produces an
acceptable result, the resulting elasticity shown in Table A1 has a ‘C‘ in the next column.
31. If all of the above approaches fail to produce an acceptable result, consider excluding PCTs with
extreme values of expenditure per person. Only explore this option for programmes with small
amounts of expenditure and/or mortality. If this re-estimation approach produces an acceptable
result, the resulting elasticity shown in Table A1 has a ‘D’ in the next column.
32. The estimation strategy outlined above generated the outcome and expenditure elasticities for
2012/13 shown in Table A1.
33. The full result [IV (second-stage) or OLS] associated with each elasticity reported in Table A1 can
be found in Table A4 (for the outcome equations) and Table A5 (for the expenditure equations) in
the appendix.
34. The full estimation path for each result (starting with the re-estimation of the 2011/12
specification with updated data) can be found in Table A6 (for the outcome equations) and Table A7
(for the expenditure equations) in the appendix.

16
Table A1 Outcome and expenditure elasticities for 2008/09, 2009/10, 2010/11, 2011/12 and 2012/13
17
Overview of results by PBC
Infectious diseases
35. Outcome: Re-estimation of the 2011/12 specification using updated data generates an
acceptable result, both statistically and in line with priors (see Table A4 and Table A6).
36. Expenditure: Re-estimation of the 2011/12 specification reveals some evidence of mis-
specification (see Table A7). Using our pool of census-based variables, we tried adding an additional
regressor and re-estimating. We did this for each potential additional regressor and selected the
result that ‘passed’ the usual tests and which generated the most significant additional regressor
(see Table A5 and Table A7).
Cancer and tumours
37. Outcome: Re-estimation of the 2011/12 specification using updated data generates an
acceptable result, both statistically and in line with priors (see Table A4 and Table A6).
38. Expenditure: Re-estimation of the 2011/12 specification using updated data generates an
acceptable result (see Table A5 and Table A7).
Blood disorders
39. Expenditure: Re-estimation of the 2011/12 specification using updated data generates an
acceptable result (see Table A5 and Table A7).
Endocrine, nutritional and metabolic
40. Outcome: Re-estimation of the 2011/12 specification using updated data reveals some evidence
of mis-specification (see Table A6). Re-derivation of the specification generates a reasonable result
but the relevant statistical test suggests that expenditure is not endogenous. However, the OLS
equivalent of the IV specification ‘fails’ the reset test so we persevere with the IV result (Table A4
and Table A6).
41. Expenditure: Re-estimation of the 2011/12 specification using updated data reveals some
evidence of mis-specification (see Table A7). We tried adding an additional regressor and re-
estimating but this was not successful. However, the removal of one of the instruments from the
2011/12 specification resolved the issue (see Table A5 and Table A7).
Mental health disorders
42. Expenditure: The 2011/12 specification generates an acceptable result (Table A5 and Table A7).
Learning disability
43. Expenditure: The 2011/12 specification generates a poor result with only one significant
variable (Table A7). Re-derivation of the IV specification for 2012/13 generates an acceptable result
but the endogeneity test suggests that OLS can be used (Table A7). Re-estimation using OLS
generates an acceptable result (Table A5 and Table A7). [Outliers beyond the 5%tiles and 95%tiles
are excluded.]
Neurological problems
18
44. Outcome: Re-estimation of the 2011/12 specification using updated data generates a poor
result (Table A6). Re-derivation generates an acceptable result (Table A6) but expenditure is not
endogenous. OLS re-estimation generates the result shown in Table A4 and Table A6.
45. Expenditure: Re-estimation of the 2011/12 specification using updated data generates a
reasonable result (Table A5 and Table A7).
Problems of vision
46. Expenditure: Re-estimation of the 2011/12 specification using updated data generates an
acceptable result (Table A5 and Table A7).
Problems of hearing
47. Expenditure: Re-estimation of the 2011/12 specification using updated data generates a
reasonable result (Table A5 and Table A7).
Circulatory problems
48. Outcome: The 2011/12 specification generates an acceptable result (Table A4 and Table A6).
49. Expenditure: Re-estimation of the 2011/12 specification using updated data reveals some
evidence of mis-specification (Table A7). We tried adding an additional regressor and re-estimating.
This approach was successful with the addition of either the proportion of the population born
outside the EU or the proportion of the population in the white ethnic group.
We selected the specification with the ‘white ethnic group’ variable because this variable was the
more significant of the two (Table A5 and Table A7).
Respiratory problems
50. Outcome: The 2011/12 specification has weak instruments (Table A6) so we tried adding an
additional instrument and re-estimating. The addition of the ‘unpaid carers’ variable passed all of
our tests and generated the best (the most significant) weak instrument test result (see Table A4 and
Table A6).
51. Expenditure: The 2011/12 specification generates an acceptable result (Table A5 and Table A7).
Dental problems
52. Expenditure: The 2011/12 specification generates a poor result (eg instruments are not valid;
see Table A7). Re-derivation of an IV specification generates a more acceptable result (see Table A5
and Table A7).
19
Gastro-intestinal problems
53. Outcome: The 2011/12 specification is OK but it reveals that the current instrument
(households without a car) is a slightly weak one (see Table A6). Using the relevant F-statistic to
judge strength, we selected the instrument that generates the most significant coefficient on spend
subject to the instrument being a strong one (i.e., with an F-statistic ideally at least 10). This
instrument (lone pensioner households) resolves the weak instrument problem (see Table A4 and
Table A6).
54. Expenditure: The 2011/12 specification generates an acceptable result (Table A5 and Table A7).
Skin problems
55. Expenditure: The 2011/12 specification fails the instrument validity test (Table A7). However,
the addition of one of the instruments (population in professional occupations) to the set of second-
stage regressors generates a significant coefficient on this regressor and this specification passes all
tests and all other regressors are significant (see Table A5 and Table A7). The addition of the other
instrument to the set of second-stage regressors was much less successful.
Musculo-Skeletal system
56. Expenditure: The 2011/12 specification generates an acceptable result (Table A5 and Table A7).
Trauma and injuries
57. Outcome: No updated outcome measure for 2012/13/14 is available (HSCIC).
58. Expenditure: The 2011/12 specification generates an acceptable result (Table A5 and Table A7).
Genito-urinary system
59. Outcome: The 2011/12 specification generates a poor result (positive coefficient on
expenditure; see Table A6). Re-derivation proves unsuccessful (significant positive coefficient on
expenditure) so we returned to the OLS specification associated with the re-derivation and re-
estimated the second-stage using OLS, each time adding a single additional regressor. The only
result in line with our priors was the specification with the CARAN need variable and this result is
shown in Table A4 and Table A6.
60. Expenditure: The 2011/12 specification generates a plausible result (Table A5 and Table A7).
Maternity/Neonates
61. Outcome: The 2011/12 specification generates an acceptable result (see Table A4 and Table
A6).
62. Expenditure: The 2011/12 specification generates an acceptable result (see Table A5 and Table
A7).
20
Poisoning
63. Expenditure: The 2011/12 specification generates an acceptable result (Table A5 and Table A7).
Healthy Individuals
64. Expenditure: The 2011/12 specification generates an OK result but the ‘no qualifications’
variables is insignificant. We tried re-estimating the specification, replacing the ‘no qualifications’
variable with each of the other available needs indicators. Only one specification generated a result
in line with our priors and this replaced the ‘no qualifications’ variable with the ‘percentage long-
term unemployed’ variable (Table A5 and Table A7).
Social Care
65. Expenditure: The 2011/12 specification fails the reset test (Table A7) so we tried adding one
regressor to the specification from the available pool of needs indicators and re-estimating. We did
this for each available regressor, and our preferred specification generates three significant
regressors, passes the reset test, and has the largest R-squared (see Table A7 and Table A5). Note
that the sample restriction to LAs with expenditure per head between the 5th and 95th percentiles is
necessary to exclude ‘outliers’ eg PCTs that are Care Trusts.
GMS/PMS
66. Expenditure: The 2011/12 specification generates a reasonable result (see Table A5 and Table
A7).
All PBCs: Comparing specifications for 2011/12 and 2012/13
67. Table A2 summarises whether the preferred specification for each equation is the same as for
the previous year (indicated by a blank cell) or, if not, why the previous year’s specification is not
suitable. For example, this might be because the previous specification does not 'pass' the
appropriate statistical tests when estimated on updated data (indicated by “Tests”). It could also be
because the estimated coefficients are incompatible with our prior beliefs about their sign and
significance. For example, one of our priors is that, for the outcome equation, health care
expenditure should not have a negative marginal effect on mortality and another is that (“Prior”), in
the expenditure equation, budget should have a positive marginal effect on PBC expenditure (“Prior
(A)”). In a small number of cases, the previous specification might 'fail' on both statistical tests and
on priors.
68. Finally, Table A3 reports the number times where the preferred specification for 2012/13 is OLS
and this is the same/similar specification as was preferred for the previous year (i.e., we do not re-
drive the specification).
Note
69. 2012/13 was the third year the mortality data used the new European Standard Population.
21
Table A2 Whether the preferred specification for each equation is the same as for the previous year
22
Table A3 OLS specification for previous year and current year
Number of times preferred specification is OLS and 2009/10 2010/11 2011/12 2012/13
the same/similar OLS specification as in the previous year
Outcome equation (maximum n=10) n=0 n=0 n=2 n=2
Expenditure equation (maximum n=22) n=5 n=7 n=9 n=11
23
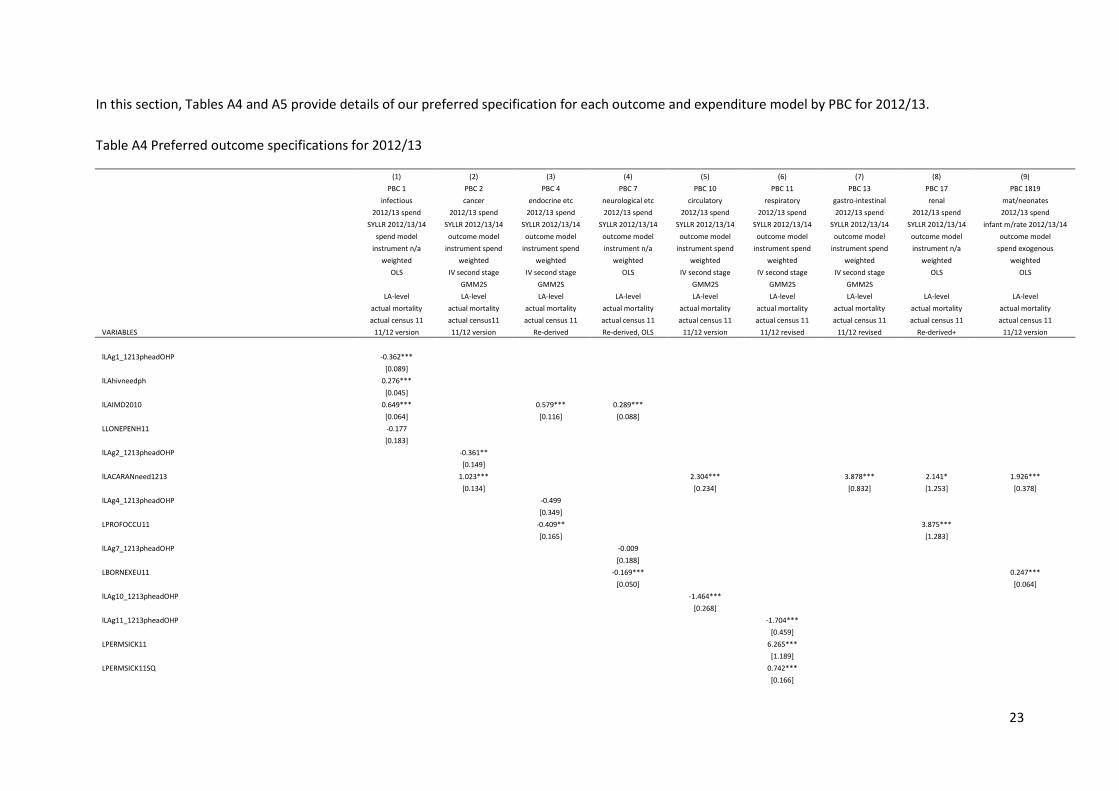
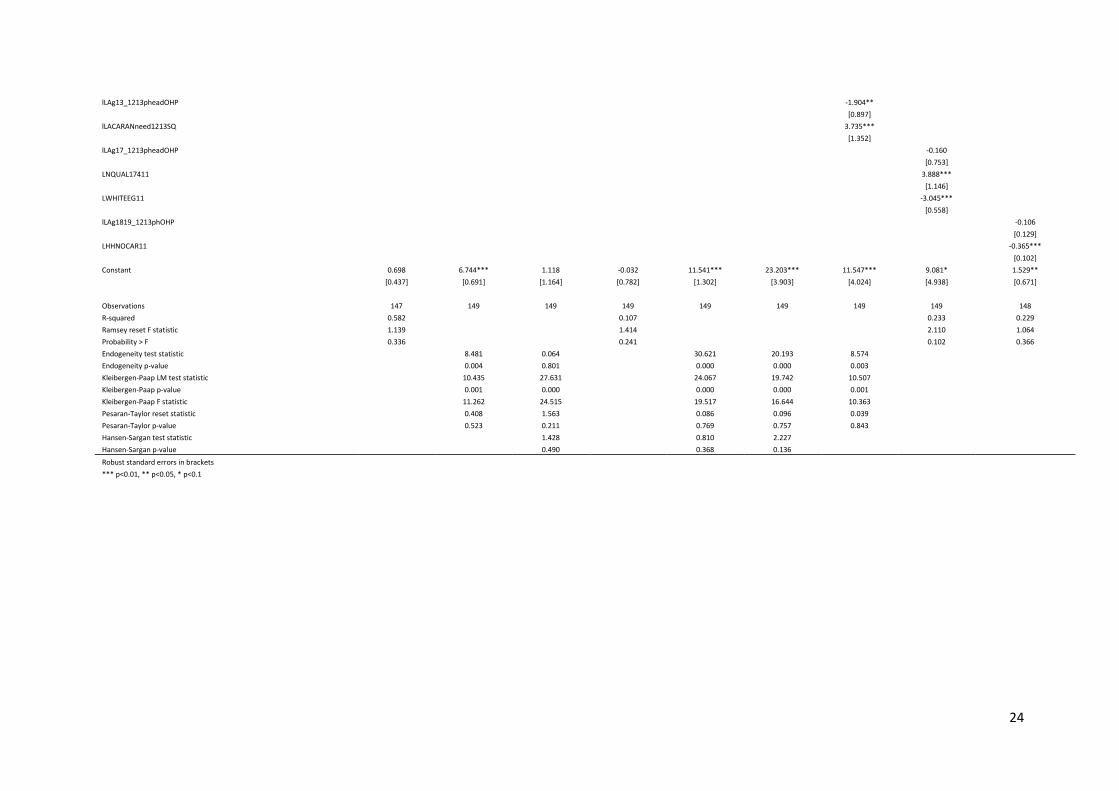
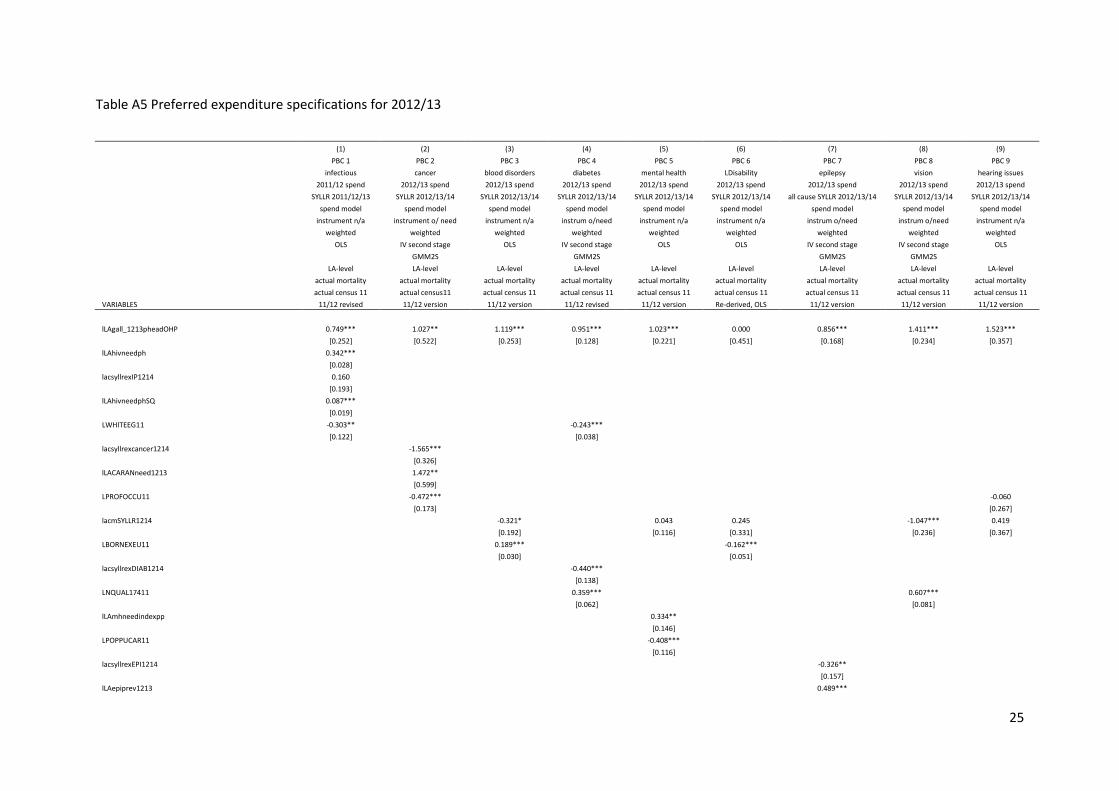
In this section, Tables A4 and A5 provide details of our preferred specification for each outcome and expenditure model by PBC for 2012/13.
Table A4 Preferred outcome specifications for 2012/13
(1) (2) (3) (4) (5) (6) (7) (8) (9)
PBC 1 PBC 2 PBC 4 PBC 7 PBC 10 PBC 11 PBC 13 PBC 17 PBC 1819
infectious cancer endocrine etc neurological etc circulatory respiratory gastro-intestinal renal mat/neonates
2012/13 spend 2012/13 spend 2012/13 spend 2012/13 spend 2012/13 spend 2012/13 spend 2012/13 spend 2012/13 spend 2012/13 spend
SYLLR 2012/13/14 SYLLR 2012/13/14 SYLLR 2012/13/14 SYLLR 2012/13/14 SYLLR 2012/13/14 SYLLR 2012/13/14 SYLLR 2012/13/14 SYLLR 2012/13/14 infant m/rate 2012/13/14
spend model outcome model outcome model outcome model outcome model outcome model outcome model outcome model outcome model
instrument n/a instrument spend instrument spend instrument n/a instrument spend instrument spend instrument spend instrument n/a spend exogenous
weighted weighted weighted weighted weighted weighted weighted weighted weighted
OLS IV second stage IV second stage OLS IV second stage IV second stage IV second stage OLS OLS
GMM2S GMM2S
GMM2S GMM2S GMM2S
LA-level LA-level LA-level LA-level LA-level LA-level LA-level LA-level LA-level
actual mortality actual mortality actual mortality actual mortality actual mortality actual mortality actual mortality actual mortality actual mortality
actual census 11 actual census11 actual census 11 actual census 11 actual census 11 actual census 11 actual census 11 actual census 11 actual census 11
VARIABLES 11/12 version 11/12 version Re-derived Re-derived, OLS 11/12 version 11/12 revised 11/12 revised Re-derived+ 11/12 version
lLAg1_1213pheadOHP -0.362***
[0.089]
lLAhivneedph 0.276***
[0.045]
lLAIMD2010 0.649***
0.579*** 0.289***
[0.064]
[0.116] [0.088]
LLONEPENH11 -0.177
[0.183]
lLAg2_1213pheadOHP
-0.361**
[0.149]
lLACARANneed1213
1.023***
2.304***
3.878*** 2.141* 1.926***
[0.134]
[0.234]
[0.832] [1.253] [0.378]
lLAg4_1213pheadOHP
-0.499
[0.349]
LPROFOCCU11
-0.409**
3.875***
[0.165]
[1.283]
lLAg7_1213pheadOHP
-0.009
[0.188]
LBORNEXEU11
-0.169***
0.247***
[0.050]
[0.064]
lLAg10_1213pheadOHP
-1.464***
[0.268]
lLAg11_1213pheadOHP
-1.704***
[0.459]
LPERMSICK11
6.265***
[1.189]
LPERMSICK11SQ
0.742***
[0.166]
24
lLAg13_1213pheadOHP
-1.904**
[0.897]
lLACARANneed1213SQ
3.735***
[1.352]
lLAg17_1213pheadOHP
-0.160
[0.753]
LNQUAL17411
3.888***
[1.146]
LWHITEEG11
-3.045***
[0.558]
lLAg1819_1213phOHP
-0.106
[0.129]
LHHNOCAR11
-0.365***
[0.102]
Constant 0.698 6.744*** 1.118 -0.032 11.541*** 23.203*** 11.547*** 9.081* 1.529**
[0.437] [0.691] [1.164] [0.782] [1.302] [3.903] [4.024] [4.938] [0.671]
Observations 147 149 149 149 149 149 149 149 148
R-squared 0.582
0.107
0.233 0.229
Ramsey reset F statistic 1.139
1.414
2.110 1.064
Probability > F 0.336
0.241
0.102 0.366
Endogeneity test statistic
8.481 0.064
30.621 20.193 8.574 Endogeneity p-value
0.004 0.801
0.000 0.000 0.003
Kleibergen-Paap LM test statistic
10.435 27.631
24.067 19.742 10.507 Kleibergen-Paap p-value
0.001 0.000
0.000 0.000 0.001
Kleibergen-Paap F statistic
11.262 24.515
19.517 16.644 10.363 Pesaran-Taylor reset statistic
0.408 1.563
0.086 0.096 0.039
Pesaran-Taylor p-value
0.523 0.211
0.769 0.757 0.843 Hansen-Sargan test statistic
1.428
0.810 2.227
Hansen-Sargan p-value 0.490 0.368 0.136
Robust standard errors in brackets *** p<0.01, ** p<0.05, * p<0.1
25
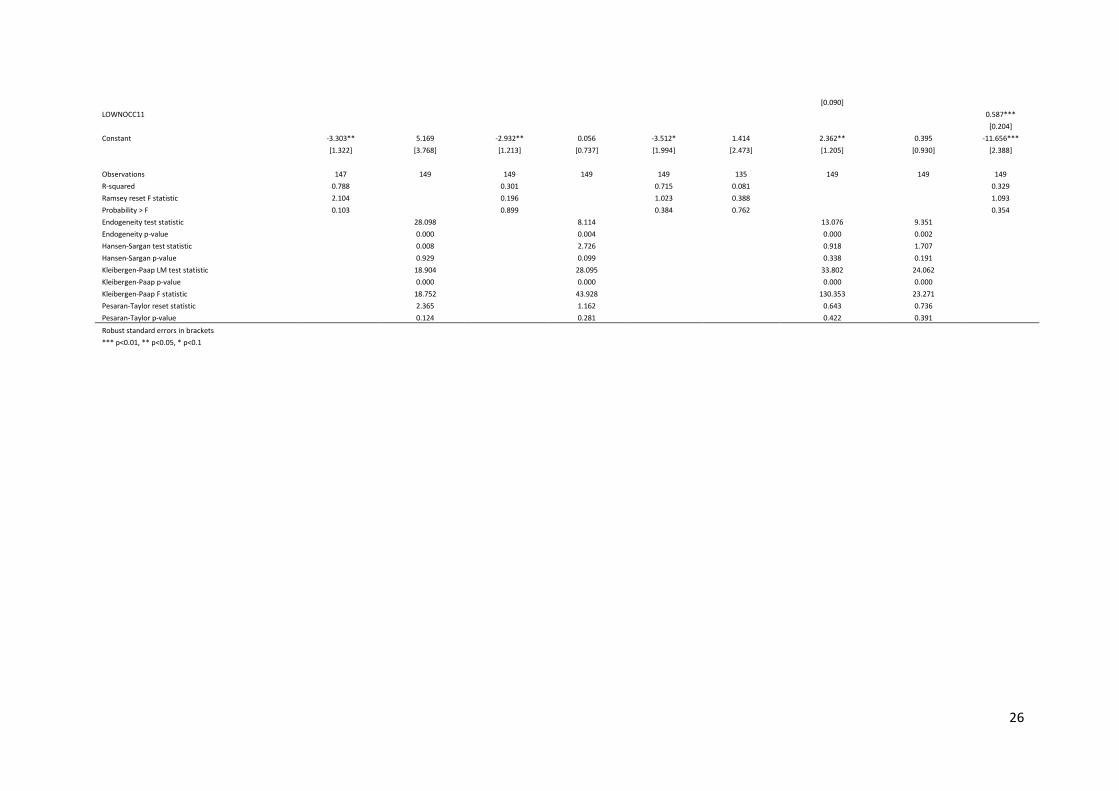
Table A5 Preferred expenditure specifications for 2012/13
(1) (2) (3) (4) (5) (6) (7) (8) (9)
PBC 1 PBC 2 PBC 3 PBC 4 PBC 5 PBC 6 PBC 7 PBC 8 PBC 9
infectious cancer blood disorders diabetes mental health LDisability epilepsy vision hearing issues
2011/12 spend 2012/13 spend 2012/13 spend 2012/13 spend 2012/13 spend 2012/13 spend 2012/13 spend 2012/13 spend 2012/13 spend
SYLLR 2011/12/13 SYLLR 2012/13/14 SYLLR 2012/13/14 SYLLR 2012/13/14 SYLLR 2012/13/14 SYLLR 2012/13/14 all cause SYLLR 2012/13/14 SYLLR 2012/13/14 SYLLR 2012/13/14
spend model spend model spend model spend model spend model spend model spend model spend model spend model
instrument n/a instrument o/ need instrument n/a instrum o/need instrument n/a instrument n/a instrum o/need instrum o/need instrument n/a
weighted weighted weighted weighted weighted weighted weighted weighted weighted
OLS IV second stage OLS IV second stage OLS OLS IV second stage IV second stage OLS
GMM2S
GMM2S
GMM2S GMM2S
LA-level LA-level LA-level LA-level LA-level LA-level LA-level LA-level LA-level
actual mortality actual mortality actual mortality actual mortality actual mortality actual mortality actual mortality actual mortality actual mortality
actual census 11 actual census11 actual census 11 actual census 11 actual census 11 actual census 11 actual census 11 actual census 11 actual census 11
VARIABLES 11/12 revised 11/12 version 11/12 version 11/12 revised 11/12 version Re-derived, OLS 11/12 version 11/12 version 11/12 version
lLAgall_1213pheadOHP 0.749*** 1.027** 1.119*** 0.951*** 1.023*** 0.000 0.856*** 1.411*** 1.523***
[0.252] [0.522] [0.253] [0.128] [0.221] [0.451] [0.168] [0.234] [0.357]
lLAhivneedph 0.342***
[0.028]
lacsyllrexIP1214 0.160
[0.193]
lLAhivneedphSQ 0.087***
[0.019]
LWHITEEG11 -0.303**
-0.243***
[0.122]
[0.038]
lacsyllrexcancer1214
-1.565***
[0.326]
lLACARANneed1213
1.472**
[0.599]
LPROFOCCU11
-0.472***
-0.060
[0.173]
[0.267]
lacmSYLLR1214
-0.321*
0.043 0.245
-1.047*** 0.419
[0.192]
[0.116] [0.331]
[0.236] [0.367]
LBORNEXEU11
0.189***
-0.162***
[0.030]
[0.051]
lacsyllrexDIAB1214
-0.440***
[0.138]
LNQUAL17411
0.359***
0.607***
[0.062]
[0.081]
lLAmhneedindexpp
0.334**
[0.146]
LPOPPUCAR11
-0.408***
[0.116]
lacsyllrexEPI1214
-0.326**
[0.157]
lLAepiprev1213
0.489***
26
[0.090]
LOWNOCC11
0.587***
[0.204]
Constant -3.303** 5.169 -2.932** 0.056 -3.512* 1.414 2.362** 0.395 -11.656***
[1.322] [3.768] [1.213] [0.737] [1.994] [2.473] [1.205] [0.930] [2.388]
Observations 147 149 149 149 149 135 149 149 149
R-squared 0.788
0.301
0.715 0.081
0.329
Ramsey reset F statistic 2.104
0.196
1.023 0.388
1.093
Probability > F 0.103
0.899
0.384 0.762
0.354
Endogeneity test statistic
28.098
8.114
13.076 9.351 Endogeneity p-value
0.000
0.004
0.000 0.002
Hansen-Sargan test statistic
0.008
2.726
0.918 1.707 Hansen-Sargan p-value
0.929
0.099
0.338 0.191
Kleibergen-Paap LM test statistic
18.904
28.095
33.802 24.062 Kleibergen-Paap p-value
0.000
0.000
0.000 0.000
Kleibergen-Paap F statistic
18.752
43.928
130.353 23.271 Pesaran-Taylor reset statistic
2.365
1.162
0.643 0.736
Pesaran-Taylor p-value 0.124 0.281 0.422 0.391
Robust standard errors in brackets *** p<0.01, ** p<0.05, * p<0.1
27
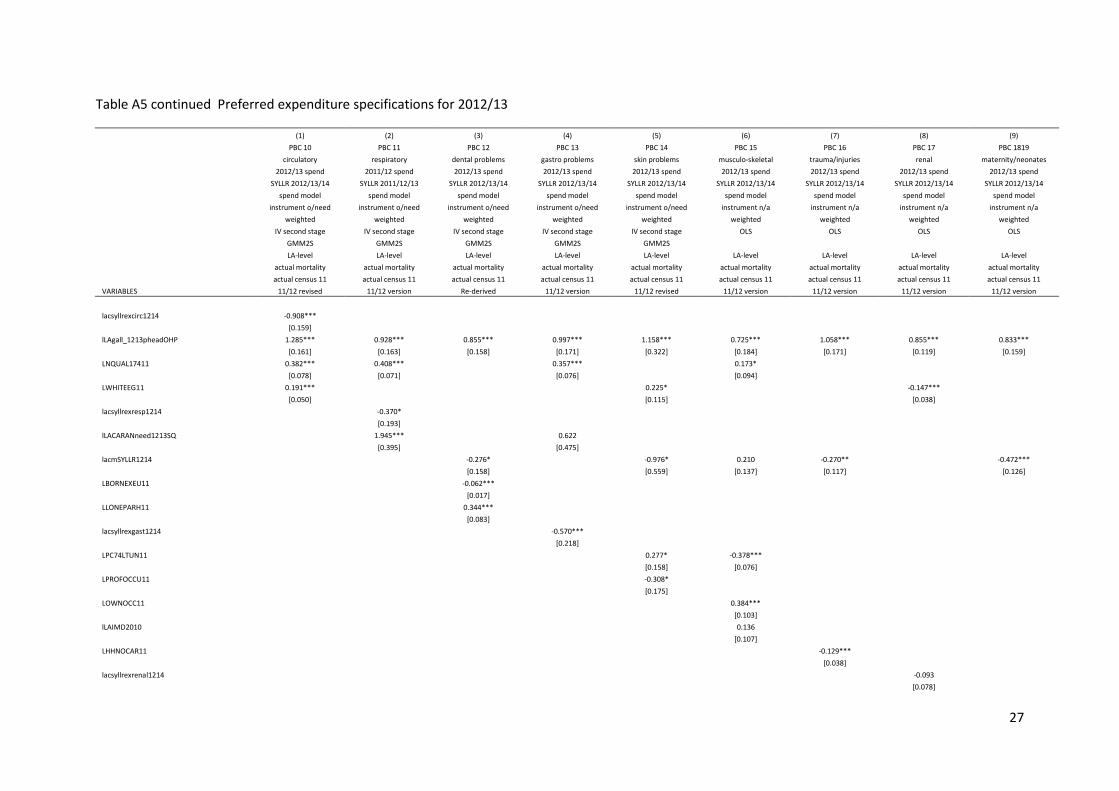
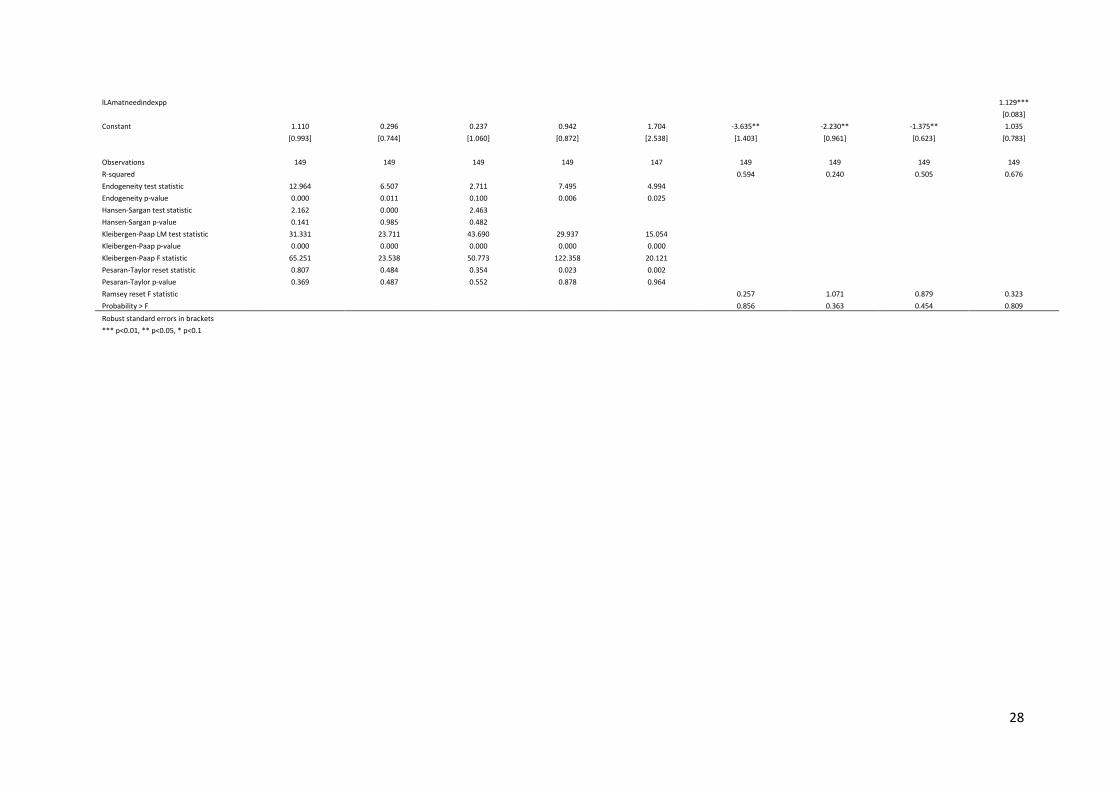
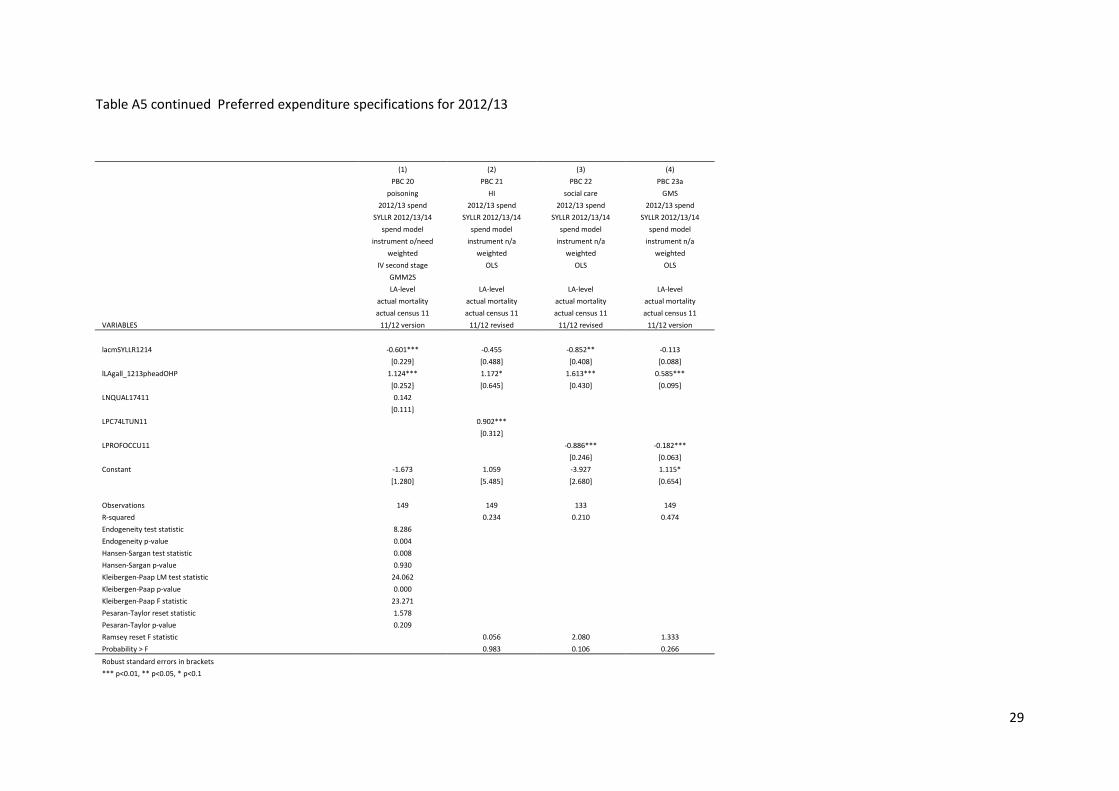
Table A5 continued Preferred expenditure specifications for 2012/13
(1) (2) (3) (4) (5) (6) (7) (8) (9)
PBC 10 PBC 11 PBC 12 PBC 13 PBC 14 PBC 15 PBC 16 PBC 17 PBC 1819
circulatory respiratory dental problems gastro problems skin problems musculo-skeletal trauma/injuries renal maternity/neonates
2012/13 spend 2011/12 spend 2012/13 spend 2012/13 spend 2012/13 spend 2012/13 spend 2012/13 spend 2012/13 spend 2012/13 spend
SYLLR 2012/13/14 SYLLR 2011/12/13 SYLLR 2012/13/14 SYLLR 2012/13/14 SYLLR 2012/13/14 SYLLR 2012/13/14 SYLLR 2012/13/14 SYLLR 2012/13/14 SYLLR 2012/13/14
spend model spend model spend model spend model spend model spend model spend model spend model spend model
instrument o/need instrument o/need instrument o/need instrument o/need instrument o/need instrument n/a instrument n/a instrument n/a instrument n/a
weighted weighted weighted weighted weighted weighted weighted weighted weighted
IV second stage IV second stage IV second stage IV second stage IV second stage OLS OLS OLS OLS
GMM2S GMM2S GMM2S GMM2S GMM2S
LA-level LA-level LA-level LA-level LA-level LA-level LA-level LA-level LA-level
actual mortality actual mortality actual mortality actual mortality actual mortality actual mortality actual mortality actual mortality actual mortality
actual census 11 actual census 11 actual census 11 actual census 11 actual census 11 actual census 11 actual census 11 actual census 11 actual census 11
VARIABLES 11/12 revised 11/12 version Re-derived 11/12 version 11/12 revised 11/12 version 11/12 version 11/12 version 11/12 version
lacsyllrexcirc1214 -0.908***
[0.159]
lLAgall_1213pheadOHP 1.285*** 0.928*** 0.855*** 0.997*** 1.158*** 0.725*** 1.058*** 0.855*** 0.833***
[0.161] [0.163] [0.158] [0.171] [0.322] [0.184] [0.171] [0.119] [0.159]
LNQUAL17411 0.382*** 0.408***
0.357***
0.173*
[0.078] [0.071]
[0.076]
[0.094]
LWHITEEG11 0.191***
0.225*
-0.147***
[0.050]
[0.115]
[0.038]
lacsyllrexresp1214
-0.370*
[0.193]
lLACARANneed1213SQ
1.945***
0.622
[0.395]
[0.475]
lacmSYLLR1214
-0.276*
-0.976* 0.210 -0.270**
-0.472***
[0.158]
[0.559] [0.137] [0.117]
[0.126]
LBORNEXEU11
-0.062***
[0.017]
LLONEPARH11
0.344***
[0.083]
lacsyllrexgast1214
-0.570***
[0.218]
LPC74LTUN11
0.277* -0.378***
[0.158] [0.076]
LPROFOCCU11
-0.308*
[0.175]
LOWNOCC11
0.384***
[0.103]
lLAIMD2010
0.136
[0.107]
LHHNOCAR11
-0.129***
[0.038]
lacsyllrexrenal1214
-0.093
[0.078]
28
lLAmatneedindexpp
1.129***
[0.083]
Constant 1.110 0.296 0.237 0.942 1.704 -3.635** -2.230** -1.375** 1.035
[0.993] [0.744] [1.060] [0.872] [2.538] [1.403] [0.961] [0.623] [0.783]
Observations 149 149 149 149 147 149 149 149 149
R-squared
0.594 0.240 0.505 0.676
Endogeneity test statistic 12.964 6.507 2.711 7.495 4.994 Endogeneity p-value 0.000 0.011 0.100 0.006 0.025 Hansen-Sargan test statistic 2.162 0.000 2.463
Hansen-Sargan p-value 0.141 0.985 0.482 Kleibergen-Paap LM test statistic 31.331 23.711 43.690 29.937 15.054
Kleibergen-Paap p-value 0.000 0.000 0.000 0.000 0.000 Kleibergen-Paap F statistic 65.251 23.538 50.773 122.358 20.121 Pesaran-Taylor reset statistic 0.807 0.484 0.354 0.023 0.002 Pesaran-Taylor p-value 0.369 0.487 0.552 0.878 0.964 Ramsey reset F statistic
0.257 1.071 0.879 0.323
Probability > F 0.856 0.363 0.454 0.809
Robust standard errors in brackets *** p<0.01, ** p<0.05, * p<0.1
29
Table A5 continued Preferred expenditure specifications for 2012/13
(1) (2) (3) (4)
PBC 20 PBC 21 PBC 22 PBC 23a
poisoning HI social care GMS
2012/13 spend 2012/13 spend 2012/13 spend 2012/13 spend
SYLLR 2012/13/14 SYLLR 2012/13/14 SYLLR 2012/13/14 SYLLR 2012/13/14
spend model spend model spend model spend model
instrument o/need instrument n/a instrument n/a instrument n/a
weighted weighted weighted weighted
IV second stage OLS OLS OLS
GMM2S
LA-level LA-level LA-level LA-level
actual mortality actual mortality actual mortality actual mortality
actual census 11 actual census 11 actual census 11 actual census 11
VARIABLES 11/12 version 11/12 revised 11/12 revised 11/12 version lacmSYLLR1214 -0.601*** -0.455 -0.852** -0.113
[0.229] [0.488] [0.408] [0.088]
lLAgall_1213pheadOHP 1.124*** 1.172* 1.613*** 0.585***
[0.252] [0.645] [0.430] [0.095]
LNQUAL17411 0.142
[0.111]
LPC74LTUN11
0.902***
[0.312]
LPROFOCCU11
-0.886*** -0.182***
[0.246] [0.063]
Constant -1.673 1.059 -3.927 1.115*
[1.280] [5.485] [2.680] [0.654]
Observations 149 149 133 149 R-squared
0.234 0.210 0.474
Endogeneity test statistic 8.286 Endogeneity p-value 0.004 Hansen-Sargan test statistic 0.008 Hansen-Sargan p-value 0.930 Kleibergen-Paap LM test statistic 24.062 Kleibergen-Paap p-value 0.000 Kleibergen-Paap F statistic 23.271 Pesaran-Taylor reset statistic 1.578 Pesaran-Taylor p-value 0.209 Ramsey reset F statistic
0.056 2.080 1.333
Probability > F 0.983 0.106 0.266 Robust standard errors in brackets
*** p<0.01, ** p<0.05, * p<0.1
30
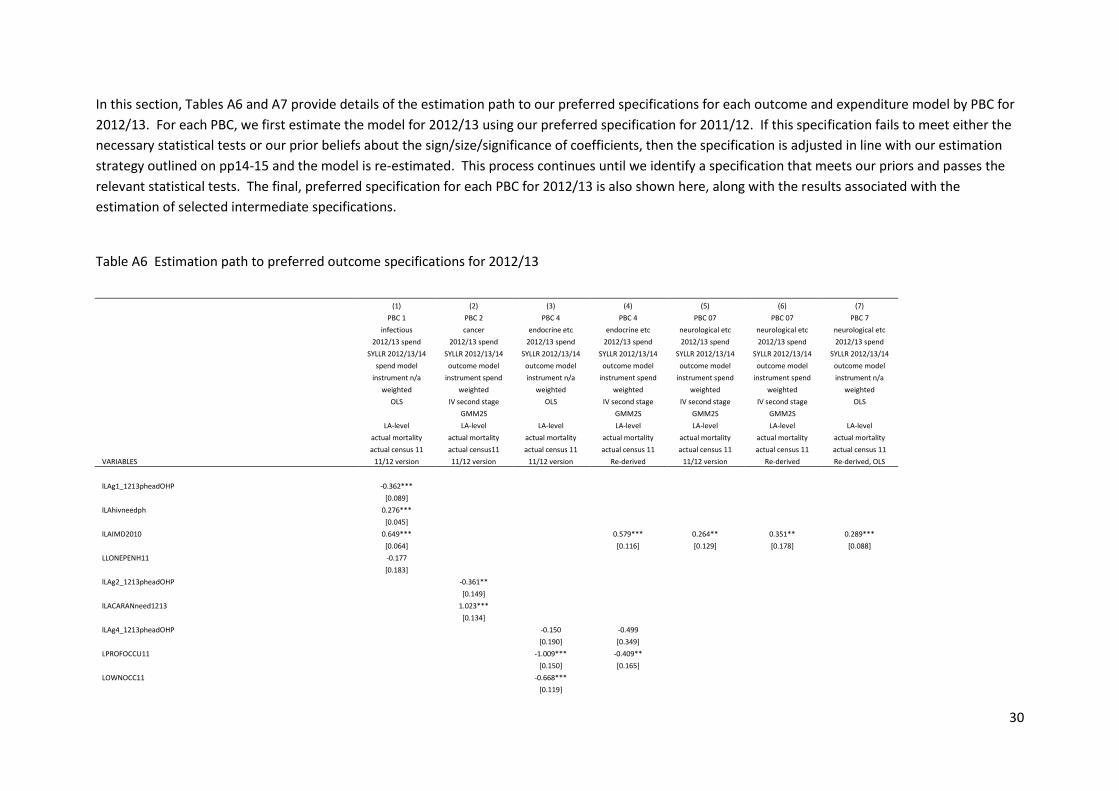
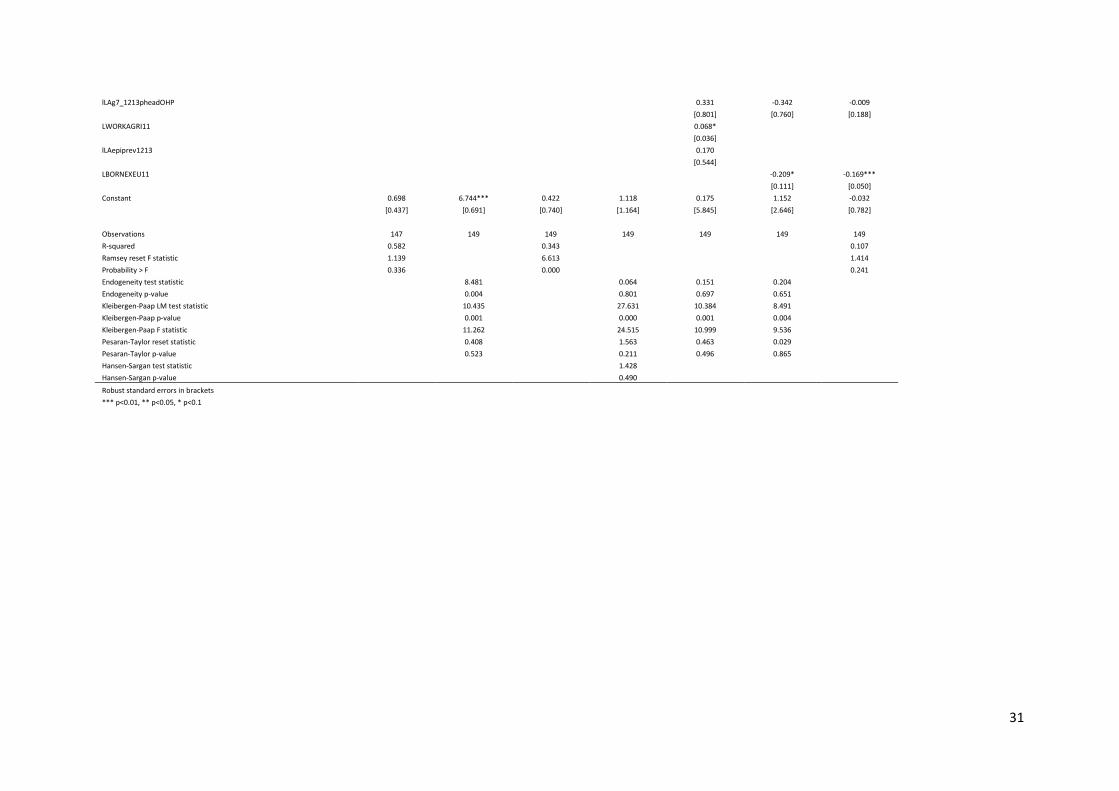
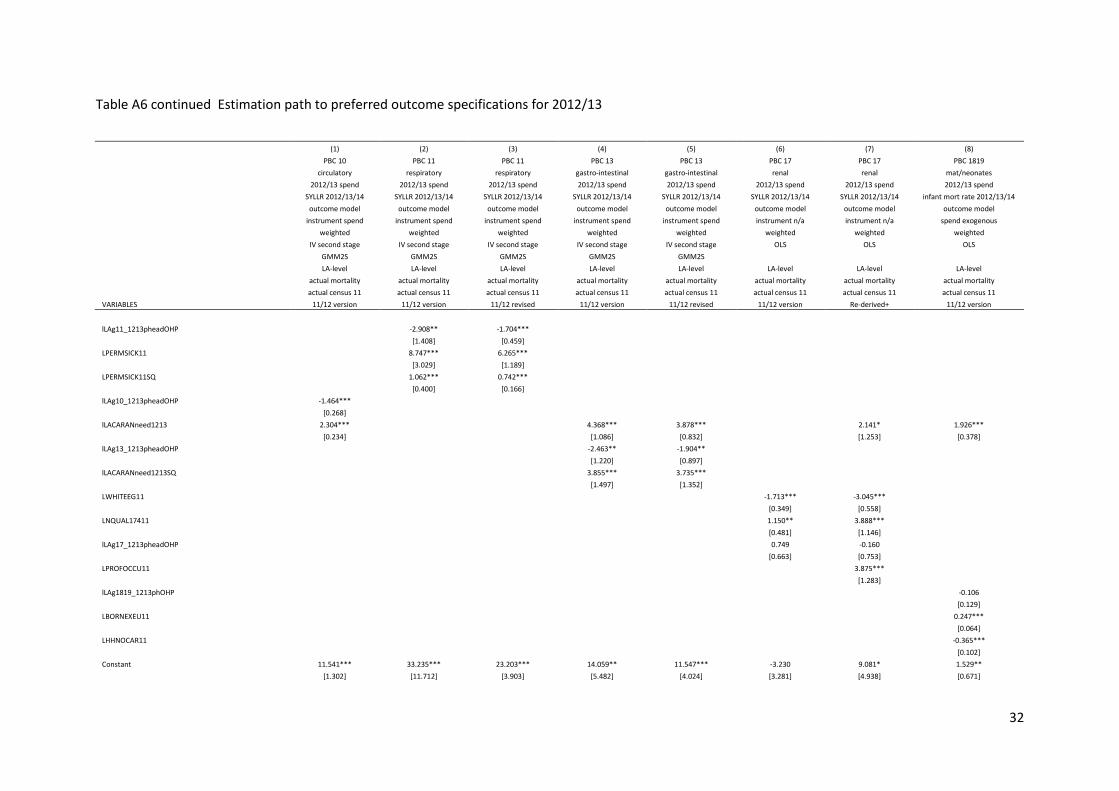
In this section, Tables A6 and A7 provide details of the estimation path to our preferred specifications for each outcome and expenditure model by PBC for
2012/13. For each PBC, we first estimate the model for 2012/13 using our preferred specification for 2011/12. If this specification fails to meet either the
necessary statistical tests or our prior beliefs about the sign/size/significance of coefficients, then the specification is adjusted in line with our estimation
strategy outlined on pp14-15 and the model is re-estimated. This process continues until we identify a specification that meets our priors and passes the
relevant statistical tests. The final, preferred specification for each PBC for 2012/13 is also shown here, along with the results associated with the
estimation of selected intermediate specifications.
Table A6 Estimation path to preferred outcome specifications for 2012/13
(1) (2) (3) (4) (5) (6) (7)
PBC 1 PBC 2 PBC 4 PBC 4 PBC 07 PBC 07 PBC 7
infectious cancer endocrine etc endocrine etc neurological etc neurological etc neurological etc
2012/13 spend 2012/13 spend 2012/13 spend 2012/13 spend 2012/13 spend 2012/13 spend 2012/13 spend
SYLLR 2012/13/14 SYLLR 2012/13/14 SYLLR 2012/13/14 SYLLR 2012/13/14 SYLLR 2012/13/14 SYLLR 2012/13/14 SYLLR 2012/13/14
spend model outcome model outcome model outcome model outcome model outcome model outcome model
instrument n/a instrument spend instrument n/a instrument spend instrument spend instrument spend instrument n/a
weighted weighted weighted weighted weighted weighted weighted
OLS IV second stage OLS IV second stage IV second stage IV second stage OLS
GMM2S
GMM2S GMM2S GMM2S
LA-level LA-level LA-level LA-level LA-level LA-level LA-level
actual mortality actual mortality actual mortality actual mortality actual mortality actual mortality actual mortality
actual census 11 actual census11 actual census 11 actual census 11 actual census 11 actual census 11 actual census 11
VARIABLES 11/12 version 11/12 version 11/12 version Re-derived 11/12 version Re-derived Re-derived, OLS
lLAg1_1213pheadOHP -0.362***
[0.089]
lLAhivneedph 0.276***
[0.045]
lLAIMD2010 0.649***
0.579*** 0.264** 0.351** 0.289***
[0.064]
[0.116] [0.129] [0.178] [0.088]
LLONEPENH11 -0.177
[0.183]
lLAg2_1213pheadOHP
-0.361**
[0.149]
lLACARANneed1213
1.023***
[0.134]
lLAg4_1213pheadOHP
-0.150 -0.499
[0.190] [0.349]
LPROFOCCU11
-1.009*** -0.409**
[0.150] [0.165]
LOWNOCC11
-0.668***
[0.119]
31
lLAg7_1213pheadOHP
0.331 -0.342 -0.009
[0.801] [0.760] [0.188]
LWORKAGRI11
0.068*
[0.036]
lLAepiprev1213
0.170
[0.544]
LBORNEXEU11
-0.209* -0.169***
[0.111] [0.050]
Constant 0.698 6.744*** 0.422 1.118 0.175 1.152 -0.032
[0.437] [0.691] [0.740] [1.164] [5.845] [2.646] [0.782]
Observations 147 149 149 149 149 149 149
R-squared 0.582
0.343
0.107
Ramsey reset F statistic 1.139
6.613
1.414
Probability > F 0.336
0.000
0.241
Endogeneity test statistic
8.481
0.064 0.151 0.204 Endogeneity p-value
0.004
0.801 0.697 0.651
Kleibergen-Paap LM test statistic
10.435
27.631 10.384 8.491 Kleibergen-Paap p-value
0.001
0.000 0.001 0.004
Kleibergen-Paap F statistic
11.262
24.515 10.999 9.536 Pesaran-Taylor reset statistic
0.408
1.563 0.463 0.029
Pesaran-Taylor p-value
0.523
0.211 0.496 0.865 Hansen-Sargan test statistic
1.428
Hansen-Sargan p-value 0.490
Robust standard errors in brackets *** p<0.01, ** p<0.05, * p<0.1
32
Table A6 continued Estimation path to preferred outcome specifications for 2012/13
(1) (2) (3) (4) (5) (6) (7) (8)
PBC 10 PBC 11 PBC 11 PBC 13 PBC 13 PBC 17 PBC 17 PBC 1819
circulatory respiratory respiratory gastro-intestinal gastro-intestinal renal renal mat/neonates
2012/13 spend 2012/13 spend 2012/13 spend 2012/13 spend 2012/13 spend 2012/13 spend 2012/13 spend 2012/13 spend
SYLLR 2012/13/14 SYLLR 2012/13/14 SYLLR 2012/13/14 SYLLR 2012/13/14 SYLLR 2012/13/14 SYLLR 2012/13/14 SYLLR 2012/13/14 infant mort rate 2012/13/14
outcome model outcome model outcome model outcome model outcome model outcome model outcome model outcome model
instrument spend instrument spend instrument spend instrument spend instrument spend instrument n/a instrument n/a spend exogenous
weighted weighted weighted weighted weighted weighted weighted weighted
IV second stage IV second stage IV second stage IV second stage IV second stage OLS OLS OLS
GMM2S GMM2S GMM2S GMM2S GMM2S
LA-level LA-level LA-level LA-level LA-level LA-level LA-level LA-level
actual mortality actual mortality actual mortality actual mortality actual mortality actual mortality actual mortality actual mortality
actual census 11 actual census 11 actual census 11 actual census 11 actual census 11 actual census 11 actual census 11 actual census 11
VARIABLES 11/12 version 11/12 version 11/12 revised 11/12 version 11/12 revised 11/12 version Re-derived+ 11/12 version
lLAg11_1213pheadOHP
-2.908** -1.704***
[1.408] [0.459]
LPERMSICK11
8.747*** 6.265***
[3.029] [1.189]
LPERMSICK11SQ
1.062*** 0.742***
[0.400] [0.166]
lLAg10_1213pheadOHP -1.464***
[0.268]
lLACARANneed1213 2.304***
4.368*** 3.878***
2.141* 1.926***
[0.234]
[1.086] [0.832]
[1.253] [0.378]
lLAg13_1213pheadOHP
-2.463** -1.904**
[1.220] [0.897]
lLACARANneed1213SQ
3.855*** 3.735***
[1.497] [1.352]
LWHITEEG11
-1.713*** -3.045***
[0.349] [0.558]
LNQUAL17411
1.150** 3.888***
[0.481] [1.146]
lLAg17_1213pheadOHP
0.749 -0.160
[0.663] [0.753]
LPROFOCCU11
3.875***
[1.283]
lLAg1819_1213phOHP
-0.106
[0.129]
LBORNEXEU11
0.247***
[0.064]
LHHNOCAR11
-0.365***
[0.102]
Constant 11.541*** 33.235*** 23.203*** 14.059** 11.547*** -3.230 9.081* 1.529**
[1.302] [11.712] [3.903] [5.482] [4.024] [3.281] [4.938] [0.671]
33
Observations 149 149 149 149 149 149 149 148
R-squared
0.165 0.233 0.229
Endogeneity test statistic 30.621 18.635 20.193 11.065 8.574 Endogeneity p-value 0.000 0.000 0.000 0.001 0.003 Hansen-Sargan test statistic 0.810
2.227
Hansen-Sargan p-value 0.368
0.136 Kleibergen-Paap LM test statistic 24.067 5.686 19.742 6.427 10.507
Kleibergen-Paap p-value 0.000 0.017 0.000 0.011 0.001 Kleibergen-Paap F statistic 19.517 6.613 16.644 8.139 10.363 Pesaran-Taylor reset statistic 0.086 3.575 0.096 0.000 0.039 Pesaran-Taylor p-value 0.769 0.059 0.757 0.989 0.843 Ramsey reset F statistic
1.838 2.110 1.064
Probability > F 0.143 0.102 0.366
Robust standard errors in brackets *** p<0.01, ** p<0.05, * p<0.1
34
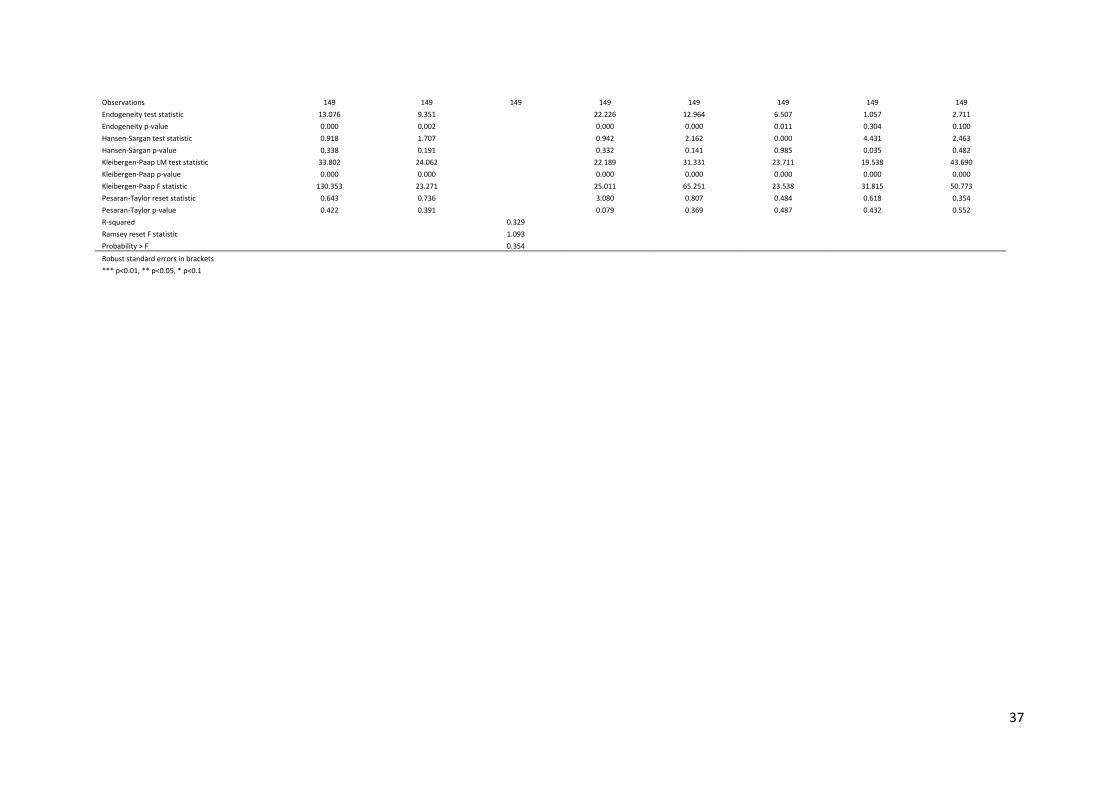
Table A7 Estimation path to preferred expenditure specifications for 2012/13
(1) (2) (3) (4) (5) (6) (7) (8) (9) (10)
PBC 1 PBC 1 PBC 2 PBC 3 PBC 4 PBC 4 PBC 5 PBC 6 PBC 6 PBC 6
infectious infectious cancer Blood disorders diabetes diabetes Mental health LDisability LDisability LDisability
2012/13 spend 2012/13 spend 2012/13 spend 2012/13 spend 2012/13 spend 2012/13 spend 2012/13 spend 2012/13 spend 2012/13 spend 2012/13 spend
SYLLR 2012/13/14 SYLLR 2012/13/14 SYLLR 2012/13/14 SYLLR 2012/13/14 SYLLR 2012/13/14 SYLLR 2012/13/14 SYLLR 2012/13/14 SYLLR 2012/13/14 SYLLR 2012/13/14 SYLLR 2012/13/14
spend model spend model spend model spend model spend model spend model spend model spend model spend model spend model
instrument n/a instrument n/a
instrument o/need instrument n/a
instrument o/need
instrument o/need instrument n/a instrument n/a
instrument o/need instrument n/a
weighted weighted weighted weighted weighted weighted weighted weighted weighted weighted
OLS OLS IV second stage OLS IV second stage IV second stage OLS OLS IV second stage OLS
GMM2S
GMM2S GMM2S
GMM2S
LA-level LA-level LA-level LA-level LA-level LA-level LA-level LA-level LA-level LA-level
actual mortality actual mortality actual mortality actual mortality actual mortality actual mortality actual mortality actual mortality actual mortality actual mortality
actual census 11 actual census 11 actual census11 actual census 11 actual census 11 actual census 11 actual census 11 actual census 11 actual census 11 actual census 11
VARIABLES 11/12 version 11/12 revised 11/12 version 11/12 version 11/12 version 11/12 revised 11/12 version 11/12 version Re-derived Re-derived, OLS
lLAgall_1213pheadOHP 0.750*** 0.749*** 1.027** 1.119*** 0.930*** 0.951*** 1.023*** 0.421 0.142 0.000
[0.261] [0.252] [0.522] [0.253] [0.119] [0.128] [0.221] [0.436] [0.508] [0.451]
lLAhivneedph 0.400*** 0.342***
[0.017] [0.028]
lacsyllrexIP1214 0.175 0.160
[0.197] [0.193]
lLAhivneedphSQ 0.091*** 0.087***
[0.021] [0.019]
LWHITEEG11
-0.303**
-0.240*** -0.243***
[0.122]
[0.036] [0.038]
lacsyllrexcancer1214
-1.565***
[0.326]
lLACARANneed1213
1.472**
[0.599]
LPROFOCCU11
-0.472***
-0.289
[0.173]
[0.333]
lacmSYLLR1214
-0.321*
0.043 0.542 0.172 0.245
[0.192]
[0.116] [0.557] [0.442] [0.331]
LBORNEXEU11
0.189***
-0.153*** -0.162***
[0.030]
[0.048] [0.051]
lacsyllrexDIAB1214
-0.410*** -0.440***
[0.114] [0.138]
LNQUAL17411
0.347*** 0.359***
[0.052] [0.062]
lLAmhneedindexpp
0.334**
[0.146]
LPOPPUCAR11
-0.408***
35
[0.116]
LPC74LTUN11
-0.587**
[0.225]
Constant -3.327** -3.303** 5.169 -2.932** 0.009 0.056 -3.512* -5.895 0.810 1.414
[1.381] [1.322] [3.768] [1.213] [0.718] [0.737] [1.994] [3.928] [2.336] [2.473]
Observations 147 147 149 149 149 149 149 135 135 135
R-squared 0.778 0.788
0.301
0.715 0.078
0.081 Ramsey reset F statistic 3.058 2.104
0.196
1.023 0.930
0.388
Probability > F 0.030 0.103
0.899
0.384 0.428
0.762 Endogeneity test statistic
28.098
10.957 8.114
0.059
Endogeneity p-value
0.000
0.001 0.004
0.808
Hansen-Sargan test statistic
0.008
2.887 2.726
0.768
Hansen-Sargan p-value
0.929
0.236 0.099
0.681
Kleibergen-Paap LM test statistic
18.904
31.972 28.095
40.711
Kleibergen-Paap p-value
0.000
0.000 0.000
0.000
Kleibergen-Paap F statistic
18.752
58.510 43.928
83.564
Pesaran-Taylor reset statistic
2.365
4.485 1.162
0.035
Pesaran-Taylor p-value 0.124 0.034 0.281 0.853
Robust standard errors in brackets
*** p<0.01, ** p<0.05, * p<0.1
36
Table A7 continued Estimation path to preferred expenditure specifications for 2012/13
(1) (2) (3) (4) (5) (6) (7) (8)
PBC 7 PBC 8 PBC 9 PBC 10 PBC 10 PBC 11 PBC 12 PBC 12
epilepsy Vision hearing problems circulatory circulatory respiratory dental problems dental problems
2012/13 spend 2012/13 spend 2012/13 spend 2012/13 spend 2012/13 spend 2012/13 spend 2012/13 spend 2012/13 spend
all cause SYLLR 2012/13/14 SYLLR 2012/13/14 SYLLR 2012/13/14 SYLLR 2012/13/14 SYLLR 2012/13/14 SYLLR 2012/13/14 SYLLR 2012/13/14 SYLLR 2012/13/14
spend model spend model spend model spend model spend model spend model spend model spend model
instrument o/need instrument o/need instrument n/a instrument o/need instrument o/need instrument o/need instrument o/need instrument o/need
weighted weighted weighted weighted weighted weighted weighted weighted
IV second stage IV second stage OLS IV second stage IV second stage IV second stage IV second stage IV second stage
GMM2S GMM2S
GMM2S GMM2S GMM2S GMM2S GMM2S
LA-level LA-level LA-level LA-level LA-level LA-level LA-level LA-level
actual mortality actual mortality actual mortality actual mortality actual mortality actual mortality actual mortality actual mortality
actual census 11 actual census 11 actual census 11 actual census 11 actual census 11 actual census 11 actual census 11 actual census 11
VARIABLES 11/12 version 11/12 version 11/12 version 11/12 version 11/12 revised 11/12 version 11/12 version Re-derived
lacsyllrexEPI1214 -0.326**
[0.157]
lLAgall_1213pheadOHP 0.856*** 1.411*** 1.523*** 1.589*** 1.285*** 0.928*** 0.906*** 0.855***
[0.168] [0.234] [0.357] [0.257] [0.161] [0.163] [0.174] [0.158]
lLAepiprev1213 0.489***
[0.090]
lacmSYLLR1214
-1.047*** 0.419
-0.087 -0.276*
[0.236] [0.367]
[0.323] [0.158]
LNQUAL17411
0.607***
0.614*** 0.382*** 0.408***
[0.081]
[0.097] [0.078] [0.071]
LOWNOCC11
0.587***
[0.204]
LPROFOCCU11
-0.060
-0.181
[0.267]
[0.128]
lacsyllrexcirc1214
-1.480*** -0.908***
[0.279] [0.159]
LWHITEEG11
0.191***
[0.050]
lacsyllrexresp1214
-0.370*
[0.193]
lLACARANneed1213SQ
1.945*** -0.574
[0.395] [0.637]
lLAIMD2010
-0.006
[0.083]
LBORNEXEU11
-0.062***
[0.017]
LLONEPARH11
0.344***
[0.083]
Constant 2.362** 0.395 -11.656*** 2.473** 1.110 0.296 -2.230 0.237
[1.205] [0.930] [2.388] [1.161] [0.993] [0.744] [1.475] [1.060]
37
Observations 149 149 149 149 149 149 149 149
Endogeneity test statistic 13.076 9.351
22.226 12.964 6.507 1.057 2.711
Endogeneity p-value 0.000 0.002
0.000 0.000 0.011 0.304 0.100
Hansen-Sargan test statistic 0.918 1.707
0.942 2.162 0.000 4.431 2.463
Hansen-Sargan p-value 0.338 0.191
0.332 0.141 0.985 0.035 0.482
Kleibergen-Paap LM test statistic 33.802 24.062
22.189 31.331 23.711 19.538 43.690
Kleibergen-Paap p-value 0.000 0.000
0.000 0.000 0.000 0.000 0.000
Kleibergen-Paap F statistic 130.353 23.271
25.011 65.251 23.538 31.815 50.773
Pesaran-Taylor reset statistic 0.643 0.736
3.080 0.807 0.484 0.618 0.354
Pesaran-Taylor p-value 0.422 0.391
0.079 0.369 0.487 0.432 0.552
R-squared
0.329 Ramsey reset F statistic
1.093
Probability > F 0.354
Robust standard errors in brackets *** p<0.01, ** p<0.05, * p<0.1
38
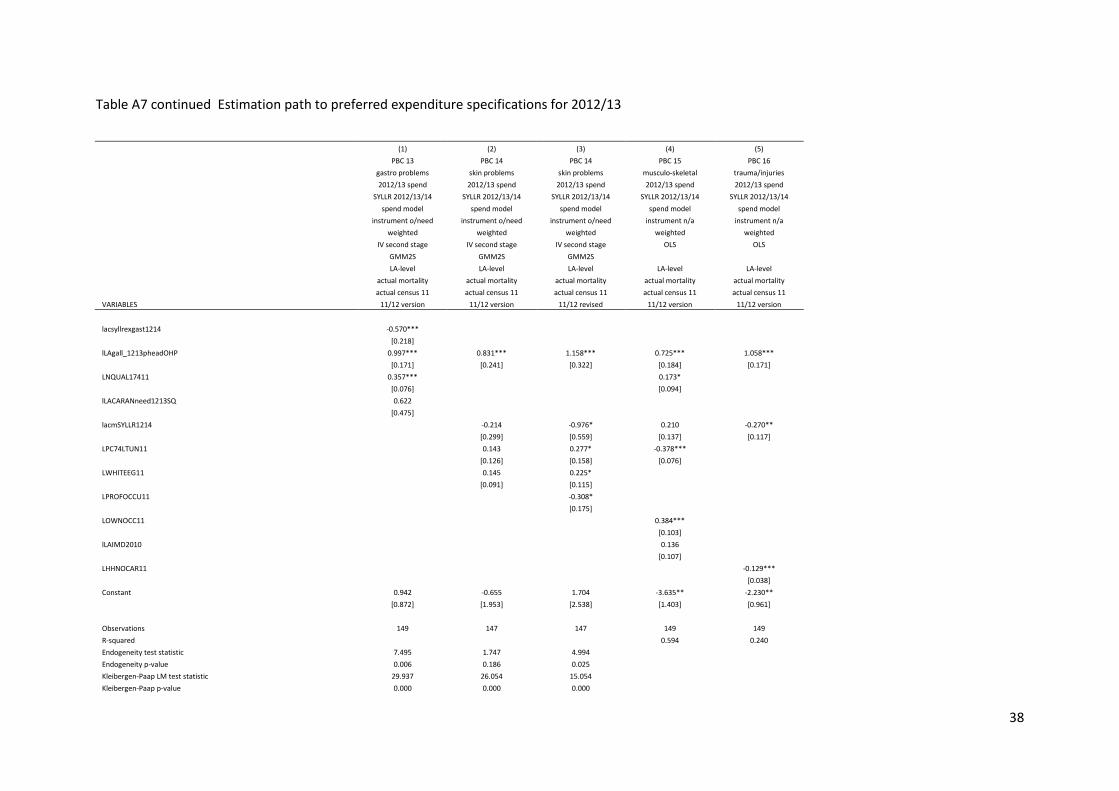
Table A7 continued Estimation path to preferred expenditure specifications for 2012/13
(1) (2) (3) (4) (5)
PBC 13 PBC 14 PBC 14 PBC 15 PBC 16
gastro problems skin problems skin problems musculo-skeletal trauma/injuries
2012/13 spend 2012/13 spend 2012/13 spend 2012/13 spend 2012/13 spend
SYLLR 2012/13/14 SYLLR 2012/13/14 SYLLR 2012/13/14 SYLLR 2012/13/14 SYLLR 2012/13/14
spend model spend model spend model spend model spend model
instrument o/need instrument o/need instrument o/need instrument n/a instrument n/a
weighted weighted weighted weighted weighted
IV second stage IV second stage IV second stage OLS OLS
GMM2S GMM2S GMM2S
LA-level LA-level LA-level LA-level LA-level
actual mortality actual mortality actual mortality actual mortality actual mortality
actual census 11 actual census 11 actual census 11 actual census 11 actual census 11
VARIABLES 11/12 version 11/12 version 11/12 revised 11/12 version 11/12 version
lacsyllrexgast1214 -0.570***
[0.218]
lLAgall_1213pheadOHP 0.997*** 0.831*** 1.158*** 0.725*** 1.058***
[0.171] [0.241] [0.322] [0.184] [0.171]
LNQUAL17411 0.357***
0.173*
[0.076]
[0.094]
lLACARANneed1213SQ 0.622
[0.475]
lacmSYLLR1214
-0.214 -0.976* 0.210 -0.270**
[0.299] [0.559] [0.137] [0.117]
LPC74LTUN11
0.143 0.277* -0.378***
[0.126] [0.158] [0.076]
LWHITEEG11
0.145 0.225*
[0.091] [0.115]
LPROFOCCU11
-0.308*
[0.175]
LOWNOCC11
0.384***
[0.103]
lLAIMD2010
0.136
[0.107]
LHHNOCAR11
-0.129***
[0.038]
Constant 0.942 -0.655 1.704 -3.635** -2.230**
[0.872] [1.953] [2.538] [1.403] [0.961]
Observations 149 147 147 149 149
R-squared
0.594 0.240
Endogeneity test statistic 7.495 1.747 4.994 Endogeneity p-value 0.006 0.186 0.025 Kleibergen-Paap LM test statistic 29.937 26.054 15.054 Kleibergen-Paap p-value 0.000 0.000 0.000
39
Kleibergen-Paap F statistic 122.358 37.718 20.121 Pesaran-Taylor reset statistic 0.023 0.035 0.002 Pesaran-Taylor p-value 0.878 0.852 0.964 Hansen-Sargan test statistic
3.167
Hansen-Sargan p-value
0.075 Ramsey reset F statistic
0.257 1.071
Probability > F 0.856 0.363
Robust standard errors in brackets *** p<0.01, ** p<0.05, * p<0.1
40
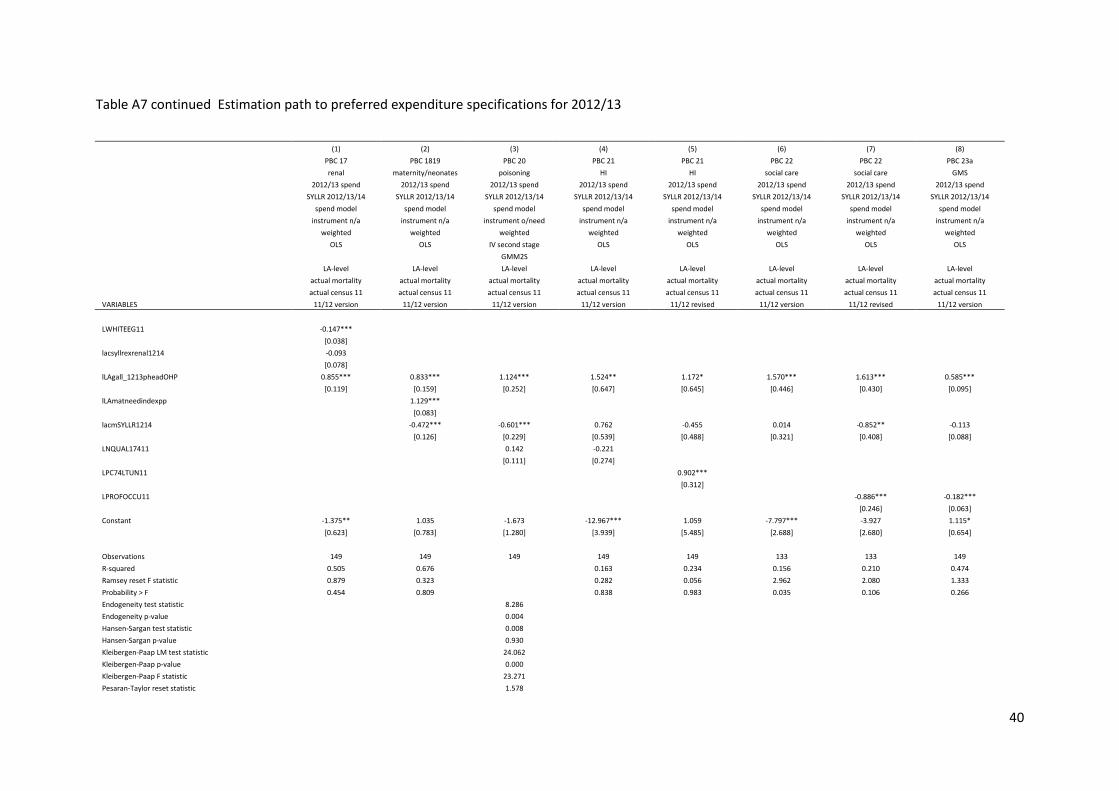
Table A7 continued Estimation path to preferred expenditure specifications for 2012/13
(1) (2) (3) (4) (5) (6) (7) (8)
PBC 17 PBC 1819 PBC 20 PBC 21 PBC 21 PBC 22 PBC 22 PBC 23a
renal maternity/neonates poisoning HI HI social care social care GMS
2012/13 spend 2012/13 spend 2012/13 spend 2012/13 spend 2012/13 spend 2012/13 spend 2012/13 spend 2012/13 spend
SYLLR 2012/13/14 SYLLR 2012/13/14 SYLLR 2012/13/14 SYLLR 2012/13/14 SYLLR 2012/13/14 SYLLR 2012/13/14 SYLLR 2012/13/14 SYLLR 2012/13/14
spend model spend model spend model spend model spend model spend model spend model spend model
instrument n/a instrument n/a instrument o/need instrument n/a instrument n/a instrument n/a instrument n/a instrument n/a
weighted weighted weighted weighted weighted weighted weighted weighted
OLS OLS IV second stage OLS OLS OLS OLS OLS
GMM2S
LA-level LA-level LA-level LA-level LA-level LA-level LA-level LA-level
actual mortality actual mortality actual mortality actual mortality actual mortality actual mortality actual mortality actual mortality
actual census 11 actual census 11 actual census 11 actual census 11 actual census 11 actual census 11 actual census 11 actual census 11
VARIABLES 11/12 version 11/12 version 11/12 version 11/12 version 11/12 revised 11/12 version 11/12 revised 11/12 version
LWHITEEG11 -0.147***
[0.038]
lacsyllrexrenal1214 -0.093
[0.078]
lLAgall_1213pheadOHP 0.855*** 0.833*** 1.124*** 1.524** 1.172* 1.570*** 1.613*** 0.585***
[0.119] [0.159] [0.252] [0.647] [0.645] [0.446] [0.430] [0.095]
lLAmatneedindexpp
1.129***
[0.083]
lacmSYLLR1214
-0.472*** -0.601*** 0.762 -0.455 0.014 -0.852** -0.113
[0.126] [0.229] [0.539] [0.488] [0.321] [0.408] [0.088]
LNQUAL17411
0.142 -0.221
[0.111] [0.274]
LPC74LTUN11
0.902***
[0.312]
LPROFOCCU11
-0.886*** -0.182***
[0.246] [0.063]
Constant -1.375** 1.035 -1.673 -12.967*** 1.059 -7.797*** -3.927 1.115*
[0.623] [0.783] [1.280] [3.939] [5.485] [2.688] [2.680] [0.654]
Observations 149 149 149 149 149 133 133 149
R-squared 0.505 0.676
0.163 0.234 0.156 0.210 0.474
Ramsey reset F statistic 0.879 0.323
0.282 0.056 2.962 2.080 1.333
Probability > F 0.454 0.809
0.838 0.983 0.035 0.106 0.266
Endogeneity test statistic
8.286 Endogeneity p-value
0.004
Hansen-Sargan test statistic
0.008 Hansen-Sargan p-value
0.930
Kleibergen-Paap LM test statistic
24.062 Kleibergen-Paap p-value
0.000
Kleibergen-Paap F statistic
23.271 Pesaran-Taylor reset statistic
1.578
41
Pesaran-Taylor p-value 0.209
Robust standard errors in brackets *** p<0.01, ** p<0.05, * p<0.1
42
Appendix 2: Expected health opportunity costs in the NHS (2012/13 results)
Overview
70. In the second appendix results are presented that reflect the available data for 2012/13
expenditure (this forms Appendix 2.1). In Appendix 2.2, the results are also analysed in terms of
how sensitive the results are to two key inputs: i) each of the estimated elasticities and ii)
assumptions made in order to overcome data limitations for each PBC (only have mortality outcome
data and for only a portion of PBCs). Finally, Appendix 2.3 briefly considers an update regarding data
from ONS used to inform burden of disease.
Appendix 2.1 Results
71. Results are presented in two ways as the point estimate of the cost per QALY of marginal activity
in the NHS, or alternatively expressed as the expected QALY health opportunity cost for £10,000,000
expenditure.
Table A8 Results for 2012/13 compared to previously generated results
Year 2008/09* 2009/10 2010/11 2011/12 2012/13
Cost per QALY £12,311 £9,887 £10,225 £8,997 £14,410
Health opportunity costs of £10mn (QALYs)
812 1,011 978 1,112 694
*re-applied PCT model
72. It can be seen from Table A8 that the expected health opportunity costs of a given level of
expenditure have decreased between 2011/12 and 2012/13 and so the cost per QALY ratio has
increased. The associated uncertainty with each of these results is presented in Table A9 and figures
A1 and A2 below.
43
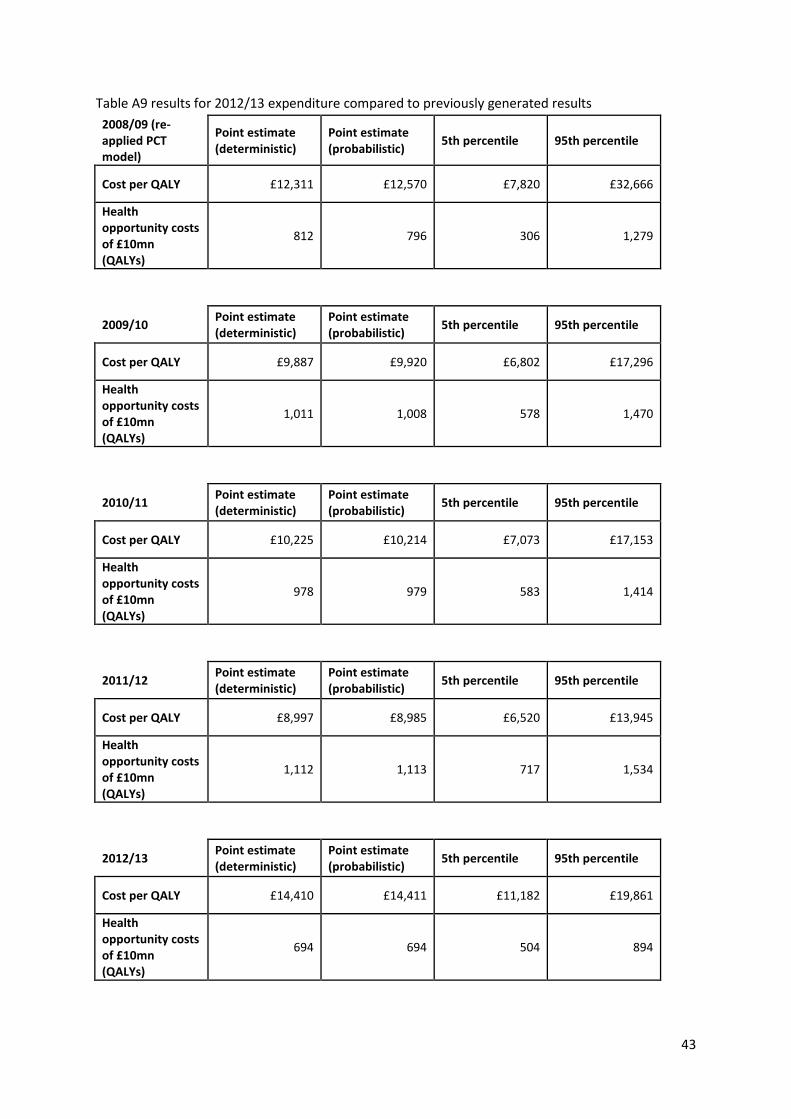
Table A9 results for 2012/13 expenditure compared to previously generated results
2008/09 (re-applied PCT model)
Point estimate (deterministic)
Point estimate (probabilistic)
5th percentile 95th percentile
Cost per QALY £12,311 £12,570 £7,820 £32,666
Health opportunity costs of £10mn (QALYs)
812 796 306 1,279
2009/10
Point estimate (deterministic)
Point estimate (probabilistic)
5th percentile 95th percentile
Cost per QALY £9,887 £9,920 £6,802 £17,296
Health opportunity costs of £10mn (QALYs)
1,011 1,008 578 1,470
2010/11
Point estimate (deterministic)
Point estimate (probabilistic)
5th percentile 95th percentile
Cost per QALY £10,225 £10,214 £7,073 £17,153
Health opportunity costs of £10mn (QALYs)
978 979 583 1,414
2011/12
Point estimate (deterministic)
Point estimate (probabilistic)
5th percentile 95th percentile
Cost per QALY £8,997 £8,985 £6,520 £13,945
Health opportunity costs of £10mn (QALYs)
1,112 1,113 717 1,534
2012/13
Point estimate (deterministic)
Point estimate (probabilistic)
5th percentile 95th percentile
Cost per QALY £14,410 £14,411 £11,182 £19,861
Health opportunity costs of £10mn (QALYs)
694 694 504 894

44
It can be seen from Table A9 that the expected health opportunity costs of a change in expenditure
have decreased between 2011/12 and 2012/13 and so the cost per QALY ratio has risen. The health
opportunity costs of £10mn are smaller than those estimated using 2008/9 data with the re-applied
specifications from the PCT model. In this table, the uncertainty associated with these estimates is
shown and it can be judged to what extent any changes in the point estimate between years should
be interpreted as a signal of any trend. From Table A9 it is hard to conclude that there is a significant
change in the health opportunity costs of £10mn expenditure, since there is a great deal of overlap
between the 90% confidence intervals of the years shown.

45
Figure A1 Results illustrating uncertainty for 2012/13 and previously generated results – cost per
QALY
Figure A2 Results illustrating uncertainty for 2012/13 and previously generated results – Health
opportunity costs of £10mn (QALYs)
46
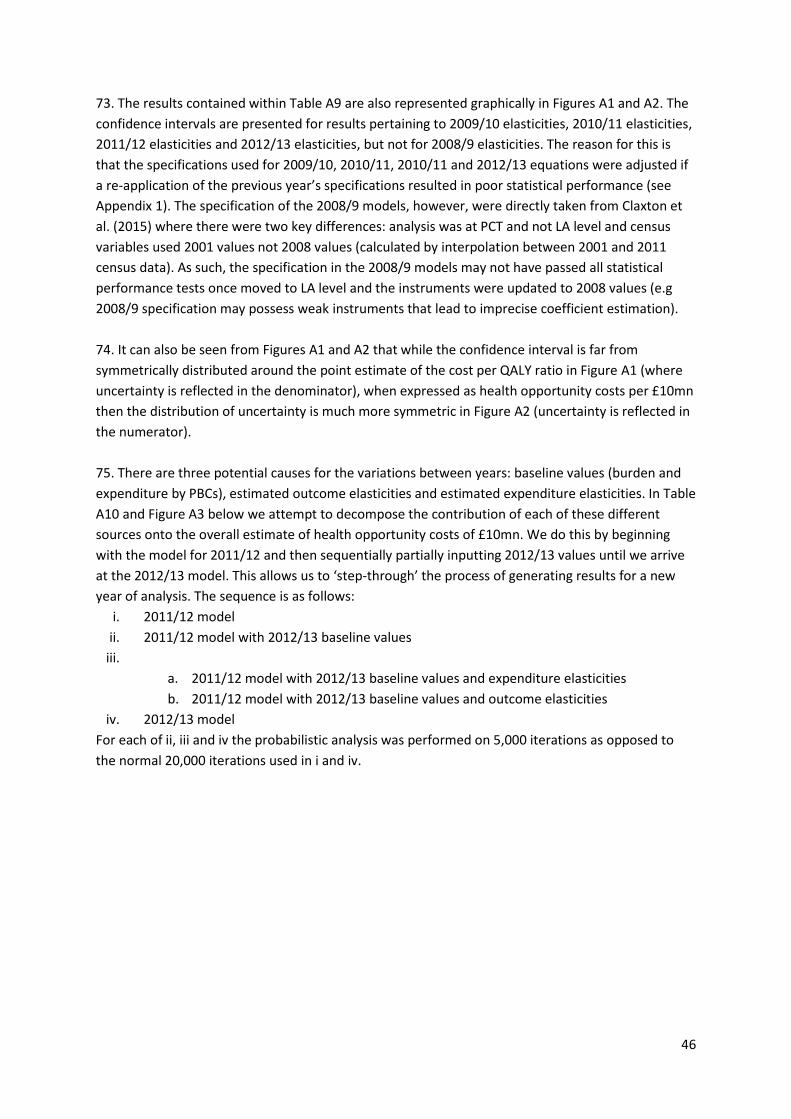
73. The results contained within Table A9 are also represented graphically in Figures A1 and A2. The
confidence intervals are presented for results pertaining to 2009/10 elasticities, 2010/11 elasticities,
2011/12 elasticities and 2012/13 elasticities, but not for 2008/9 elasticities. The reason for this is
that the specifications used for 2009/10, 2010/11, 2010/11 and 2012/13 equations were adjusted if
a re-application of the previous year’s specifications resulted in poor statistical performance (see
Appendix 1). The specification of the 2008/9 models, however, were directly taken from Claxton et
al. (2015) where there were two key differences: analysis was at PCT and not LA level and census
variables used 2001 values not 2008 values (calculated by interpolation between 2001 and 2011
census data). As such, the specification in the 2008/9 models may not have passed all statistical
performance tests once moved to LA level and the instruments were updated to 2008 values (e.g
2008/9 specification may possess weak instruments that lead to imprecise coefficient estimation).
74. It can also be seen from Figures A1 and A2 that while the confidence interval is far from
symmetrically distributed around the point estimate of the cost per QALY ratio in Figure A1 (where
uncertainty is reflected in the denominator), when expressed as health opportunity costs per £10mn
then the distribution of uncertainty is much more symmetric in Figure A2 (uncertainty is reflected in
the numerator).
75. There are three potential causes for the variations between years: baseline values (burden and
expenditure by PBCs), estimated outcome elasticities and estimated expenditure elasticities. In Table
A10 and Figure A3 below we attempt to decompose the contribution of each of these different
sources onto the overall estimate of health opportunity costs of £10mn. We do this by beginning
with the model for 2011/12 and then sequentially partially inputting 2012/13 values until we arrive
at the 2012/13 model. This allows us to ‘step-through’ the process of generating results for a new
year of analysis. The sequence is as follows:
i. 2011/12 model
ii. 2011/12 model with 2012/13 baseline values
iii.
a. 2011/12 model with 2012/13 baseline values and expenditure elasticities
b. 2011/12 model with 2012/13 baseline values and outcome elasticities
iv. 2012/13 model
For each of ii, iii and iv the probabilistic analysis was performed on 5,000 iterations as opposed to
the normal 20,000 iterations used in i and iv.
47
Table A10 Decomposing change in overall health opportunity costs of £10mn estimate between
2011/12 and 2012/13
Health opportunity costs of £10mn (QALYs)
Point estimate (deterministic)
Point estimate (probabilistic)
5th percentile
95th percentile
i. 2011/12 1,112 1,113 717 1,534
ii. i + 2012/13 baselines 1,096 1,092 691 1,513
iii a. ii + 2012/13 exp elasticities
997 994 582 1,441
iii b. ii + 2012/13 out elasticities
842 842 620 1,078
iv. 2012/13 694 694 504 894
Figure A3 Decomposing change in overall health opportunity costs of £10mn estimate between
2011/12 and 2012/13
76. From these results it is clear that the changes between 2011/12 and 2012/13 overall estimates
result from a combination of the differences in estimated expenditure elasticities and estimated
outcome elasticities. In addition, there is some interaction between these two that affects the
overall result, since the difference between i and iv is greater than the difference between i and iii a
48
and i and iii b combined. Further, it can be seen that there is a clear reduction in uncertainty when
2012/13 outcome elasticities are inputted compared to the 2011/12 outcome elasticities.
77. It is also possible to generate implied cost per QALY ratio results for each individual PBC. If taken
at face values then these results would have important policy implications, for example to divest
from one PBC, perhaps maternity and neonates (PBCs 18 and 19), and to invest in another, for
example respiratory (PBC 11). There are good reasons why this should not happen, namely potential
‘spillovers’ between PBCs and the assumption of proportionality between the effect of changes in
expenditure on the QALY burden disease and the estimated proportionate effect on the mortality
burden, which may be more appropriate for some PBCs than others. In Table A11, we consider how
cost per QALY ratios for specific PBCs vary over time.
Table A11 Implied PBC cost per QALY ratios over time
Implied PBC cost per QALY (£) 2009/10
Implied PBC cost per QALY (£) 2010/11
Implied PBC cost per QALY (£) 2011/12
Implied PBC cost per QALY (£) 2012/13
2 Cancer £ 16,523.87 £ 25,406.48 £ 12,952.38 £ 15,898.57
10 Circulatory £ 5,544.45 £ 6,108.68 £ 6,582.53 £ 7,274.40
11 Respiratory £ 1,889.33 £ 1,912.83 £ 2,210.58 £ 2,411.65
13 Gastro-intestinal £ 5,583.95 £ 7,724.82 £ 5,851.88 £ 6,432.45
1 Infectious diseases £ 41,541.64 £ 51,622.80 £ 46,086.46 £ 40,830.94
4 Endocrine £ 4,056.79 £ 28,337.44 £ 26,211.12 £ 10,523.80
7 Neurological £ 1,866.46 £ 6,585.53 £ 1,710.05 £ 256,923.73
17 Genito-urinary £ 28,904.12 £ 33,577.90 £ 215,941.87 £ 707,660.45
16 Trauma & injuries* N/A N/A N/A N/A
18+19 Maternity & neonates* £ 2,765,793.49 £ 11,427,595.27 £ 3,722,944.22 £ 4,731,851.32
3 Disorders of Blood £ 7,331.55 £ 5,221.93 £ 5,360.81 £ 7,189.07
5 Mental Health £ 13,301.48 £ 10,161.35 £ 10,577.65 £ 14,289.44
6 Learning Disability £ 103,050.77 £ 71,730.28 £ 41,727.46 N/A
8 Problems of Vision £ 35,141.24 £ 29,389.20 £ 30,301.58 £ 41,341.39
9 Problems of Hearing £ 4,875.99 £ 3,237.62 £ 3,439.82 £ 4,510.01
12 Dental problems £ 30,249.72 £ 22,655.89 £ 22,467.03 £ 31,506.40
14 Skin £ 78,047.29 £ 59,906.77 £ 62,989.94 £ 84,740.12
15 Musculo skeletal £ 11,569.64 £ 9,323.76 £ 9,787.69 £ 13,545.60
20 Poisoning and AE £ 83,574.76 £ 55,355.67 £ 58,373.17 £ 78,625.37
21 Healthy Individuals £ 378,806.71 £ 287,282.84 £ 286,931.70 £ 346,536.63
22 Social Care Needs N/A N/A N/A N/A
23 Other N/A N/A N/A N/A
49
78. The results in Table A11 for each PBC are largely driven by two key variables: each PBC’s
estimated outcome elasticity and the changing burden of disease for PBCs. Expenditure elasticities
only affect PBCs without a mortality signal through the mortality elasticity used for extrapolation,
which depends upon expenditure elasticities. As a result, the variations observed in Table A11 reflect
variations that can be seen in the elasticities found in Table A1. Take for instance PBC 7 –
neurological – the highest (lowest) implied cost per QALY ratio is observed in 2012/13 (2011/12),
which is the year with the smallest (largest) magnitude of outcome elasticity.
Appendix 2.2 Sensitivity analysis
79. Appendix 2.2 details three sensitivity analyses that were performed. The first two concerned the
elasticities that were econometrically estimated for each of the PBCs. In the first case each of the
estimated PBC outcome elasticities are varied by +/- 1 standard error. Then, the difference between
the two resulting opportunity costs is presented. When this is larger, this implies that the overall
resulting estimate of health opportunity costs is more sensitive to the outcome elasticity under
consideration. The same procedure is then carried out for each of the PBC expenditure elasticities.
The results of these sensitivity analyses are reported in Tables A12 and A13.
50
Table A12 Sensitivity of results to estimated outcome elasticities
Change in spend
Change in QALY
death + QALY alive
Implied PBC cost per QALY (£)
Difference in health
opportunity costs
between +1 SE and
-1 SE in PBC
outcome
elasticity
% difference in health
opportunity costs
between +1 SE and
-1 SE in PBC
outcome elasticity
Importance of PBC (rank)
Importance of PBC (rank)
2011/12
Importance of PBC (rank)
2010/11
Importance of PBC (rank)
2009/10
2 Cancer £ 662,897.55 42 £ 15,898.57 52 7.48% 5 5 7 7
10 Circulatory £ 1,007,028.41 138 £ 7,274.40 88 12.71% 3 3 3 3
11 Respiratory £ 494,916.09 205 £ 2,411.65 134 19.31% 1 2 1 2
13 Gastro-intestinal £ 539,720.67 84 £ 6,432.45 96 13.85% 2 4 4 4
1 Infectious diseases £ 131,518.91 3 £ 40,830.94 2 0.27% 8 8 8 8
4 Endocrine £ 330,707.15 31 £ 10,523.80 46 6.59% 6 6 6 5
7 Neurological £ 431,954.90 2 £ 256,923.73 73 10.54% 4 1 2 1
17 Genito-urinary £ 463,947.64 1 £ 707,660.45 11 1.57% 7 7 5 6
16 Trauma & injuries* £ 447,083.30 0 N/A - - - - - -
18+19 Maternity & neonates* £ 424,516.42 0 £ 4,731,851.32 0 0.03% 9 9 9 9
3 Disorders of Blood £ 146,330.91 20 £ 7,189.07 - - - - - -
5 Mental Health £ 1,311,251.36 92 £ 14,289.44 - - - - - -
6 Learning Disability £ - 0 N/A - - - - - -
8 Problems of Vision £ 369,173.21 9 £ 41,341.39 - - - - - -
9 Problems of Hearing £ 78,811.30 17 £ 4,510.01 - - - - - -
12 Dental problems £ 348,207.85 11 £ 31,506.40 - - - - - -
14 Skin £ 276,255.90 3 £ 84,740.12 - - - - - -
15 Musculo skeletal £ 440,252.82 33 £ 13,545.60 - - - - - -
20 Poisoning and AE £ 125,330.07 2 £ 78,625.37 - - - - - -
21 Healthy Individuals £ 242,347.45 1 £ 346,536.63 - - - - - -
22 Social Care Needs £ 612,797.70 0 N/A - - - - - -
23 Other £ 1,114,950.40 0 N/A - - - - - -
Total: 694

51
Table A13 Sensitivity of overall results to estimated spend elasticities
Change in spend
Change in QALY
death + QALY alive
Implied PBC cost per QALY (£)
Difference in health
opportunity costs
between +1 SE and
-1 SE in PBC
spend
elasticity
% difference in health
opportunity costs
between +1 SE and
-1 SE in PBC
spend elasticity
Importance of PBC (rank)
Importance of PBC (rank)
2011/12
Importance of PBC (rank)
2010/11
Importance of PBC (rank)
2009/10
2 Cancer £ 662,897.55 42 £ 15,898.57 8 1.22% 12 9 3 12
10 Circulatory £ 1,007,028.41 138 £ 7,274.40 33 4.79% 2 5 2 2
11 Respiratory £ 494,916.09 205 £ 2,411.65 69 9.90% 1 2 1 1
13 Gastro-intestinal £ 539,720.67 84 £ 6,432.45 15 2.18% 9 15 20 10
1 Infectious diseases £ 131,518.91 3 £ 40,830.94 7 1.00% 14 12 12 15
4 Endocrine £ 330,707.15 31 £ 10,523.80 1 0.11% 21 13 11 14
7 Neurological £ 431,954.90 2 £ 256,923.73 18 2.53% 6 1 21 3
17 Genito-urinary £ 463,947.64 1 £ 707,660.45 14 1.95% 10 10 10 11
16 Trauma & injuries* £ 447,083.30 0 N/A 16 2.24% 8 7 7 5
18+19 Maternity & neonates* £ 424,516.42 0 £ 4,731,851.32 17 2.50% 7 6 6 4
3 Disorders of Blood £ 146,330.91 20 £ 7,189.07 5 0.66% 18 21 18 22
5 Mental Health £ 1,311,251.36 92 £ 14,289.44 0 0.05% 22 18 22 13
6 Learning Disability £ - 0 N/A 8 1.19% 13 11 8 9
8 Problems of Vision £ 369,173.21 9 £ 41,341.39 6 0.80% 16 16 17 17
9 Problems of Hearing £ 78,811.30 17 £ 4,510.01 6 0.81% 15 19 13 20
12 Dental problems £ 348,207.85 11 £ 31,506.40 5 0.70% 17 17 15 16
14 Skin £ 276,255.90 3 £ 84,740.12 9 1.28% 11 14 14 18
15 Musculo skeletal £ 440,252.82 33 £ 13,545.60 1 0.14% 20 22 19 21
20 Poisoning and AE £ 125,330.07 2 £ 78,625.37 3 0.46% 19 20 16 19
21 Healthy Individuals £ 242,347.45 1 £ 346,536.63 18 2.56% 5 8 9 8
22 Social Care Needs £ 612,797.70 0 N/A 23 3.27% 4 4 5 6
23 Other £ 1,114,950.40 0 N/A 25 3.62% 3 3 4 7
Total: 694
52
80. The first thing that is striking is that PBC 6 (learning disability) is associated with no change in
spend. This results from the zero point estimate of its spend elasticity. Generally, the results display
varying degrees of sensitivity to estimated elasticities depending upon the PBC under consideration.
In general, but not always, the results are more sensitive to specific PBC outcome elasticities than to
specific PBC spend elasticities. Looking first at Table A13, for many PBCs, the difference between the
overall health opportunity cost when the spend elasticity is increased by one standard error
compared to the result when the standard error is reduced by one standard error represents less
than 1% of the overall point estimate of health opportunity costs (PBCs 1, 4, 3, 8, 9, 12, 15 and 20).
This difference is only greater than 10% for PBC 11 (respiratory). A significant change from the
results for 2011/12 concerns PBC 7: neurological, the most important PBC in terms of spend
elasticity in 2011/12 , but only 7th most important in 2012/13. This can be explained by the
considerably higher implied PBC cost per QALY for PBC 7 in 2012/13 compared to 2011/12. Switching
to look at Table A12 it can be seen that the most important PBC in terms of outcome elasticity
sensitivity is PBC 11: respiratory, as it is when spend elasticity is considered. The overall estimated
health opportunity cost is also sensitive to PBC 13 (gastro-intestinal) and to a lesser extent PBCs 7
and 10 (neurological and circulatory).
53
81. Following these two sensitivity analyses, a third is performed with a different emphasis, which
analyses the sensitivity of the overall health opportunity cost estimate to two key assumptions:
Surrogacy- we are required to make an assumption about how the effect on mortality for PBCs with
a mortality indicator can be used as a surrogate for the effect that expenditure has on morbidity (or
health-related quality of life) in those PBCs.
Extrapolation- We are required to make an assumption about how the estimated effects on
mortality found for PBCs with a mortality indicator can be extrapolated to the effect that
expenditure has on mortality for those PBCs that do not have a mortality indicator.
In order to assess the impact of these assumptions on the overall results for the NHS, we evaluate
the health effects of £10mn spending at the margin in the NHS when either:
a) For PBCs with a mortality indicator: no surrogacy assumption, therefore expenditure has no effect
on morbidity
b) For PBCs without a mortality indicator: assume no health effects at all, neither on mortality
(extrapolation assumption) nor morbidity (surrogacy assumption)
The results are found here in Table A14.
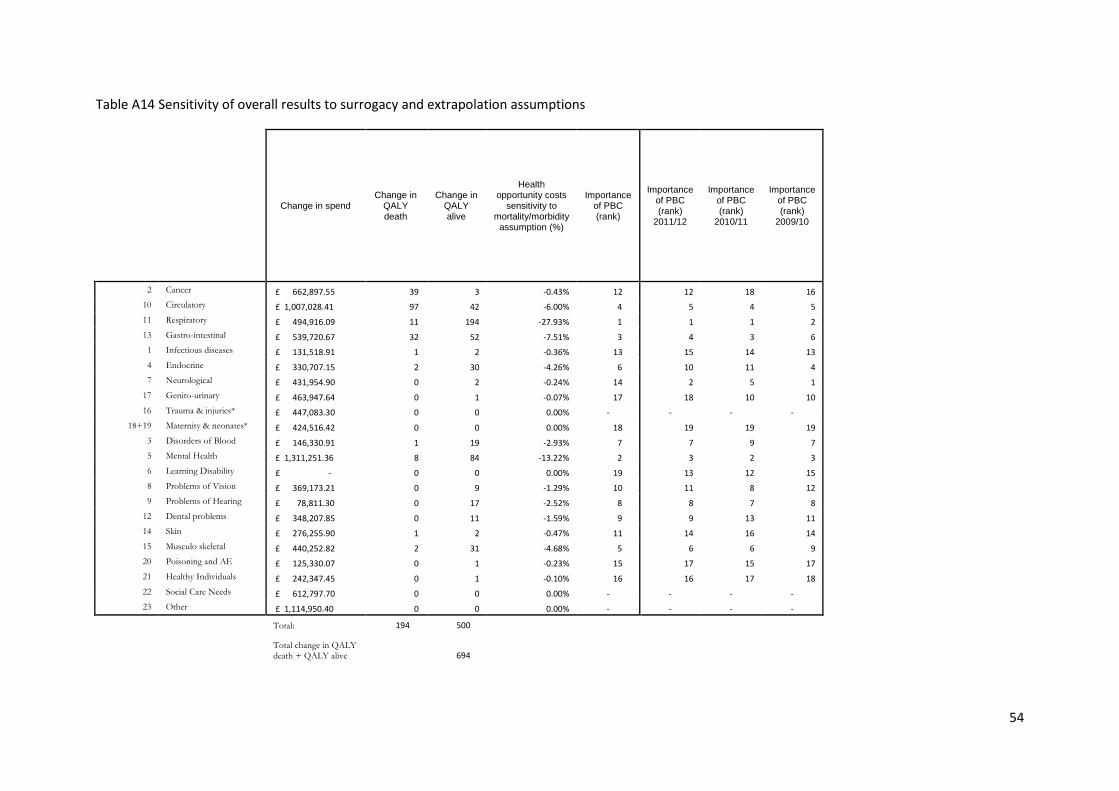
54
Table A14 Sensitivity of overall results to surrogacy and extrapolation assumptions
Change in spend Change in
QALY death
Change in QALY alive
Health opportunity costs
sensitivity to mortality/morbidity
assumption (%)
Importance of PBC (rank)
Importance of PBC (rank)
2011/12
Importance of PBC (rank)
2010/11
Importance of PBC (rank)
2009/10
2 Cancer £ 662,897.55 39 3 -0.43% 12 12 18 16
10 Circulatory £ 1,007,028.41 97 42 -6.00% 4 5 4 5
11 Respiratory £ 494,916.09 11 194 -27.93% 1 1 1 2
13 Gastro-intestinal £ 539,720.67 32 52 -7.51% 3 4 3 6
1 Infectious diseases £ 131,518.91 1 2 -0.36% 13 15 14 13
4 Endocrine £ 330,707.15 2 30 -4.26% 6 10 11 4
7 Neurological £ 431,954.90 0 2 -0.24% 14 2 5 1
17 Genito-urinary £ 463,947.64 0 1 -0.07% 17 18 10 10
16 Trauma & injuries* £ 447,083.30 0 0 0.00% - - - -
18+19 Maternity & neonates* £ 424,516.42 0 0 0.00% 18 19 19 19
3 Disorders of Blood £ 146,330.91 1 19 -2.93% 7 7 9 7
5 Mental Health £ 1,311,251.36 8 84 -13.22% 2 3 2 3
6 Learning Disability £ - 0 0 0.00% 19 13 12 15
8 Problems of Vision £ 369,173.21 0 9 -1.29% 10 11 8 12
9 Problems of Hearing £ 78,811.30 0 17 -2.52% 8 8 7 8
12 Dental problems £ 348,207.85 0 11 -1.59% 9 9 13 11
14 Skin £ 276,255.90 1 2 -0.47% 11 14 16 14
15 Musculo skeletal £ 440,252.82 2 31 -4.68% 5 6 6 9
20 Poisoning and AE £ 125,330.07 0 1 -0.23% 15 17 15 17
21 Healthy Individuals £ 242,347.45 0 1 -0.10% 16 16 17 18
22 Social Care Needs £ 612,797.70 0 0 0.00% - - - -
23 Other £ 1,114,950.40 0 0 0.00% - - - -
Total: 194 500
Total change in QALY death + QALY alive
694
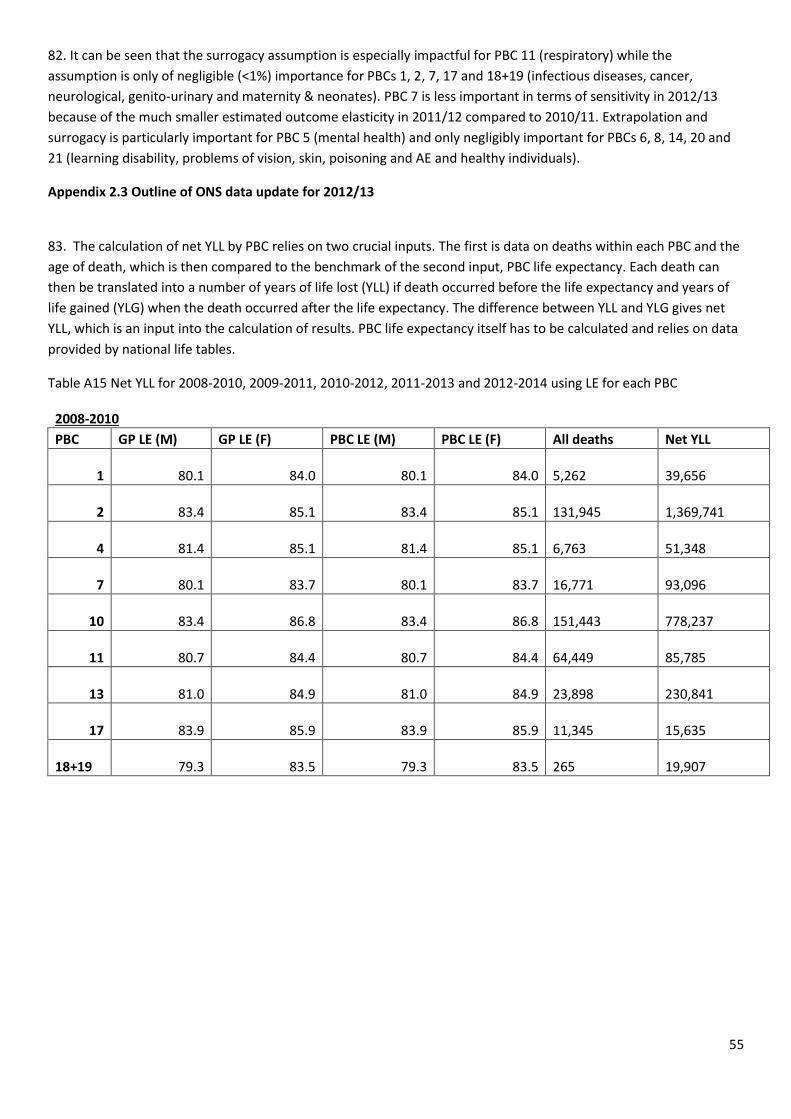
55
82. It can be seen that the surrogacy assumption is especially impactful for PBC 11 (respiratory) while the
assumption is only of negligible (<1%) importance for PBCs 1, 2, 7, 17 and 18+19 (infectious diseases, cancer,
neurological, genito-urinary and maternity & neonates). PBC 7 is less important in terms of sensitivity in 2012/13
because of the much smaller estimated outcome elasticity in 2011/12 compared to 2010/11. Extrapolation and
surrogacy is particularly important for PBC 5 (mental health) and only negligibly important for PBCs 6, 8, 14, 20 and
21 (learning disability, problems of vision, skin, poisoning and AE and healthy individuals).
Appendix 2.3 Outline of ONS data update for 2012/13
83. The calculation of net YLL by PBC relies on two crucial inputs. The first is data on deaths within each PBC and the
age of death, which is then compared to the benchmark of the second input, PBC life expectancy. Each death can
then be translated into a number of years of life lost (YLL) if death occurred before the life expectancy and years of
life gained (YLG) when the death occurred after the life expectancy. The difference between YLL and YLG gives net
YLL, which is an input into the calculation of results. PBC life expectancy itself has to be calculated and relies on data
provided by national life tables.
Table A15 Net YLL for 2008-2010, 2009-2011, 2010-2012, 2011-2013 and 2012-2014 using LE for each PBC
2008-2010 PBC GP LE (M) GP LE (F) PBC LE (M) PBC LE (F) All deaths Net YLL
1 80.1 84.0 80.1 84.0 5,262
39,656
2 83.4 85.1 83.4 85.1 131,945
1,369,741
4 81.4 85.1 81.4 85.1 6,763
51,348
7 80.1 83.7 80.1 83.7 16,771
93,096
10 83.4 86.8 83.4 86.8 151,443
778,237
11 80.7 84.4 80.7 84.4 64,449
85,785
13 81.0 84.9 81.0 84.9 23,898
230,841
17 83.9 85.9 83.9 85.9 11,345
15,635
18+19 79.3 83.5 79.3 83.5 265
19,907
56
2009-2011 PBC GP LE (M) GP LE (F) PBC LE (M) PBC LE (F) All deaths Net YLL
1 80.5 84.3 80.5 84.3 4,907
38,814
2 83.7 85.4 83.7 85.4 132,656
1,395,819
4 81.7 85.4 81.7 85.4 6,477
51,079
7 80.5 84.0 80.5 84.0 17,113
93,164
10 83.6 87.1 83.6 87.1 142,567
768,320
11 81.1 84.7 81.1 84.7 63,088
101,927
13 81.4 85.2 81.4 85.2 23,499
235,041
17 84.1 86.2 84.1 86.2 10,600
16,230
18+19 79.7 83.8 79.7 83.8 252
18,895
2010-2012 PBC GP LE (M) GP LE (F) PBC LE (M) PBC LE (F) All deaths Net YLL
1 80.7 84.5 80.7 84.5 4,721
36,662
2 83.8 85.5 83.8 85.5 134,236
1,405,256
4 81.9 85.5 81.9 85.5 6,348
50,182
7 80.7 84.1 80.7 84.1 18,312
91,923
10 83.8 87.2 83.8 87.2 136,790
741,406
11 81.3 84.8 81.3 84.8 64,034
99,150
13 81.6 85.3 81.6 85.3 23,325
232,162
17 84.3 86.3 84.3 86.3 9,876
15,325
18+19 80.0 83.9 80.0 83.9 234
17,773
57
2011-2013 PBC GP LE (M) GP LE (F) PBC LE (M) PBC LE (F) All deaths Net YLL
1 80.9 84.6 80.9 84.6 4,836
36,190
2 83.9 85.5 83.9 85.5 135,439
1,411,055
4 82.1 85.6 82.1 85.6 6,227
51,216
7 80.9 84.2 80.9 84.2 19,603
89,638
10 83.9 87.2 83.9 87.2 131,189
717,461
11 81.5 84.9 81.5 84.9 66,138
96,351
13 81.8 85.3 81.8 85.3 22,922
228,849
17 84.4 86.3 84.4 86.3 8,983
14,710
18+19 80.1 84.0 80.1 84.0 219
16,478
2012-2014 PBC GP LE (M) GP LE (F) PBC LE (M) PBC LE (F) All deaths Net YLL
1 81.0 84.6 81.0 84.6 4,797
35,741
2 84.0 85.6 84.0 85.6 136,592
1,413,327
4 82.2 85.7 82.2 85.7 6,440
53,424
7 81.0 84.3 81.0 84.3 21,451
86,067
10 84.0 87.3 84.0 87.3 130,040
712,590
11 81.6 85.0 81.6 85.0 65,766
101,468
13 81.9 85.4 81.9 85.4 22,807
224,613
17 84.5 86.4 84.5 86.4 8,744
14,334
18+19 80.3 84.1 80.3 84.1 220
16,530
58
Appendix 2.4 Calculation of elasticity for extrapolation and overall NHS mortality elasticities
84. Whilst we have estimated outcome elasticities for PBCs 2, 10, 11, 13, 1, 4, 7, 17 and 18+19, we need to use these
to generate an overall elasticity for two purposes. The first is that we wish to extrapolate an estimated outcome
elasticity to those PBCs without outcome indicators. The second is that there is a vast body of literature that
estimates the elasticity of all-cause mortality with respect to health care expenditure, but this is not easily compared
with disease-specific mortality elasticities.
85. For the purposes of extrapolation, a weighted average of outcome elasticities was employed by Claxton et al.
(2015), where the weight was determined by the change in spend in each of the PBCs with outcome indicators
(including PBC 16). However, this does not result in an overall elasticity as such, i.e. it does not reflect the % change
in mortality across these PBCs for a % increase in expenditure for these PBCs. In order to obtain an elasticity like this,
it is necessary to simulate the changes in expenditure and mortality that would result from a % increase in overall
budget and then calculate the resulting % changes in expenditure and mortality to calculate the elasticity.
86. We also want to construct an estimate of overall mortality elasticity that can be used to compare with other
studies that have estimated an all-cause mortality model. To do this, a similar procedure to that explained above (in
85.) is implemented, only the increase in mortality is expressed as a % of all mortality, rather than as a % of the
mortality just from those PBCs with outcome indicators.
87. The effect of changing the way in which extrapolated elasticity is calculated has an ambiguous effect on the
extrapolated elasticity and consequently the overall health opportunity costs estimate. Practically, we find that it has
a modest effect, generally from extrapolated elasticity increases (all years except 2009/10) as shown in Table A16
where we give the results for 2009/10, 2011/12, 2012/13 and re-applied 2008/09 using both methods of elasticity
extrapolation. We also provide overall mortality elasticity estimates for these years for comparison with all-cause
model mortality elasticities.
59
Table A16 Estimated overall elasticities and implications for results
Year *re-applied PCT model
Year 2008/09* 2009/10 2010/11 2011/12 2012/13
Cla
xto
n e
t al
. (2
01
5)
ext
rap
ola
ted
ela
stic
ity
Cost per QALY £13,095 £9,662 £10,750 £9,643 £15,714
Health opportunity costs of £10mn (QALYs)
764 1,035 930 1037 636
Elasticity for extrapolation
0.66 1.25 1.25 1.07 0.79
Ne
w e
xtra
po
late
d
ela
stic
ity
Cost per QALY £12,311 £9,887 £10,225 £8,997 £14,410
Health opportunity costs of £10mn (QALYs)
812 1,011 978 1,112 694
Elasticity for extrapolation
0.88 1.13 1.55 1.53 1.15
Elasticity comparable to all-cause model results
0.85 0.94 1.33 1.39 1.03
60
88. The methods compared in Table A16 are expressed in algebraic terms in the following paragraphs, for purposes of
simplifying algebraic notation, PBC number re-assigned as below, with new number on the left and old number on the right:
1 2 Cancer
2 10 Circulatory problems
3 11 Respiratory problems
4 13 Gastro-intestinal problems
5 1 Infectious diseases
6 4 Endocrine problems
7 7 Neurological problems
8 17 Genito-urinary problems
9 16 Trauma & injuries*
10 18+19 Maternity & neonates*
11 3 Disorders of Blood
12 5 Mental Health Disorders
13 6 Problems of Learning Disability
14 8 Problems of Vision
15 9 Problems of Hearing
16 12 Dental problems
17 14 Problems of the Skin
18 15 Problems of the Musculo skeletal system
19 20 Poisoning and adverse effects
20 21 Healthy Individuals
21 22 Social Care Needs
22 23 Other
89. A list of the variables and label are provided below:
∈𝑃𝐵𝐶𝐸𝑥𝑝
adjusted* PBC expenditure elasticity
∈̇𝑃𝐵𝐶𝐸𝑥𝑝
adjusted* PBC expenditure elasticity
∈𝑃𝐵𝐶𝑂𝑢𝑡 adjusted PBC outcome elasticity
𝐸𝑥𝑝𝑃𝐵𝐶 PBC expenditure
𝑀𝑃𝐵𝐶 PBC mortality (source: ONS)
𝑀𝑂𝑁𝑆 All-cause mortality (source: ONS)
∆𝐸𝑥𝑝𝑃𝐵𝐶 PBC change in expenditure
∆𝑀𝑃𝐵𝐶 PBC change in mortality
* Consider a change in overall budget of 1%
∈̇𝑃𝐵𝐶𝐸𝑥𝑝
represents adjusted elasticity so that 1% increase in budget is equal to the increases in PBC expenditures added together,
i.e. ∈̇𝑃𝐵𝐶𝐸𝑥𝑝
= 𝑘 ∗∈𝑃𝐵𝐶𝐸𝑥𝑝
where k is such that:
∑ ∆𝐸𝑥𝑝𝑃𝐵𝐶
22
𝑃𝐵𝐶=1
= ∑ 0.01 ∗∈̇𝑃𝐵𝐶𝐸𝑥𝑝
∗ 𝐸𝑥𝑝𝑃𝐵𝐶
22
𝑃𝐵𝐶=1
= 0.01 ∗ ∑ 𝐸𝑥𝑝𝑃𝐵𝐶
22
𝑃𝐵𝐶=1
89. Claxton et al. (2015) approach ∈̅
61
Weighted average of the outcome elasticity by the change in expenditure for each PBC following a 1% increase in overall budget:
∈̅=∑ 0.01 ∗∈̇𝑃𝐵𝐶
𝐸𝑥𝑝∗ 𝐸𝑥𝑝𝑃𝐵𝐶 ∗∈𝑃𝐵𝐶
𝑂𝑢𝑡10𝑃𝐵𝐶=1
∑ 0.01 ∗∈̇𝑃𝐵𝐶𝐸𝑥𝑝
∗ 𝐸𝑥𝑝𝑃𝐵𝐶10𝑃𝐵𝐶=1
90. Alternative approaches – general equation:
𝑀𝑜𝑟𝑡𝑎𝑙𝑖𝑡𝑦 𝑒𝑙𝑎𝑠𝑡𝑖𝑐𝑖𝑡𝑦 =∆𝑀
𝑀⁄
∆𝐸𝑥𝑝𝐸𝑥𝑝⁄
91. Calculating ∈̌ (elasticity for extrapolation):
∆𝐸𝑥𝑝 = ∑ ∆𝐸𝑥𝑝𝑃𝐵𝐶
10
𝑃𝐵𝐶=1
= ∑ 0.01 ∗∈̇𝑃𝐵𝐶𝐸𝑥𝑝
∗ 𝐸𝑥𝑝𝑃𝐵𝐶
10
𝑃𝐵𝐶=1
𝐸𝑥𝑝 = ∑ 𝐸𝑥𝑝𝑃𝐵𝐶
10
𝑃𝐵𝐶=1
∆𝑀 = ∑ ∆𝑀𝑃𝐵𝐶
10
𝑃𝐵𝐶=1
= ∑ 0.01 ∗∈̇𝑃𝐵𝐶𝐸𝑥𝑝
∗∈𝑃𝐵𝐶𝑂𝑢𝑡 ∗ 𝑀𝑃𝐵𝐶
10
𝑃𝐵𝐶=1
𝑀 = ∑ 𝑀𝑃𝐵𝐶
10
𝑃𝐵𝐶=1
∈̌=
∑ 0.01 ∗∈̇𝑃𝐵𝐶𝐸𝑥𝑝
∗∈𝑃𝐵𝐶𝑂𝑢𝑡 ∗ 𝑀𝑃𝐵𝐶
10𝑃𝐵𝐶=1
∑ 𝑀𝑃𝐵𝐶10𝑃𝐵𝐶=1
⁄
∑ 0.01 ∗∈̇𝑃𝐵𝐶𝐸𝑥𝑝
∗ 𝐸𝑥𝑝𝑃𝐵𝐶10𝑃𝐵𝐶=1
∑ 𝐸𝑥𝑝𝑃𝐵𝐶10𝑃𝐵𝐶=1
⁄
92. Calculating ∈̂ (overall elasticity to compare with all-cause mortality models):
∆𝐸𝑥𝑝𝐸𝑥𝑝⁄ = 0.01
(%change in expenditure relevant here is % overall change in budget)
∆𝑀 = ∑ ∆𝑀𝑃𝐵𝐶
10
𝑃𝐵𝐶=1
= ∑ 0.01 ∗∈̇𝑃𝐵𝐶𝐸𝑥𝑝
∗∈𝑃𝐵𝐶𝑂𝑢𝑡 ∗ 𝑀𝑃𝐵𝐶
10
𝑃𝐵𝐶=1
Effectively assume that no mortality effects in any of the other PBCs beside 10 with mortality indicator
∈̂=
∑ 0.01 ∗∈̇𝑃𝐵𝐶𝐸𝑥𝑝
∗∈𝑃𝐵𝐶𝑂𝑢𝑡 ∗ 𝑀𝑃𝐵𝐶
10𝑃𝐵𝐶=1
𝑀𝑂𝑁𝑆⁄
0.01