Embed Size (px)
Citation preview

Civilian-held Firearms Numbers 1
Briefing PaperJune 2018
Estimating gloBal Civilian-HElD FirEarms numBErsAaron Karp
2 Briefing Paper June 2018
About the authoraaron Karp is a senior consultant at the Small Arms Survey and a senior lecturer in Political Science at Old Dominion University. Previously he held positions at Columbia University, Harvard University, the Stiftung Wissenschaft und Politik, and the Stockholm International Peace Research Institute. His early research con-tributed to the creation of the Missile Technology Control Regime. He served as consultant to the United Nations Secretary-General on missiles and nuclear weap-ons, and contributed to the US Commission to Assess Ballistic Missile Threats to the United States. At the Small Arms Survey his work concentrates on the global distribution of small arms.
AcknowledgementsThe Small Arms Survey wishes to express its gratitude to all the governments, and regional and international organizations that supported this project financially and with data and responses to inquiries, as well as the non-governmental organizations, journalists, researchers, and scholars who contributed the details and reports that helped to make this publication possible.
Credits and contributors
Front cover photo
A hunter walks with his dog, Castell’Azzara, Italy,
November 2015. Source: Max Rossi/Reuters
Copy-editors: Tania Inowlocki and Alex Potter ([email protected])
Proofreader: Donald Strachan
Design and layout: Rick Jones ([email protected])
Printed by nbmedia in Geneva, Switzerland
First edition: September 2011this edition: June 2018

Civilian-held Firearms Numbers 3
overviewUncertainty about any firearms data requires systematic esti-mation that relies on a broad spectrum of sources and makes approximation unavoidable. The Small Arms Survey’s estimates of civilian firearms holdings use data gathered from multiple sources. However, with much of civilian ownership concealed or hard to identify, gun ownership numbers can only approxi-mate reality. Using data from several different sources, at the end of 2017 there were approximately 857 million civilian-held firearms in the world’s 230 countries and territories. Civilian firearms registration data was available for 133 countries and territories. Survey results were used to help establish total gun civilian holdings in 56 countries. The new figure is 32 per cent higher than the previous estimate from 2006, when the Small Arms Survey estimated there were approximately 650 million civilian-held firearms. Virtually all countries show higher numbers, although national ownership rates vary widely, reflecting factors such as national legislation, a coun-try’s gun culture, historical and other factors. While some of the increase reflects improved data and research methods, much is due to actual growth of civilian ownership.
Key findings There were approximately 857 million civilian-held firearms
in the world at the end of 2017.
Roughly 100 million civilian firearms were reported as reg-istered, accounting for some 12 per cent of the global total.
National ownership rates vary from about 120.5 firearms for every 100 residents in the United States to less than 1 firearm for every 100 residents in countries like Indonesia, Japan, Malawi, and several Pacific island states.
There are regional or national surveys concerning civilian holdings for 56 countries and territories.
introductionMost of the world’s firearms are privately owned, which makes documenting their precise number particularly challenging.
Official registration totals provide the most reliable data, although they do not capture the full spectrum of firearms in civilian hands. Estimates, even the most comprehensive, are often not reliable. Maximizing both comprehensiveness and reliability requires the considera-tion of a wide range of sources. This Briefing Paper shows how a variety of data sources can be combined to generate better estimates of total firearms owner-ship for a specific country, as well as a global figure.
The sources and methods used by the Small Arms Survey show there were approximately 857 million civilian-held firearms in 230 states and autonomous territories at the end of 2017 (see Box 1).1 The new figure is 32 per cent higher (207 million more) than the previous global number, when the Small Arms Survey estimated approximately 650 million civilian-held firearms in 2006 (Small Arms Survey, 2007, p. 39).
While some of the higher figures for civilian-held firearms reflect improved data and research methods (see Box 4), a significant part is due to changes in actual ownership levels. With the world’s factories delivering millions of newly man-ufactured firearms annually and with far fewer being destroyed, civilian ownership appears to be growing globally (Bauer, 2013; Small Arms Survey, 2007, p. 64; 2018). In the United States alone civil-ians acquired at least 122 million new or imported firearms during the period 2006–17 (ATF, 2017a; 2017b). National ownership rates vary significantly from a high of about 120.5 firearms for every 100 people in the United States to less than 1 firearm for every 100 residents in countries like Indonesia, Japan, Malawi, and several Pacific island states (see Tables 1 and 2; Small Arms Survey, 2018).
The legal definition of a civilian fire-arm varies.2 For example, some states allow civilian ownership of firearms that are restricted to military use in other states.3 As a result, and depending on the setting, the firearms reviewed in this Briefing Paper range from improvised craft weapons to factory-made handguns, rifles, shotguns, and in some countries even machine guns (see Boxes 2 and 3). The word civilian is used here to refer to who possesses the weapons, not their specific type or legal status. Numbers provided here include all firearms in civilian hands, both licit and illicit. Wherever possible, the civilian total includes the firearms of private security firms, as well as those of

4 Briefing Paper June 2018
table 2 Estimated rate of civilian firearms holdings in the 25 top-ranked countries and territories, 2017 (firearms per 100 residents)
United States 120.5 Iceland 31.7 Sweden 23.1
Yemen 52.8 Bosnia and Herzegovina 31.2 Pakistan 22.3
Montenegro 39.1 Austria 30.0 Portugal 21.3
Serbia 39.1 Macedonia* 29.8 France 19.6
Canada 34.7 Norway 28.8 Germany 19.6
Uruguay 34.7 Malta 28.3 Iraq 19.6
Cyprus 34.0 Switzerland 27.6 Luxembourg 18.9
Finland 32.4 New Zealand 26.3
Lebanon 31.9 Kosovo** 23.8
Notes: This table excludes countries and territories with a population of under 150,000. * Macedonia = the former
Yugoslav Republic of Macedonia. ** The designation of Kosovo is without prejudice to positions on status and
is in line with UN Security Council Resolution 1244 and the International Court of Justice Opinion on the Kosovo
declaration of independence.
Source: Small Arms Survey (2018)
Box 1 Global breakdown of firearms numbers
At the end of 2017 there were approximately 1,013 million firearms in the 230 countries and autonomous territories of the world, 84.6 per cent of which were held by civilians, 13.1 per cent by state militaries, and 2.2 per cent by law enforcement agencies (see Figure 2).
The 2017 combined global total of 1,013 million firearms is higher than the previously published Small Arms Survey global total of 875 million firearms in 2006, an increase of 15.7 per cent for all identified firearms. Much of this change is due to an increase of 32 per cent in the estimated civilian-held firearms total. Reported global totals for the law enforcement and military categories show net decreases, mostly due to changes in esti-mating procedures.
While the global total for 2017 is signifi-cantly higher than that in 2006, not all changes at the country level are due to a growth of civilian firearms holdings. Some variations since 2006 are also affected by the availability of more complete reporting or more comprehensive estimates.
Every effort has been made to ensure the reliability of Small Arms Survey data, but not all entries are equally complete. In some areas—especially law enforce-ment and the military—some government agencies and stockpiles may have been missed. The Survey methodology counts all firearms equally, although they can vary greatly in capability, reliability, and durability.
Figure 1 Global firearms ownership estimates, 2017
Civilians (857 million)
Law enforcement (22.7 million)
Military (133 million)
table 1 Estimated total civilian-held legal and illicit firearms in the 25 top-ranked countries and territories, 2017
United States 393,300,000 Turkey 13,200,000 Saudi Arabia 5,500,000
India 71,100,000 France 12,700,000 South Africa 5,400,000
China 49,700,000 Canada 12,700,000 Colombia 5,000,000
Pakistan 43,900,000 Thailand 10,300,000 Ukraine 4,400,000
Russian Federation 17,600,000 Italy 8,600,000 Afghanistan 4,300,000
Brazil 17,500,000 Iraq 7,600,000 Egypt 3,900,000
Mexico 16,800,000 Nigeria 6,200,000 Philippines 3,800,000
Germany 15,800,000 Venezuela 5,900,000
Yemen 14,900,000 Iran 5,900,000
Source: Small Arms Survey (2018)
non-state armed groups and gangs. These sub-categories represent a small fraction of the civilian total, although they can be disproportionately significant in armed violence in some settings (Small Arms Survey, 2010, p. 103).
Comparative sources on civilian firearm ownershipWhile it is generally easy to be certain of the existence of some guns, it is almost impossible to be sure of the total number of all guns. Poor record-keeping and the near absence of reporting requirements in much of the world complicate assess-ments of global stockpiles. Differences in national ‘gun culture’—each country’s distinctive combination of historic and current sources of supply, laws, and attitudes towards firearms ownership and use—are no less important. In the process of estimating civilian firearm ownership, differences in national ‘gun culture’ often have effects not just on fire-arms availability, but also on sensitivity to, and the classification and perception of, firearms. And at the empirical level, categories of firearm holders may over-lap, such as when individuals use private firearms as security guards, in armed groups, or in gangs. Uncertainty about any firearm data requires systematic estimation to rely on a broad spectrum of sources and makes approximation unavoidable.
The Small Arms Survey’s civilian ownership estimates emphasize data gathered from multiple sources. These are systematically integrated to generate the total estimate for each country (Box 4). The available data sources include pub-lished official documents and research studies on countries and regions, official responses to questionnaires from the Small Arms Survey, public opinion surveys, news reports, and private correspondence with experts. When possible, highest and low-est numbers are discarded as outliers.
Six data sources deserving special emphasis are reviewed here. Four are emphasized in the Small Arms Survey’s Civilian Firearms Holdings 2017 data-base. Two others feature prominently in the literature on civilian holdings, but are not used here.
Firearms registrationEspecially where it is mandatory and widely accepted, registration can be the most reliable indicator of overall private gun ownership. With the help of govern-ments, research, and media reporting,

Civilian-held Firearms Numbers 5
a global total of roughly 100 million reg-istered firearms have been identified in 133 countries and territories (Small Arms Survey, 2018).
But registration systems can be quirky. In the absence of automatic renewal, for example, weapons can disappear from public records and statistics. In some countries, registration totals include other kinds of weapons, such as air guns in Scotland or swords in Japan (BBC, 2016; Karp, 2017). In the United States, only specific categories of weapons require federal registration, and in many coun-tries registration is not systematically respected, resulting in very low registra-tion totals (ATF, 2017b, p. 15; Gould and Lamb, 2004). Even in countries with sophisticated registration systems, reg-istration totals remain incomplete. Older guns and privately or illegally traded weapons regularly escape registration.
SurveysThe findings of surveys on gun ownership can be especially useful. The greatest appeal of polling is comprehensiveness: it should cover all civilian firearms. But the sensitivity of gun ownership can weaken the reliability of responses. Survey results
depend on question wording, while sam-pling issues and social biases can affect responses. The lowest estimates of civil-ian ownership are often from surveys. If expert estimates can appear to exaggerate figures, surveys are sometimes suspected of underreporting (Wellford, Pepper, and Petrie, 2005, pp. 34–37, 57–58). In the United States, for example, there is a grow-ing trend among gun owners to refuse to answer surveys on firearm possession (Urbatsch, 2018). As a result, survey results, like other measures of owner-ship, should be combined with data from other sources whenever possible.
Survey results were used to help establish total gun ownership in 56 coun-tries. There are several ways in which sur-veys can ask about firearms, so adjusting results is necessary to make them fully comparable. Many surveys measure not the number of guns, but the proportion of individuals or households that hold at least one gun. Many studies of crime and violence collect information on the pres-ence of firearms in households. When surveys ask about individual ownership, findings must be corrected for the popula-tion surveyed, which is usually just adults. The largest international survey project on individual gun owners examined 28 countries (European Commission, 2013).
Expert estimatesAmong the most common figures on gun ownership are personal estimates by knowledgeable observers. Their impres-sions are useful, but they can also differ dramatically. In some countries, such estimates have diverged by a factor of ten (Small Arms Survey, 2007, pp. 45, 54). Expert estimates can be much higher than other country totals, often double or triple other estimates, sometimes even higher. Expert estimates are important and should be considered seriously, but in our methodology, highly divergent expert estimates are usually discarded as outliers.
Analogous comparison Another way to estimate civilian owner-ship is through comparison with similar but better-understood countries. Survey-based estimates of unregistered weap-ons in one country, for instance, can serve as a useful basis for estimating illicit firearm ownership in a country where surveys are lacking, but which has comparable firearms legislation, and a similar ‘gun culture’ and per capita gross domestic product.
A gun owner waits his turn during a firearms registration programme, Nueva Italia, Mexico, April 2014. Source: Alan Ortega/Reuters
6 Briefing Paper June 2018
Other indicators
Proxies
The use of substitute indicators or proxies is an established and important tech-nique for firearms estimation. For exam-ple, here appears to be a positive—albeit weak—correlation between national wealth, population, and gun ownership (Small Arms Survey, 2007, pp. 57–59). Another proxy for gun ownership is the
proportion of suicides committed with firearms (Ajdacic-Gross et al., 2010; Alvazzi del Frate and Pavesi, 2014). Such statistical tools are limited by the cultural and social differences among the coun-tries being compared and statistical prob-lems like the reliability of these countries’ suicide data. The firearm suicide proxy, for instance, has been proved to be reli-able in Western societies, but its utility elsewhere is uncertain (Ajdacic-Gross et al., 2006). For these reasons proxies were
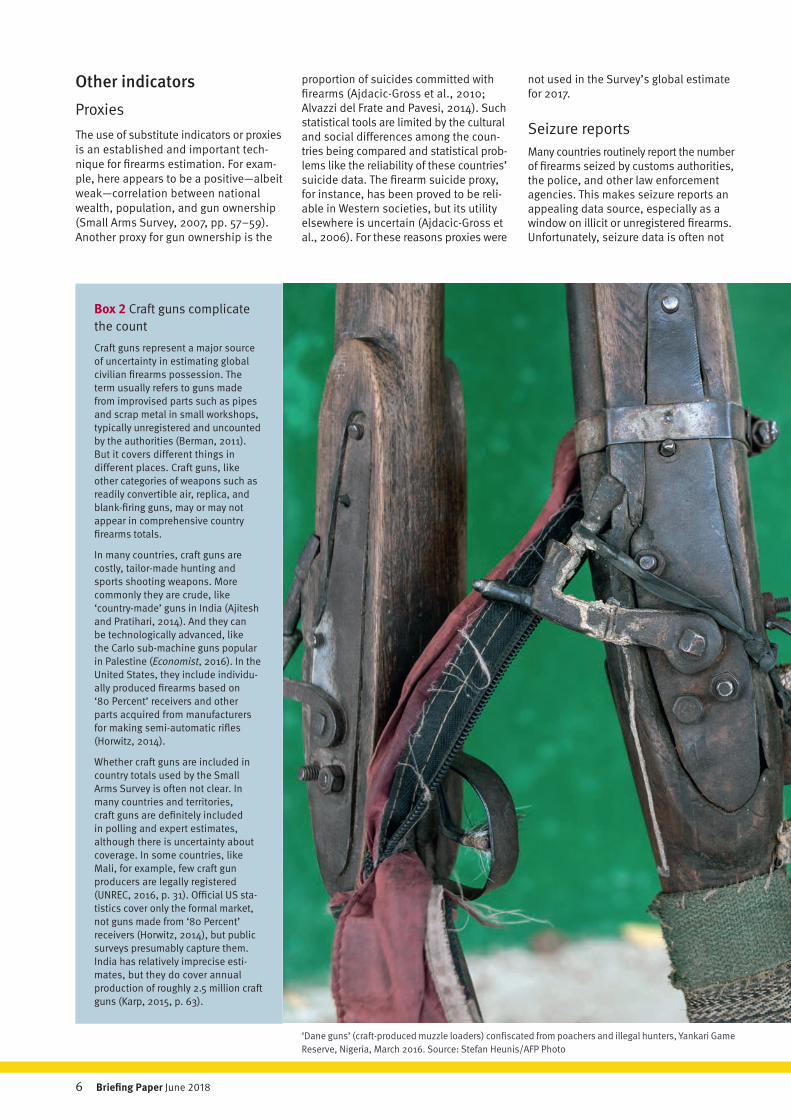
Box 2 Craft guns complicate the count
Craft guns represent a major source of uncertainty in estimating global civilian firearms possession. The term usually refers to guns made from improvised parts such as pipes and scrap metal in small workshops, typically unregistered and uncounted by the authorities (Berman, 2011). But it covers different things in different places. Craft guns, like other categories of weapons such as readily convertible air, replica, and blank-firing guns, may or may not appear in comprehensive country firearms totals.
In many countries, craft guns are costly, tailor-made hunting and sports shooting weapons. More commonly they are crude, like ‘country-made’ guns in India (Ajitesh and Pratihari, 2014). And they can be technologically advanced, like the Carlo sub-machine guns popular in Palestine (Economist, 2016). In the United States, they include individu-ally produced firearms based on ‘80 Percent’ receivers and other parts acquired from manufacturers for making semi-automatic rifles (Horwitz, 2014).
Whether craft guns are included in country totals used by the Small Arms Survey is often not clear. In many countries and territories, craft guns are definitely included in polling and expert estimates, although there is uncertainty about coverage. In some countries, like Mali, for example, few craft gun producers are legally registered (UNREC, 2016, p. 31). Official US sta-tistics cover only the formal market, not guns made from ‘80 Percent’ receivers (Horwitz, 2014), but public surveys presumably capture them. India has relatively imprecise esti-mates, but they do cover annual production of roughly 2.5 million craft guns (Karp, 2015, p. 63).
not used in the Survey’s global estimate for 2017.
Seizure reportsMany countries routinely report the number of firearms seized by customs authorities, the police, and other law enforcement agencies. This makes seizure reports an appealing data source, especially as a window on illicit or unregistered firearms. Unfortunately, seizure data is often not
‘Dane guns’ (craft-produced muzzle loaders) confiscated from poachers and illegal hunters, Yankari Game Reserve, Nigeria, March 2016. Source: Stefan Heunis/AFP Photo

Civilian-held Firearms Numbers 7
Box 3 All firearms are not alike
Country totals aim for comprehensiveness, but they usually lack detail. Very different types of firearms are lumped together by macrostatistics such as those in this Briefing Paper. For example, a country total might combine weapons with capabilities that vary significantly, including single-shot craft guns and factory-made semi-automatic rifles.
Registration data and manufacturer reporting can be more nuanced, depending on the law. In Canada, for example, the federal government requires the registration of hand-guns, but not of long guns (Masters, 2016). But some Canadian provinces, like some states in the United States, have their own registration requirements (RCMP, 2017). In other countries, ownership patterns simplify the problem, particularly when one type of gun is most common. As the Survey previously reported, ‘the vast majority of illicit small arms in Afghanistan, Iraq, and Somalia appear to be Kalashnikov-pattern assault rifles. Other types of small arms are comparatively rare’ (Small Arms Survey, 2012, p. 313).
Where more detailed data is available, it can reveal important trends. In the United States, it points to dramatic shifts in public gun-purchasing patterns in the past decade, as pistols and semi-automatic rifles became increasingly dominant, influenced by the expiry of the Federal Assault Weapons Ban in 2004 and changing consumer preferences (see Figure 2). According to data from the National Shooting Sports Foundation (NSSF)—a manufacturer’s advocacy organization—semi-automatic rifles accounted for a growing share of US rifle sales since then, reaching 13 per cent of all US civilians’ new gun purchases in 2012, the last year for which data is available. No less striking is the rising share of pistols, which, according to data from the US Bureau of Alcohol, Tobacco and Firearms, out-sell revolvers in the US domestic civilian market by four to one or more since 2012 (ATF, 2017b, pp. 1, 3, 5; NSSF, 2015, p. 5).
According to surveys commissioned by the NSSF, as of 2016, 42.3 per cent of US hunters and shooters reported owning at least one AR15 platform (M16-style) rifle. In the following year, 24.8 per cent of surveyed US hunters and shooters who bought a firearm in July–August 2017 reported purchasing at least one modern sporting rifle or semi-automatic assault weapon, such as an AR15- or Kalashnikov-style rifle (NSSF, 2018, pp. 201–2). In 2016, six per cent of US adults surveyed reported that they participated in target shoot-ing with a modern sporting rifle or semi-automatic assault weapon, which is equal to approximately 14 million people nationally (NSSF, 2018, pp. 136, 189).
consistently reported and tends to vary greatly across countries, making it easy to misinterpret (UNODC, 2015, p. 5). While seizure reports are revealing, they cur-rently cannot be used for estimating total civilian firearms. Research has not revealed a reliable technique to extrapolate from seizure reports to trends in total firearms ownership or even just unregistered own-ership (UNODC, 2015, p. 87). For these reasons, seizure reports were also not used in the Survey’s global estimate for 2017.
analytical considerations
Increasing numbers Factors that tend to propel levels of civil-ian firearms ownership include growing supply due to production, and growing demand from population and income growth (Atwood, Glatz, and Muggah, 2006). While there are a few exceptional countries where public gun ownership is declining—Japan is the best understood—
in most of the world the total number of civilian firearms appears to be going up. Documented annual inflation growth rates vary greatly from country to coun-try, with rates as high as 3.4 per cent for rifles in England and Wales and 4.16 per cent for all firearms in the United States in recent years (Home Office, 2015; ATF, 2017a; 2017b). The Small Arms Survey assumes that countries have a growth rate of one per cent annually, unless higher rates can be substantiated.
Figure 2 Annual acquisition of new firearms in the United States, by type
Note: The ‘miscellaneous’ category includes black-powder firearms, sub-machine guns, pistol-grip
firearms (usually a type of pump-action shotgun), starter guns, and other kinds of firearms.
Source: ATF (2017b)
2000 2001 2002 2003 2004 2005 2006 2007 2008 2009 2010 2011 2012 2013 2014 2015
5
4
3
2
1
0
Number of firearms purchased (millions)
Year
Pistols Revolvers Rifles Shotguns Miscellaneous
8 Briefing Paper June 2018
Box 4 Computation methods for civilian firearms holdings
This Briefing Paper presents estimates from the Small Arms Survey’s Civilian Firearms Holdings 2017 database (Small Arms Survey, 2018). The database estimates are calcu-lated on the basis of the following sources (or mix of sources):
(a) national firearms registration statistics;
(b) general population surveys about firearm ownership (available for 56 countries/territories);
(c) experts’ estimates of civilian holdings; and,
(d) where none of these was available, analogous comparisons based on estimates for comparable countries.
The database further relies on the analysis of individual reports on civilian firearms owner-ship from multiple sources, including published official documents and research studies on countries and regions, official responses to questionnaires sent out by the Small Arms Survey, news reports, and private correspondence with experts.
Computation steps
The goal of this exercise was to produce estimates of civilian firearms ownership for 230 countries and territories. For 181 countries/territories, at least one of the sources indicated as (a), (b), or (c) above was available. Forty-nine figures were estimated using analogous comparison, mostly in the Caribbean, Central Asia, the Middle East, and sub-Saharan Africa. The year 2017 was established as the reporting year.
The process of computation required going through all available sources for each country/territory as follows:
1. Where relevant national statistics were available, they were used to establish the number of registered firearms. If only the number of persons licensed to own a fire-arm was available, this number served as a minimum estimate for registered firearms, with the assumption that each person with a licence owns at least one firearm.
2. If population surveys were available, a mean estimate of the number of firearms was calculated, using the most recent reliable survey of households and individuals in each country/territory. Each estimate was then adjusted for annual increase to make results comparable and aligned to the reporting year.
3. Expert estimates were analysed and mean estimates of the number of civilian firearms in each country/territory were produced. Each estimate was then adjusted for annual increase to the reporting year, making up for the difference between the year of the original estimate and the reporting year. Highest and lowest expert estimates were discarded if they were too extreme.
4. Survey- and expert-based mean estimates were averaged out for each country/territory, if they were available.
5. Attrition (known actions that would deflate numbers) since the reference year was considered; that is, any known figures were deducted related to civilian disarmament, firearms collection programmes, seizures, destruction, etc. from the mean estimate derived from expert assessments and survey-based estimates.
6. In countries/territories where no information from sources (1), (2), or (3) was available, firearms numbers were estimated using analogous rates from comparable countries and territories where the research team, guided by available research and media reporting, appraised whether analogous comparisons were plausible.
For most locations there were multiple sources generating a wide range of estimates. After discarding clear outliers, the approach described above averaged these estimates into a single estimate.
This estimation system used several important assumptions. The most significant of these were the following:
We assumed an annual change in total civilian ownership, representing an increase of at least one per cent per year, to be the same in each country/territory of the world. This would represent the average balance of all losses and increases. Exceptions we applied included countries with documented deflation that contradicted this assump-tion (like Japan) and countries with higher documented inflation (such as the United States since 2006), or countries with plausibly higher growth rates due, for exam-ple, to an ongoing conflict where we assumed above-average civilian armament is taking place.
Secondly, where no information was available about the number of firearms per owner, it was assumed that an average owner possessed 1.5 firearms (this multiplier was used in survey-based estimates, where no national figures for firearms-per-owner rates were available, or could not be estimated from registration data).

Civilian-held Firearms Numbers 9
A woman listens to instructions about her practice shooting for her concealed carry certification test, Illinois, United States, July 2017. Source: Jim Young/AFP Photo

10 Briefing Paper June 2018
Growth of total firearms numbers (for example, see Table 1) is not the same as growth rates of ownership per population (for example, see Table 2). If a country’s population grows faster than its gun hold-ings, its ownership rate can decline even as total holdings increase.
Decreasing numbersGuns also can be destroyed, corrode beyond repair, or become permanently broken or disabled. The form of attrition or wastage that is easiest to document is formal disarmament and destruction supervised by governments or interna-tional organizations. This can be signifi-cant for country totals and must be taken into account when estimating civilian ownership (Small Arms Survey, 2009, pp. 158–91). Many other forms of attrition cannot be estimated directly, although attempts have been made using assumed attrition rates.4 Most problematically, weapons can be tempo-rarily removed from circulation without being destroyed. Firearms seized by the customs authorities or police, for exam-ple, may be destroyed, but might also be returned to their owners or sold at auctions. The most reliable method for estimating the loss of firearms appears to be surveying for comprehensive levels of gun ownership, which indirectly includes the effects of increasing and reducing numbers.
Data pickingA common fallacy in firearms estimation is preference for one particular estimate when several are available, typically because it seems right or best. This confirmation bias is often justified as conservative estimation, as a synonym for cautious. In practice it can privilege either low or high estimates, depending entirely on individual preferences. Such data picking, typically confirming an
observer’s preferences, is always to be avoided (Karp, 2013, p. 76). The most reliable and verifiable insulation against confirmation bias or data picking is to average as many independent estimates as possible.
The procedures followed to reach the conclusions laid out in this Briefing Paper are described in Box 4.
ConclusionMuch has been learned during the past decade about the global distribution of civilian firearms. It is possible to say with greater authority and accuracy how many guns people have in each country. The relative ranking of countries is known with greater certainty. It is clear that global civilian holdings are growing, with much, but not all, of the increase attributable to rising ownership in the United States.
The greater willingness and capabil-ity of governments to share details about civilian gun ownership in their respective territories is a vital force in this rising tide of knowledge. But registration data remains just part of the picture. With roughly 100 million civilian firearms reported as reg-istered out of some 857 million believed to exist, registration data accounts for only some 12 per cent of the global total. This gap reflects the unwillingness or inability of many governments to release registration data, and the lack of informa-tion on countries and territories where comprehensive registration is not legally required. Similarly, the most comprehen-sive surveys of civilian gun ownership also have their caveats, and they can be hardest to find in many of the places where armed violence is worst and they are needed most. These problems make estimation a natural and inevitable part of any effort to determine country or global totals.
While estimations will remain an essential element of civilian firearms
data, all global and country estimates must be used with respect for their limi-tations. Even the most useful estimates must often trade precision for honesty about data and methods, relying on pro-cedures that consider alternatives and acknowledge the truths that lie between the highs and lows (Kent, 1964). With much of civilian ownership concealed or hard to identify, gun ownership numbers can only approximate reality or reveal only part of it. They should therefore always be used with caution.
notes1 Each of the three Small Arms Survey fire-
arms data sets covers a different number of states and territories, depending on the unit of analysis and data availability. Civilian data covers 230 states and autono-mous territories. Law enforcement data was available for 230 states and autono-mous territories. Military firearms are presented for 177 states with formal military forces.
2 In most countries, civilian ownership of small arms and light weapons is limited to firearms, usually meaning ‘any portable barreled weapon that expels, is designed to expel or may be readily converted to expel a shot, bullet or projectile by the action of an explosive’ (UNGA, 2001, art. 3(a)). This Briefing Paper, however, defines firearms in accordance with the lists of ‘small arms’ contained in the Inter-national Tracing Instrument (UNGA, 2005, para. 4 (a)). Therefore, certain light weap-ons fitting the above definition of a fire-arm, such as heavy machine guns, are not included in country totals for civilian firearms. However, every country, and sometimes different data sources, may use definitions of their own, reflecting domestic laws, specific survey questions, and interpretations by experts, who are free to use definitions of their own. Due to these idiosyncratic national reporting procedures and definitions, firearms that are classified as light weapons under the International Tracing Instrument might be included in some country totals.
3 In the United States, for example, civilian ownership of machine guns is legal under Class 3 licences (Capps, 2014). Legal or widespread civilian ownership of fully automatic rifles is seen in a few other countries, such as Afghanistan, Iraq, Somalia, and Yemen (Root, 2013; Small Arms Survey, 2012, p. 313). In Switzerland, military reservists may keep their assault rifles (Sturmgewehre), but only if they have been converted to semi-automatic fire (Bundesrat, 2018, art. 11.3). Some countries are becoming more restrictive. In March 2018 the Norwegian Parliament agreed to end the legal owner-ship of semi-automatic rifles in Norway (Ljung, 2018).
4 See, for example, Azrael et al. (2017).
Estimation will remain an essential element of civilian firearms data, but all estimates must be used with respect for their limits.”

Civilian-held Firearms Numbers 11
referencesAjdacic-Gross, Vladeta, et al. 2006. ‘Changing
Times: A Longitudinal Analysis of Interna-tional Firearms Suicide Data.’ American Journal of Public Health, Vol. 96, No. 10, pp. 1752–55.
—. 2010. ‘Firearm Suicides and Availability of Firearms: The Swiss Experience.’ European Psychiatry, Vol. 25, No. 7, pp. 432–34.
Ajitesh, Pal and Hemanta Kumar Pratihari. 2014. ‘Examination of Some Country Made Smooth Bore Firearms.’ Journal of Forensic Science & Criminology, Vol. 2, No. 5, pp. 1–6.
Alvazzi del Frate, Anna and Irene Pavesi. 2014. Firearms Suicides. Research Note No. 44. Geneva: Small Arms Survey. August.
ATF (United States Bureau of Alcohol, Tobacco, Firearms and Explosives). 2017a. Annual Firearms Manufacturing and Export Report: Year 2016 Final* Manufactured Firearms Distributed into Commerce. Washington, DC: ATF.
—. 2017b. Firearms Commerce in the United States: Annual Statistical Update 2017. Washington, DC: ATF.
Atwood, David, Anne-Kathrin Glatz, and Robert Muggah. 2006. Demanding Attention: Addressing the Dynamics of Small Arms Demand. Occasional Paper No. 18. Geneva: Small Arms Survey.
Azrael, Deborah, et al. 2017. ‘The Stock and Flow of U.S. Firearms: Results from the 2015 National Firearms Survey.’ Russell Sage Foundation Journal of the Social Sciences, Vol. 3, No. 5, pp. 38–57.
Bauer, Jurgen. 2013. The US Firearms Industry: Production and Supply. Working Paper No. 14. Geneva: Small Arms Survey.
BBC (British Broadcasting Corporation). 2016. ‘Airgun Owners Given Six Months to Licence Weapons.’ BBC News. 26 February.
Berman, Eric G. 2011. Craft Production of Small Arms. Research Note No. 3. Geneva: Small Arms Survey.
Bundesrat. 2018. SR 514.10 Verordnung über die persönliche Ausrüstung der Armeeangehörigen (VPAA). Bern: Schweizerische Bundesrat. 5 December 2003, updated 1 January 2018.
Capps, Alex. ‘Machine Guns Are Legal: A Prac-tical Guide to Full Auto.’ The Firearms Blog. 21 May.
Economist. 2016. ‘The West Bank: Deadly DIY.’ 7 April.
European Commission. 2013. Flash Eurobarometer 383: Firearms in the European Union. Brussels: European Commission.
Gould, Chandré and Guy Lamb. 2004. Hide and Seek: Taking Account of Small Arms in Southern Africa. Pretoria: Institute for Security Studies.
Home Office. 2015. National Statistics: Firearm and Shotgun Certificates in England and Wales Financial Year Ending March 2015. London: Home Office. 24 September.
Horwitz, Sari. 2014. ‘“Unfinished Receivers,” a Gun Part that Is Sold Separately, Lets Some Get around the Law.’ Washington Post. 13 May.
Karp, Aaron. 2013. ‘The Global Geography of Small Arms Numbers.’ In Peter Batchelor and Kei Kenkel, eds. Controlling Small
Arms: Consolidation, Innovation and Relevance in Research and Policy. Abingdon: Routledge.
—. 2015. Arming against Itself: Firearms and the Transformation of India. Unpublished manuscript.
—. 2017. ‘Putting Guns Away for Good: Can Japan Eliminate Civilian Firearms?’ Asia & the Pacific Policy Society. 24 April.
Kent, Sherman. 1964. ‘Words of Estimative Probability.’ Studies in Intelligence, Vol. 8, No. 4, pp. 49–65.
Ljung, Anders. 2018. ‘Norska jägare förlorar halvautomater.’ Jakt & Jägare. 13 March.
Masters, Jonathan. 2016. ‘How Do U.S. Gun Laws Compare to Other Countries?’ PBS Newshour. 13 June.
NSSF (National Shooting Sports Foundation). 2015. 2015 Edition: Firearms Production in the United States with Firearm Import and Export Data. Newtown: NSSF.
—. 2018. Industry Reference Guide: A Compilation of Firearm & Ammunition Industry Data. Newtown: NSSF.
RCMP (Royal Canadian Mounted Police). 2017. ‘Coming into Force of Quebec’s Long-gun Registry.’
Root, Tik. 2013. ‘Gun Control, Yemen-style.’ The Atlantic. 12 February.
Small Arms Survey. 2007. Small Arms Survey 2007: Guns and the City. Cambridge: Cambridge University Press.
—. 2009. Small Arms Survey 2009: Shadows of War. Cambridge: Cambridge University Press.
—. 2010. Small Arms Survey 2010: Gangs, Groups, and Guns. Cambridge: Cambridge University Press.
—. 2012. Small Arms Survey 2012: Moving Targets. Cambridge: Cambridge University Press.
—. 2018. Global Firearms Holdings Database: Civilians. Geneva: Small Arms Survey.
UNGA (United Nations General Assembly). 2001. Protocol against the Illicit Manufacturing of and Trafficking in Firearms, Their Parts and Components and Ammunition, Sup-plementing the United Nations Convention against Transnational Organized Crime (‘UN Firearms Protocol’). A/RES/55/255 of 8 June.
—. 2005. International Instrument to Enable States to Identify and Trace, in a Timely and Reliable Manner, Illicit Small Arms and Light Weapons (‘International Tracing Instrument’). Adopted 8 December. A/60/88 of 27 June (Annex).
UNODC (United Nations Office on Drugs and Crime). 2015. UNODC Study on Firearms 2015. Vienna: UNODC.
UNREC (United Nations Regional Centre for Peace and Disarmament in Africa). 2016. Assessment Survey on Small Arms in the Sahel Region and Neighbouring Countries. Lomé: UNREC. February.
Urbatsch, Robert. 2018. ‘Gun-shy: Refusal to Answer Questions about Firearm Owner-ship.’ Social Science Journal, Vol. 55.
Wellford, Charles R., John V. Pepper, and Carol V. Petrie, eds. 2005. Firearms and Violence: A Critical Review. Washington, DC: National Academies Press.

About thesmall arms survey
The Small Arms Survey is a global centre of excellence whose mandate is to generate impartial, evidence-based, and policy-relevant knowledge on all aspects of small arms and armed violence. It is the principal international source of expertise, information, and analysis on small arms and armed violence issues, and acts as a resource for governments, policy-makers, researchers, and civil society. It is located in Geneva, Switzerland, and is a project of the Graduate Institute of Inter-national and Development Studies.
The Survey has an international staff with expertise in security studies, political science, law, economics, development studies, sociology, and criminology, and collaborates with a network of researchers, partner institutions, non-governmental organizations, and governments in more than 50 countries.
For more information, please visit: www.smallarmssurvey.org.
Contact details
Small Arms SurveyMaison de la PaixChemin Eugène-Rigot 2E1202 Geneva Switzerland
t +41 22 908 5777
f +41 22 732 2738
Follow the Small Arms Survey
www.facebook.com/SmallArmsSurvey
www.twitter.com/SmallArmsSurvey
www.smallarmssurvey.org/multimedia
A publication of the Small Arms Survey, with support from the
Department of Foreign Affairs and Trade of Australia