Embed Size (px)
Citation preview

Final document to be edited for publication. Not for citation.
3 Estimating Health Impacts
3.1 This chapter presents estimates for health impacts of indoor air pollution in Guatemala. The purpose of this estimate is to provide an indication of the potential severity of this problem in Guatemala as a decision-making tool for policy-makers. Given the lack of a dose-response function between the illnesses associated with indoor air pollution and levels of pollution, this chapter draws upon the international epidemiological literature for these estimates. Specifically it focuses on estimating health impacts of traditional fuel use in the rural areas of the Guatemalan highlands, where the impact is potentially most severe. In the northwest and southwest regions of Guatemala, approximately two-thirds of households use wood fires, without chimneys, for heating and cooking. The associated levels of PM10 inside these houses are in excess of 1000 micrograms per cubic meter. The estimates focus on the reduction in morbidity and mortality for children under 5 years living in households that use open fires, associated with ALRI that can be attributed to indoor air pollution, if PM10 levels are lowered to below 200 micrograms per cubic meter, a level that, in theory, could be achieved by a well-maintained improved stove. 3.2 The following sections provide a brief description of the scope of this chapter; examine the characteristics of IAP in Guatemalan highlands that are used in estimating the health impacts of IAP; and describe in greater detail the methodology used to estimate the health impacts of IAP for the Guatemalan highlands, through transferring to Guatemala the odds ratios found in the epidemiological literature linking IAP and ALRI (Smith et al. 2000, Ezzati and Kammen 2001a).10
Scope of the Study
3.3 Target Endpoint: Acute Lower Respiratory Infection (ALRI). For practical reasons, this chapter focuses on the effects of indoor air pollution on ALRI. According to Von Schirnding et al. (2001) “there is consistent evidence that exposure to biomass smoke increases the risk of a range of common and serious diseases of both children and
10 See Smith et al (2000) for a complete review of the health impacts of indoor air pollution on acute respiratory infections in children.
33

34 Health Impacts of Traditional Fuel Use in Guatemala
adults. Chief amongst these are acute lower respiratory infections (ALRI) in childhood, particularly pneumonia….” 3.4 It should, however, be noted that the health impacts of indoor air pollution are not limited to ALRI. Smith (2000) divides the evidence on the health effects of indoor air pollution into three classes (strong, moderate, and suggestive), as follows. He cites strong evidence for (a) acute respiratory infection (ARI) in children under 5 years; (b) chronic obstructive pulmonary disease (COPD) in women; and (c) lung cancer in women. The epidemiological literature linking indoor air pollution to COPD in women is limited in comparison to similar literature linking indoor air pollution to ARI in children. Lung cancer in women is a well demonstrated outcome of cooking with open coal stoves in China. However, coal is not commonly used as cooking fuel in the Guatemalan highlands. Based on these observations, this chapter estimates health impacts only for ARI in children under 5 years. Because health effects in women are ignored, these estimates constitute a lower bound to the health benefits of reducing indoor air pollution. 3.5 Smith classifies as moderate the evidence regarding a relationship between solid-fuel use and other health outcomes such as cataracts and blindness, tuberculosis, asthma and adverse pregnancy outcomes. He cites evidence of indoor air pollution causing heart disease in women as only suggestive because there do not appear to be any studies of it in developing countries related to indoor biomass use. 3.6 ARI is among the class of disease risks with strong evidence of a relationship with IAP. The definition used for ARI (Smith et al. 2000) is that “it comprises a set of clinical conditions of various aetiologies and severities that are generally divided into two main forms: upper respiratory tract infections (URI) and lower respiratory tract infections (ALRI). [. . . .] WHO defines URI to include any combination of the following symptoms: cough with or without fever, blocked or runny nose, sore throat, and/or ear discharge.[. . . .]ALRI includes severe ARI involving infection of the lungs, with pneumonia being the most serious form.[. . . .]Clinical signs of ALRI include any of the above symptoms of URI with the addition of rapid breathing and/or chest indrawing and/or stridor.” 3.7 Target Age Group: Children Under 5 Years of Age. This chapter concentrates on children under 5 years, as they are at highest risk of contracting acute respiratory diseases thought to be linked to indoor air pollution. ARI is the most common cause of illness in children and the leading cause of death in children under age 5 in the world. As noted by Smith (2000), “Among children under five years of age, three to five million deaths annually have been attributed to ARI, of which 75% are from pneumonia.” In addition, in houses where biomass fuels are used, children under 5 are likely to be more exposed to air pollution than older children. Children under 5 spend more time at home with their mothers, and thus receive higher exposures than older children, who may spend much time away from the household. It is also the case that the epidemiological literature relating IAP to respiratory illness is larger for children under 5 than for other age groups. Due to these factors, this chapter focuses entirely on the effects of IAP on children under 5 years.
Estimating Health Impacts 35
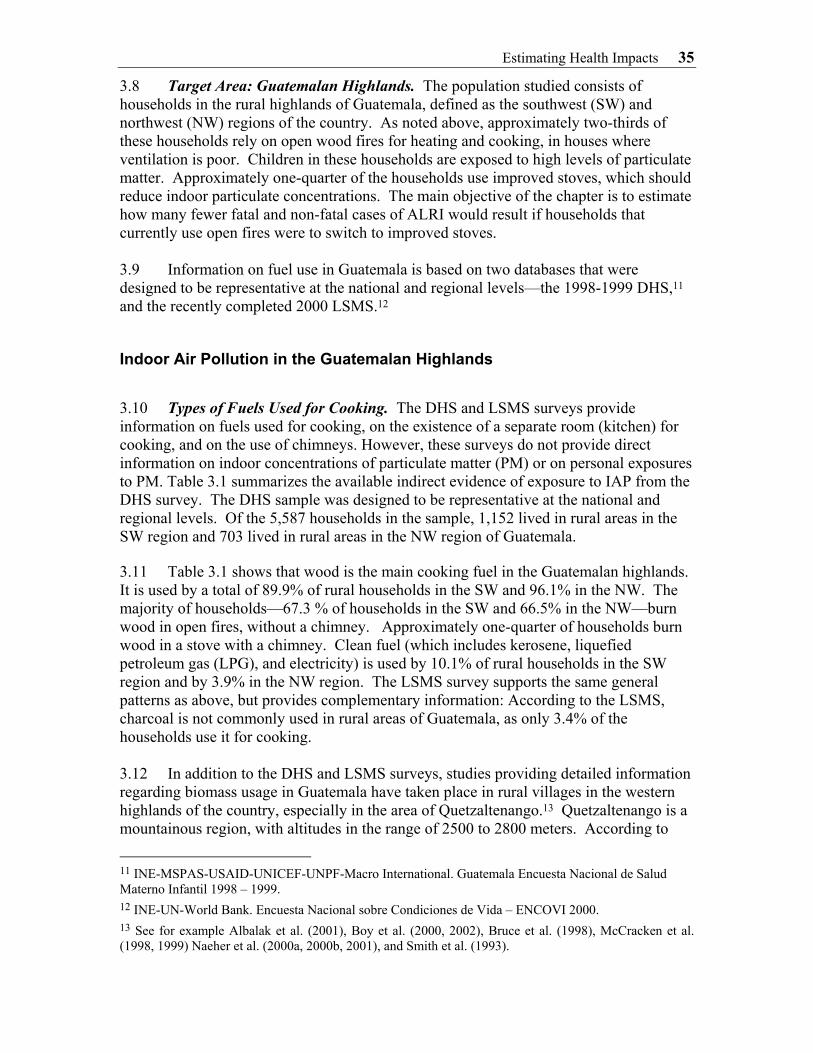
3.8 Target Area: Guatemalan Highlands. The population studied consists of households in the rural highlands of Guatemala, defined as the southwest (SW) and northwest (NW) regions of the country. As noted above, approximately two-thirds of these households rely on open wood fires for heating and cooking, in houses where ventilation is poor. Children in these households are exposed to high levels of particulate matter. Approximately one-quarter of the households use improved stoves, which should reduce indoor particulate concentrations. The main objective of the chapter is to estimate how many fewer fatal and non-fatal cases of ALRI would result if households that currently use open fires were to switch to improved stoves. 3.9 Information on fuel use in Guatemala is based on two databases that were designed to be representative at the national and regional levels—the 1998-1999 DHS,11 and the recently completed 2000 LSMS.12
Indoor Air Pollution in the Guatemalan Highlands
3.10 Types of Fuels Used for Cooking. The DHS and LSMS surveys provide information on fuels used for cooking, on the existence of a separate room (kitchen) for cooking, and on the use of chimneys. However, these surveys do not provide direct information on indoor concentrations of particulate matter (PM) or on personal exposures to PM. Table 3.1 summarizes the available indirect evidence of exposure to IAP from the DHS survey. The DHS sample was designed to be representative at the national and regional levels. Of the 5,587 households in the sample, 1,152 lived in rural areas in the SW region and 703 lived in rural areas in the NW region of Guatemala. 3.11 Table 3.1 shows that wood is the main cooking fuel in the Guatemalan highlands. It is used by a total of 89.9% of rural households in the SW and 96.1% in the NW. The majority of households—67.3 % of households in the SW and 66.5% in the NW—burn wood in open fires, without a chimney. Approximately one-quarter of households burn wood in a stove with a chimney. Clean fuel (which includes kerosene, liquefied petroleum gas (LPG), and electricity) is used by 10.1% of rural households in the SW region and by 3.9% in the NW region. The LSMS survey supports the same general patterns as above, but provides complementary information: According to the LSMS, charcoal is not commonly used in rural areas of Guatemala, as only 3.4% of the households use it for cooking. 3.12 In addition to the DHS and LSMS surveys, studies providing detailed information regarding biomass usage in Guatemala have taken place in rural villages in the western highlands of the country, especially in the area of Quetzaltenango.13 Quetzaltenango is a mountainous region, with altitudes in the range of 2500 to 2800 meters. According to
11 INE-MSPAS-USAID-UNICEF-UNPF-Macro International. Guatemala Encuesta Nacional de Salud Materno Infantil 1998 – 1999. 12 INE-UN-World Bank. Encuesta Nacional sobre Condiciones de Vida – ENCOVI 2000. 13 See for example Albalak et al. (2001), Boy et al. (2000, 2002), Bruce et al. (1998), McCracken et al. (1998, 1999) Naeher et al. (2000a, 2000b, 2001), and Smith et al. (1993).

36 Health Impacts of Traditional Fuel Use in Guatemala
McCracken et al. (1999), a survey in Los Romeros, Quetzaltenango indicated that “70% of the households have only open fires for cooking, 25% have some form of improved wood-burning stove, and 5% have gas stoves.”
Table 3.1. Percent of Rural Households Using Fuelwood, Conditional on House Characteristics.14
South West North WestType Fuel Separate Kitchen Chimney in KitchenFuelwood NO NO 12.1 18.1Fuelwood YES NO 55.3 48.4Fuelwood YES YES 22.6 29.7Clean Fuel *** *** 10.1 3.9
100 100
3.13 Other information on cooking fuel use for the area can be found in the study by Albalak et al. (2001), which states that “as of September 1998, 49% of the 867 households in La Victoria [Quetzaltenango] used a traditional open fire wood cookstove for all their cooking needs. Thirty-one percent used the plancha exclusively, and 10% used an LPG/open fire combination.” These results are broadly consistent with the DHS survey results reported in Table 3.1. 3.14 Indoor Concentrations of PM10. Ambient concentrations of particulate matter inside houses differ depending on the types of cooking fuel used, whether it is burned in a stove or open fire and whether a chimney is used. Table 3.2 summarizes the available information on ambient IAP concentrations in Guatemalan highlands, measured as particulate matter monitored in the kitchen area. The study by Naeher et al. (2000b), which was conducted during the fall, selected three houses in which open fires were used for cooking and measured indoor PM concentrations (PM2.5, PM10 and TSP) in these houses (a) when an open fire was used; (b) when the open fire was replaced by a plancha; (c) when the open fire was replaced by a gas stove. The study attached personal monitors to the mother and child for a period of 12 hours. As new planchas were introduced solely for the study, the results cannot be considered as representative of normal operating conditions. 3.15 The study by Albalak et al. (2001) monitored 30 households 6 times during the year (between December and July), with a third of the households using each fuel type (gas/plancha/open fire). The authors noted that the planchas were in relatively good condition, but not new, nor did they appear to have been planchas mejoradas.15 Naeher et al. (1999) carried out a cross-sectional study in which measurements of PM2.5 are reported for both planchas (in situ) and open fires. The study by McCracken et al. (1999) measured 24-hour average PM2.5 concentrations in 45 homes over a period of 5 months (6 observations per house), with the sample evenly divided between households using an open fire for cooking, households using natural gas, and households using an improved
14 Information on cooking fuel type, and existence of kitchen and chimney in Guatemalan households in 1998-99 DHS (taken from Torres (2000). 15 A plancha mejorada has an improved combustion chamber.

Estimating Health Impacts 37
plancha (plancha mejorada). Smith et al. (1993) measured concentrations inside 60 homes, 23 of which used open fires, 25 of which used planchas, and 12 of which used LPG for cooking. 3.16 In all the studies in Table 3.2, kitchen PM concentrations (24-hour average) were significantly higher when an open wood fire was used for cooking than when a plancha was used. Average PM10 concentrations reported by Smith et al. (1993) with an open wood fire were 1210 µg/m3. This is much higher than the concentration of 717.1 µg/m3 reported by Naeher et al. (2000b). However, the Naeher study was conducted in the fall, when temperatures are higher than in winter months and home heating requirements may be lower. Four of the studies in Table 3.2 reported PM2.5 concentrations. Albalak et al. (2001) reported the highest average 24-hour concentrations, 1930 µg/m3. McCracken et al. (1999) reported an average 24-hour PM2.5 concentration of 1102 µg/m3. The figures in the two studies by Naeher et al. are lower than for the other studies. 3.17 By averaging the PM2.5 concentrations in Table 3.2, weighting each by the number of observations reported in the study, the mean concentration is 1325 µg/m3. Using the ratio of PM10 to PM2.5 reported by Naeher et al. (2000b), i.e., 717.1/527.9, a 24-hour average PM10 concentration of approximately 1800 µg/m3 is obtained. 3.18 Ambient levels of PM when a plancha is used depend on how the stove is maintained. Table 3.2 shows that concentrations of PM2.5 and PM10 below 200 µg/m3 can be achieved with a well-maintained plancha. Under actual conditions of use, the emissions from a plancha may be considerably higher. The study by Smith el al., (1993) indicates that 24-hour concentrations of 520 µg/m3 of PM10 can be achieved for a plancha in situ. Using the ratio of PM2.5 to PM10 (186.3/96.5) reported by Naeher et al. (2000b), the PM2.5 concentration associated with the plancha in situ in the study by Smith el al. (1993) would be approximately 1004 µg/m3. 3.19 Individual Exposure Estimation. Predicting cases of ALRI associated with IAP requires estimates of personal exposure to PM10 for children in the Guatemalan highlands. For the purposes of this study, the challenge inherent in making such predictions on the basis of the average kitchen concentrations reported in Table 3.2, will be in transposing the reported values to the context of the Guatemalan highlands. One approach to address this challenge is through the ratio of a child’s exposure to average kitchen concentrations in households with open fires, as reported in Naeher et al. (2000b). This ratio, 0.53, when applied to the estimated 24-hour PM10 kitchen concentration of 1800 µg/m3 PM10 in households with open fires, suggests a personal PM10 exposure of 954 µg/m3 (24-hour average). The Naeher et al. (2000b) results are, however, based on only two observations.
3.20 Ezzati et al. (2000) in their study of exposure to PM10 in villages in Kenya suggest that average indoor concentrations are a good proxy for the personal exposure of children aged 0-5. This would suggest a personal PM10 exposure for children 0 to 5 in homes with open fires of 1800 µg/m3 (24 hour average). In view of the fact that children in Kenya are not carried on their mother’s back, as is the case in Guatemala, the estimate of exposure levels in Guatemala could be higher.

44
Hea
lth Im
pact
s of T
radi
tiona
l Fue
l Use
in G
uate
mal
a T
able
3.2
. Per
sona
l and
Dai
ly A
vera
ge K
itche
n M
easu
rem
ents
of P
artic
ulat
e M
atte
r in
the
Gua
tem
alan
Hig
hlan
ds
DA
ILY
AV
ER
AG
E C
ON
CE
NT
RA
TIO
NS
IN K
ITC
HE
N A
RE
A
PER
SON
AL
MO
NIT
OR
ING
Stov
e co
nditi
on
D
ata
for
PM2.
5 (N
aehe
r et
al.
2000
b)
[A
] µg
/m3
Dat
a fo
r PM
10
(Nae
her
et a
l. 20
00b)
]
[B
] µg
/m3
Dat
a fo
r PM
2.5
(Alb
alak
et
al. 2
001)
µg
/m3 *
D
ata
for
PM2.
5 (N
aehe
r et
al.
1999
) µg
/m3
Dat
a fo
r
PM2.
5 (M
cCra
cken
et
al.
1999
) µg
/m3
Dat
a fo
r PM
10
(S
mith
et
al. 1
993)
µg
/m3
Dat
a fo
r PM
2.5
(Nae
her
et
al.2
000b
) µg
/m3 C
hild
Dat
a fo
r PM
2.5
(Nae
her
et
al.2
000b
) µg
/m3 M
othe
r
Bac
kgro
und
Ave
rage
St
d. d
ev.
Sam
ple
size
56.2
17
.6
9
183.
9 13
4.6
8
174.
1 11
3 9
LPG
Sto
ve
Ave
rage
St
d. d
ev.
Sam
ple
size
56.8
19
9
210.
2 10
0.3
9
217.
7 88
.1
9
148.
568
.5
3
135.
6 11
7 3
Com
al L
PG (
real
con
ditio
ns w
ithop
en fi
re)
Ave
rage
St
d. d
ev.
Sam
ple
size
790
654
60
Ave
rage
18
0
Std.
dev
.
10
7
Plan
cha
Mej
orad
a
sam
ple
size
60
Ave
rage
96
.5
186.
3 33
0
169.
7 25
7.2
Std.
dev
. 66
.5
89.5
22
0
153.
6 75
.4
Plan
cha
(in
goo
d co
nditi
ons)
sam
ple
size
9
9 59
3 3
Ave
rage
152
52
0
St
d. d
ev.
12
0
572
Plan
cha
(
in si
tu)
sam
ple
size
26
25
A
vera
ge
527.
971
7.1
1930
868
1102
.012
1027
9.1
481.
2St
d.de
v.
24
8.5
284.
612
8052
060
672
619
.519
4.4
Ope
n fir
e
sam
ple
size
99
5817
6023
23
* A
lbal
ak e
t a. (
2001
) ref
er to
the
size
frac
tion
of p
artic
les m
easu
red
as P
M3.
5 bec
ause
the
SKC
mon
itors
use
d in
the
stud
y w
ere
run
at a
flow
rate
of 2
L/m
inut
e to
av
oid
satu
ratin
g th
e fil
ters
. Th
is is
the
sam
e flo
w ra
te a
t whi
ch th
e m
onito
rs w
ere
run
in M
cCra
cken
et a
l. (1
999)
, who
refe
r to
mea
surin
g PM
2.5.
We
ther
efor
e re
fer t
o th
e A
lbal
ak e
t al.
mea
sure
men
ts a
s mea
sure
men
ts o
f PM
2.5.

Estimating Health Impacts 45
Estimation of Health Impacts of Indoor Air Pollution
3.21 The Literature Relating IAP to ALRI. To estimate the health impacts of exposure to indoor air pollution requires dose-response (or concentration-response) information from the epidemiological literature relating ALRI to exposure to IAP. A recent review article by Smith et al. (2000) summarizes 13 studies conducted in developing countries that relate indoor air pollution to acute lower respiratory infections in children.16 Three of the studies examine the impact of IAP on mortality. Others examine the impact of IAP on morbidity. 3.22 The main difficulties in establishing a relationship between ALRI and IAP lie in measuring exposure to indoor air pollution and in controlling for confounding factors, i.e., variables that are correlated with the use of biomass fuels which may also contribute to ALRI. In all but one of the studies reviewed by Smith et al. (2000) exposure to IAP is measured by a qualitative index; for example, an indicator variable = 1 if biomass fuel is used for cooking and/or an indicator variable = 1 if the child is carried on the mother’s back during cooking. The only study conducted in a developing country that has carefully attempted to measure indoor air concentrations and personal exposures is Ezzati and Kammen (2001a), which is discussed in more detail below. 3.23 Controlling for confounding variables is especially important in IAP studies. The use of biomass for cooking is likely to be inversely correlated with income, access to health care, and good nutrition, all of which could affect the incidence of ALRI. A study that fails to control for these factors may simply demonstrate that poor children are more likely to contract (and die from) ALRI than children who are better off. Five of the studies reviewed by Smith et al. (2000) make no attempt to adjust for confounders. Other studies attempt (variously) to control for number of siblings, crowding, birth weight and economic status. As Table 5 from Smith et al. (2000) indicates, the studies with the largest odds ratios are those that fail to control for confounders. 3.24 The World Health Organization (2002) in computing the global burden of disease associated with indoor air pollution relied on an odds ratio for ALRI morbidity and mortality associated with IAP of 2.3 [95% CI = 1.9, 2.7]. This was based on a meta-analysis of the studies reported in Smith et al. (2000). The assumption that an odds ratio based primarily on studies of the impact of IAP on morbidity also applies to mortality is not without limitations. In particular, it assumes that IAP has no impact on the case fatality rate associated with ALRI. There is, however, an insufficient number of case-fatality studies in the literature to permit estimation of an odds ratio for mortality. 3.25 In this study, calculation of the impacts of exposure to IAP in the Guatemalan highlands is based solely on the work by Ezzati and Kammen (2001a). This is the only study to date to associate incidence of respiratory illness to personal measurements of exposure to PM10. The study was carried out in the Laikipia District of central Kenya. 16 Table 5 from Smith et al. (2000) summarizing the studies reviewed is reproduced in the Appendix.

46 Health Impacts of Traditional Fuel Use in Guatemala
This is a mountainous region, whose rate of under-5 child mortality is comparable to that in the Guatemalan highlands.17 Members of 55 households were followed for two years, receiving biweekly and then weekly visits from a nurse to diagnose cases of ARI. A measure of personal exposure to PM10 was constructed for each household member, based on a sample of measurements inside each house, combined with information on the length of time spent in various microenvironments by each household member. 3.26 Table 3.3 summarizes the odds ratios reported in Ezzati and Kammen for logistic regression models to explain the incidence of ARI and ALRI among children under age 5. The distribution of the N=93 children, according to their category of exposure is as follows: 7 children with an average daily exposure <200 µg/m3; 20 children between 200-500 µg/m3, 20 children between 500-1,000 µg/m3; 21 children between 1,000-2,000 µg/m3; 20 children between 2,000-3500 µg/m3; and 5 children with an exposure >3,500 µg/m3. As indicated in Table 3.3, the models control for household size and village type, as well as for age and sex. 3.27 Focusing on ALRI, the odds ratio for exposures between 1,000 and 2,000 µg/m3 is significantly different from zero at the .009 level; however, the odds ratios for lower exposures are not significant at conventional levels. The small number of controls in the reference exposure category (<200 µg/m3), together with the lack of statistical significance of exposure between 200 and 500 µg/m3 suggest that combining the lowest two categories might produce different results.18
Calculation of ALRI associated with IAP in Guatemala
3.28 As indicated in the previous section, this study assumes that children in households using open fires fall in the exposure range of 1000-2000 µg/m3, which is associated with an odds ratio of 2.33 for ALRI [95% CI: 1.23, 4.38], compared with exposures of < 200 µg/m3. Therefore this odds ratio was used to calculate cases of excess morbidity and mortality associated with ALRI for children in households where open fires are used. The estimates of excess morbidity and mortality below represent the number of fewer cases of ALRI that would be achieved if exposure levels for these children were reduced below 200 µg/m3, a level that, in theory, could be achieved by a well-maintained plancha or by reliance on a gas stove for heating and cooking. To the extent that there are benefits from reducing the exposures of children in households with planchas in situ who fall in the exposure range between 1,000 µg/m3 of PM10 and 200 µg/m3, these calculations understate the burden of ALRI associated with indoor air pollution in the Guatemalan highlands.
17 According the 1993 DHS survey, the under-5 mortality rate in the central region of Kenya is 14.7 per thousand. This rate is comparable to those reported in Table 4 below for Guatemala. 18 In particular, it might lower the odds ratio for the 1,000-2,000µg/m3 category relative to exposure <500 µg/m3.

Estim
atin
g H
ealth
Impa
cts
47
T
able
3.3
: Adj
uste
d O
dds R
atio
s for
AR
I and
AL
RI E
stim
ated
with
a L
ogis
tic M
odel
(Ext
ract
ed fr
om E
zzat
i and
Kam
men
20
01a)
Fact
or
Age
<5
year
s
A
RI (
n=93
)
AL
RI (
n=93
)
Odd
s rat
io (9
5%C
l) p
Odd
s rat
io (9
5% )
p
PM e
xpos
ure
(µg/
m3 )
<200
1.00
-1.
00-
200-
500
2.42
(1.5
3-3.
83)
0.00
1*
1.48
(0.8
3-2.
63)
0.18
* 50
0-10
00
2.15
(1.3
0-3.
56)
0.00
3*
1.40
(0.7
4-2.
67)
0.30
* 10
00-2
000
4.30
(2.6
3-7.
04)
0.00
1*
2.33
(1.2
3-4.
38)
0.00
9*
2000
-350
0 4.
72 (2
.82-
7.88
)
0.
001*
1.
93 (0
.99-
3.78
)
0.05
* 20
00-4
000
--
--
>350
0 6.
73 (3
.75-
12.0
6)
0.00
1*
2.93
(1.3
4-6.
39)
0.
007*
40
00-7
000
--
--
>700
0-
--
-Fe
mal
e Se
x 0.
99 (0
.83-
1.17
) 0.
88
0.84
(0.6
5-1.
10)
0.21
A
ge+
0.88
(0.8
3-0.
94)
0.00
1 0.
76 (0
.70-
0.84
) 0.
001
Smok
ing
- -
-
-V
illag
e T
ype
++
1.29
(0.9
9-1.
67)
0.06
1.
18 (0
.79-
1.77
) 0.
41
Num
ber
of
peop
le in
hou
se
+
1.00
(0.9
5-1.
05)
0.99
0.
98 (0
.91-
1.06
) 0.
70
48 Health Impacts of Traditional Fuel Use in Guatemala
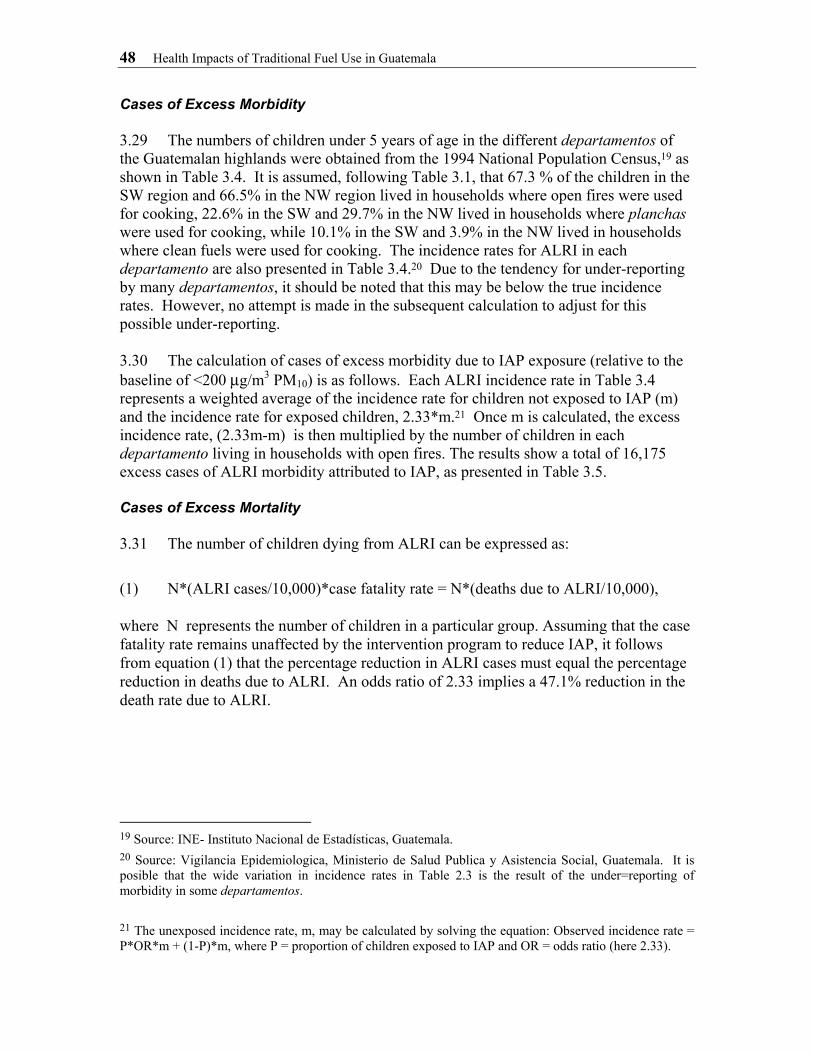
Cases of Excess Morbidity 3.29 The numbers of children under 5 years of age in the different departamentos of the Guatemalan highlands were obtained from the 1994 National Population Census,19 as shown in Table 3.4. It is assumed, following Table 3.1, that 67.3 % of the children in the SW region and 66.5% in the NW region lived in households where open fires were used for cooking, 22.6% in the SW and 29.7% in the NW lived in households where planchas were used for cooking, while 10.1% in the SW and 3.9% in the NW lived in households where clean fuels were used for cooking. The incidence rates for ALRI in each departamento are also presented in Table 3.4.20 Due to the tendency for under-reporting by many departamentos, it should be noted that this may be below the true incidence rates. However, no attempt is made in the subsequent calculation to adjust for this possible under-reporting. 3.30 The calculation of cases of excess morbidity due to IAP exposure (relative to the baseline of <200 µg/m3 PM10) is as follows. Each ALRI incidence rate in Table 3.4 represents a weighted average of the incidence rate for children not exposed to IAP (m) and the incidence rate for exposed children, 2.33*m.21 Once m is calculated, the excess incidence rate, (2.33m-m) is then multiplied by the number of children in each departamento living in households with open fires. The results show a total of 16,175 excess cases of ALRI morbidity attributed to IAP, as presented in Table 3.5. Cases of Excess Mortality 3.31 The number of children dying from ALRI can be expressed as: (1) N*(ALRI cases/10,000)*case fatality rate = N*(deaths due to ALRI/10,000), where N represents the number of children in a particular group. Assuming that the case fatality rate remains unaffected by the intervention program to reduce IAP, it follows from equation (1) that the percentage reduction in ALRI cases must equal the percentage reduction in deaths due to ALRI. An odds ratio of 2.33 implies a 47.1% reduction in the death rate due to ALRI.
19 Source: INE- Instituto Nacional de Estadísticas, Guatemala. 20 Source: Vigilancia Epidemiologica, Ministerio de Salud Publica y Asistencia Social, Guatemala. It is posible that the wide variation in incidence rates in Table 2.3 is the result of the under=reporting of morbidity in some departamentos. 21 The unexposed incidence rate, m, may be calculated by solving the equation: Observed incidence rate = P*OR*m + (1-P)*m, where P = proportion of children exposed to IAP and OR = odds ratio (here 2.33).

Estimating Health Impacts 49
Table 3.4: Number of Children under 5 years of age and ALRI incidence rates
.32 Table 3.5 calculates the expected reduction in deaths due to ALRI for each -
RI is
Region Children under 5 years of
age
Number of children in the HIGH exposure
range (Open fire)
Number of children in
the MEDIUM exposure
range (Plancha in
situ)
Number of children in the LOW exposure
range
ALRI rate of incidence (per 10,000
under 5 years old)
% of children in each SW= 67.3% 22.6% 10.1%range of exposure NW= 66.5% 29.7% 3.9%
SOLOLA SW 36,580 24,624 8,255 3,701 1,450
TOTONICAPAN SW 55,810 37,569 12,595 5,646 1,045
QUETZALTENANGO SW 73,502 49,478 16,588 7,436 533
SUCHITEPEQUEZ SW 48,948 32,950 11,047 4,952 876
RETALHULEU SW 30,160 20,302 6,807 3,051 762
SAN MARCOS SW 132,257 89,029 29,848 13,380 989
HUEHUETENANGO NW 136,940 90,999 40,640 5,301 743
QUICHE NW 90,696 60,269 26,916 3,511 696
TOTAL HIGHLAND 604,893 405,219 152,696 46,978
3departamento. The death rate due to ALRI is approximated by multiplying the agespecific, 0-4 mortality rate for each departamento by the percent of deaths due to pneumonia during the first year of life. The age-specific, 0-4 death rate due to ALthen multiplied by the number of children exposed to open fires shown in Table 3.4 to calculate the expected number of children under 5 years in homes with open fires dyingannually from ALRI. For the NW and SW regions combined, this figure is 1,438. The estimated number of excess ALRI mortality cases (relative to a baseline of <200 µg/m3 PM10) is 47.1% of 1,438, or 677 deaths. Figures corresponding to a 95% confidence interval about the odds ratio of 2.33 are also presented in the table.
50 Health Impacts of Traditional Fuel Use in Guatemala
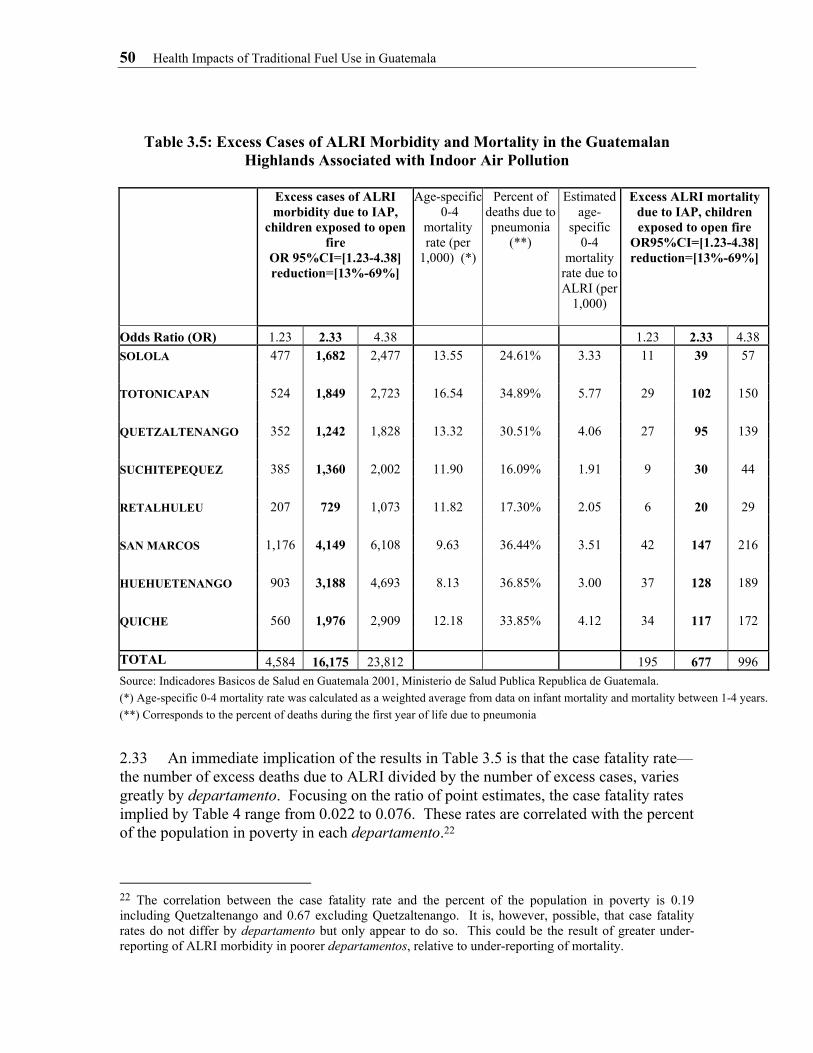
Table 3.5: Excess Cases of ALRI Morbidity and Mortality in the Guatemalan Highlands Associated with Indoor Air Pollution
Excess cases of ALRI
morbidity due to IAP, children exposed to open
fire OR 95%CI=[1.23-4.38] reduction=[13%-69%]
Age-specific 0-4
mortality rate (per
1,000) (*)
Percent of deaths due to pneumonia
(**)
Estimated age-
specific 0-4
mortality rate due to ALRI (per
1,000)
Excess ALRI mortality due to IAP, children exposed to open fire
OR95%CI=[1.23-4.38] reduction=[13%-69%]
Odds Ratio (OR) 1.23 2.33 4.38 1.23 2.33 4.38 SOLOLA 477 1,682 2,477 13.55 24.61% 3.33 11 39 57 TOTONICAPAN 524 1,849 2,723 16.54 34.89% 5.77 29 102 150 QUETZALTENANGO 352 1,242 1,828 13.32 30.51% 4.06 27 95 139 SUCHITEPEQUEZ 385 1,360 2,002 11.90 16.09% 1.91 9 30 44 RETALHULEU 207 729 1,073 11.82 17.30% 2.05 6 20 29 SAN MARCOS 1,176 4,149 6,108 9.63 36.44% 3.51 42 147 216 HUEHUETENANGO 903 3,188 4,693 8.13 36.85% 3.00 37 128 189 QUICHE 560 1,976 2,909 12.18 33.85% 4.12 34 117 172
TOTAL 4,584 16,175 23,812 195 677 996 Source: Indicadores Basicos de Salud en Guatemala 2001, Ministerio de Salud Publica Republica de Guatemala. (*) Age-specific 0-4 mortality rate was calculated as a weighted average from data on infant mortality and mortality between 1-4 years.(**) Corresponds to the percent of deaths during the first year of life due to pneumonia
2.33 An immediate implication of the results in Table 3.5 is that the case fatality rate—the number of excess deaths due to ALRI divided by the number of excess cases, varies greatly by departamento. Focusing on the ratio of point estimates, the case fatality rates implied by Table 4 range from 0.022 to 0.076. These rates are correlated with the percent of the population in poverty in each departamento.22
22 The correlation between the case fatality rate and the percent of the population in poverty is 0.19 including Quetzaltenango and 0.67 excluding Quetzaltenango. It is, however, possible, that case fatality rates do not differ by departamento but only appear to do so. This could be the result of greater under-reporting of ALRI morbidity in poorer departamentos, relative to under-reporting of mortality.

Estimating Health Impacts 51
Conclusions
2.34 The purpose of this chapter has been to estimate the magnitude of health damages to children under age five in the Guatemalan highlands associated with indoor air pollution. For children living in homes where open fires are used for heating and cooking, we calculate that there are approximately 16,000 cases of ALRI [95% CI: 64,584, 23,812] and 700 deaths from ALRI [95% CI: 195, 996] annually among children under age 5 that would be eliminated if indoor PM10 levels were reduced to less than 200 µg/m3. 2.35 An important issue is how this could be achieved. A study by Naeher et al. (2000b) reports average PM10 concentrations and child exposures below 200 µg/m3 (24 hour average) when well-maintained planchas are introduced into houses where open fires were previously used. Studies that measure indoor concentrations in houses where planchas have been used for some time, however, often record higher levels of PM10. This suggests that the benefits (in terms of reduced ALRI in children under age 5) of replacing open fires with planchas could be less than reported in this study. At the same time, other health benefits, such as benefits to mothers, of reducing indoor air pollution in the Guatemalan highlands have not been quantified.