Embed Size (px)
Citation preview

ESTIMATING INDUSTRIAL POLLUTIONIN LATVIA
by
Benoit Laplante*
andKarlis Smits**
June 1998
* DECRG – Environment and Infrastructure.** ECSRE.
The findings, interpretations, and conclusions expressed in this paper are entirely those ofthe authors. They do not necessarily represent the views of the World Bank, its ExecutiveDirectors, or the countries they represent.
ii
Acknowledgments
This data-intensive work was made possible through the support of a large number ofindividuals. In particular, we would like to thank Mr. Indulis Emsis, State Minister ofEnvironmental Protection of Latvia, and Mr. Guntis Pukitis, State Secretary of theMinistry who allowed us access to disaggregate emissions data. From the LatvianEnvironment Data Centre, we would like to thank especially Mrs Ilze Kirstuka, Directorand Mr. Ilgmars Lustiks. From the Central Statistical Bureau of Latvia, we would like tothank especially Mr. Arvils Sautins, Director who gave us access to industrial productionand employment data. We would also like to thank Messrs Kari Homanen and PeterisZilgalvis, formerly from the World Bank regional mission in Riga who facilitated our workin Latvia. We also thank Mrs. Sari Soderstrom in ECSRE for her continuous support andfor securing the funding necessary to conduct this analysis. We would also like to thankour colleagues in DECRG-IE, especially Ms. Susmita Dasgupta for her continuousavailability to answer our numerous questions. The research assistance of Mr. CraigMeisner is gratefully acknowledged. Usual disclaimers apply.
iii
Executive Summary
Due to limited resources, a large number of developing countries have scarce informationon the nature and level of emissions of industrial polluters in their countries. When thisinformation is available, it generally tends to be on a very limited number of (conventional)pollutants. Moreover, the system of information does not explicitly account for the factthat various pollutants have different degrees of toxicity. It is then difficult forenvironmental regulators in such conditions to set priorities in terms both of the industrialsectors that should be targeted for intervention, and in terms of the geographical areaswhere intervention should be focused. The implementation of cost-effective interventionthus suffers from a lack of basic information.
As a response to this insufficiency of information, the Infrastructure and Environmentteam of the Development Research Group of the World Bank (DECRG-IE) has developedthe Industrial Pollution Projection System (IPPS) which exploits the fact that industrialpollution is heavily affected by the scale of industrial activity and its sectoral composition.IPPS operates through sector estimates of pollution intensity (pollution per unit ofactivity). Estimates have been obtained from merging production and emissions data from200 000 factories in the Unites States.
In this paper, we use the emissions factors available in IPPS to estimate industrialpollution emissions in Latvia. These cover toxic pollution (for air, land and water), toxicmetal pollution, air pollution (SO2, NO2, CO, VOC, PM10 and TP) and water pollution(BOD and TSS). Some of this data will provide new information as the environmentalregulator in Latvia does not currently collect information on many of these pollutants.
Furthermore, we are able to weight the emissions of pollution by the relative risk that eachpollutant represents. We then compare the weighted rankings of industrial sectors (interms of pollution load) with the unweighted rankings; we provide a similar comparison atthe regional level. We show the weighted and unweighted rankings to be significantlydifferent thus illustrating that a prioritization of regulatory intervention based solely on ananalysis of pollution load may lead to an inefficient distribution of pollution control effortacross industrial sectors and geographical areas.
Finally, we also compare predicted air emissions with actual emissions reported by aselected number of firms in Latvia. As expected, in most cases (but not all), reportedemissions are much larger than predicted emissions thus reflecting on the nature of theindustrial technology in use in Latvia.
A similar exercise can be performed with other FSU countries with relatively modest datarequirements. The purpose of such estimation is not to supplement proper monitoringactivities of pollution sources. Its purpose is, in absence of such activities, to provide theregulator with information that can be used to prioritise its monitoring effort and allocateits monitoring resources more efficiently.

1
1. Introduction
Over the last two decades, a large number of developing countries have introduced
industrial environmental standards and/or some form of market-based instruments to
control industrial pollution. However, it is generally recognized that the implementation of
those standards and instruments has typically been seriously lacking. This is largely
explained by the absence of a reliable and comprehensive system of monitoring of
industrial emissions, and enforcement of compliance with the environmental standards.
Indeed, as a result of limited resources, a large number of developing countries have little
information on industrial emissions of air-borne and water-based pollutants, the costs of
pollution abatement, and the environmental and health impact of these various emissions.
This lack of information makes difficult the identification of priorities of actions, and the
implementation of cost-effective intervention.
Latvia is a country covering approximately 65 000 km2 with a population of 2.6
million people, located on the eastern edge of the Baltic Sea. During the Soviet period,
Latvia’s economy was based on specialized industries and agriculture which were fully
integrated with the Soviet centrally planned system. Since the restoration of independence
in 1991 and the ensuing collapse of trading relations with Russia and other former
Republics of the Former Soviet Union (FSU), Latvia has experienced a significant
reduction of industrial activity, high inflation rates, and a sharp decline in gross domestic
2
product (GDP). As a result of a vast program of economic reform, GDP has now
stabilized and is expected to grow at about 4% per year over the next few years.1
The central environmental protection authority in Latvia is the Ministry of
Environmental Protection and Regional Development (MOE) which is responsible, in
particular, for establishing environmental standards and enforcing environmental
protection and natural resource use. Latvia has recently passed new environmental
legislation, including a law on environmental taxes.2 Under the overall guidance of the
MOE, nine regional environmental protection committees are responsible for pollution
monitoring, inspection and compliance enforcement with standards and permits, and the
collection of pollution charges. Recently, the Latvian Environment Data Centre has been
created. Its principal mandate is to process and analyze environmental data in view of
supporting policy making.3
Despite this legislative and institutional apparatus, it is generally recognized that
the MOE and its regional offices lack the necessary information to set priorities, strategies,
and action plans. Plant-level monitoring of air and water emissions is at best imperfect,
monitoring equipment is often obsolete, data collection and measurement methodology are
1 For more information, see Environmental Protection Committee of the Republic of Latvia (1992),
Europe World Year Book (1994), and World Bank (1993a).
2 For more details, see Zilgalvis (1993).
3 The Centre was officially created in 1989, and received its current name in September 1993. It issubordinated to the Ministry of Environmental Protection and Regional Development. According toits status, its tasks are twofold: (1) to establish a uniform Environment Data System in Latvia and(2) to coordinate the monitoring of environmental quality and pollution discharges. Moreinformation about the Centre may be found at the following address: http://www.vdc.lv.
3
questionable, and there is usually a lack of trained personnel on industrial sites.4 A large
number of developing countries and countries in transition are similarly characterized.
As a response to this insufficiency of information, the Infrastructure and
Environment team of the Development Research Group of the World Bank has developed
the Industrial Pollution Projection System (IPPS) to exploit the fact that industrial
pollution is heavily affected by the scale of industrial activity and its sectoral composition.
IPPS operates through sector estimates of pollution intensity (usually defined as pollution
per unit of output and pollution per unit of employment). These estimates have been
obtained from merging production and emissions data from 200 000 factories in the Unites
States. Results from IPPS have been used in various countries where insufficient data on
industrial pollution proved to be an impediment to setting-up pollution control strategies
and prioritization of activities.5 Typically, pollution intensities obtained in IPPS are used to
estimate the pollution load of diverse industrial sectors.
Applying the IPPS methodology to Latvia is of interest for a number of reasons.
First, to our knowledge, this is the first time that the IPPS methodology is applied to a
country of the FSU. It is therefore possible to provide estimates of the emissions of a
number of pollutants that are not currently monitored by the MOE. Some of these
4 For more details, see Gooch (1994), Hardi (1992), and World Bank (1993a).
5 For example, IPPS was recently used to estimate the contribution of various industrial sectors to totaltoxic intensity in Vietnam (World Bank, 1996). Other examples include Lee and Roland-Holst(1993), World Bank (1993b, 1994), and World Resources Institute (1995).

4
pollutants have high degree of toxicity, and estimates of the release of these pollutants
especially on a regional basis, may therefore provide the MOE with valuable information.
Second, we have obtained output, employment, and emissions data for a number of
industrial enterprises in Latvia, and we can therefore compare the predicted levels of
pollution by IPPS with the actual pollution load recorded, albeit imperfectly, by the plants
and the regional environmental offices. This is of particular interest since the applicability
of US-based estimates to developing economies with industrial characteristics that may
differ significantly from those of the United States has always been the object of some
concerns. In particular, we show that the IPPS generally – but surprisingly not always -
underestimates considerably the pollution load of industrial enterprises in Latvia.
However, it provides a ranking of the industrial sectors (from large to small polluters) that
is similar to the ranking based on actual emissions. Hence, while IPPS estimates of
pollution load indicates correctly which industrial sectors or regions should be of greater
priority than others, it may at the same time wrongly suggests (since it underestimates
pollution load) that these sectors or regions do not deserve intervention while they should.
Finally, while IPPS provides an estimate of pollution which does not account for
the degree of toxicity of the various pollutants, in the current analysis we factor risk into
the pollution intensities. This allows us to compare the risk weighted ranking of industrial
sectors and geographical areas with the unweighted ranking. We show the risk weighted
ranking to be significantly different than the ranking provided by IPPS. Hence, a
prioritization of regulatory intervention based solely on an analysis of pollution load may

5
lead to an inefficient distribution of pollution control effort across industrial sectors and
regions.
In the next section, we briefly summarize the IPPS methodology. In Section 3, we
first describe the nature of industrial activity in Latvia, and then apply IPPS pollution
intensities to obtain estimates of land, air, and water pollution by industrial sectors and
geographical areas. We also compare the IPPS estimates for air pollution with actual
pollution load. In Section 4, we analyze and compare the risk weighted ranking of
industrial sectors and geographical areas with the unweighted ranking obtained in Section
3. We briefly conclude in Section 5.
2. The Industrial Pollution Projection System: an Overview6
IPPS is a modeling system which combines data from industrial activity (such as
production and employment) with data on pollution emissions to calculate pollution
intensity factors, i.e. the level of pollution emissions per unit of industrial activity. As
illustrated in Figure 1, pollution intensities have initially been calculated with data available
in the United States from the U.S. Manufacturing Census and the U.S. Environmental
Protection Agency (EPA). The Manufacturing Census maintains a database known as the
Longitudinal Research Database (LRD) which contains information from the Census of
Manufactures (CM) and the Annual Survey of Manufactures (ASM). While the CM
contains information on all manufacturing establishments in the United States, the ASM
seeks further and more detailed information on a subset of those companies. Once an

6
establishment has been selected to be part of the ASM, information is collected from the
chosen company once a year, for a period of 5 years. The LRD thus contains detailed
information on approximately 200,000 plants.
The EPA maintains a number of databases on pollution emissions. These include
the Toxics Release Inventory (TRI), the Aerometric Information Retrieval System
(AIRS), the National Pollutant Discharge Elimination System (NPDES), and the Human
Health and Ecotoxicity Database (HHED). All of these datasets have been used in the
calculation of pollution intensities.7 Upon combining the LRD’s database with the various
EPA databases, it is possible to calculate pollution intensity factors for approximately
20,000 plants.
6 Further information may be obtained in Hettige et al. (1995).
7 The TRI contains information on annual emissions for more than 300 toxic chemicals to theenvironment. Manufacturing establishments that (1) employ 10 full-time employees or more and (2)produce, import or process 25,000 pounds or more of any listed chemical must report the nature andquantity of the chemical produced, imported, or processed. In 1987, approximately 20,000enterprises reported their releases of such chemicals. The AIRS is the US national database forambient air quality, air emissions and compliance data with the U.S. Clean Air Act. The NPDEScontains the self-reported data of plants facing standards for water emissions. Finally, the HHEDcontains various indices of toxicological potency.

7
Figure 1Industrial Pollution Projection System
Pollution Intensity
US Manufacturing Census(200,000 plants)
US EPA EMISSIONS(20,000 plants)
Economic Data Toxics Air Water
IPPSData
A difficulty with the calculation of industrial pollution intensity factors concerns the choice
of the variable to capture the extent or size of the manufacturing activity. While physical
volume of output would be the ideal unit of measurement, industries and even
establishments within a given industry often use different units to report the volume of
their production. This does not allow for comparison across industries. However, the
value of output and plant-level employment do offer such common units of measurement.
While estimates of pollution load depend on the unit of measurement (value of output or
employment), Hettige et al (1995) have shown that the ranking of industrial sectors is
almost identical whether the value of output or employment is used as the unit of
measurement.8 In the United States therefore, the choice of the unit of measurement
would appear not to impact the ranking of industrial sectors by their pollution load. For
the purpose of policy-making, it is this ranking that is of relevance.

8
U.S. pollution intensities for toxic, toxic metal, and selected components of air and
water pollution are presented in Appendix 1. Note that pollution intensities are relatively
much higher in the sectors of activity listed in Table 1. In the next section, we use these
factor intensities to estimate the total industrial pollution load in Latvia.
Table 1Pollution intensive sectors of activity
Toxic pollution1 Industrial chemical (3511)Synthetic resins and plastic materials 93513)Textiles (3219)Tanneries (3231)
Toxic metal pollution2 Nonferrous metals (3720)Iron and steel (3710)
Air pollution3 Cement, lime and plaster (3692)Nonferrous metals (3720)Pulp and paper (3411)Petroleum and coal products (3540)
Water pollution4 Pulp and paper (3411)Dairy products (3112)Distilled spirits (3131)Industrial chemical (3511)
1 These cover the more than 300 toxic pollutants listed in the USEPA Toxic Release Inventory. Acomplete listing may be obtained in Hettige et al. (1995).
2 These are: aluminum, antimony, barium, beryllium, cadmium, chromium, cobalt, copper, lead,maneb, manganese, mercury, molybdenum, nickel, osmium tetroxide, silver, thallium, thoriumdioxide, titanium, vanadium, zinc, and zineb.
3 These are: SO2, NO2, CO, VOC, PM10 and TP.4 These are: BOD and TSS.
8 For the U.S. study, the rank correlation coefficient between intensity factors using the value of output
and using employment is 0.98 thus indicating an almost identical ranking.

9
3. Industrial pollution in Latvia
In this section, we first review the sectoral and geographical distribution of
industrial activity in Latvia. We then estimate the pollution load of various pollutants using
the IPPS pollution intensity factors. We finally compare IPPS estimates with actual
emissions reported to the MOE.
(A) Industrial activity in Latvia
We have obtained information on industrial activity from the Latvian Statistics
Committee. According to the Law on Statistics of the Republic of Latvia, the Committee
is not permitted to disclose plant-level information on industrial output and employment.
However, it can provide information on the industrial activity at both the sectoral and
regional levels. While the Statistics Committee records the information for every plant in
Latvia, it only provides information at the regional level and for those plants with 50 full-
time employees or more. Since it is of interest to estimate pollution load at the regional
level, we use a dataset which includes only those plants with 50 employees or more. Of
the 1986 entreprises in Latvia in 1994, there are 1486 such enterprises which account for
over 94% of the total value of production in Latvia, and 92% of the total employment. For
each region, the dataset provided by the Committee contains the following information:
10
- industry sector (ISIC code);9
- number of plants in the industryl;
- value of production per sector in current prices (Latvian currency) for 1993 and
1994; and
- total employment per sector for 1993 and 1994.
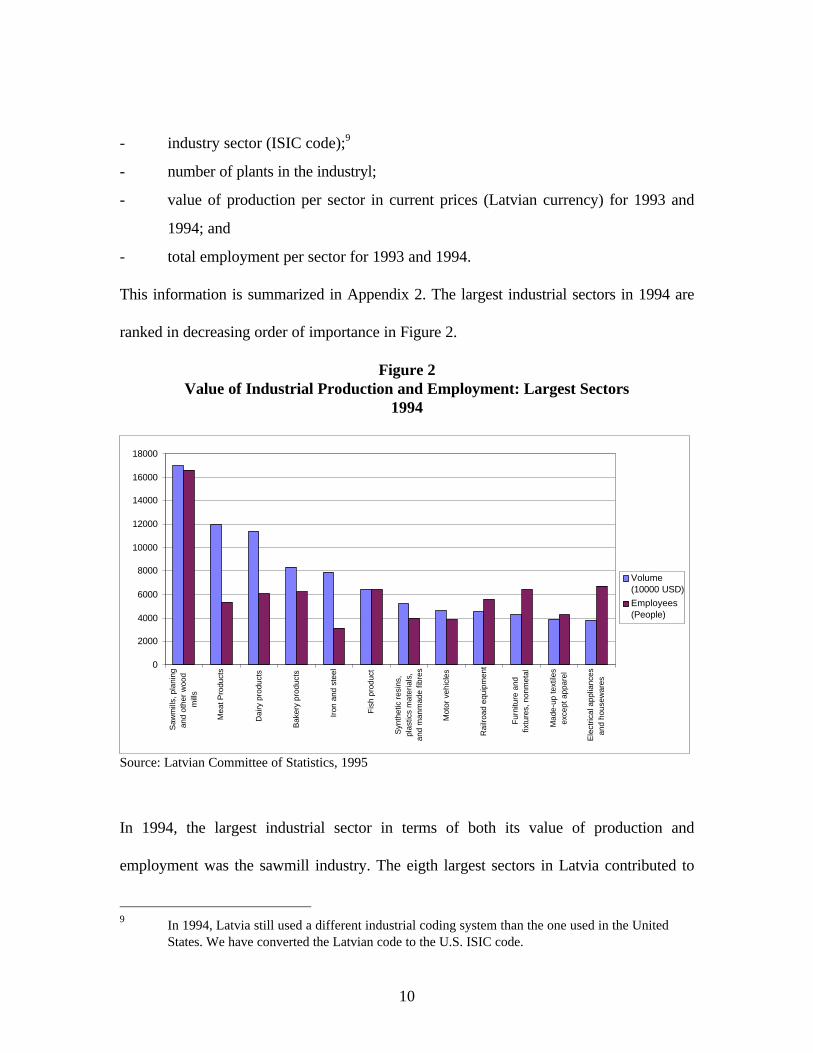
This information is summarized in Appendix 2. The largest industrial sectors in 1994 are
ranked in decreasing order of importance in Figure 2.
Figure 2Value of Industrial Production and Employment: Largest Sectors
1994
0
2000
4000
6000
8000
10000
12000
14000
16000
18000
Saw
mill
s, p
lani
ngan
d ot
her
woo
dm
ills
Mea
t Pro
duct
s
Dai
ry p
rodu
cts
Bak
ery
prod
ucts
Iron
and
ste
el
Fis
h pr
oduc
t
Syn
thet
ic r
esin
s,pl
astic
s m
ater
ials
,an
d m
anm
ade
fibre
s
Mot
or v
ehic
les
Rai
lroad
equ
ipm
ent
Fur
nitu
re a
ndfix
ture
s, n
onm
etal
Mad
e-up
text
iles
exce
pt a
ppar
el
Ele
ctric
al a
pplia
nces
and
hous
ewar
es
Volume(10000 USD)
Employees(People)
Source: Latvian Committee of Statistics, 1995
In 1994, the largest industrial sector in terms of both its value of production and
employment was the sawmill industry. The eigth largest sectors in Latvia contributed to
9 In 1994, Latvia still used a different industrial coding system than the one used in the United
States. We have converted the Latvian code to the U.S. ISIC code.
11
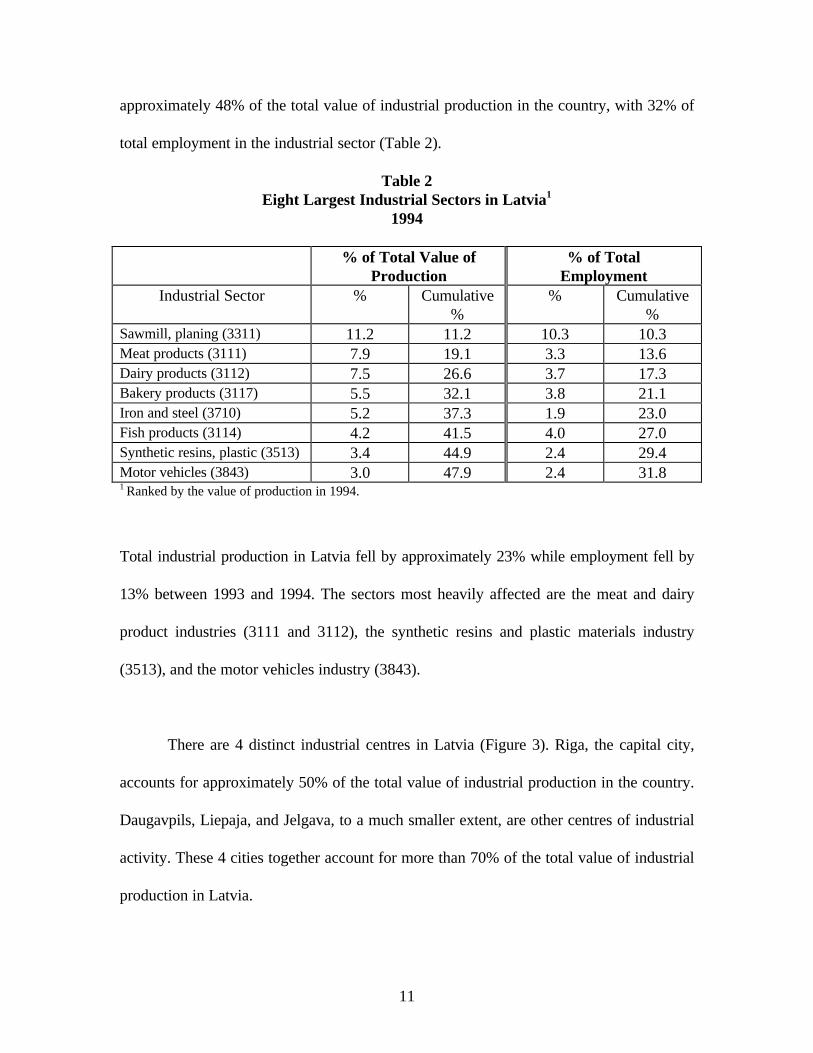
approximately 48% of the total value of industrial production in the country, with 32% of
total employment in the industrial sector (Table 2).
Table 2Eight Largest Industrial Sectors in Latvia1
1994
% of Total Value ofProduction
% of TotalEmployment
Industrial Sector % Cumulative%
% Cumulative%
Sawmill, planing (3311) 11.2 11.2 10.3 10.3Meat products (3111) 7.9 19.1 3.3 13.6Dairy products (3112) 7.5 26.6 3.7 17.3Bakery products (3117) 5.5 32.1 3.8 21.1Iron and steel (3710) 5.2 37.3 1.9 23.0Fish products (3114) 4.2 41.5 4.0 27.0Synthetic resins, plastic (3513) 3.4 44.9 2.4 29.4Motor vehicles (3843) 3.0 47.9 2.4 31.81 Ranked by the value of production in 1994.
Total industrial production in Latvia fell by approximately 23% while employment fell by
13% between 1993 and 1994. The sectors most heavily affected are the meat and dairy
product industries (3111 and 3112), the synthetic resins and plastic materials industry
(3513), and the motor vehicles industry (3843).
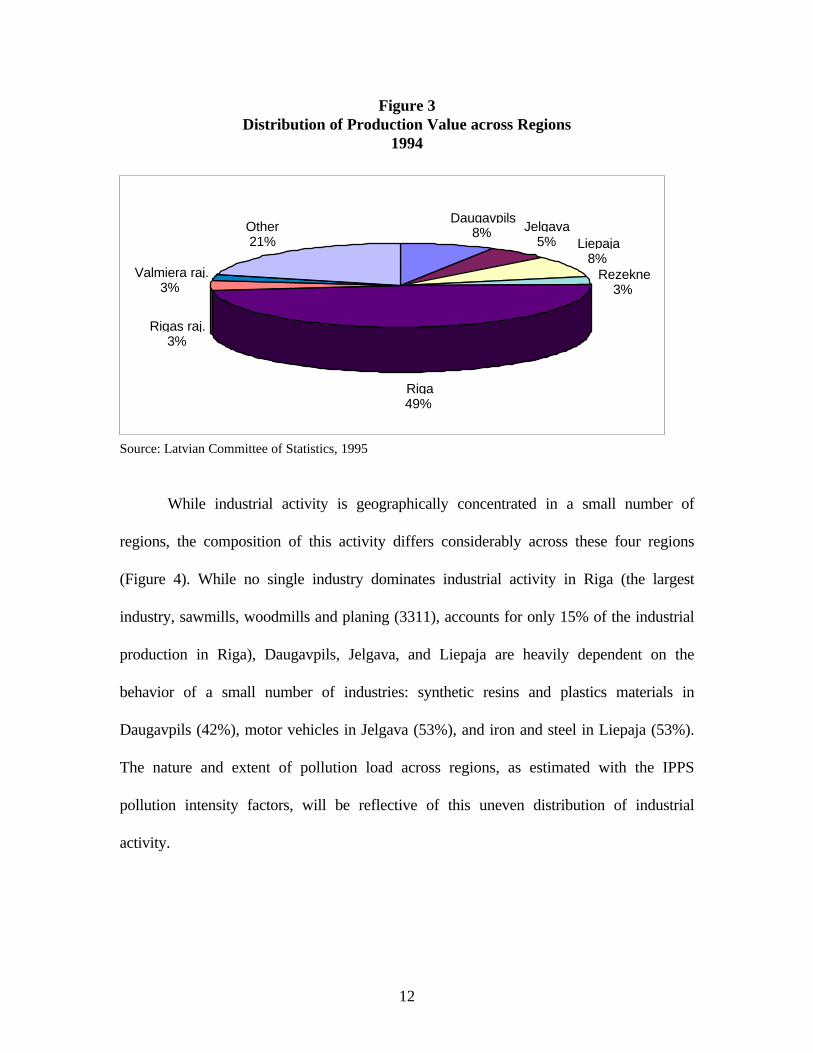
There are 4 distinct industrial centres in Latvia (Figure 3). Riga, the capital city,
accounts for approximately 50% of the total value of industrial production in the country.
Daugavpils, Liepaja, and Jelgava, to a much smaller extent, are other centres of industrial
activity. These 4 cities together account for more than 70% of the total value of industrial
production in Latvia.
12
Figure 3Distribution of Production Value across Regions
1994
Daugavpils8% Jelgava
5% Liepaja8%
Rezekne3%
Riga49%
Rigas raj.3%
Valmiera raj.3%
Other21%
Source: Latvian Committee of Statistics, 1995
While industrial activity is geographically concentrated in a small number of
regions, the composition of this activity differs considerably across these four regions
(Figure 4). While no single industry dominates industrial activity in Riga (the largest
industry, sawmills, woodmills and planing (3311), accounts for only 15% of the industrial
production in Riga), Daugavpils, Jelgava, and Liepaja are heavily dependent on the
behavior of a small number of industries: synthetic resins and plastics materials in
Daugavpils (42%), motor vehicles in Jelgava (53%), and iron and steel in Liepaja (53%).
The nature and extent of pollution load across regions, as estimated with the IPPS
pollution intensity factors, will be reflective of this uneven distribution of industrial
activity.

13
Figure 4Industry Structure for Largest Industrial Centres in 1994
31175% 3311
13%31193%3833
7%
31115%Other
67%
311114%
351348%
38219%
38238%
38425%
Other16%
31114%
311210% 3117
2% 31188%
32112%
384363%
Other11%
31117%
31126% 3114
3%
321220%
371042%
38322%
Other20%
RIGA DAUGAVPILS

14
(B) Pollution emissions in Latvia: IPPS projections for water, toxic and toxic metal pollution
In order to examine the sectoral and geographical ranking of pollution emissions in
Latvia, one can use the sectoral value of production or sectoral employment as a basis to
measure industrial activity. However, whether we use production or employment as the
unit of measurement, the bulk of emissions, as shown in Table 3, is accounted for by a
small number of industrial sectors. For example, the four largest water polluters account
for approximately 96% of total water pollution by the Latvian industrial sector. Two
industries are largely responsible for the emissions of toxic pollution: the Synthetic resins
and plastics industry, and the Iron and steel industry. The Iron and steel industry is also by
far the largest producer of toxic metal pollution and water pollution. The Cement and lime
industry is the largest producer of air pollution.
While the ranking of industrial sectors remain relatively the same whether we use
employment or production as the unit of measurement, note in Appendix 3 that estimates
of pollution emissions are always much larger using employment as the unit of
measurement by a factor of approximately 1 to 10. Two factors may explain this result.
First, while we have used the official Latvian/US exchange rate prevailing in 1987 to
estimate pollution coefficient per value of production, it may have been preferable to use a
measure of purchasing power parity. We may reasonably expect the purchasing power
parity to be higher than the official exchange rate, thereby leading to higher estimates of
pollution emissions. Second, it was certainly the case that most enterprises in Latvia were
significantly overstaffed, thereby leading to higher estimates of pollution load.

15
Table 3Largest Industrial Polluters in Latvia
Using Value of Production Using EmploymentFour largest industrial polluters Four largest industrial polluters
Toxic Pollution % Cumulative % Toxic Pollution % Cumulative %Synthetic resins and plastics (3513) 29.6 29.6 Synthetic resins and plastics (3513) 32.4 32.4Iron and steel (3710) 28.0 57.6 Iron and steel (3710) 9.9 42.3Drugs and Medicines (3522) 4.1 61.7 Industrial chemical (3511) 6.7 49.0Furniture and fixtures (3320) 3.3 65.0 Drugs and Medicines (3522) 5.6 54.6
Toxic Metal Pollution Toxic Metal PollutionIron and steel (3710) 82.6 82.6 Iron and steel (3710) 59.7 59.7Synthetic resins and plastics (3513) 3.5 86.4 Synthetic resins and plastics (3513) 8.0 67.7Non ferrous metals (3720) 2.1 88.2 Fabricated metal products (3819) 3.7 71.4Metal & wood machinery (3823) 1.7 89.9 Tanneries and leather finishing (3231)3 2.8 74.2
Air Pollution Air PollutionCement, lime (3692)1 40.8 40.8 Cement, lime (3692) 57.7 57.7Iron and steel (3710) 17.2 58.0 Synthetic resins and plastics (3513) 7.2 64.9Sawmills (3311) 10.3 68.3 Iron and steel (3710) 7.1 72.0Synthetic resins and plastics (3513) 7.4 75.7 Sawmills (3311) 6.2 78.2
Water pollution Water pollutionIron and steel (3710)2 85.5 85.5 Iron and steel (3710) 61.6 61.6Dairy products (3112) 5.8 91.3 Dairy products (3112) 11.2 73.8Distilled spirits (3131) 2.6 93.9 Pulp and paper (3411) 10.0 83.8Drugs and Medicines (3522) 1.9 95.8 Drugs and Medicines (3522) 5.2 89.01 The Cement and lime industry emits large quantities of SO2, PM10, and TP; the Iron and steel and Sawmill industries are particularly intensive in CO; theSynthetic resins and plastics industry emits mainly NO2.2 The Iron and steel industry emits very large quantities of TSS (to a lesser extent, so does the Drugs and medicines industry); the Dairy products and Distilledspirits industries are BOD intensive.3 This sector produced 42.31 tons of toxic metal pollution. The Non Ferrous metals industry (3720) produced 41.65 tons.

16
The regions with the highest toxic land and air pollution are Riga, Daugavpils and
Liepaja.10 Note that toxic water pollution is small relative to land and air across most
industries and regions. Although water pollution is smaller in volume relative to air and
land, groundwater pollution is occurring in areas adjacent to solid and hazardous waste
disposal sites and major agricultural facilities.11
Figure 5Distribution of Toxic Pollution by Region, 1994
0
50
100
150
200
250
Daugavpils
Jelgava
Liepaja
Riga
Rigas raj.
Other
By Water
By Land
By Air
10 Unless indicated otherwise, we proceed with estimates of pollution using the value of production as
the unit of measurement. To a large extent, the analysis would be similar if we were to use pollutionestimates based on employment.
11 World Bank, 1993a, p. 187.

17
Of most interest in Figure 5 is to observe that while Riga accounts for
approximately 50% of the value of industrial production in Latvia, Daugavpils and Liepaja
account for a large share of total industrial emissions of toxic pollution. This suggests that
disproportionately large polluters may be found in these regions. Hence, looking solely at
the distribution of industrial activities across a nation or region may not send the correct
signal as to the appropriate geographical distribution of pollution monitoring efforts:
Daugavpils, with only 8% of the total Latvian industrial production, produces as much
toxic pollution as Riga.
In Liepaja, the Iron and Steel (3710) industry (Liepaja Metalurgs), intensive in
metal pollution for land and air, explains the bulk of the toxic metal pollution. Land is the
major receiving medium for toxic metal pollution across the regions of Liepaja, Riga and
Daugavpils (Figure 6). Riga and Daugavpils are metal intensive due to the large galvanic
industries which load sewage systems with heavy metals. Municipal and industrial
wastewater treatment is often lacking and most sludge is dried in land-extensive facilities
not lined or monitored.12
12 World Bank, 1993a, p.189.

18
Figure 6Distribution of Toxic Metal Pollution by Region, 1994
0
2 0
4 0
6 0
8 0
1 0 0
1 2 0
D a u g a v p i l s L i e p a j a R i g a O t h e r
B y W a t e r
B y L a n d
B y A ir
Insofar as water pollution is concerned, the distinction between BOD and TSS is
important. High load of BOD are mainly the results of agricultural runoff from intensive
livestock enterprises, returning fertilizer and organic material released into water course.
The Dairy products industry (3112) is by far the most important producer of BOD (Figure
7). Moreover, we dont find a high degree of concentration of BOD releases at the regional
level. The region of Riga accounts for 33% of total BOD releases by the industrial sector
(Figure 8).

19
Figure 7 Distribution of BOD by Industry, 1994
311274%
31143%
313114%
Other9%
Figure 8Distribution of BOD by Region, 1994
R ig a3 3 %
V a l m iera ra j .7 %
R e z e k n e7 %
Je lgava6 %
Liepa ja4 %
O ther3 8 %
Tukums ra j .5 %

20
However, emissions of TSS are heavily concentrated in the Iron and Steel industry (3710),
which accounts for over 90% of total industrial emissions of TSS. The pollution is also
focused in one region, Liepaja (77%), where the presence of Liepaja
Metalurgs, as a point source, emerges again.
Figure 9Distribution of TSS Emissions by Industry
31312%
35222%
371092%
Other4%

21
Figure 10Distribution of TSS Emissions by Region, 1994
Riga18%
Liepaja77%
Daugavpils1%
Other4%
(C) Air pollution: IPPS estimates vs Actual emissions
As mentioned earlier, we have obtained information on industrial activity from the
Latvian Statistics Committee, and pollution emissions from the Latvian Environment Data
Centre. In a large number of cases, it was possible to match these two datasets and
identify industrial activity and pollution emissions for specific plants. For those cases
where this was possible, we can compare the reported emissions with the estimates
calculated by IPPS.
We first compare reported and estimated air emissions per industrial sector.13
Results for total particulates, VOC and SO2 are presented in Figure 11, 12 and 13
13 Complete results are presented in Appendix 4. Note that this comparative exercise was possible
only for air pollution. In Latvia, most industrial polluters are discharging into municipal sewage.It is therefore the responsibilities of municipalities to monitor and control these water discharges.The national authorities do not possess this data.

22
respectively. A comparison of these figures indicate that except for TP in the Cement
industry and for SO2 in the Iron and steel industry, IPPS consistently and signficantly
underestimates reported emissions. This is indeed what we expected, namely that given the
state of industrial production technology currently in use in Latvia, reported emissions
(and therefore perhaps actual emissions) would be considerably higher than IPPS
estimates. In all three figures, note that if we were to rank industrial sectors in terms of
their pollution emissions, the ranking would be the same upon using reported emissions
and IPPS estimates. From the point of view of policy makers, it is this information that is
mainly of interest. This may be an indication that in terms of all the other pollutants on
which information is not currently collected in Latvia (e.g. toxic, toxic metal, etc.) IPPS
estimates may provide a reliable source of informationto initiate a prioritisation of
monitoring effort.

23
Figure 11Actual vs predicted emissions of Total Particulates in 1994 (tons)
0
100
200
300
400
500
600
700
800
900
Iron andsteel
Grain millproducts
Pulp, paperand
paperboard
Cement,lime, andplaster
Pottery,china, andearthw are
TP (Actual)
TP (IPPS)

24
FIGURE 12
Actual vs predicted emissions of VOC in 1994 (tons)
0
20
40
60
80
100
120
140
Motorvehicles
Furnitureand
fixtures,nonmetal
Pottery,china, andearthw are
Wood andcork
products,NEC
Woodenand cane
containers;small cane
VOC (Actual)
VOC (IPPS)
Note that for the Iron and steel industry, IPPS underestimates the emissions of total
particulates and overestimates the emissions of SO2. A number of factors may explain this
phenomenon. First, there is only one large iron and steel plant in Latvia (located in
Liepaja). This plant may not be representative of the average sectoral characteristics
observed in theUnited States. To this extent, the emissions factors used in IPPS may
simply not be good indicators of the pollution intensity of this particular plant. It may also
be the case that this particular plant systematically underreports its emissions of SO2,

25
deliberately or not (for example, it may be that the methodology (formula) used by the
plant to estimate SO2 emissions leads to an underestimate of the plant’s emissions).14
Figure 13Actual vs predicted emissions of SO2 in 1994 (tons)
0
50
100
150
200
250
300
350
400
450
500
Sugarfactories
andrefineries
Distilledspirits
Iron andsteel
Dairyproducts
Petroleumrefiners
SO2 (Actual)
SO2(IPPS)
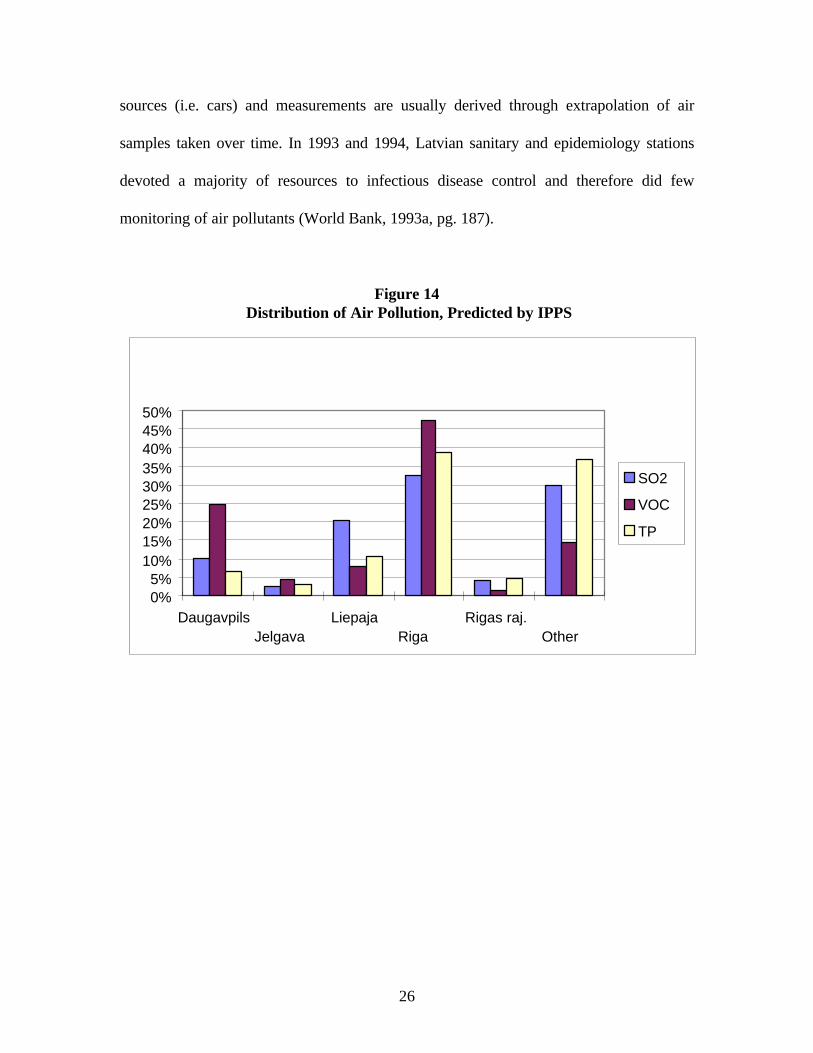
On a regional level, the correlation between predicted and actual emissions
improved for some selected compounds. For VOC the correlation is quite high and this
may be due to more accurate reporting by point source industries. VOCs are known to be
more acute in toxicity (hazardous in small doses) thus the reporting of these substances
may be more formalized than SO2 or TP. SO2 and TP emissions have many non-point
14 In a recent conversation with the Latvian Environment Data Centre, we were told that the permits of
the Iron and steel plant and of the plants in the Cement, lime and plaster industry were currentlyunder revision.
26
sources (i.e. cars) and measurements are usually derived through extrapolation of air
samples taken over time. In 1993 and 1994, Latvian sanitary and epidemiology stations
devoted a majority of resources to infectious disease control and therefore did few
monitoring of air pollutants (World Bank, 1993a, pg. 187).
Figure 14 Distribution of Air Pollution, Predicted by IPPS
0%5%
10%15%20%25%30%35%40%45%50%
DaugavpilsJelgava
LiepajaRiga
Rigas raj.Other
SO2
VOC
TP
27
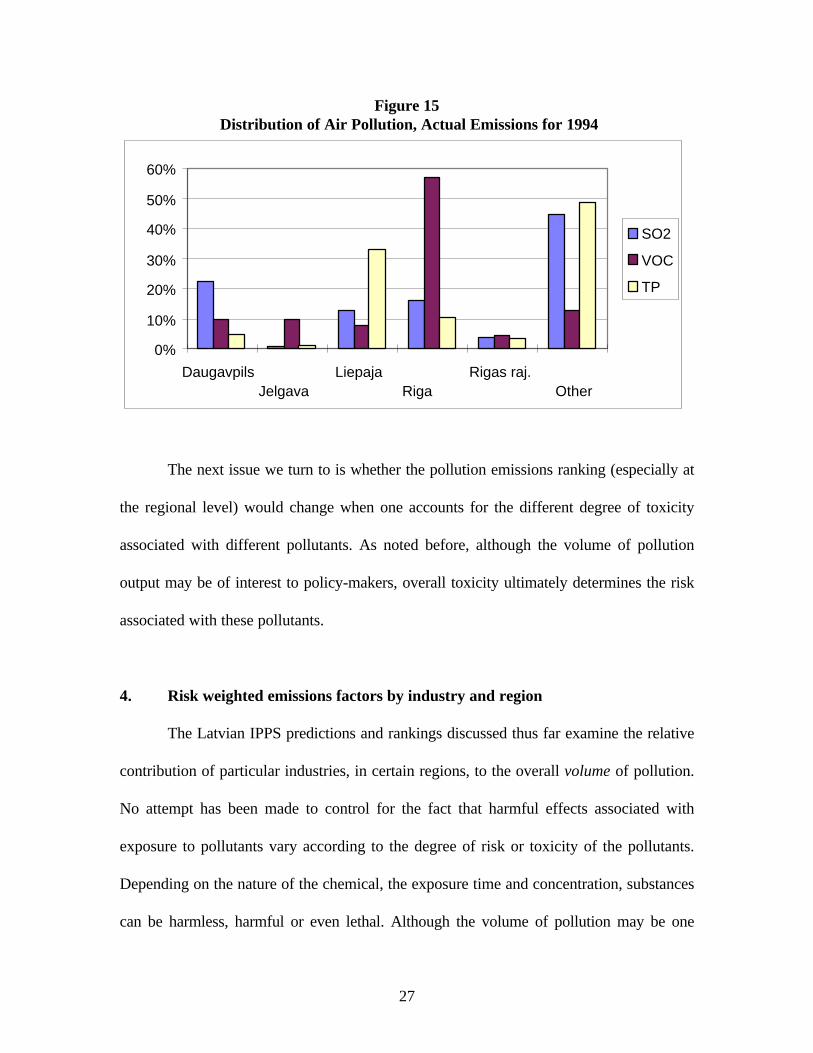
Figure 15 Distribution of Air Pollution, Actual Emissions for 1994
0%
10%
20%
30%
40%
50%
60%
DaugavpilsJelgava
LiepajaRiga
Rigas raj.Other
SO2
VOC
TP
The next issue we turn to is whether the pollution emissions ranking (especially at
the regional level) would change when one accounts for the different degree of toxicity
associated with different pollutants. As noted before, although the volume of pollution
output may be of interest to policy-makers, overall toxicity ultimately determines the risk
associated with these pollutants.
4. Risk weighted emissions factors by industry and region
The Latvian IPPS predictions and rankings discussed thus far examine the relative
contribution of particular industries, in certain regions, to the overall volume of pollution.
No attempt has been made to control for the fact that harmful effects associated with
exposure to pollutants vary according to the degree of risk or toxicity of the pollutants.
Depending on the nature of the chemical, the exposure time and concentration, substances
can be harmless, harmful or even lethal. Although the volume of pollution may be one

28
criteria for prioritisation of pollution control effort, the overall toxicity associated with
pollutants may be of importance. Indeed, accounting for the heterogeneous chemical risk
of each pollutant may yield different rankings of pollution intensive industrial sectors and
geographical areas. Thus, as an extension to the above analysis, in this section we weight
the levels of pollution for each industry and region in Latvia with appropriate toxicity
factors, and compare the results with the unweighted ranking. It will be shown that the
two rankings differ substantially.
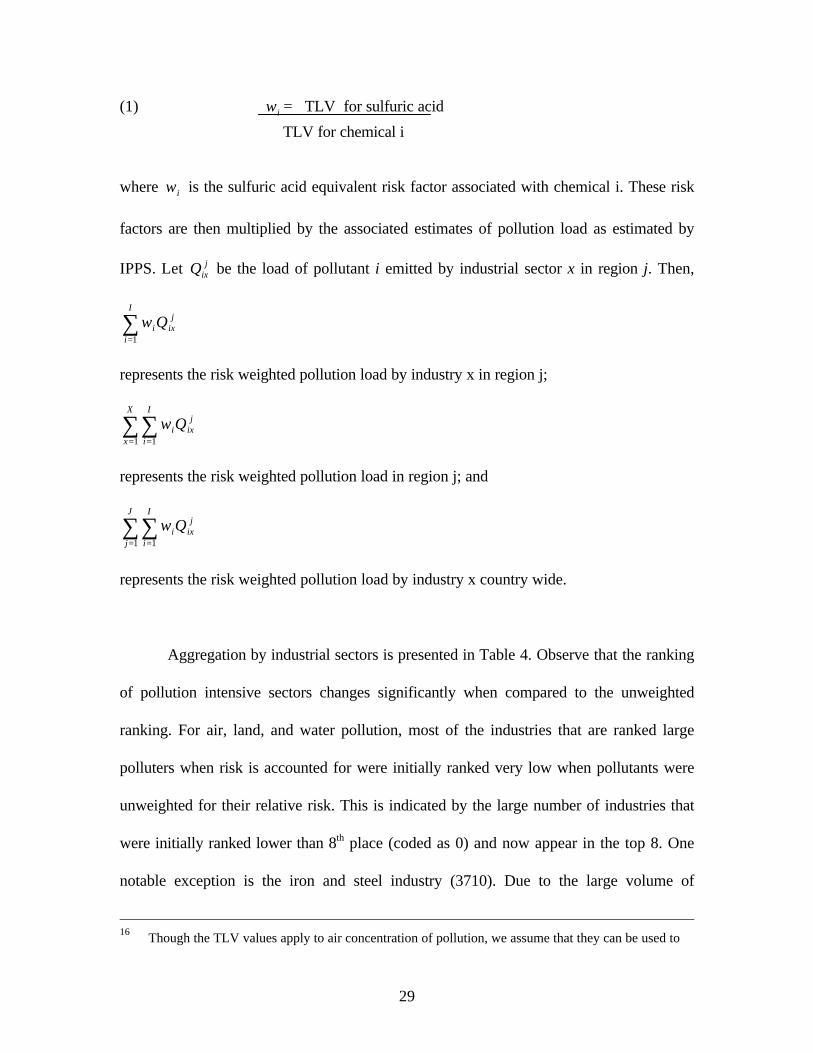
In order to introduce toxicity in our analysis, we apply weighting factors to the
volume of pollution calculated in the previous section for each industrial sector and
region. While numerous weighting structures are available, we use the methodology
known as Threshold Limit Values (TLVs).15 TLVs are a time weighted average
concentration in air that cannot be exceeded without adverse effects to workers in a
normal 8 hour work day and a 40 hour work week. TLVs are revised and published
annually by the American Conference of Governmental Industrial Hygienists (ACGIH). In
the current analysis, we use the 1996 TLVs.16
In order to aggregate weighted pollution across industries or regions, we must
initially convert each chemical into equivalent weights. These weight equivalent risk
factors were calculated by normalising each chemical with respect to a reference chemical,
sulfuric acid:
15 See Dasgupta et al. (1998) for more details on various methodologies.
29
(1) iw = TLV for sulfuric acid
where iw is the sulfuric acid equivalent risk factor associated with chemical i. These risk
factors are then multiplied by the associated estimates of pollution load as estimated by
IPPS. Let jixQ be the load of pollutant i emitted by industrial sector x in region j. Then,
∑=
I
i
jixiQw
1
represents the risk weighted pollution load by industry x in region j;
∑∑= =
X
x
I
i
jixiQw
1 1
represents the risk weighted pollution load in region j; and
∑∑= =
J
j
I
i
jixiQw
1 1
represents the risk weighted pollution load by industry x country wide.
Aggregation by industrial sectors is presented in Table 4. Observe that the ranking
of pollution intensive sectors changes significantly when compared to the unweighted
ranking. For air, land, and water pollution, most of the industries that are ranked large
polluters when risk is accounted for were initially ranked very low when pollutants were
unweighted for their relative risk. This is indicated by the large number of industries that
were initially ranked lower than 8th place (coded as 0) and now appear in the top 8. One
notable exception is the iron and steel industry (3710). Due to the large volume of
16 Though the TLV values apply to air concentration of pollution, we assume that they can be used to
TLV for chemical i

30
pollution produced by this industry, the unweighted method initially ranked this industry
number one polluter for land and water pollution. However, its ranking falls when
pollution is risk weighted. These results indicate that although the volume of pollution
may be high, the relative risk associated with the land and water pollution from this
industry may not deserve as much attention as the land and water pollution from other
industrial sectors.
The overall industry rankings suggest that the sawmill, woodmill and planing
(3311), iron and steel (3710), synthetic resin, plastic material and man-made fiber (3513),
fabricated metal products (3819), motor vehicle (3843), printing and publishing (3420)
and dairy product (3112) industries are the higher risk polluters.
When aggregated at the regional level, the ranking of the most polluted regions of
Latvia also differs significantly between the weighted and unweighted ranking, although
perhaps not as significantly as across industrial sectors. Observe in Table 5 that the
ranking of Riga, Liepaja and Daugavpils remains relatively the same for air and land
pollution. That Liepaja falls from the first polluted region to the fifth in terms of water
pollution is entirely accounted for by the change in ranking in the Iron and steel industry.
Also observe that a number of regions not classified very high when pollution is
unweighted for risk (regions with zeros), would rank among priority regions when
pollution is weighted for risk.
approxiamte the toxicity from all routes of exposure. Horvath et al. (1995) proceed similarly.

31
Table 4Risk weighted versus unweighted ranking
Most polluting industries across mediaAIR
Industry name Code Unweighted ranking Weighted rankingSawmills, planing and other wood mills 3311 3 1Iron and steel 3710 2 2Printing and publishing 3420 0 3Prepared animal food 3122 0 4Furniture and fixtures, nonmetal 3320 7 5Synthetic resins, plastics materials 3513 4 6Shipbuilding and repair 3841 0 7Motor vehicles 3843 0 8
LANDSawmills, planing and other wood mills 3311 0 1Dairy products 3112 5 2Iron and steel 3710 1 3Engines and turbines 3821 0 4Motor vehicles 3843 0 5Printing and publishing 3420 0 6Fabricated metal products 3819 0 7Radio, TV, communication equipment 3832 8 8
WATERSawmills, planing and other wood mills 3311 7 1Spinning, weaving and finishing textiles 3211 0 2Dairy products 3112 2 3Cement, lime and plaster 3692 0 4Iron and steel 3710 1 5Fabricated metal products 3819 0 6Oils and fats 3115 0 7Synthetic resins, plastics materials 3513 0 8

32
Table 5Risk weighted versus unweighted ranking
Most polluted regions across media
AIRRegion Unweighted ranking Weighted ranking
Riga 1 1Liepaja 2 2Ventspils 0 3Daugavpils 4 4Cesu raj. 0 5Rigas raj. 5 6Valmiera raj. 0 7Kuldigas raj. 0 8
LANDRiga 2 1Liepaja 1 2Jelgava 5 3Daugavpils 3 4Daugavpils 6 5Ventspils 0 6Rezekne 7 7Ventspils 4 8
WATERRiga 2 1Valmiera raj. 4 2Ventspils 0 3Jelgava 6 4Liepaja 1 5Cesu raj. 0 6Rigas raj. 0 7Saldus raj. 0 8
Perhaps of greater interest however is that for air and water pollution, a large
number of regions with a high index of unweighted risk pollution have a much lower index
when pollution is risk weighted (Figures 16 and 17). For land pollution, results are exactly
the converse (Figure 18). These once again indicate that a prioritisation of pollution
control effort that would ignore the heterogeneous toxicity factors of pollutants may lead
to an inefficient allocation of resources.

33
Figure 16aUnweighted Air Pollution in 1994
Figure 16bRisk Weighted Air Pollution in 1994

34
Figure 17aUnweighted water pollution in 1994
Figure 17bRisk weighted water pollution in 1994

35
Figure 18aUnweighted land pollution in 1994
Figure 18bRisk Weighted Land Pollution in 1994

36
5. Conclusion
Due to limited resources, a large number of developing countries have scarce
information on the nature and level of emissions of industrial polluters in their countries.
When this information is available, it generally tends to be on a very limited number of
(conventional) pollutants. Moreover, the system of information does not explicitly account
for the fact that various pollutants have different degrees of toxicity. It is then difficult for
environmental regulators in such conditions to set priorities in terms both of the industrial
sectors that should be targeted for intervention, and in terms of the geographical areas
where intervention should be focused.
It does not follow that regulators in developing countries should refrain from
acting. In this paper, we have shown that it is possible to use the emissions factors
available in IPPS to estimate industrial pollution emissions in Latvia. Some of our results
will undeniably provide new information to the environmental regulator in Latvia.
Furthermore, we have been able to weight the emissions of pollution by the relative risk
that each pollutant represents, and shown that the weighted and unweighted rankings (at
the industrial or regional levels to be significantly different thus illustrating that a
prioritization of regulatory intervention based solely on an analysis of pollution load may
lead to an inefficient distribution of pollution control effort across industrial sectors and
geographical areas.
The purpose of such estimation is not to supplement proper monitoring activities
of pollution sources. These activities are utterly desirable and necessary. Its purpose is, in
37
absence of such activities, to provide the regulator with information that can be used to
prioritise its monitoring effort and allocate its monitoring resources more efficiently.

38
REFERENCES
Dasgupta, S., Laplante, B. and C. Meisner (1998), Accounting for Toxicity Risks inPollution Control: Does it Matter?
Europe World Year Book (1994), Latvia, pp. 1783-96.
Environmental Protection Committee of the Republic of Latvia, (1992), National Report of Latvia to UNCED. United Nations Conference on Environment and Development.
Gooch, G.D. (1994), “Environmental policy in the Baltic States of Estonia and Latvia”, Journal of Environmental Planning and Management, 37, 3, 323-333.
Hardi, P. (1992), Impediments on Environmental Policy-Making and Implementation in Central and Eastern Europe: Tabula Rasa vs Legacy of the Past, Institute of International Studies, Policy Papers in International Affairs # 40, University of California, Berkeley.
Hettige, M., Martin, P., Singh, M, and D. Wheeler (1995), The Industrial Pollution Projection System, Policy Research Department, Policy Research Working Paper 1431, The World Bank.
Horvath, A., Hendrickson, C.T., Lave, L.B., McMichael, F.C. and T.S. Wu, “Toxicemissions indices for green design and inventory”, Environmental Science &Technology, 29, 2, 86-90.
Lee, H. and D. Roland-Holst (1993), International Trade and the Transfer of Environmental Costs and Benefits, Organisation for Cooperation and Development, Paris.
World Bank (1993a), Latvia, The Transition to a Market Economy, World Bank, Washington, D.C.
World Bank (1993b), Asia: Environment and Development, World Bank, Washington, D.C.
World Bank (1994), Indonesia: Environment and Development, World Bank, Washington, D.C.
World Bank (1996), Viet Nam -- Industrial Pollution Prevention (IPP) Sector Report, mimeo, Washington, D.C.
World Resources Institute (1995), World Resources 1994-95, World Resources Institute, Washington, D.C.

39
Zilgalvis, P. (1993), Environmental Legislation in Latvia, Prepared for the Commission of the European Communities, The World Bank, Riga, Latvia.