Embed Size (px)
Citation preview
Estimating Low-Flow Frequency Statistics and Hydrologic Analysis of Selected Streamflow-Gaging Stations, Nooksack River Basin, Northwestern Washington and Canada
Scientific Investigations Report 2009–5170
Prepared in cooperation with the Lummi Nation
U.S. Department of the InteriorU.S. Geological Survey

Cover: Photograph of Racehorse Falls near Kendall, Washington. (Photograph taken by Christopher A. Curran, 2009.)
Estimating Low-Flow Frequency Statistics and Hydrologic Analysis of Selected Streamflow-Gaging Stations, Nooksack River Basin, Northwestern Washington and Canada
By Christopher A. Curran and Theresa D. Olsen
Prepared in cooperation with the Lummi Nation
Scientific Investigations Report 2009–5170
U.S. Department of the InteriorU.S. Geological Survey
U.S. Department of the InteriorKEN SALAZAR, Secretary
U.S. Geological SurveySuzette M. Kimball, Acting Director
U.S. Geological Survey, Reston, Virginia: 2009
For more information on the USGS—the Federal source for science about the Earth, its natural and living resources, natural hazards, and the environment, visit http://www.usgs.gov or call 1-888-ASK-USGS
For an overview of USGS information products, including maps, imagery, and publications, visit http://www.usgs.gov/pubprod
To order this and other USGS information products, visit http://store.usgs.gov
Any use of trade, product, or firm names is for descriptive purposes only and does not imply endorsement by the U.S. Government.
Although this report is in the public domain, permission must be secured from the individual copyright owners to reproduce any copyrighted materials contained within this report.
Suggested citation:Curran, C.A., and Olsen, T.D., 2009, Estimating low-flow frequency statistics and hydrologic analysis of selected streamflow-gaging stations, Nooksack River basin, northwestern Washington and Canada: U.S. Geological Survey Scientific Investigations Report 2009–5170, 44 p.
iii
Contents
Abstract ...........................................................................................................................................................1Introduction ....................................................................................................................................................1
Purpose and Scope ..............................................................................................................................6Description of Study Area ..................................................................................................................6Previous Investigations........................................................................................................................7
Low-Flow Frequency Statistics at Continuous-Record Gaging Stations and Miscellaneous Measurement Sites .........................................................................................................................7
Estimating Low-Flow Frequency Statistics at Ungaged Sites Using Regional Regression Equations ...........................................................................................................................................8
Methods of Regression ........................................................................................................................8Basin Attributes.....................................................................................................................................8Regression Equations.........................................................................................................................13Accuracy and Limitations ..................................................................................................................14
Hydrologic Analysis of Selected Streamflow-Gaging Stations ...........................................................14Description of Subbasins ..................................................................................................................14
Racehorse Creek .......................................................................................................................16Warm Creek ................................................................................................................................18Clearwater Creek .......................................................................................................................20Skookum Creek...........................................................................................................................22Anderson Creek..........................................................................................................................24Fishtrap Creek.............................................................................................................................26
Evaluation of Redundancy in the Streamflow-Gaging Station Network ...................................28Hydrograph Comparison Method ............................................................................................28Daily-Value Correlation Method ..............................................................................................30Variable-Space Method ............................................................................................................34Flow-Duration-Ratio Method ...................................................................................................35Summary of Methods and Prioritization of Streamflow-Gaging Stations ........................37
Summary........................................................................................................................................................39Acknowledgments .......................................................................................................................................40References Cited..........................................................................................................................................41Appendix A. Regression Equations for Estimating Daily Mean Streamflow at Six Gaging
Stations in the Nooksack River Basin .........................................................................................43
iv
Figures Figure 1. Map showing location of the Nooksack River basin and major rivers and
population centers in the basin, Washington and Canada ……………………… 2 Figure 2. Map showing locations of streamflow-gaging stations and miscellaneous
measurement sites in and near the Nooksack River basin, Washington and Canada ……………………………………………………………………… 3
Figure 3. Map showing location of streamflow-gaging stations in Racehorse, Warm, Clearwater, Skookum, Anderson, and Fishtrap Creek subbasins that were analyzed for redundancy in the streamflow-gaging station network, Nooksack River basin, Washington and Canada ………………………………… 15
Figure 4. Satellite image showing oblique view and delineation of the Racehorse Creek subbasin with the January 2009 landslide area, Nooksack River basin, Washington ……………………………………………………………………… 16
Figure 5. Photographs showing view looking upstream (A) and downstream (B) from the U.S. Geological Survey streamflow-gaging station on Racehorse Creek at North Fork Road, near Kendall, Washington …………………………………… 17
Figure 6. Satellite image showing oblique view and delineation of the Warm Creek subbasin, Nooksack River basin, Washington …………………………………… 18
Figure 7. Photographs showing view looking upstream (A) and downstream (B) from the U.S. Geological Survey streamflow-gaging station on Warm Creek near Welcome, Washington …………………………………………………………… 19
Figure 8. Satellite image showing oblique view and delineation of the Clearwater Creek subbasin, Nooksack River basin, Washington …………………………………… 20
Figure 9. Photographs showing view looking upstream (A) and downstream (B) from the U.S. Geological Survey streamflow-gaging station on Clear Water Creek near Welcome, Washington …………………………………………………… 21
Figure 10. Satellite image showing oblique view and delineation of the Skookum Creek subbasin, Nooksack River basin, Washington …………………………………… 22
Figure 11. Photographs showing view looking upstream (A) and downstream (B) from the U.S. Geological Survey streamflow-gaging station on Skookum Creek near Wickersham, Washington ……………………………………………………… 23
Figure 12. Satellite image showing oblique view and delineation of the Anderson Creek subbasin, Nooksack River basin, Washington …………………………………… 24
Figure 13. Photographs showing view looking upstream (A) and downstream (B) from the U.S. Geological Survey streamflow-gaging station on Anderson Creek near Goshen, Washington …………………………………………………………… 25
Figure 14. Satellite image showing oblique view and delineation of the Fishtrap Creek subbasin, Nooksack River basin, Washington …………………………………… 26
Figure 15. Photographs showing view looking upstream (A) and downstream (B) from the U.S. Geological Survey streamflow-gaging station on Fishtrap Creek near Lynden, Washington ……………………………………………………………… 27
Figure 16. Graph showing daily streamflow runoff at six streamflow-gaging stations in the Racehorse, Warm, Clearwater, Skookum, Anderson, and Fishtrap Creek subbasins, Nooksack River basin, Washington and Canada, water year 2003 …… 29
v
Figure 17. Graph showing fifteen-minute streamflow and average tau (τ) values during the period of July 11–31 at six gaging stations in the Racehorse, Warm, Clearwater, Skookum, Anderson, and Fishtrap Creek subbasins, Nooksack River basin, Washington and Canada ………………………………………………………… 30
Figure 18. Scatter plots and correlation coefficients (Pearson’s r) showing relation among the natural logs of daily mean streamflows during the summer, winter, and spring seasons at each of six gaging stations in the Racehorse, Warm, Clearwater, Skookum, Anderson, and Fishtrap Creek subbasins, Nooksack River basin, Washington and Canada …………………………………………… 31
Figure 19. Graph showing drainage area and mean basin elevation for all gaging stations used in the regional regression analysis for estimating low-flow frequency statistics at ungaged sites, Nooksack River basin, Washington and Canada …… 35
Figure 20. Graph showing Q90/Q50 ratios for all sites used in the regional regression analysis for estimating low-flow frequency statistics at ungaged sites, Nooksack River basin, Washington and Canada ………………………………… 36
Figure 21. Graph showing Q10/Q50 ratios for all sites used in the regional regression analysis for estimating low-flow frequency statistics at ungaged sites, Nooksack River basin, Washington and Canada ………………………………… 37
Figures—Continued
Tables Table 1. Streamflow-gaging stations and miscellaneous measurement sites in and
near the Nooksack River basin, Washington and Canada ………………………… 4 Table 2. Low-flow frequency statistics for continuous-record gaging stations and
miscellaneous measurement sites in and near the Nooksack River basin, Washington and Canada ………………………………………………………… 9
Table 3. Basin attributes and their source data considered in the regional regression analysis for estimating low-flow frequency statistics at ungaged sites, Nooksack River basin, Washington and Canada ………………………………… 10
Table 4. Basin attributes for continuous-record gaging stations and miscellaneous measurement sites used in the regional regression analysis for estimating low-flow frequency statistics at ungaged sites, Nooksack River basin, Washington and Canada ………………………………………………………… 11
Table 5. Regression equations for estimating low-flow frequency statistics at ungaged sites in the Nooksack River basin, Washington and Canada …………… 13
Table 6. Summary of correlation coefficients (Pearson’s r) showing patterns among the natural logs of daily mean streamflows at six gaging stations in the Racehorse, Warm, Clearwater, Skookum, Anderson, and Fishtrap Creek subbasins during summer, winter, and spring seasons, Nooksack River basin, Washington and Canada ………………………………………………………… 34
Table 7. Summary of results by method for determining optimal combinations of streamflow-gaging stations to retain in six subbasins, Nooksack River basin, Washington and Canada ………………………………………………………… 38
Table 8. Prioritized list of streamflow-gaging stations to retain in six subbasins of the Nooksack River basin, Washington and Canada ………………………………… 39
vi
Conversion Factors and Datums
Conversion Factors
Inch/Pound to SI
Multiply By To obtain
Length
inch (in.) 2.54 centimeter (cm)inch (in.) 25.4 millimeter (mm)foot (ft) 0.3048 meter (m)mile (mi) 1.609 kilometer (km)
Area
acre 4,047 square meter (m2)acre 0.4047 hectare (ha)acre 0.004047 square kilometer (km2) square mile (mi2) 259.0 hectare (ha)square mile (mi2) 2.590 square kilometer (km2)
Flow rate
cubic foot per second (ft3/s) 0.02832 cubic meter per second (m3/s)cubic foot per second per square
mile [(ft3/s)/mi2] 0.01093 cubic meter per second per square
kilometer [(m3/s)/km2]
Temperature in degrees Fahrenheit (°F) may be converted to degrees Celsius (°C) as follows:
°C=(°F-32)/1.8
Datums
Vertical coordinate information is referenced to the North American Vertical Datum of 1988 (NAVD 88).
Horizontal coordinate information is referenced to the North American Datum of 1983 (NAD 83).
Elevation, as used in this report, refers to distance above the vertical datum.
Estimating Low-Flow Frequency Statistics and Hydrologic Analysis of Selected Streamflow-Gaging Stations, Nooksack River Basin, Northwestern Washington and Canada
By Christopher A. Curran and Theresa D. Olsen
AbstractLow-flow frequency statistics were computed at
17 continuous-record streamflow-gaging stations and 8 miscellaneous measurement sites in and near the Nooksack River basin in northwestern Washington and Canada, including the 1, 3, 7, 15, 30, and 60 consecutive-day low flows with recurrence intervals of 2 and 10 years. Using these low-flow statistics, 12 regional regression equations were developed for estimating the same low-flow statistics at ungaged sites in the Nooksack River basin using a weighted-least-squares method. Adjusted R2 (coefficient of determination) values for the equations ranged from 0.79 to 0.93 and the root-mean-squared error (RMSE) expressed as a percentage ranged from 77 to 560 percent.
Streamflow records from six gaging stations located in mountain-stream or lowland-stream subbasins of the Nooksack River basin were analyzed to determine if any of the gaging stations could be removed from the network without significant loss of information. Using methods of hydrograph comparison, daily-value correlation, variable space, and flow-duration ratios, and other factors relating to individual subbasins, the six gaging stations were prioritized from most to least important as follows: Skookum Creek (12209490), Anderson Creek (12210900), Warm Creek (12207750), Fishtrap Creek (12212050), Racehorse Creek (12206900), and Clearwater Creek (12207850). The optimum streamflow-gaging station network would contain all gaging stations except Clearwater Creek, and the minimum network would include Skookum Creek and Anderson Creek.
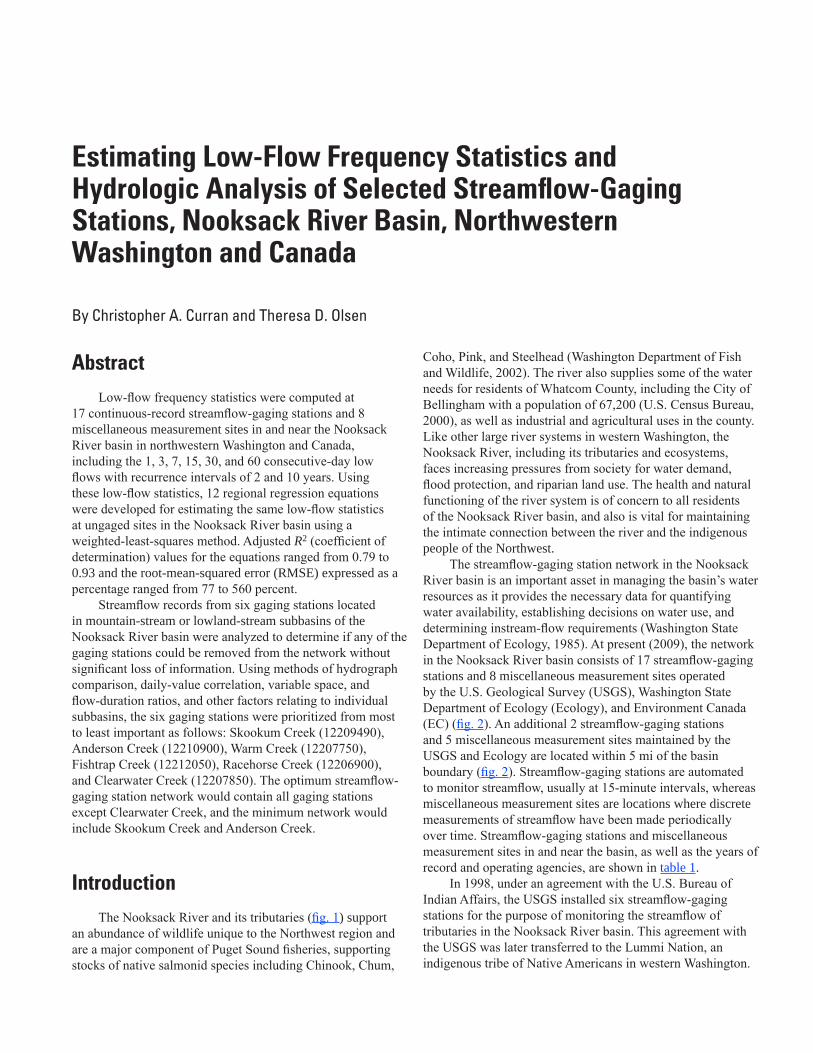
Introduction The Nooksack River and its tributaries (fig. 1) support
an abundance of wildlife unique to the Northwest region and are a major component of Puget Sound fisheries, supporting stocks of native salmonid species including Chinook, Chum,
Coho, Pink, and Steelhead (Washington Department of Fish and Wildlife, 2002). The river also supplies some of the water needs for residents of Whatcom County, including the City of Bellingham with a population of 67,200 (U.S. Census Bureau, 2000), as well as industrial and agricultural uses in the county. Like other large river systems in western Washington, the Nooksack River, including its tributaries and ecosystems, faces increasing pressures from society for water demand, flood protection, and riparian land use. The health and natural functioning of the river system is of concern to all residents of the Nooksack River basin, and also is vital for maintaining the intimate connection between the river and the indigenous people of the Northwest.
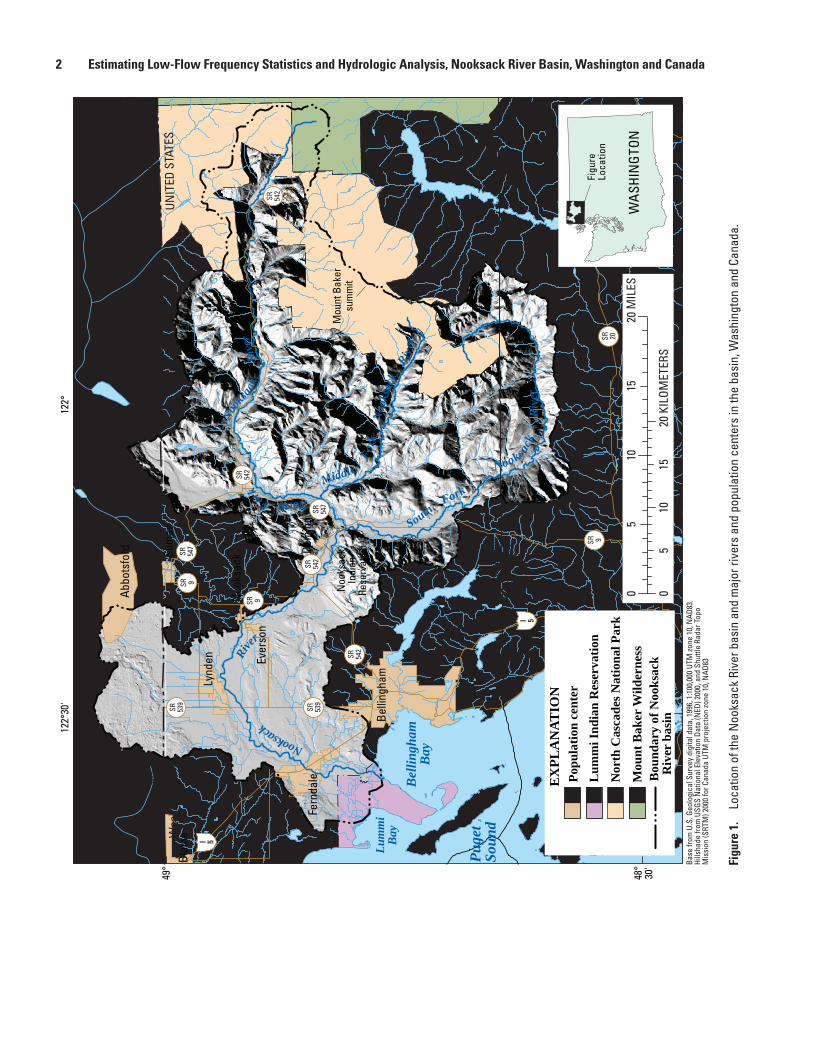
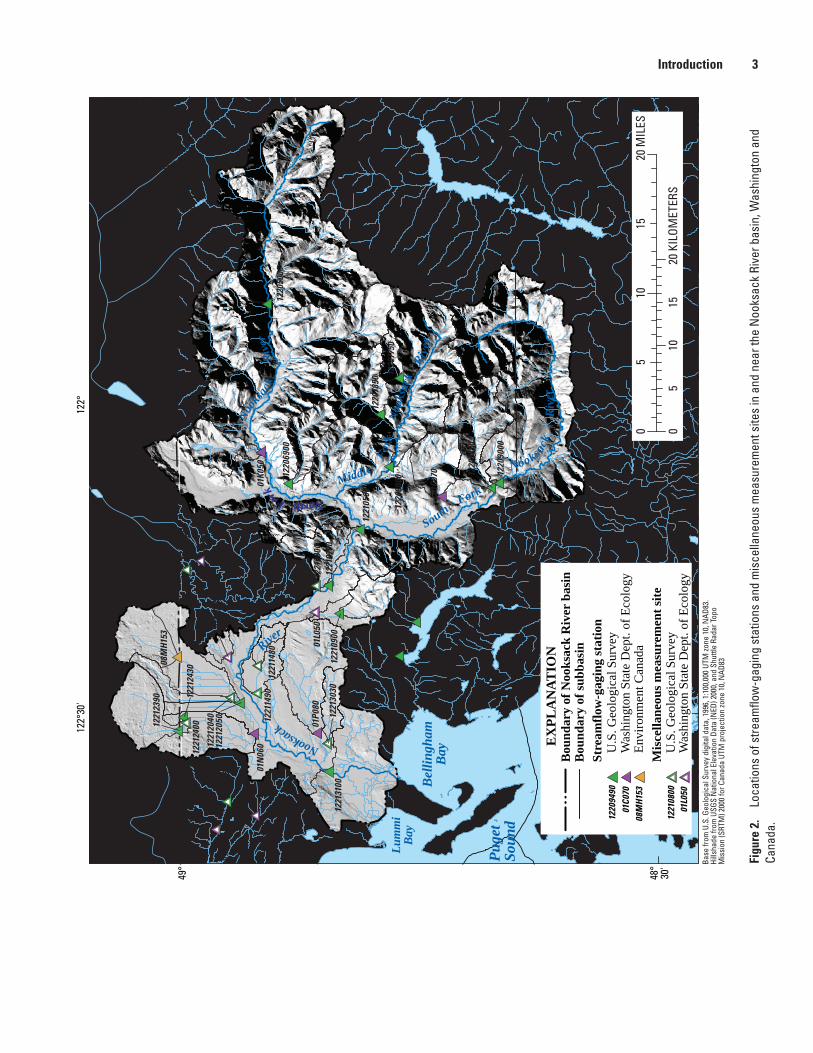
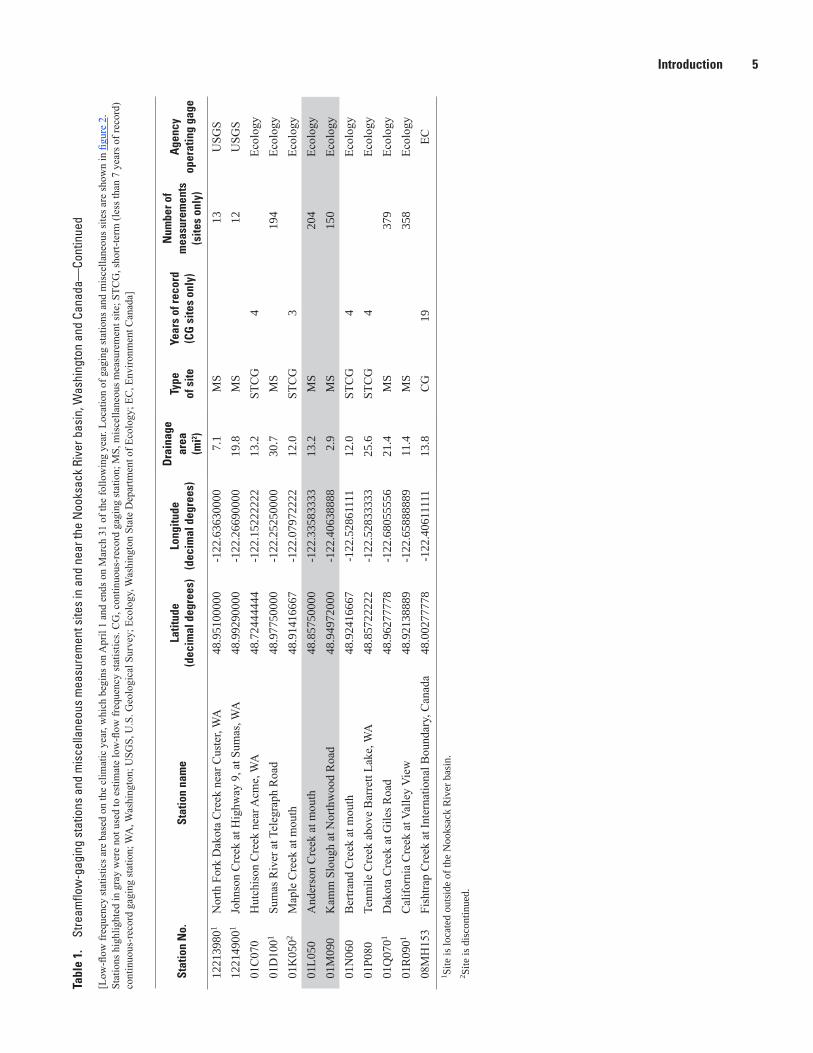
The streamflow-gaging station network in the Nooksack River basin is an important asset in managing the basin’s water resources as it provides the necessary data for quantifying water availability, establishing decisions on water use, and determining instream-flow requirements (Washington State Department of Ecology, 1985). At present (2009), the network in the Nooksack River basin consists of 17 streamflow-gaging stations and 8 miscellaneous measurement sites operated by the U.S. Geological Survey (USGS), Washington State Department of Ecology (Ecology), and Environment Canada (EC) (fig. 2). An additional 2 streamflow-gaging stations and 5 miscellaneous measurement sites maintained by the USGS and Ecology are located within 5 mi of the basin boundary (fig. 2). Streamflow-gaging stations are automated to monitor streamflow, usually at 15-minute intervals, whereas miscellaneous measurement sites are locations where discrete measurements of streamflow have been made periodically over time. Streamflow-gaging stations and miscellaneous measurement sites in and near the basin, as well as the years of record and operating agencies, are shown in table 1.
In 1998, under an agreement with the U.S. Bureau of Indian Affairs, the USGS installed six streamflow-gaging stations for the purpose of monitoring the streamflow of tributaries in the Nooksack River basin. This agreement with the USGS was later transferred to the Lummi Nation, an indigenous tribe of Native Americans in western Washington.
2 Estimating Low-Flow Frequency Statistics and Hydrologic Analysis, Nooksack River Basin, Washington and Canada
tac09-0390 NookLocation_Fig 01
I 5
I 5
SR 542
SR 542
SR 20
SR 542
SR 542
SR 9
SR 9
SR 9
SR 547
SR 547
SR 539
SR 539
Belli
ngha
m
Bel
lingh
amB
ay
Lum
mi
Bay
Blai
ne
Fern
dale
Lynd
en
Sum
as
Abbo
tsfo
rd
Ever
son
Dem
ing
Noo
ksac
k
Noo
ksac
kIn
dian
Rese
rvat
ion
Mou
nt B
aker
sum
mit
Puge
tSo
und
North Fork
N
ooks
ack
R
iver
Middle Fo
rk
Noo
ksac
k R
iver
South Fork
Nooksa
ck
R
iver
Nooksack
Ri
verW
ASH
ING
TON
Figu
reLo
catio
n
EX
PLA
NAT
ION
Nor
th C
asca
des N
atio
nal P
ark
Lum
mi I
ndia
n R
eser
vatio
nPo
pula
tion
cent
er
Mou
nt B
aker
Wild
erne
ss0
105
20 M
ILES
15
010
520
KIL
OMET
ERS
15B
ound
ary
of N
ooks
ack
Riv
er b
asin
Base
from
U.S
. Geo
logi
cal S
urve
y di
gita
l dat
a, 1
996,
1:1
00,0
00 U
TM zo
ne 1
0, N
AD83
.Hi
llsha
de fr
om U
SGS
Nat
iona
l Ele
vatio
n Da
ta (N
ED) 2
000,
and
Shu
ttle
Rada
r Top
oM
issi
on (S
RTM
) 200
0 fo
r Can
ada
UTM
pro
ject
ion
zone
10,
NAD
83
122°
30'
49°
48°
30'
122°
Briti
sh C
olum
bia
Was
hing
ton
Wha
tcom
Cou
nty
Skag
it Co
unty
CAN
ADA
UNIT
ED S
TATE
S
Figu
re 1
. Lo
catio
n of
the
Noo
ksac
k Ri
ver b
asin
and
maj
or ri
vers
and
pop
ulat
ion
cent
ers
in th
e ba
sin,
Was
hing
ton
and
Cana
da.
2 Estimating Low-Flow Frequency Statistics and Hydrologic Analysis, Nooksack River Basin, Washington and Canada Introduction 3
tac09-0390 NookLocation_Fig 02
Bel
lingh
amB
ay
Lum
mi
Bay
Puge
tSo
und
North Fork
N
ooks
ack
R
iver
Middle Fo
rk
Noo
ksac
k R
iver
South Fork
Nooksa
ck
R
iver
Nooksack
R
iver
010
520
MIL
ES15
010
520
KIL
OMET
ERS
15
122°
30'
49°
48°
30'
122°
Briti
sh C
olum
bia
Was
hing
ton
CAN
ADA
UNIT
ED S
TATE
S
Wha
tcom
Cou
nty
Skag
it Co
unty
EX
PLA
NAT
ION
U.S
. Geo
logi
cal S
urve
yW
ashi
ngto
n St
ate
Dep
t. of
Eco
logy
Envi
ronm
ent C
anad
a
Was
hing
ton
Stat
e D
ept.
of E
colo
gyU
.S. G
eolo
gica
l Sur
vey
Bou
ndar
y of
Noo
ksac
k R
iver
bas
inB
ound
ary
of su
bbas
in
1220
9490
08M
H153
01C0
70
1221
0800
01L0
50
Mis
cella
neou
s mea
sure
men
t site
Stre
amflo
w-g
agin
g st
atio
n
01Q
070
1221
3980
01R0
90
1220
2450
1220
2300
1221
4900
01D1
0012
2124
00
1221
2040
1221
2050
01M
090
1221
1490
1221
1480
01P0
80
1221
3100
1221
3030
1221
0900
1221
0500
1221
0800
1221
0700
1220
6900
01K0
50
1220
8000
01C0
70 1220
9490
1220
9000
1220
7850
1220
7750
1220
5000
1221
2390 12
2124
30
01L0
50
01N
060
08M
H153
Base
from
U.S
. Geo
logi
cal S
urve
y di
gita
l dat
a, 1
996,
1:1
00,0
00 U
TM zo
ne 1
0, N
AD83
.Hi
llsha
de fr
om U
SGS
Nat
iona
l Ele
vatio
n Da
ta (N
ED) 2
000,
and
Shu
ttle
Rada
r Top
oM
issi
on (S
RTM
) 200
0 fo
r Can
ada
UTM
pro
ject
ion
zone
10,
NAD
83
Figu
re 2
. Lo
catio
ns o
f stre
amflo
w-g
agin
g st
atio
ns a
nd m
isce
llane
ous
mea
sure
men
t site
s in
and
nea
r the
Noo
ksac
k Ri
ver b
asin
, Was
hing
ton
and
Cana
da.
4 Estimating Low-Flow Frequency Statistics and Hydrologic Analysis, Nooksack River Basin, Washington and CanadaTa
ble
1.
Stre
amflo
w-g
agin
g st
atio
ns a
nd m
isce
llane
ous
mea
sure
men
t site
s in
and
nea
r the
Noo
ksac
k Ri
ver b
asin
, Was
hing
ton
and
Cana
da.
[Low
-flow
freq
uenc
y st
atis
tics a
re b
ased
on
the
clim
atic
yea
r, w
hich
beg
ins o
n A
pril
1 an
d en
ds o
n M
arch
31
of th
e fo
llow
ing
year
. Loc
atio
n of
gag
ing
stat
ions
and
mis
cella
neou
s site
s are
show
n in
figu
re 2
. St
atio
ns h
ighl
ight
ed in
gra
y w
ere
not u
sed
to e
stim
ate
low
-flow
freq
uenc
y st
atis
tics.
CG
, con
tinuo
us-r
ecor
d ga
ging
stat
ion;
MS,
mis
cella
neou
s mea
sure
men
t site
; STC
G, s
hort-
term
(les
s tha
n 7
year
s of r
ecor
d)co
ntin
uous
-rec
ord
gagi
ng st
atio
n; W
A, W
ashi
ngto
n; U
SGS,
U.S
. Geo
logi
cal S
urve
y; E
colo
gy, W
ashi
ngto
n St
ate
Dep
artm
ent o
f Eco
logy
; EC
, Env
ironm
ent C
anad
a]
Stat
ion
No.
Stat
ion
nam
eLa
titud
e
(dec
imal
deg
rees
)Lo
ngitu
de
(dec
imal
deg
rees
)
Dra
inag
e ar
ea
(mi2 )
Type
of
site
Year
s of
reco
rd(C
G s
ites
only
)
Num
ber o
f m
easu
rem
ents
(s
ites
only
)
Age
ncy
oper
atin
g ga
ge
1220
2300
1O
lsen
Cre
ek n
ear B
ellin
gham
, WA
48.7
5122
213
-122
.353
4975
83.
9C
G7
U
SGS
1220
2450
1Si
lver
Bea
ch C
reek
at M
ayna
rd P
lace
, at
Bel
lingh
am, W
A48
.769
2772
1-1
22.4
0655
473
1.1
STC
G6
USG
S
1220
5000
Nor
th F
ork
Noo
ksac
k R
iver
bel
ow C
asca
de
Cre
ek, n
ear G
laci
er, W
A48
.905
9573
9-1
21.8
4431
036
105
CG
70
USG
S
1220
6900
Rac
ehor
se C
reek
at N
orth
For
k R
oad,
nea
r K
enda
ll, W
A48
.884
8419
6-1
22.1
3320
746
10.5
CG
9
USG
S
1220
7750
War
m C
reek
nea
r Wel
com
e, W
A48
.767
3399
3-1
21.9
6459
472
4.3
CG
9
USG
S12
2078
50C
lear
wat
er C
reek
nea
r Wel
com
e, W
A48
.788
4510
1-1
22.0
2292
921
18.9
CG
7
USG
S12
2080
00M
iddl
e Fo
rk N
ooks
ack
Riv
er n
ear D
emin
g, W
A48
.779
2828
2-1
22.1
0654
341
73.3
CG
15
USG
S12
2090
00So
uth
Fork
Noo
ksac
k R
iver
nea
r Wic
kers
ham
,WA
48.6
6427
931
-122
.133
4885
610
3C
G55
U
SGS
1220
9490
Skoo
kum
Cre
ek a
bove
div
ersi
on, n
ear
Wic
kers
ham
, WA
48.6
7150
163
-122
.139
5999
822
.4C
G9
U
SGS
1221
0500
2N
ooks
ack
Riv
er a
t Dem
ing,
WA
48.8
1039
369
-122
.204
8790
158
4C
G61
U
SGS
1221
0700
Noo
ksac
k R
iver
at N
orth
Ced
arvi
lle, W
A48
.841
9444
4-1
22.2
9305
555
589
STC
G2
USG
S12
2108
00Sm
ith C
reek
nea
r Gos
hen,
WA
48.8
5570
000
-122
.294
1000
011
..5M
S
13U
SGS
1221
0900
And
erso
n C
reek
at S
mith
Roa
d, n
ear G
oshe
n, W
A48
.832
6141
4-1
22.3
3905
016
9.0
CG
9
USG
S12
2114
80Sc
ott C
reek
at T
heil
Roa
d, n
ear L
ynde
n, W
A48
.918
1000
0-1
22.4
1980
000
3.4
MS
12
USG
S12
2114
90Sc
ott C
reek
at B
lysm
a R
oad,
nea
r Lyn
den,
WA
48.9
1900
000
-122
.463
7000
010
.4M
S8
USG
S12
2120
40Pe
pin
Cre
ek a
t Lyn
den,
WA
48.9
4670
000
-122
.468
6000
06.
1M
S
11U
SGS
1221
2050
Fish
trap
Cre
ek a
t Fro
nt S
treet
, at L
ynde
n, W
A48
.938
7257
4-1
22.4
7905
316
36.9
CG
9
USG
S12
2123
90B
ertra
nd C
reek
at I
nter
natio
nal B
ound
ary
49.0
0250
000
-122
.521
9444
017
.4ST
CG
1U
SGS
1221
2400
Ber
trand
Cre
ek a
t Ber
trand
H S
treet
Brid
ge, n
ear
Lynd
en, W
A48
.993
3000
0-1
22.5
0940
000
18.0
MS
13
USG
S
1221
2430
Unn
amed
Trib
utar
y to
Ber
trand
Cre
ek, n
ear H
St
reet
, nea
r Lyn
den,
WA
48.9
8333
333
-122
.500
0000
00.
9ST
CG
1U
SGS
1221
3030
Dee
r Cre
ek n
ear F
ernd
ale,
WA
48.8
4510
000
-122
.545
1000
06.
4M
S
12U
SGS
1221
3100
Noo
ksac
k R
iver
at F
ernd
ale,
WA
48.8
4483
249
-122
.589
3389
078
6C
G41
U
SGS
4 Estimating Low-Flow Frequency Statistics and Hydrologic Analysis, Nooksack River Basin, Washington and Canada Introduction 5Ta
ble
1.
Stre
amflo
w-g
agin
g st
atio
ns a
nd m
isce
llane
ous
mea
sure
men
t site
s in
and
nea
r the
Noo
ksac
k Ri
ver b
asin
, Was
hing
ton
and
Cana
da—
Cont
inue
d
[Low
-flow
freq
uenc
y st
atis
tics a
re b
ased
on
the
clim
atic
yea
r, w
hich
beg
ins o
n A
pril
1 an
d en
ds o
n M
arch
31
of th
e fo
llow
ing
year
. Loc
atio
n of
gag
ing
stat
ions
and
mis
cella
neou
s site
s are
show
n in
figu
re 2
. St
atio
ns h
ighl
ight
ed in
gra
y w
ere
not u
sed
to e
stim
ate
low
-flow
freq
uenc
y st
atis
tics.
CG
, con
tinuo
us-r
ecor
d ga
ging
stat
ion;
MS,
mis
cella
neou
s mea
sure
men
t site
; STC
G, s
hort-
term
(les
s tha
n 7
year
s of r
ecor
d)
cont
inuo
us-r
ecor
d ga
ging
stat
ion;
WA
, Was
hing
ton;
USG
S, U
.S. G
eolo
gica
l Sur
vey;
Eco
logy
, Was
hing
ton
Stat
e D
epar
tmen
t of E
colo
gy; E
C, E
nviro
nmen
t Can
ada]
Stat
ion
No.
Stat
ion
nam
eLa
titud
e
(dec
imal
deg
rees
)Lo
ngitu
de
(dec
imal
deg
rees
)
Dra
inag
e ar
ea
(mi2 )
Type
of
site
Year
s of
reco
rd(C
G s
ites
only
)
Num
ber o
f m
easu
rem
ents
(s
ites
only
)
Age
ncy
oper
atin
g ga
ge
1221
3980
1N
orth
For
k D
akot
a C
reek
nea
r Cus
ter,
WA
48.9
5100
000
-122
.636
3000
07.
1M
S
13U
SGS
1221
4900
1Jo
hnso
n C
reek
at H
ighw
ay 9
, at S
umas
, WA
48.9
9290
000
-122
.266
9000
019
.8M
S
12U
SGS
01C
070
Hut
chis
on C
reek
nea
r Acm
e, W
A48
.724
4444
4-1
22.1
5222
222
13.2
STC
G4
Ec
olog
y01
D10
01Su
mas
Riv
er a
t Tel
egra
ph R
oad
48.9
7750
000
-122
.252
5000
030
.7M
S
194
Ecol
ogy
01K
0502
Map
le C
reek
at m
outh
48.9
1416
667
-122
.079
7222
212
.0ST
CG
3
Ecol
ogy
01L0
50A
nder
son
Cre
ek a
t mou
th48
.857
5000
0-1
22.3
3583
333
13.2
MS
20
4Ec
olog
y01
M09
0K
amm
Slo
ugh
at N
orth
woo
d R
oad
48.9
4972
000
-122
.406
3888
82.
9M
S
150
Ecol
ogy
01N
060
Ber
trand
Cre
ek a
t mou
th48
.924
1666
7-1
22.5
2861
111
12.0
STC
G4
Ec
olog
y01
P080
Tenm
ile C
reek
abo
ve B
arre
tt La
ke, W
A48
.857
2222
2-1
22.5
2833
333
25.6
STC
G4
Ec
olog
y01
Q07
01D
akot
a C
reek
at G
iles R
oad
48.9
6277
778
-122
.680
5555
621
.4M
S
379
Ecol
ogy
01R
0901
Cal
iforn
ia C
reek
at V
alle
y V
iew
48.9
2138
889
-122
.658
8888
911
.4M
S
358
Ecol
ogy
08M
H15
3Fi
shtra
p C
reek
at I
nter
natio
nal B
ound
ary,
Can
ada
48.0
0277
778
-122
.406
1111
113
.8C
G19
EC
1 Site
is lo
cate
d ou
tsid
e of
the
Noo
ksac
k R
iver
bas
in.
2 Site
is d
isco
ntin
ued.
6 Estimating Low-Flow Frequency Statistics and Hydrologic Analysis, Nooksack River Basin, Washington and Canada
The Lummi Nation has funded the operation of the six streamflow-gaging stations from 2000 to the present (2009) and has requested that the USGS provide an analysis of the accumulated data with a focus on low flows, as well as determine whether some of the six stations could be removed from the network without significant loss of information.
Purpose and Scope
This report summarizes streamflow data collected in the Nooksack River basin, including data from six gaging stations funded by the Lummi Nation for the purpose of developing regional regression equations to estimate low-flow frequency statistics at ungaged sites. The report also evaluates the redundancy in streamflow data between the six gaging stations and their importance for developing future regional regression equations.
Low-flow frequency statistics, such as the 7Q10 (defined as the mean low streamflow that occurs over 7 consecutive days with a 10-year recurrence interval) were calculated for 17 of the streamflow-gaging stations in and near the basin. These statistics also were estimated for 8 miscellaneous measurement sites based on concurrent streamflow at index sites (gaging stations that are nearby or hydrologically similar) using established methods. Subbasin drainage areas were then delineated upstream of all streamflow sites in the study and basin attributes such as mean annual precipitation, percent forest cover, and percent surficial geology classified as bedrock, were determined using Geographic Information System (GIS) methods.
Using the statistics and basin attributes determined for all streamflow sites in the network, regional regression equations were developed for estimating low-flow frequency statistics at ungaged streams in the Nooksack River basin. Performance metrics such as the root-mean-squared error (RMSE) and the adjusted coefficient of determination (R2 adjusted) were calculated for each of the regression equations developed.
In evaluating the six streamflow-gaging stations funded by the Lummi Nation, the subbasins for each of the gaging stations were characterized based on land use, channel processes, and the stream hydrograph. The Pearson’s correlation coefficient, r, was examined between the seasonal daily mean streamflow records for each of the gaging stations to show where redundancy in daily streamflow information exists. The basin attributes for each gaging station as well as flow-duration ratios and variable space methods were examined to qualitatively assess the priority of each of the six gaging stations for remaining in the overall streamflow-gaging station network for the basin.
Description of Study Area
Located primarily in northwestern Washington, the Nooksack River basin (fig. 1) encompasses 822 mi2 of mostly forested land, and ranges in elevation from 10,800 ft, the
summit of Mount Baker in the Cascade Range, to sea level at the shores of Puget Sound. The Nooksack River is the product of three major tributaries: the North Fork, Middle Fork, and South Fork Nooksack Rivers (fig. 1). The largest of these is the North Fork, and when added to the length of the mainstem, the entire river runs westward about 75 river miles from its headwaters in the mountains to Puget Sound. The basin is bounded to the north by mountains forming the Fraser River valley in Canada and to the south by mountains forming the Skagit River valley. Of all Washington State rivers flowing into Puget Sound, the Nooksack River is the third largest, with an average streamflow of 3,840 ft3/s (U.S. Geological Survey, 2008).
The Nooksack River basin connects the contrasting landscapes of a tectonically and volcanically active mountain range and glaciated lowland. The Cascade Range is a magmatic arc formed by the subduction of an oceanic plate beneath the continental crust and its western edge is an assemblage of sedimentary and volcanic rocks of Eocene through early Miocene age (Jones, 1999). The comparatively flat Puget Lowland lies within the forearc basin formed between the colliding plates and has been largely sculpted by numerous Pleistocene glaciations which deposited thick sedimentary layers of glacial outwash, interspersed with finer layers of till (Dragovich and others, 1997b). Present-day surficial geology in the basin reflects the history of mountain-building, erosional processes such as landslides and lahars, and fluvial processes that erode, transport and deposit sediment in post-glacial terrain (Linneman and others, 2007).
Climate in the region is maritime and heavily influenced by moist, offshore weather patterns originating in the Pacific Ocean and moving inland. The region receives about 67 percent of annual precipitation from October to March (National Oceanic and Atmospheric Administration, 2007), with orographic uplift causing more precipitation at high elevations, often as snow in the mountains. Winters in the region typically are wet and mild in the lowland, while summers are warmer and relatively dry. During the most recent climate-normal period (1971–2000), mean annual precipitation in the Nooksack River basin was about 90 in. and ranged from about 32 in. near the mouth of the river to about 220 in. near the crest of Mount Baker (PRISM Climate Group, 1998).
About 70 percent of the Nooksack River basin is forested (primarily by coniferous trees in the mountains) while in the lowland, agriculture (crops and dairy) is the dominant land use accounting for 16 percent of total land cover (Multi-Resolution Land Characteristics Consortium, 2001). Urbanized areas in the basin are largely concentrated in or around the population centers of Ferndale, Lynden, Bellingham (which is largely outside of the basin), and Abbotsford, British Columbia. The population in the Nooksack River basin was about 55,000 in 2000 and increased about 25 percent from 1990 to 2000 (U.S. Census Bureau, 2000).
6 Estimating Low-Flow Frequency Statistics and Hydrologic Analysis, Nooksack River Basin, Washington and Canada Low-Flow Frequency Statistics at Continuous-Record Gaging Stations and Miscellaneous Measurement Sites 7
Previous Investigations
The earliest investigation of low-flow characteristics for streams in the Puget Sound region was conducted by Hidaka (1973). In that study, streamflow records from 150 gaging stations throughout the Puget Sound region were used to determine low-flow frequency statistics. Indexes such as the low-flow yield index (ratio of 7Q2 to drainage area, where the 7Q2 is defined as the mean low streamflow that occurs over 7 consecutive days with a 2-year recurrence interval) and the base-flow index (ratio of 7Q2 to mean annual streamflow) also were calculated and related qualitatively to basin characteristics such as climate, topography, and geology. Subsequent researchers determined low-flow frequency curves for streams in selected areas of western Washington such as the Olympic and Kitsap Peninsulas, and used simple regression methods to estimate low-flow frequency statistics at miscellaneous measurement sites (Cummans, 1976; Haushild and LaFrance, 1977).
Although no previous studies have documented the development of regional regression equations for estimating low-flow frequency statistics at ungaged sites in western Washington, numerous such studies have recently been conducted throughout the country at the State-wide scale (Ries and Friesz, 2000; Hortness, 2006; Funkhouser and others, 2008; and Risley and others, 2008).
Low-Flow Frequency Statistics at Continuous-Record Gaging Stations and Miscellaneous Measurement Sites
Low-flow frequency statistics are useful for estimating the probability of water availability in streams during critical low-flow periods when conflicting demands for water, for example the demands of water supply versus ecosystem needs, are likely to exist. These statistics commonly are used by Federal, State and local agencies in water-use planning and management, as well as in establishing regulatory policies relating to instream flows and water quality. Low-flow frequency statistics such as the 7Q10 (defined as the mean low streamflow that occurs over 7 consecutive days with a 10-year recurrence interval) are determined from the mean of consecutive-day low flows of a particular stream, usually during a climatic year (April 1 through March 31 of the following year) to avoid artificially separating low-flow periods by water year. The recurrence interval of a particular consecutive-day low-flow event is calculated by fitting the annual low-flow series to a log-Pearson Type III distribution (Riggs, 1972). In general, it is desirable to compute low-flow frequency statistics such as the 7Q10 at streamflow-gaging stations with 10 or more years of streamflow record, although previous studies have made exceptions based on the
range of streamflow conditions during the period of record (Hortness, 2006). When the streamflow record for a gaging station satisfies a length-of-record criterion, it is considered a continuous-record gaging station (CG), and a streamflow record that falls short of the criterion is referred to as a ‘short-term’ continuous-record gaging station (STCG) (Ries and Friesz, 2000). Low-flow frequency statistics also can be estimated at miscellaneous measurement sites provided that a sufficient number of measurements have been made during baseflow periods (Funkhouser and others, 2008; Risley and others, 2008). Whereas low-flow frequency statistics can be computed directly from the record of daily streamflow at a CG station, additional methods must be used to estimate similar statistics at miscellaneous measurement sites.
In western Washington, most annual consecutive-day low flows occur during the late summer or early autumn, and in small or intermittent streams, low-flow frequency statistics can have values of zero. In this study, low-flow frequency statistics were determined at 15 streamflow-gaging stations in the Nooksack River basin, 2 gaging stations just outside of the basin, and 8 miscellaneous measurement sites. Because of the limited number of gaging stations in the Nooksack River basin, CG stations in this study were defined as gaging stations with 7 or more years of record covering a broad range of streamflow conditions, and stations with less than 7 years of record were defined as STCG stations. All miscellaneous measurement sites with 10 or more measurements made during baseflow periods were initially considered in the analysis. Stations with known upstream diversions or significant regulation were not included in the analysis. For example, USGS gaging station 12208000 on the Middle Fork of the Nooksack River was not included because significant withdrawals for water supply are made upstream of the gaging station. At stations where small upstream diversions or regulation may exist but are undocumented (for example, stations in the lowland areas where irrigation uses may occur), low-flow frequency statistics were determined and used in the analysis based on the assumption that effects of the upstream modifications were minor. The presence of trends in streamflow data in the Nooksack River basin was not tested in this analysis and it was assumed that the annual low flows recorded at individual stations are independent and representative of long-term streamflow conditions.
At STCG stations, the streamflow record was extended to 7 years using the Maintenance of Variance Extension version 1.0 (MOVE.1) statistical method (Hirsch, 1982). In this method, a log-linear relation of daily streamflow was developed based on the overlapping streamflow records of the STCG station and a nearby or hydrologically similar CG station with a longer record (also referred to as an index station). The relation between daily streamflow at both stations was used to extend the record at the STCG station. Unlike a simple linear regression, which results in streamflow estimates that are biased low in their variance, MOVE.1 preserves the probability distribution of the estimates (Hirsch, 1982).
8 Estimating Low-Flow Frequency Statistics and Hydrologic Analysis, Nooksack River Basin, Washington and Canada
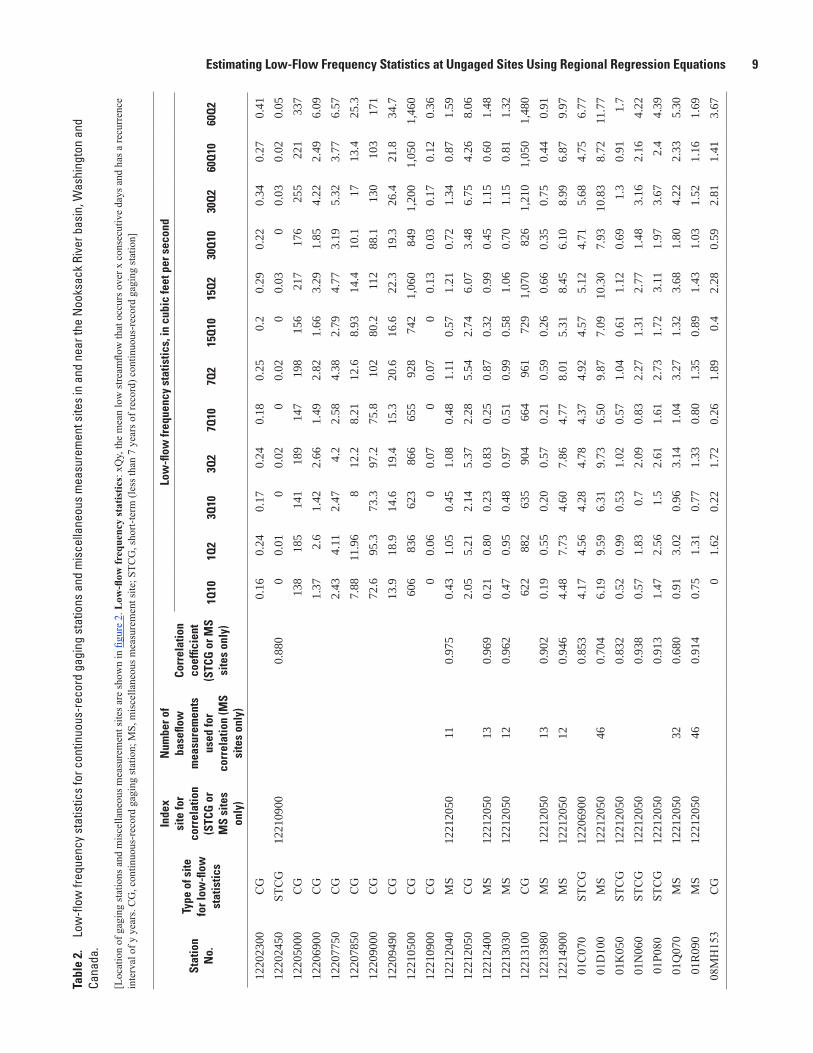
At miscellaneous measurement sites, the MOVE.1 method also was used to estimate streamflow statistics (such as the 7Q10) based on the log-linear relation between 10 or more streamflow measurements at the miscellaneous measurement site and concurrent flows at an index station. The calculated low-flow frequency statistics for 12 CG stations, 5 STCG stations, and 8 miscellaneous measurement sites are shown in table 2.
Estimating Low-Flow Frequency Statistics at Ungaged Sites Using Regional Regression Equations
Water managers, regulators, and scientists are often interested in streamflow information at locations in a stream network for which measurements do not exist. The development of regional regression equations for the purpose of estimating streamflow statistics at ungaged sites is a common practice and has been well documented in previous studies in the Pacific Northwest (Hortness, 2006; Risley and others, 2008) and throughout the United States (Ries and Friesz, 2000; Funkhouser and others, 2008). Ideally, the development of regional regression equations involves an existing network of many streamflow-gaging stations with long periods of record for which accurate streamflow statistics of natural flow conditions can be determined. In practice, the number of gaging stations representing natural flow conditions is limited, the gaging-station network is often biased toward representing larger streams or rivers and the geographic placement of the network is unevenly distributed.
For the Nooksack River basin, regional regression equations were developed for estimating the low-flow frequency statistics for the 1, 3, 7, 15, 30, and 60 consecutive-day low flows with recurrence intervals of 2 and 10 years at ungaged sites in the basin. All equations were developed from the streamflow statistics previously determined at 12 CG stations, 5 STCG stations, and 8 miscellaneous measurement sites, and the basin characteristics at each site.
Methods of Regression
Multiple linear regression methods were used to develop relations between streamflow statistics such as the 7Q10 (the 7-day low-flow with a 10-year recurrence interval), and the 30Q2 (the 30-day low flow with a 2-year recurrence interval) and basin characteristics such as drainage area and mean basin elevation. The weighted-multiple-linear-regression model (WREG) software (Ken Eng, U.S. Geological Survey, written comm., 2009) was used to develop the regression equations and three types of multiple linear regression methods were considered—ordinary least squares (OLS), weighted-least squares (WLS), and generalized-least squares (GLS). The most common regression method, OLS, assumes
that streamflow statistics from all sites are equivalent in accuracy. However, low-flow frequency statistics computed from continuous-record gaging stations with longer periods of record are likely to be more accurate than statistics from stations with shorter periods of record, and continuous-record stations of any length are likely to be more accurate than statistics estimated at miscellaneous measurement sites. Because the streamflow sites on which the regression models are based are not equivalent in their periods of record, the OLS method was not used. The WLS and GLS methods are preferred for hydrologic regression equations because these methods allow for giving more weight (influence in shaping the regression model) to streamflow sites with more reliable statistics (longer record, smaller variance). In the GLS method, weight also is assigned based on the correlation (similarity) of streamflow records among sites. For example, sites in close proximity may respond similarly to hydrologic events compared to sites that are farther apart. In GLS, less weight is assigned to sites that are highly correlated, and more weight is given to sites that represent different hydrologic responses. When all sites are located in the same basin, substantial inherent correlation among sites reduces the power of the GLS method. This was observed among sites in the Nooksack River basin (particularly during the summer season) and for this reason, the WLS method was selected over the GLS method.
Basin Attributes
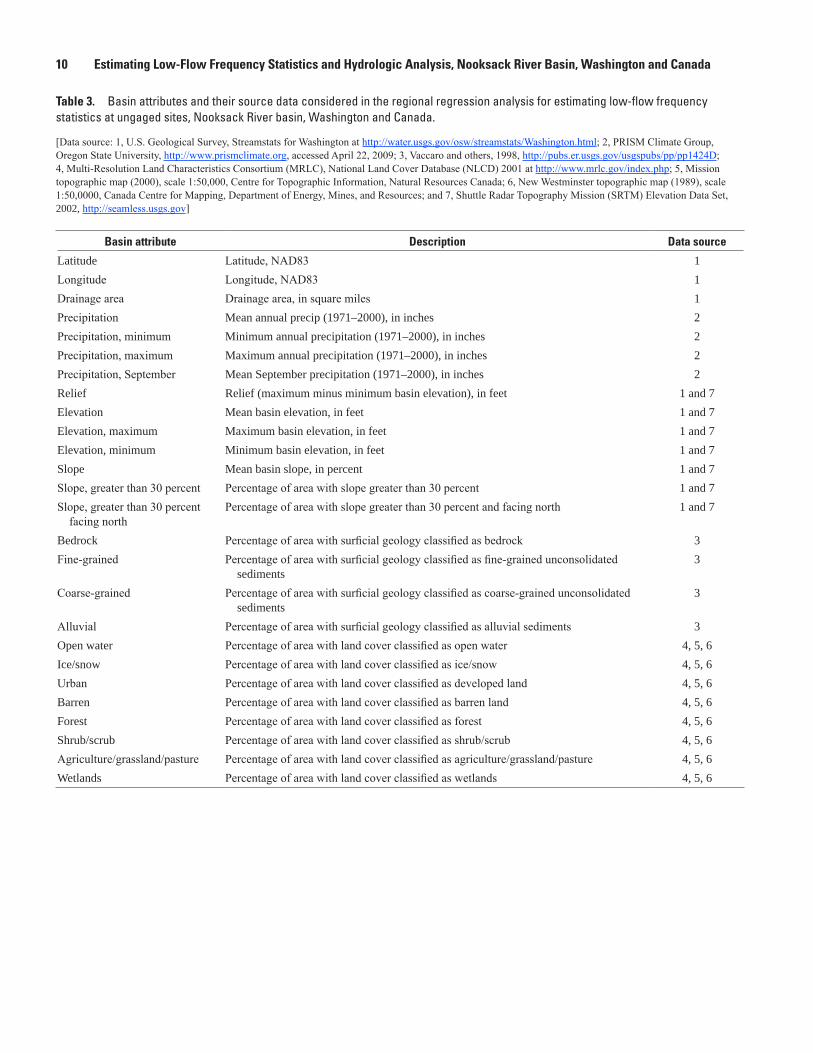
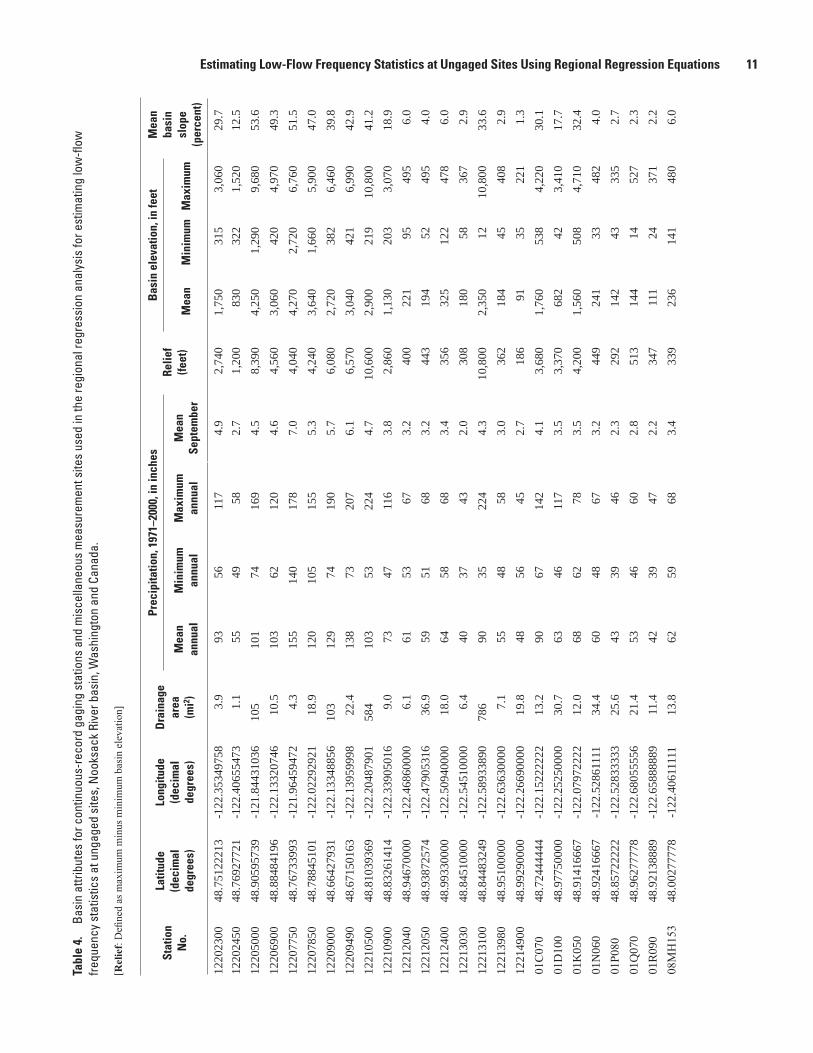
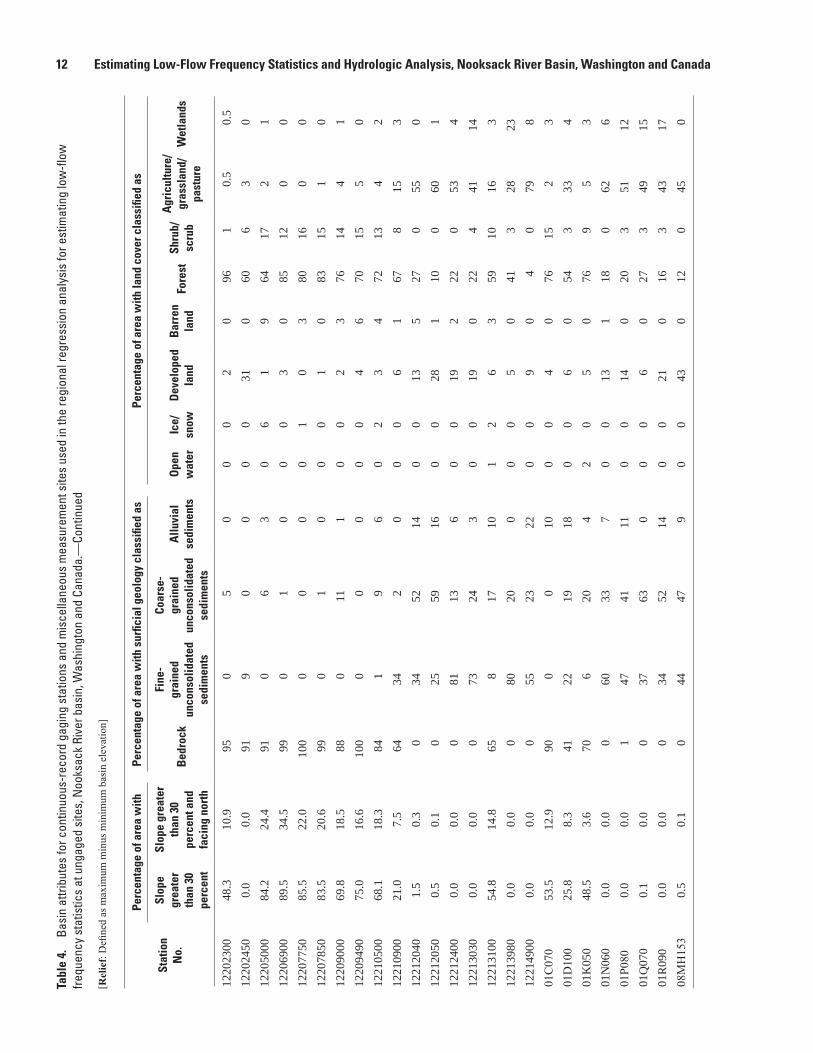
Basin attributes were derived from a combination of GIS-based sources and previous studies in the Puget Sound region. The data source for each basin attribute and the 26 attributes considered for use in the regression equations are shown in table 3. The basin attributes for all continuous-record gaging stations and miscellaneous measurement sites considered in this study are shown in table 4. Only a limited number of basin attributes were selected as explanatory variables in the final regression equations to avoid ‘over-fitting’ the model (that is, adding complexity without improving model performance). Some researchers have suggested limiting the number of explanatory variables in a regression equation to one variable for every 10–15 observations (Ken Eng, U.S. Geological Survey, oral commun., 2009), and this approach was used in the present study.
Basin attributes were first screened for multicollinearity, or the degree of correlation between explanatory variables, to determine which basin attributes should be incorporated into the regression equations. For example, a high correlation was found between the basin attributes of mean elevation and mean annual precipitation, likely due to orographic uplift that causes greater precipitation at high elevations. In this case, multicollinearity precludes both of these attributes from being used as variables in the same regression equation. Bivariate plots were then generated between streamflow statistics and basin attributes to determine if variable transformations, such as logarithms, would improve the linearity of relations.
8 Estimating Low-Flow Frequency Statistics and Hydrologic Analysis, Nooksack River Basin, Washington and Canada Estimating Low-Flow Frequency Statistics at Ungaged Sites Using Regional Regression Equations 9Ta
ble
2.
Low
-flow
freq
uenc
y st
atis
tics
for c
ontin
uous
-rec
ord
gagi
ng s
tatio
ns a
nd m
isce
llane
ous
mea
sure
men
t site
s in
and
nea
r the
Noo
ksac
k Ri
ver b
asin
, Was
hing
ton
and
Cana
da.
[Loc
atio
n of
gag
ing
stat
ions
and
mis
cella
neou
s mea
sure
men
t site
s are
show
n in
figu
re 2
. Low
-flow
freq
uenc
y st
atis
tics:
xQ
y, th
e m
ean
low
stre
amflo
w th
at o
ccur
s ove
r x c
onse
cutiv
e da
ys a
nd h
as a
recu
rren
ce
inte
rval
of y
yea
rs. C
G, c
ontin
uous
-rec
ord
gagi
ng st
atio
n; M
S, m
isce
llane
ous m
easu
rem
ent s
ite; S
TCG
, sho
rt-te
rm (l
ess t
han
7 ye
ars o
f rec
ord)
con
tinuo
us-r
ecor
d ga
ging
stat
ion]
Stat
ion
N
o.
Type
of s
ite
for l
ow-fl
ow
stat
istic
s
Inde
x si
te fo
r co
rrel
atio
n (S
TCG
or
MS
site
s on
ly)
Num
ber o
f ba
seflo
w
mea
sure
men
ts
used
for
corr
elat
ion
(MS
site
s on
ly)
Corr
elat
ion
coef
ficie
nt
(STC
G o
r MS
site
s on
ly)
Low
-flow
freq
uenc
y st
atis
tics,
in c
ubic
feet
per
sec
ond
1Q10
1Q2
3Q10
3Q2
7Q10
7Q2
15Q
1015
Q2
30Q
1030
Q2
60Q
1060
Q2
1220
2300
CG
0.16
0.24
0.17
0.24
0.18
0.25
0.2
0.29
0.22
0.34
0.27
0.41
1220
2450
STC
G12
2109
000.
880
00.
010
0.02
00.
020
0.03
00.
030.
020.
0512
2050
00C
G13
818
514
118
914
719
815
621
717
625
522
133
712
2069
00C
G1.
372.
61.
422.
661.
492.
821.
663.
291.
854.
222.
496.
0912
2077
50C
G2.
434.
112.
474.
22.
584.
382.
794.
773.
195.
323.
776.
5712
2078
50C
G7.
8811
.96
812
.28.
2112
.68.
9314
.410
.117
13.4
25.3
1220
9000
CG
72.6
95.3
73.3
97.2
75.8
102
80.2
112
88.1
130
103
171
1220
9490
CG
13.9
18.9
14.6
19.4
15.3
20.6
16.6
22.3
19.3
26.4
21.8
34.7
1221
0500
CG
606
836
623
866
655
928
742
1,06
084
91,
200
1,05
01,
460
1221
0900
CG
00.
060
0.07
00.
070
0.13
0.03
0.17
0.12
0.36
1221
2040
MS
1221
2050
110.
975
0.43
1.05
0.45
1.08
0.48
1.11
0.57
1.21
0.72
1.34
0.87
1.59
1221
2050
CG
2.05
5.21
2.14
5.37
2.28
5.54
2.74
6.07
3.48
6.75
4.26
8.06
1221
2400
MS
1221
2050
130.
969
0.21
0.80
0.23
0.83
0.25
0.87
0.32
0.99
0.45
1.15
0.60
1.48
1221
3030
MS
1221
2050
120.
962
0.47
0.95
0.48
0.97
0.51
0.99
0.58
1.06
0.70
1.15
0.81
1.32
1221
3100
CG
622
882
635
904
664
961
729
1,07
082
61,
210
1,05
01,
480
1221
3980
MS
1221
2050
130.
902
0.19
0.55
0.20
0.57
0.21
0.59
0.26
0.66
0.35
0.75
0.44
0.91
1221
4900
MS
1221
2050
120.
946
4.48
7.73
4.60
7.86
4.77
8.01
5.31
8.45
6.10
8.99
6.87
9.97
01C
070
STC
G12
2069
000.
853
4.17
4.56
4.28
4.78
4.37
4.92
4.57
5.12
4.71
5.68
4.75
6.77
01D
100
MS
1221
2050
460.
704
6.19
9.59
6.31
9.73
6.50
9.87
7.09
10.3
07.
9310
.83
8.72
11.7
701
K05
0ST
CG
1221
2050
0.83
20.
520.
990.
531.
020.
571.
040.
611.
120.
691.
30.
911.
701
N06
0ST
CG
1221
2050
0.93
80.
571.
830.
72.
090.
832.
271.
312.
771.
483.
162.
164.
2201
P080
STC
G12
2120
500.
913
1.47
2.56
1.5
2.61
1.61
2.73
1.72
3.11
1.97
3.67
2.4
4.39
01Q
070
MS
1221
2050
320.
680
0.91
3.02
0.96
3.14
1.04
3.27
1.32
3.68
1.80
4.22
2.33
5.30
01R
090
MS
1221
2050
460.
914
0.75
1.31
0.77
1.33
0.80
1.35
0.89
1.43
1.03
1.52
1.16
1.69
08M
H15
3C
G0
1.62
0.22
1.72
0.26
1.89
0.4
2.28
0.59
2.81
1.41
3.67
10 Estimating Low-Flow Frequency Statistics and Hydrologic Analysis, Nooksack River Basin, Washington and Canada
Table 3. Basin attributes and their source data considered in the regional regression analysis for estimating low-flow frequency statistics at ungaged sites, Nooksack River basin, Washington and Canada.
[Data source: 1, U.S. Geological Survey, Streamstats for Washington at http://water.usgs.gov/osw/streamstats/Washington.html; 2, PRISM Climate Group, Oregon State University, http://www.prismclimate.org, accessed April 22, 2009; 3, Vaccaro and others, 1998, http://pubs.er.usgs.gov/usgspubs/pp/pp1424D; 4, Multi-Resolution Land Characteristics Consortium (MRLC), National Land Cover Database (NLCD) 2001 at http://www.mrlc.gov/index.php; 5, Mission topographic map (2000), scale 1:50,000, Centre for Topographic Information, Natural Resources Canada; 6, New Westminster topographic map (1989), scale 1:50,0000, Canada Centre for Mapping, Department of Energy, Mines, and Resources; and 7, Shuttle Radar Topography Mission (SRTM) Elevation Data Set, 2002, http://seamless.usgs.gov]
Basin attribute Description Data source
Latitude Latitude, NAD83 1Longitude Longitude, NAD83 1Drainage area Drainage area, in square miles 1Precipitation Mean annual precip (1971–2000), in inches 2Precipitation, minimum Minimum annual precipitation (1971–2000), in inches 2Precipitation, maximum Maximum annual precipitation (1971–2000), in inches 2Precipitation, September Mean September precipitation (1971–2000), in inches 2Relief Relief (maximum minus minimum basin elevation), in feet 1 and 7Elevation Mean basin elevation, in feet 1 and 7Elevation, maximum Maximum basin elevation, in feet 1 and 7Elevation, minimum Minimum basin elevation, in feet 1 and 7Slope Mean basin slope, in percent 1 and 7Slope, greater than 30 percent Percentage of area with slope greater than 30 percent 1 and 7Slope, greater than 30 percent
facing northPercentage of area with slope greater than 30 percent and facing north 1 and 7
Bedrock Percentage of area with surficial geology classified as bedrock 3Fine-grained Percentage of area with surficial geology classified as fine-grained unconsolidated
sediments3
Coarse-grained Percentage of area with surficial geology classified as coarse-grained unconsolidated sediments
3
Alluvial Percentage of area with surficial geology classified as alluvial sediments 3Open water Percentage of area with land cover classified as open water 4, 5, 6Ice/snow Percentage of area with land cover classified as ice/snow 4, 5, 6Urban Percentage of area with land cover classified as developed land 4, 5, 6Barren Percentage of area with land cover classified as barren land 4, 5, 6Forest Percentage of area with land cover classified as forest 4, 5, 6Shrub/scrub Percentage of area with land cover classified as shrub/scrub 4, 5, 6Agriculture/grassland/pasture Percentage of area with land cover classified as agriculture/grassland/pasture 4, 5, 6Wetlands Percentage of area with land cover classified as wetlands 4, 5, 6
10 Estimating Low-Flow Frequency Statistics and Hydrologic Analysis, Nooksack River Basin, Washington and Canada Estimating Low-Flow Frequency Statistics at Ungaged Sites Using Regional Regression Equations 11Ta
ble
4.
Basi
n at
tribu
tes
for c
ontin
uous
-rec
ord
gagi
ng s
tatio
ns a
nd m
isce
llane
ous
mea
sure
men
t site
s us
ed in
the
regi
onal
regr
essi
on a
naly
sis
for e
stim
atin
g lo
w-fl
ow
frequ
ency
sta
tistic
s at
ung
aged
site
s, N
ooks
ack
Rive
r bas
in, W
ashi
ngto
n an
d Ca
nada
.
[Rel
ief:
Defi
ned
as m
axim
um m
inus
min
imum
bas
in e
leva
tion]
Stat
ion
N
o.
Latit
ude
(d
ecim
al
degr
ees)
Long
itude
(d
ecim
al
degr
ees)
Dra
inag
e ar
ea
(mi2 )
Prec
ipita
tion,
197
1–20
00, i
n in
ches
Relie
f (fe
et)
Bas
in e
leva
tion,
in fe
etM
ean
ba
sin
sl
ope
(per
cent
)M
ean
an
nual
Min
imum
an
nual
Max
imum
an
nual
Mea
n Se
ptem
ber
Mea
nM
inim
umM
axim
um
1220
2300
48.7
5122
213
-122
.353
4975
83.
993
5611
74.
9 2
,740
1
,750
3
15
3,0
60
29.7
1220
2450
48.7
6927
721
-122
.406
5547
31.
155
4958
2.7
1,2
00
830
3
22
1,5
20
12.5
1220
5000
48.9
0595
739
-121
.844
3103
610
510
174
169
4.5
8,3
90
4,2
50
1,2
90
9,6
80
53.6
1220
6900
48.8
8484
196
-122
.133
2074
610
.510
362
120
4.6
4,5
60
3,0
60
420
4
,970
49
.312
2077
5048
.767
3399
3-1
21.9
6459
472
4.3
155
140
178
7.0
4,0
40
4,2
70
2,7
20
6,7
60
51.5
1220
7850
48.7
8845
101
-122
.022
9292
118
.912
010
515
55.
3 4
,240
3
,640
1
,660
5
,900
47
.012
2090
0048
.664
2793
1-1
22.1
3348
856
103
129
7419
05.
7 6
,080
2
,720
3
82
6,4
60
39.8
1220
9490
48.6
7150
163
-122
.139
5999
822
.413
873
207
6.1
6,5
70
3,0
40
421
6
,990
42
.912
2105
0048
.810
3936
9-1
22.2
0487
901
584
103
5322
44.
7 1
0,60
0 2
,900
2
19
10,
800
41.2
1221
0900
48.8
3261
414
-122
.339
0501
69.
073
4711
63.
8 2
,860
1
,130
2
03
3,0
70
18.9
1221
2040
48.9
4670
000
-122
.468
6000
06.
161
5367
3.2
400
2
21
95
495
6.
012
2120
5048
.938
7257
4-1
22.4
7905
316
36.9
5951
683.
2 4
43
194
5
2 4
95
4.0
1221
2400
48.9
9330
000
-122
.509
4000
018
.064
5868
3.4
356
3
25
122
4
78
6.0
1221
3030
48.8
4510
000
-122
.545
1000
06.
440
3743
2.0
308
1
80
58
367
2.
912
2131
0048
.844
8324
9-1
22.5
8933
890
786
9035
224
4.3
10,
800
2,3
50
12
10,
800
33.6
1221
3980
48.9
5100
000
-122
.636
3000
07.
155
4858
3.0
362
1
84
45
408
2.
912
2149
0048
.992
9000
0-1
22.2
6690
000
19.8
4856
452.
7 1
86
91
35
221
1.
301
C07
048
.724
4444
4-1
22.1
5222
222
13.2
9067
142
4.1
3,6
80
1,7
60
538
4
,220
30
.101
D10
048
.977
5000
0-1
22.2
5250
000
30.7
6346
117
3.5
3,3
70
682
4
2 3
,410
17
.701
K05
048
.914
1666
7-1
22.0
7972
222
12.0
6862
783.
5 4
,200
1
,560
5
08
4,7
10
32.4
01N
060
48.9
2416
667
-122
.528
6111
134
.460
4867
3.2
449
2
41
33
482
4.
001
P080
48.8
5722
222
-122
.528
3333
325
.643
3946
2.3
292
1
42
43
335
2.
701
Q07
048
.962
7777
8-1
22.6
8055
556
21.4
5346
602.
8 5
13
144
1
4 5
27
2.3
01R
090
48.9
2138
889
-122
.658
8888
911
.442
3947
2.2
347
1
11
24
371
2.
208
MH
153
48.0
0277
778
-122
.406
1111
113
.862
5968
3.4
339
2
36
141
4
80
6.0
12 Estimating Low-Flow Frequency Statistics and Hydrologic Analysis, Nooksack River Basin, Washington and CanadaTa
ble
4.
Basi
n at
tribu
tes
for c
ontin
uous
-rec
ord
gagi
ng s
tatio
ns a
nd m
isce
llane
ous
mea
sure
men
t site
s us
ed in
the
regi
onal
regr
essi
on a
naly
sis
for e
stim
atin
g lo
w-fl
ow
frequ
ency
sta
tistic
s at
ung
aged
site
s, N
ooks
ack
Rive
r bas
in, W
ashi
ngto
n an
d Ca
nada
.—Co
ntin
ued
[Rel
ief:
Defi
ned
as m
axim
um m
inus
min
imum
bas
in e
leva
tion]
Stat
ion
N
o.
Perc
enta
ge o
f are
a w
ithPe
rcen
tage
of a
rea
with
sur
ficia
l geo
logy
cla
ssifi
ed a
sPe
rcen
tage
of a
rea
with
land
cov
er c
lass
ified
as
Slop
e
grea
ter
than
30
perc
ent
Slop
e gr
eate
r th
an 3
0
perc
ent a
nd
faci
ng n
orth
Bed
rock
Fine
- gr
aine
d un
cons
olid
ated
se
dim
ents
Coar
se-
grai
ned
unco
nsol
idat
ed
sedi
men
ts
Allu
vial
se
dim
ents
Ope
n
wat
erIc
e/
snow
Dev
elop
ed
land
Bar
ren
la
ndFo
rest
Shru
b/sc
rub
Agr
icul
ture
/ gr
assl
and/
pa
stur
eW
etla
nds
1220
2300
48.3
10.9
950
50
00
20
961
0.5
0.5
1220
2450
0.0
0.0
919
00
00
310
606
30
1220
5000
84.2
24.4
910
63
06
19
6417
21
1220
6900
89.5
34.5
990
10
00
30
8512
00
1220
7750
85.5
22.0
100
00
00
10
380
160
012
2078
5083
.520
.699
01
00
01
083
151
012
2090
0069
.818
.588
011
10
02
376
144
112
2094
9075
.016
.610
00
00
00
46
7015
50
1221
0500
68.1
18.3
841
96
02
34
7213
42
1221
0900
21.0
7.5
6434
20
00
61
678
153
1221
2040
1.5
0.3
034
5214
00
135
270
550
1221
2050
0.5
0.1
025
5916
00
281
100
601
1221
2400
0.0
0.0
081
136
00
192
220
534
1221
3030
0.0
0.0
073
243
00
190
224
4114
1221
3100
54.8
14.8
658
1710
12
63
5910
163
1221
3980
0.0
0.0
080
200
00
50
413
2823
1221
4900
0.0
0.0
055
2322
00
90
40
798
01C
070
53.5
12.9
900
010
00
40
7615
23
01D
100
25.8
8.3
4122
1918
00
60
543
334
01K
050
48.5
3.6
706
204
20
50
769
53
01N
060
0.0
0.0
060
337
00
131
180
626
01P0
800.
00.
01
4741
110
014
020
351
1201
Q07
00.
10.
00
3763
00
06
027
349
1501
R09
00.
00.
00
3452
140
021
016
343
1708
MH
153
0.5
0.1
044
479
00
430
120
450
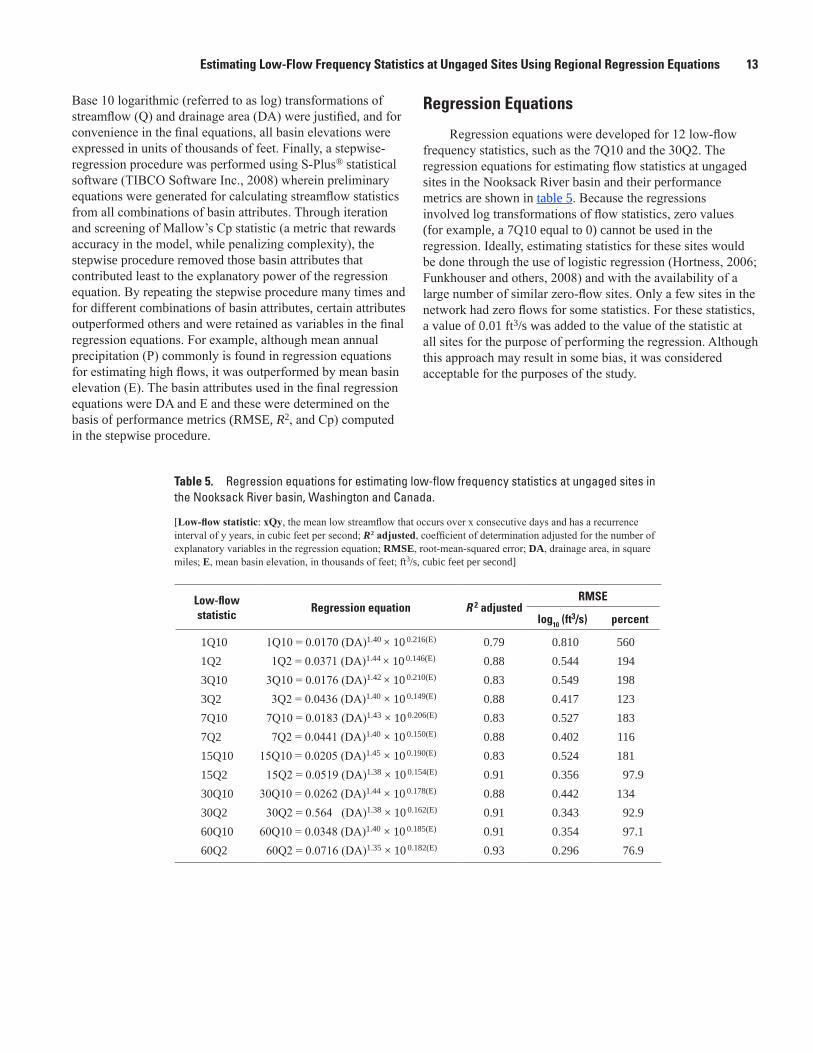
12 Estimating Low-Flow Frequency Statistics and Hydrologic Analysis, Nooksack River Basin, Washington and Canada Estimating Low-Flow Frequency Statistics at Ungaged Sites Using Regional Regression Equations 13
Base 10 logarithmic (referred to as log) transformations of streamflow (Q) and drainage area (DA) were justified, and for convenience in the final equations, all basin elevations were expressed in units of thousands of feet. Finally, a stepwise-regression procedure was performed using S-Plus® statistical software (TIBCO Software Inc., 2008) wherein preliminary equations were generated for calculating streamflow statistics from all combinations of basin attributes. Through iteration and screening of Mallow’s Cp statistic (a metric that rewards accuracy in the model, while penalizing complexity), the stepwise procedure removed those basin attributes that contributed least to the explanatory power of the regression equation. By repeating the stepwise procedure many times and for different combinations of basin attributes, certain attributes outperformed others and were retained as variables in the final regression equations. For example, although mean annual precipitation (P) commonly is found in regression equations for estimating high flows, it was outperformed by mean basin elevation (E). The basin attributes used in the final regression equations were DA and E and these were determined on the basis of performance metrics (RMSE, R2, and Cp) computed in the stepwise procedure.
Regression Equations
Regression equations were developed for 12 low-flow frequency statistics, such as the 7Q10 and the 30Q2. The regression equations for estimating flow statistics at ungaged sites in the Nooksack River basin and their performance metrics are shown in table 5. Because the regressions involved log transformations of flow statistics, zero values (for example, a 7Q10 equal to 0) cannot be used in the regression. Ideally, estimating statistics for these sites would be done through the use of logistic regression (Hortness, 2006; Funkhouser and others, 2008) and with the availability of a large number of similar zero-flow sites. Only a few sites in the network had zero flows for some statistics. For these statistics, a value of 0.01 ft3/s was added to the value of the statistic at all sites for the purpose of performing the regression. Although this approach may result in some bias, it was considered acceptable for the purposes of the study.
Table 5. Regression equations for estimating low-flow frequency statistics at ungaged sites in the Nooksack River basin, Washington and Canada.
[Low-flow statistic: xQy, the mean low streamflow that occurs over x consecutive days and has a recurrence interval of y years, in cubic feet per second; R 2 adjusted, coefficient of determination adjusted for the number of explanatory variables in the regression equation; RMSE, root-mean-squared error; DA, drainage area, in square miles; E, mean basin elevation, in thousands of feet; ft3/s, cubic feet per second]
Low-flow statistic
Regression equation R 2 adjustedRMSE
log10 (ft3/s) percent
1Q10 1Q10 = 0.0170 (DA)1.40 × 10 0.216(E) 0.79 0.810 5601Q2 1Q2 = 0.0371 (DA)1.44 × 10 0.146(E) 0.88 0.544 1943Q10 3Q10 = 0.0176 (DA)1.42 × 10 0.210(E) 0.83 0.549 1983Q2 3Q2 = 0.0436 (DA)1.40 × 10 0.149(E) 0.88 0.417 1237Q10 7Q10 = 0.0183 (DA)1.43 × 10 0.206(E) 0.83 0.527 1837Q2 7Q2 = 0.0441 (DA)1.40 × 10 0.150(E) 0.88 0.402 11615Q10 15Q10 = 0.0205 (DA)1.45 × 10 0.190(E) 0.83 0.524 18115Q2 15Q2 = 0.0519 (DA)1.38 × 10 0.154(E) 0.91 0.356 97.930Q10 30Q10 = 0.0262 (DA)1.44 × 10 0.178(E) 0.88 0.442 13430Q2 30Q2 = 0.564 (DA)1.38 × 10 0.162(E) 0.91 0.343 92.960Q10 60Q10 = 0.0348 (DA)1.40 × 10 0.185(E) 0.91 0.354 97.160Q2 60Q2 = 0.0716 (DA)1.35 × 10 0.182(E) 0.93 0.296 76.9
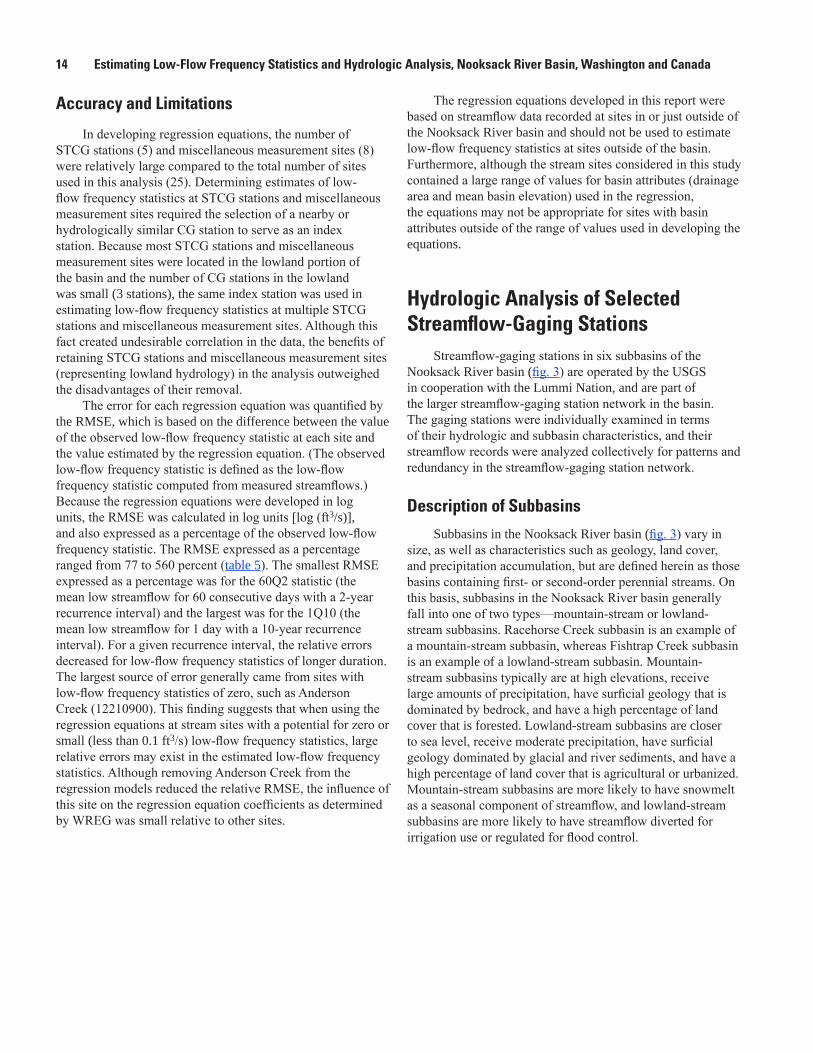
14 Estimating Low-Flow Frequency Statistics and Hydrologic Analysis, Nooksack River Basin, Washington and Canada
Accuracy and Limitations
In developing regression equations, the number of STCG stations (5) and miscellaneous measurement sites (8) were relatively large compared to the total number of sites used in this analysis (25). Determining estimates of low-flow frequency statistics at STCG stations and miscellaneous measurement sites required the selection of a nearby or hydrologically similar CG station to serve as an index station. Because most STCG stations and miscellaneous measurement sites were located in the lowland portion of the basin and the number of CG stations in the lowland was small (3 stations), the same index station was used in estimating low-flow frequency statistics at multiple STCG stations and miscellaneous measurement sites. Although this fact created undesirable correlation in the data, the benefits of retaining STCG stations and miscellaneous measurement sites (representing lowland hydrology) in the analysis outweighed the disadvantages of their removal.
The error for each regression equation was quantified by the RMSE, which is based on the difference between the value of the observed low-flow frequency statistic at each site and the value estimated by the regression equation. (The observed low-flow frequency statistic is defined as the low-flow frequency statistic computed from measured streamflows.) Because the regression equations were developed in log units, the RMSE was calculated in log units [log (ft3/s)], and also expressed as a percentage of the observed low-flow frequency statistic. The RMSE expressed as a percentage ranged from 77 to 560 percent (table 5). The smallest RMSE expressed as a percentage was for the 60Q2 statistic (the mean low streamflow for 60 consecutive days with a 2-year recurrence interval) and the largest was for the 1Q10 (the mean low streamflow for 1 day with a 10-year recurrence interval). For a given recurrence interval, the relative errors decreased for low-flow frequency statistics of longer duration. The largest source of error generally came from sites with low-flow frequency statistics of zero, such as Anderson Creek (12210900). This finding suggests that when using the regression equations at stream sites with a potential for zero or small (less than 0.1 ft3/s) low-flow frequency statistics, large relative errors may exist in the estimated low-flow frequency statistics. Although removing Anderson Creek from the regression models reduced the relative RMSE, the influence of this site on the regression equation coefficients as determined by WREG was small relative to other sites.
The regression equations developed in this report were based on streamflow data recorded at sites in or just outside of the Nooksack River basin and should not be used to estimate low-flow frequency statistics at sites outside of the basin. Furthermore, although the stream sites considered in this study contained a large range of values for basin attributes (drainage area and mean basin elevation) used in the regression, the equations may not be appropriate for sites with basin attributes outside of the range of values used in developing the equations.
Hydrologic Analysis of Selected Streamflow-Gaging Stations
Streamflow-gaging stations in six subbasins of the Nooksack River basin (fig. 3) are operated by the USGS in cooperation with the Lummi Nation, and are part of the larger streamflow-gaging station network in the basin. The gaging stations were individually examined in terms of their hydrologic and subbasin characteristics, and their streamflow records were analyzed collectively for patterns and redundancy in the streamflow-gaging station network.
Description of Subbasins
Subbasins in the Nooksack River basin (fig. 3) vary in size, as well as characteristics such as geology, land cover, and precipitation accumulation, but are defined herein as those basins containing first- or second-order perennial streams. On this basis, subbasins in the Nooksack River basin generally fall into one of two types—mountain-stream or lowland-stream subbasins. Racehorse Creek subbasin is an example of a mountain-stream subbasin, whereas Fishtrap Creek subbasin is an example of a lowland-stream subbasin. Mountain-stream subbasins typically are at high elevations, receive large amounts of precipitation, have surficial geology that is dominated by bedrock, and have a high percentage of land cover that is forested. Lowland-stream subbasins are closer to sea level, receive moderate precipitation, have surficial geology dominated by glacial and river sediments, and have a high percentage of land cover that is agricultural or urbanized. Mountain-stream subbasins are more likely to have snowmelt as a seasonal component of streamflow, and lowland-stream subbasins are more likely to have streamflow diverted for irrigation use or regulated for flood control.
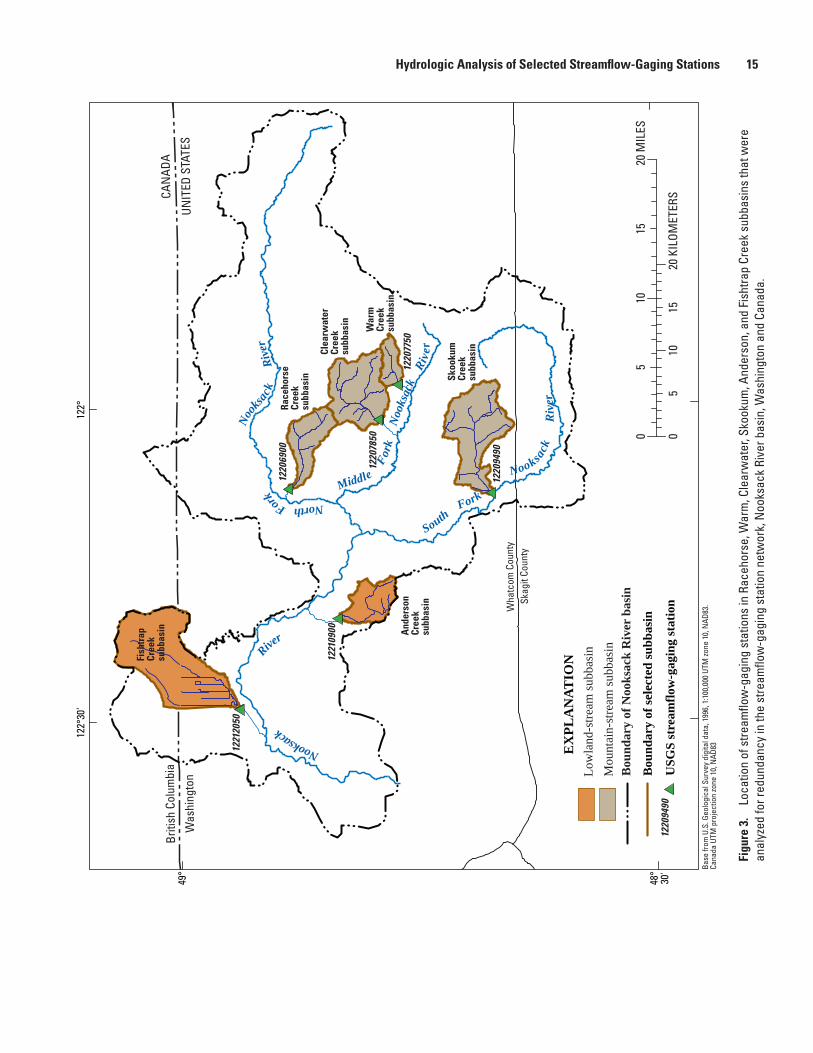
14 Estimating Low-Flow Frequency Statistics and Hydrologic Analysis, Nooksack River Basin, Washington and Canada Hydrologic Analysis of Selected Streamflow-Gaging Stations 15
tac09-0390 LummiBasinsLocation_Fig 03
North Fork
N
ooks
ack
R
iver
Middle Fo
rk
Noo
ksac
k R
iver
South Fork
Nooksa
ck
R
iver
Nooksack
R
iver
Low
land
-stre
am su
bbas
inM
ount
ain-
stre
am su
bbas
in
010
520
MIL
ES15
010
520
KIL
OMET
ERS
15
1221
2050
1221
0900
1220
6900
1220
9490
1220
7850
1220
7750
122°
30'
49°
48°
30'
122°
Briti
sh C
olum
bia
Was
hing
ton
CAN
ADA
UNIT
ED S
TATE
S
Wha
tcom
Cou
nty
Skag
it Co
unty
Clea
rwat
erCr
eek
subb
asin
War
mCr
eek
subb
asin
Skoo
kum
Cree
ksu
bbas
in
And
erso
nCr
eek
subb
asin
Fish
trap
Cree
ksu
bbas
in
Race
hors
eCr
eek
subb
asin
EX
PLA
NAT
ION
USG
S st
ream
flow
-gag
ing
stat
ion
Bou
ndar
y of
sele
cted
subb
asin
1220
9490
Bou
ndar
y of
Noo
ksac
k R
iver
bas
in
Base
from
U.S
. Geo
logi
cal S
urve
y di
gita
l dat
a, 1
996,
1:1
00,0
00 U
TM zo
ne 1
0, N
AD83
.Ca
nada
UTM
pro
ject
ion
zone
10,
NAD
83
Figu
re 3
. Lo
catio
n of
stre
amflo
w-g
agin
g st
atio
ns in
Rac
ehor
se, W
arm
, Cle
arw
ater
, Sko
okum
, And
erso
n, a
nd F
isht
rap
Cree
k su
bbas
ins
that
wer
e an
alyz
ed fo
r red
unda
ncy
in th
e st
ream
flow
-gag
ing
stat
ion
netw
ork,
Noo
ksac
k Ri
ver b
asin
, Was
hing
ton
and
Cana
da.
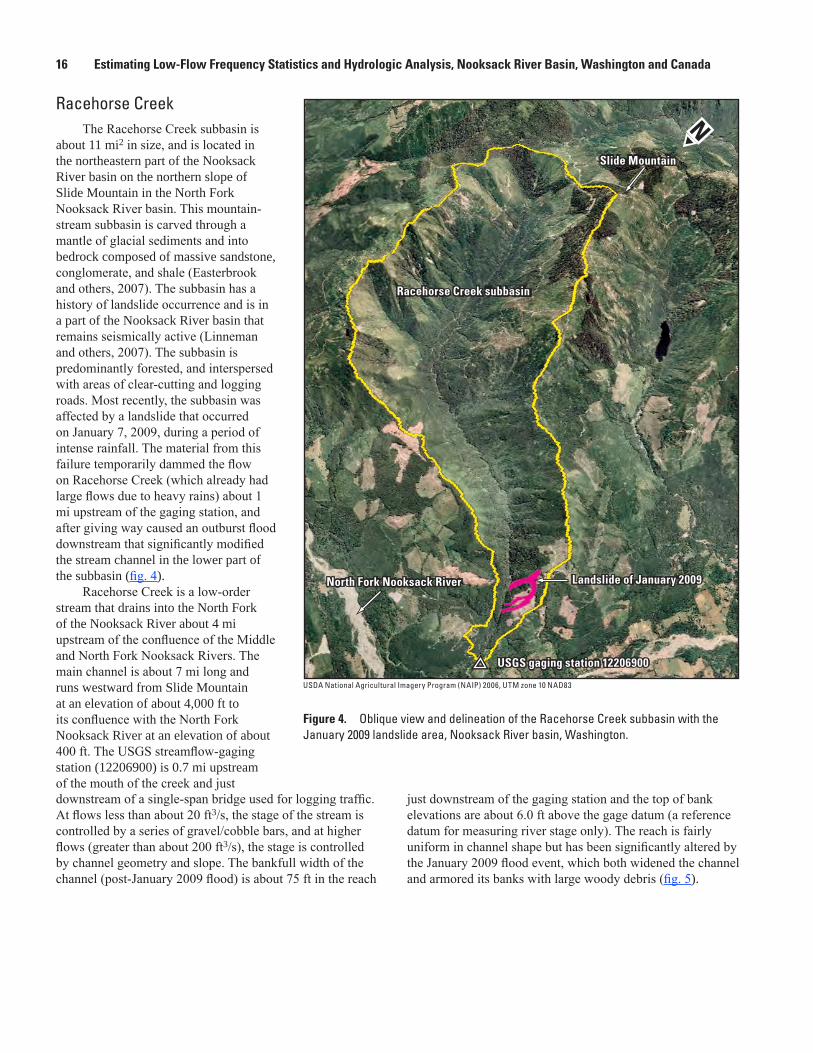
16 Estimating Low-Flow Frequency Statistics and Hydrologic Analysis, Nooksack River Basin, Washington and Canada
Racehorse CreekThe Racehorse Creek subbasin is
about 11 mi2 in size, and is located in the northeastern part of the Nooksack River basin on the northern slope of Slide Mountain in the North Fork Nooksack River basin. This mountain-stream subbasin is carved through a mantle of glacial sediments and into bedrock composed of massive sandstone, conglomerate, and shale (Easterbrook and others, 2007). The subbasin has a history of landslide occurrence and is in a part of the Nooksack River basin that remains seismically active (Linneman and others, 2007). The subbasin is predominantly forested, and interspersed with areas of clear-cutting and logging roads. Most recently, the subbasin was affected by a landslide that occurred on January 7, 2009, during a period of intense rainfall. The material from this failure temporarily dammed the flow on Racehorse Creek (which already had large flows due to heavy rains) about 1 mi upstream of the gaging station, and after giving way caused an outburst flood downstream that significantly modified the stream channel in the lower part of the subbasin (fig. 4).
Racehorse Creek is a low-order stream that drains into the North Fork of the Nooksack River about 4 mi upstream of the confluence of the Middle and North Fork Nooksack Rivers. The main channel is about 7 mi long and runs westward from Slide Mountain at an elevation of about 4,000 ft to its confluence with the North Fork Nooksack River at an elevation of about 400 ft. The USGS streamflow-gaging station (12206900) is 0.7 mi upstream of the mouth of the creek and just downstream of a single-span bridge used for logging traffic. At flows less than about 20 ft3/s, the stage of the stream is controlled by a series of gravel/cobble bars, and at higher flows (greater than about 200 ft3/s), the stage is controlled by channel geometry and slope. The bankfull width of the channel (post-January 2009 flood) is about 75 ft in the reach
watac09-0390_fig 04-Racehorse
Racehorse Creek SubbasinRacehorse Creek subbasin
USGS gaging station 12206900USGS gaging station 12206900
Landslide of January 2009Landslide of January 2009North Fork Nooksack RiverNorth Fork Nooksack River
Slide MountainSlide Mountain
USDA National Agricultural Imagery Program (NAIP) 2006, UTM zone 10 NAD83
Figure 4. Oblique view and delineation of the Racehorse Creek subbasin with the January 2009 landslide area, Nooksack River basin, Washington.
just downstream of the gaging station and the top of bank elevations are about 6.0 ft above the gage datum (a reference datum for measuring river stage only). The reach is fairly uniform in channel shape but has been significantly altered by the January 2009 flood event, which both widened the channel and armored its banks with large woody debris (fig. 5).
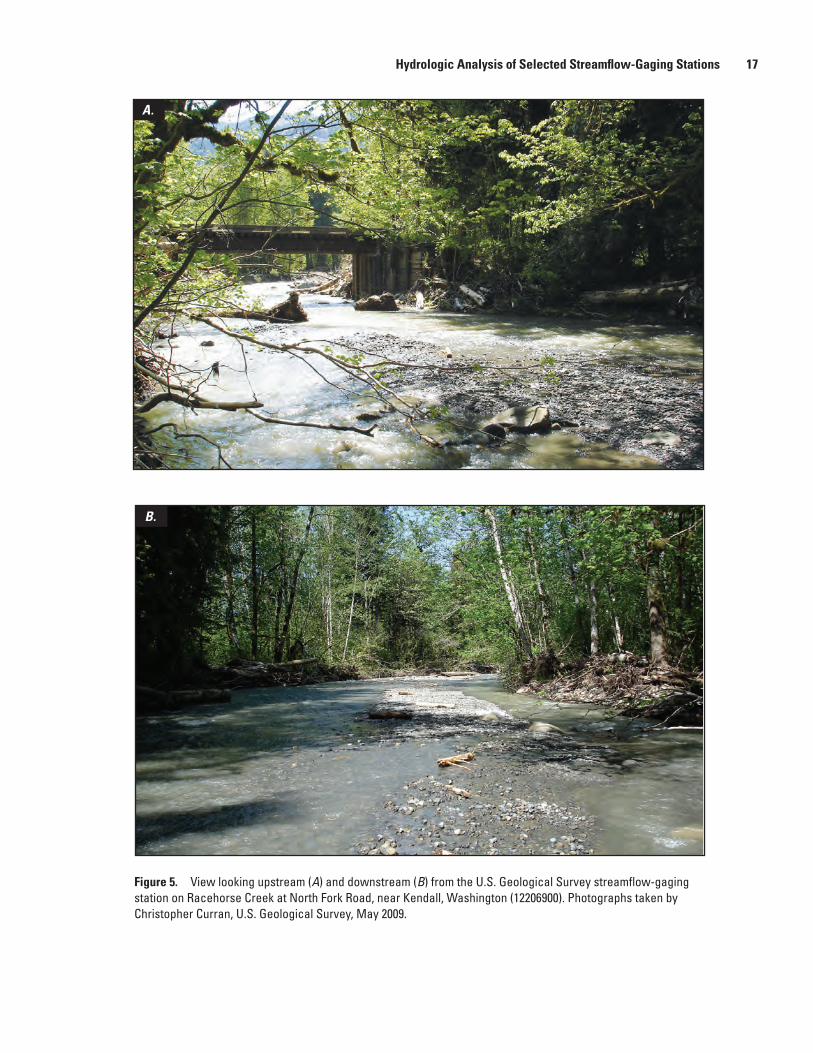
16 Estimating Low-Flow Frequency Statistics and Hydrologic Analysis, Nooksack River Basin, Washington and Canada Hydrologic Analysis of Selected Streamflow-Gaging Stations 17
watac09-0390_fig 05a,b
A.
B.
Figure 5. View looking upstream (A) and downstream (B) from the U.S. Geological Survey streamflow-gaging station on Racehorse Creek at North Fork Road, near Kendall, Washington (12206900). Photographs taken by Christopher Curran, U.S. Geological Survey, May 2009.
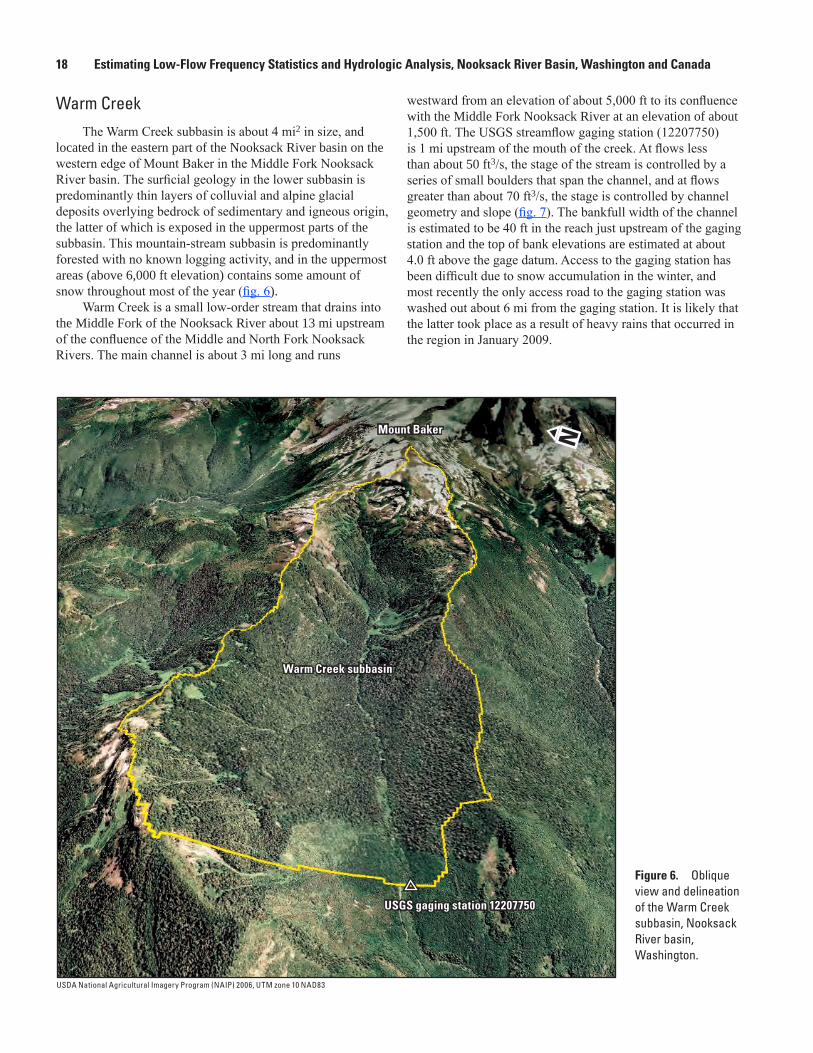
18 Estimating Low-Flow Frequency Statistics and Hydrologic Analysis, Nooksack River Basin, Washington and Canada
Warm CreekThe Warm Creek subbasin is about 4 mi2 in size, and
located in the eastern part of the Nooksack River basin on the western edge of Mount Baker in the Middle Fork Nooksack River basin. The surficial geology in the lower subbasin is predominantly thin layers of colluvial and alpine glacial deposits overlying bedrock of sedimentary and igneous origin, the latter of which is exposed in the uppermost parts of the subbasin. This mountain-stream subbasin is predominantly forested with no known logging activity, and in the uppermost areas (above 6,000 ft elevation) contains some amount of snow throughout most of the year (fig. 6).
Warm Creek is a small low-order stream that drains into the Middle Fork of the Nooksack River about 13 mi upstream of the confluence of the Middle and North Fork Nooksack Rivers. The main channel is about 3 mi long and runs
watac09-0390_fig 06-Warm Creek
Warm Creek subbasinWarm Creek subbasin
USGS gaging station 12207750USGS gaging station 12207750
Mount BakerMount Baker
USDA National Agricultural Imagery Program (NAIP) 2006, UTM zone 10 NAD83
Figure 6. Oblique view and delineation of the Warm Creek subbasin, Nooksack River basin, Washington.
westward from an elevation of about 5,000 ft to its confluence with the Middle Fork Nooksack River at an elevation of about 1,500 ft. The USGS streamflow gaging station (12207750) is 1 mi upstream of the mouth of the creek. At flows less than about 50 ft3/s, the stage of the stream is controlled by a series of small boulders that span the channel, and at flows greater than about 70 ft3/s, the stage is controlled by channel geometry and slope (fig. 7). The bankfull width of the channel is estimated to be 40 ft in the reach just upstream of the gaging station and the top of bank elevations are estimated at about 4.0 ft above the gage datum. Access to the gaging station has been difficult due to snow accumulation in the winter, and most recently the only access road to the gaging station was washed out about 6 mi from the gaging station. It is likely that the latter took place as a result of heavy rains that occurred in the region in January 2009.
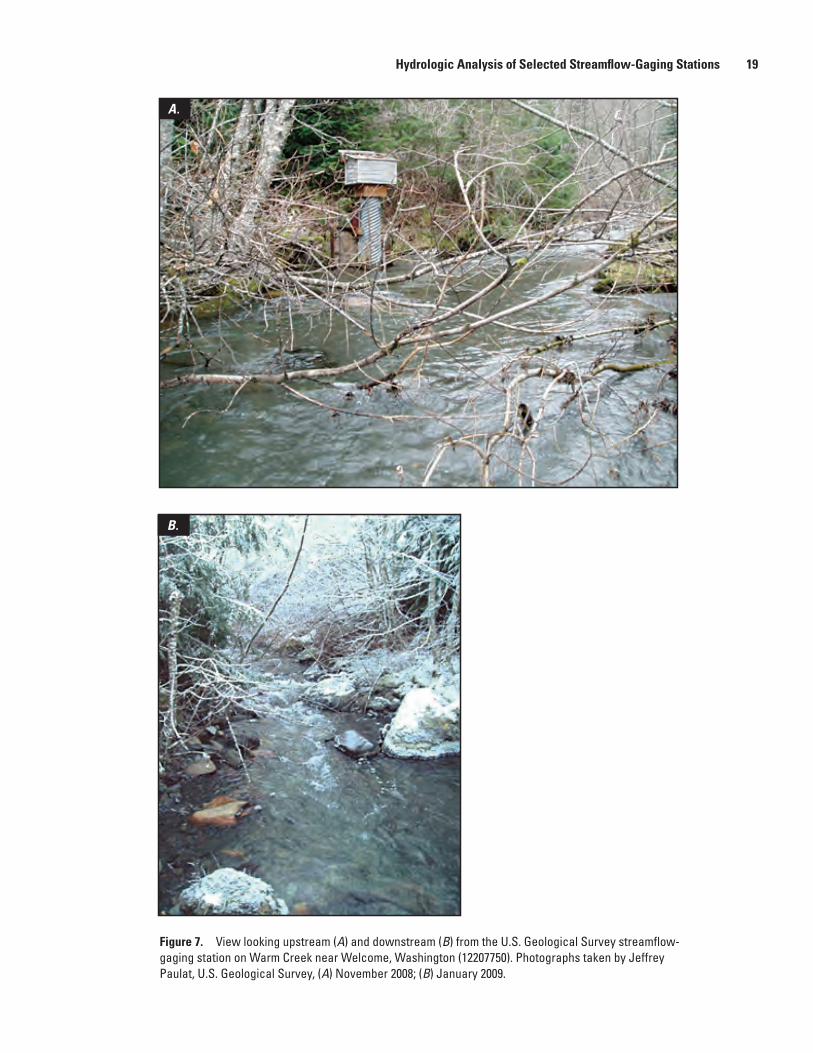
18 Estimating Low-Flow Frequency Statistics and Hydrologic Analysis, Nooksack River Basin, Washington and Canada Hydrologic Analysis of Selected Streamflow-Gaging Stations 19
watac09-0390_fig 07a,b
A.
B.
Figure 7. View looking upstream (A) and downstream (B) from the U.S. Geological Survey streamflow-gaging station on Warm Creek near Welcome, Washington (12207750). Photographs taken by Jeffrey Paulat, U.S. Geological Survey, (A) November 2008; (B) January 2009.
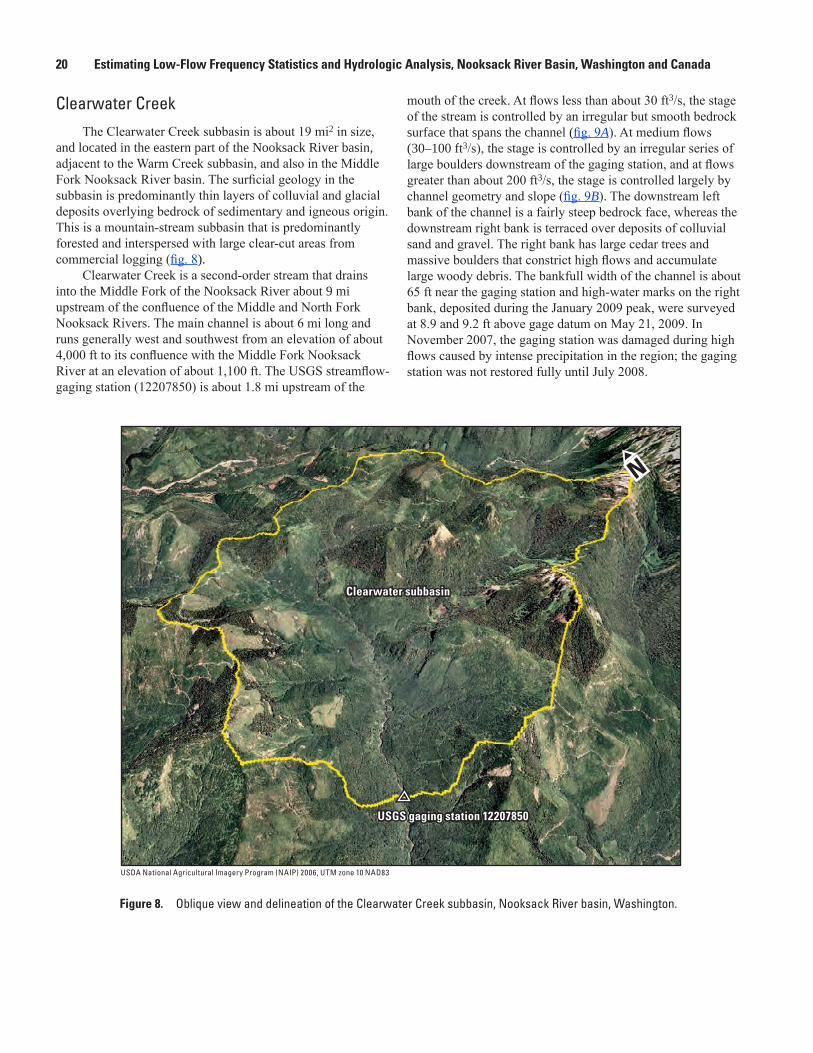
20 Estimating Low-Flow Frequency Statistics and Hydrologic Analysis, Nooksack River Basin, Washington and Canada
Clearwater CreekThe Clearwater Creek subbasin is about 19 mi2 in size,
and located in the eastern part of the Nooksack River basin, adjacent to the Warm Creek subbasin, and also in the Middle Fork Nooksack River basin. The surficial geology in the subbasin is predominantly thin layers of colluvial and glacial deposits overlying bedrock of sedimentary and igneous origin. This is a mountain-stream subbasin that is predominantly forested and interspersed with large clear-cut areas from commercial logging (fig. 8).
Clearwater Creek is a second-order stream that drains into the Middle Fork of the Nooksack River about 9 mi upstream of the confluence of the Middle and North Fork Nooksack Rivers. The main channel is about 6 mi long and runs generally west and southwest from an elevation of about 4,000 ft to its confluence with the Middle Fork Nooksack River at an elevation of about 1,100 ft. The USGS streamflow-gaging station (12207850) is about 1.8 mi upstream of the
watac09-0390_fig 08-Clearwater
Clearwater subbasinClearwater subbasin
USGS gaging station 12207850USGS gaging station 12207850
USDA National Agricultural Imagery Program (NAIP) 2006, UTM zone 10 NAD83
Figure 8. Oblique view and delineation of the Clearwater Creek subbasin, Nooksack River basin, Washington.
mouth of the creek. At flows less than about 30 ft3/s, the stage of the stream is controlled by an irregular but smooth bedrock surface that spans the channel (fig. 9A). At medium flows (30–100 ft3/s), the stage is controlled by an irregular series of large boulders downstream of the gaging station, and at flows greater than about 200 ft3/s, the stage is controlled largely by channel geometry and slope (fig. 9B). The downstream left bank of the channel is a fairly steep bedrock face, whereas the downstream right bank is terraced over deposits of colluvial sand and gravel. The right bank has large cedar trees and massive boulders that constrict high flows and accumulate large woody debris. The bankfull width of the channel is about 65 ft near the gaging station and high-water marks on the right bank, deposited during the January 2009 peak, were surveyed at 8.9 and 9.2 ft above gage datum on May 21, 2009. In November 2007, the gaging station was damaged during high flows caused by intense precipitation in the region; the gaging station was not restored fully until July 2008.
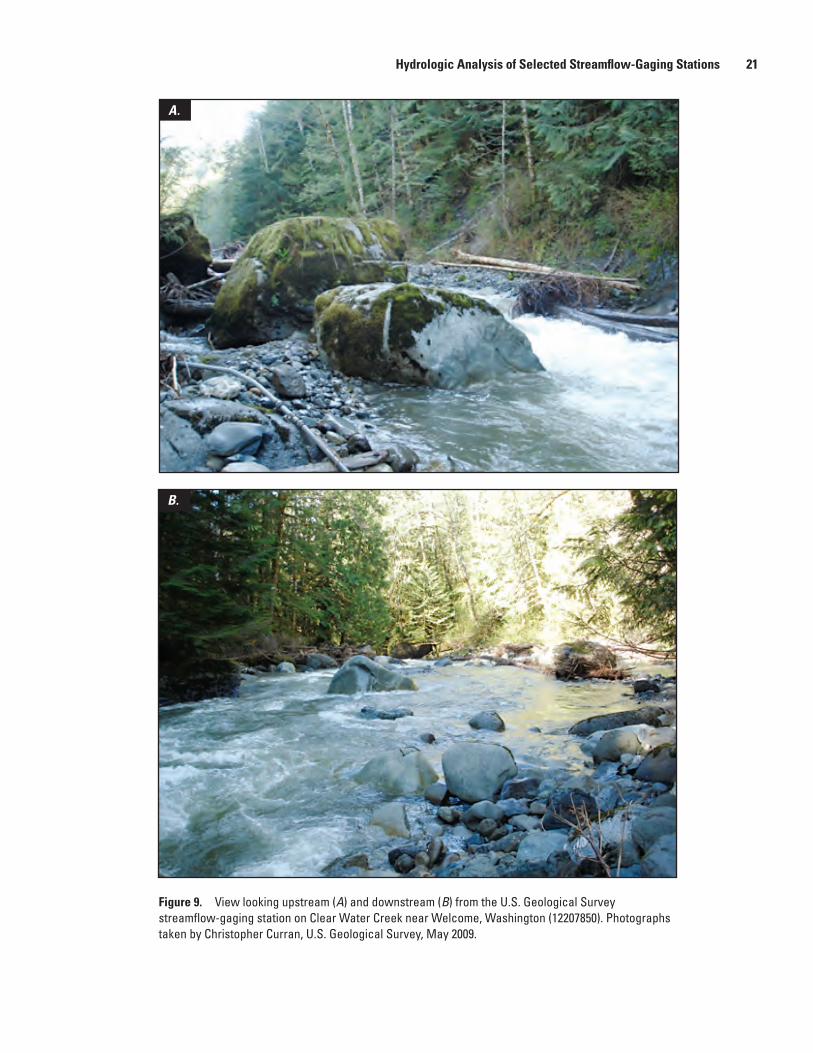
20 Estimating Low-Flow Frequency Statistics and Hydrologic Analysis, Nooksack River Basin, Washington and Canada Hydrologic Analysis of Selected Streamflow-Gaging Stations 21
watac09-0390_fig 09a,b
A.
B.
Figure 9. View looking upstream (A) and downstream (B) from the U.S. Geological Survey streamflow-gaging station on Clear Water Creek near Welcome, Washington (12207850). Photographs taken by Christopher Curran, U.S. Geological Survey, May 2009.
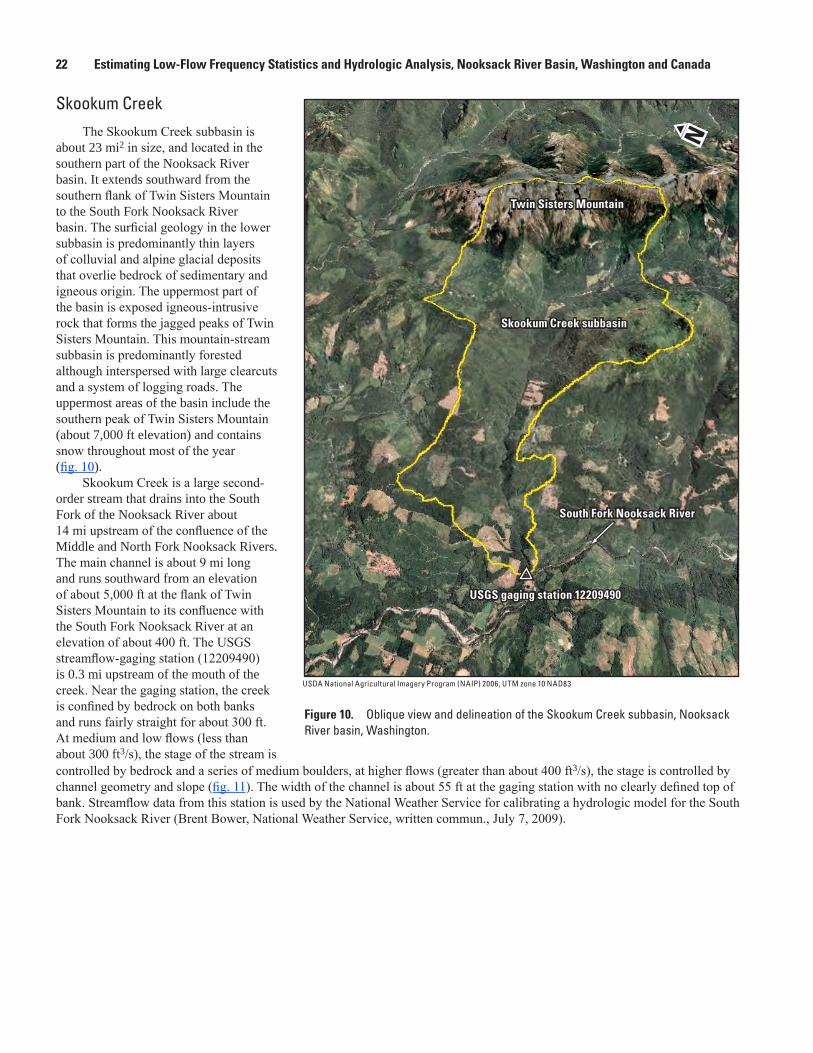
22 Estimating Low-Flow Frequency Statistics and Hydrologic Analysis, Nooksack River Basin, Washington and Canada
watac09-0390_fig 10-Skookum Creek
Skookum Creek subbasinSkookum Creek subbasin
Twin Sisters MountainTwin Sisters Mountain
USGS gaging station 12209490USGS gaging station 12209490
South Fork Nooksack RiverSouth Fork Nooksack River
USDA National Agricultural Imagery Program (NAIP) 2006, UTM zone 10 NAD83
Figure 10. Oblique view and delineation of the Skookum Creek subbasin, Nooksack River basin, Washington.
Skookum CreekThe Skookum Creek subbasin is
about 23 mi2 in size, and located in the southern part of the Nooksack River basin. It extends southward from the southern flank of Twin Sisters Mountain to the South Fork Nooksack River basin. The surficial geology in the lower subbasin is predominantly thin layers of colluvial and alpine glacial deposits that overlie bedrock of sedimentary and igneous origin. The uppermost part of the basin is exposed igneous-intrusive rock that forms the jagged peaks of Twin Sisters Mountain. This mountain-stream subbasin is predominantly forested although interspersed with large clearcuts and a system of logging roads. The uppermost areas of the basin include the southern peak of Twin Sisters Mountain (about 7,000 ft elevation) and contains snow throughout most of the year (fig. 10).
Skookum Creek is a large second-order stream that drains into the South Fork of the Nooksack River about 14 mi upstream of the confluence of the Middle and North Fork Nooksack Rivers. The main channel is about 9 mi long and runs southward from an elevation of about 5,000 ft at the flank of Twin Sisters Mountain to its confluence with the South Fork Nooksack River at an elevation of about 400 ft. The USGS streamflow-gaging station (12209490) is 0.3 mi upstream of the mouth of the creek. Near the gaging station, the creek is confined by bedrock on both banks and runs fairly straight for about 300 ft. At medium and low flows (less than about 300 ft3/s), the stage of the stream is controlled by bedrock and a series of medium boulders, at higher flows (greater than about 400 ft3/s), the stage is controlled by channel geometry and slope (fig. 11). The width of the channel is about 55 ft at the gaging station with no clearly defined top of bank. Streamflow data from this station is used by the National Weather Service for calibrating a hydrologic model for the South Fork Nooksack River (Brent Bower, National Weather Service, written commun., July 7, 2009).
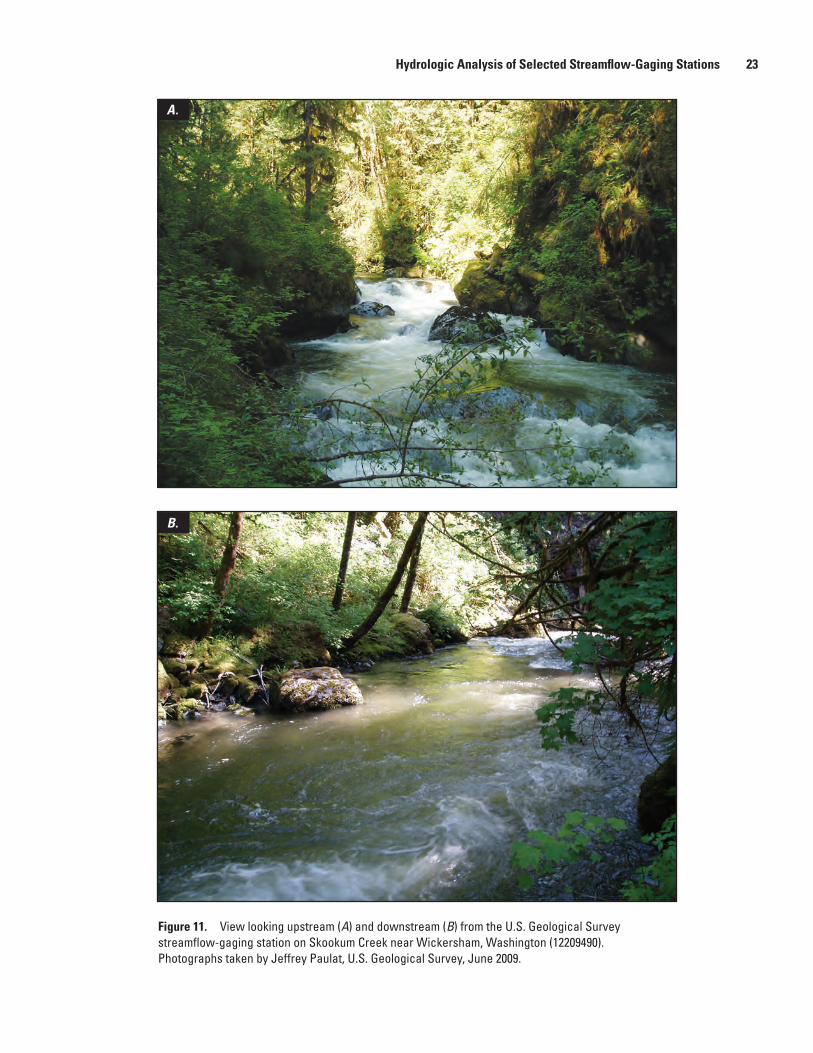
22 Estimating Low-Flow Frequency Statistics and Hydrologic Analysis, Nooksack River Basin, Washington and Canada Hydrologic Analysis of Selected Streamflow-Gaging Stations 23
watac09-0390_fig 11a,b
A.
B.
Figure 11. View looking upstream (A) and downstream (B) from the U.S. Geological Survey streamflow-gaging station on Skookum Creek near Wickersham, Washington (12209490). Photographs taken by Jeffrey Paulat, U.S. Geological Survey, June 2009.
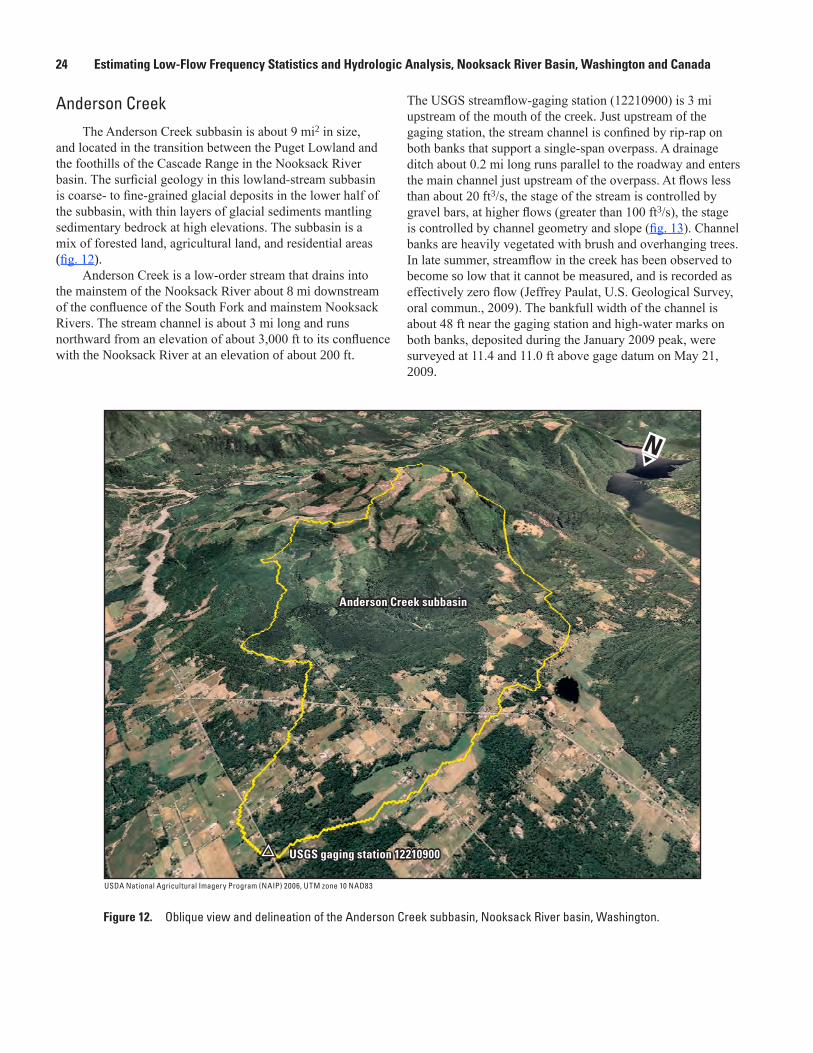
24 Estimating Low-Flow Frequency Statistics and Hydrologic Analysis, Nooksack River Basin, Washington and Canada
Anderson CreekThe Anderson Creek subbasin is about 9 mi2 in size,
and located in the transition between the Puget Lowland and the foothills of the Cascade Range in the Nooksack River basin. The surficial geology in this lowland-stream subbasin is coarse- to fine-grained glacial deposits in the lower half of the subbasin, with thin layers of glacial sediments mantling sedimentary bedrock at high elevations. The subbasin is a mix of forested land, agricultural land, and residential areas (fig. 12).
Anderson Creek is a low-order stream that drains into the mainstem of the Nooksack River about 8 mi downstream of the confluence of the South Fork and mainstem Nooksack Rivers. The stream channel is about 3 mi long and runs northward from an elevation of about 3,000 ft to its confluence with the Nooksack River at an elevation of about 200 ft.
watac09-0390_fig 12-AndersonCreek
Anderson Creek subbasinAnderson Creek subbasin
USGS gaging station 12210900USGS gaging station 12210900
USDA National Agricultural Imagery Program (NAIP) 2006, UTM zone 10 NAD83
The USGS streamflow-gaging station (12210900) is 3 mi upstream of the mouth of the creek. Just upstream of the gaging station, the stream channel is confined by rip-rap on both banks that support a single-span overpass. A drainage ditch about 0.2 mi long runs parallel to the roadway and enters the main channel just upstream of the overpass. At flows less than about 20 ft3/s, the stage of the stream is controlled by gravel bars, at higher flows (greater than 100 ft3/s), the stage is controlled by channel geometry and slope (fig. 13). Channel banks are heavily vegetated with brush and overhanging trees. In late summer, streamflow in the creek has been observed to become so low that it cannot be measured, and is recorded as effectively zero flow (Jeffrey Paulat, U.S. Geological Survey, oral commun., 2009). The bankfull width of the channel is about 48 ft near the gaging station and high-water marks on both banks, deposited during the January 2009 peak, were surveyed at 11.4 and 11.0 ft above gage datum on May 21, 2009.
Figure 12. Oblique view and delineation of the Anderson Creek subbasin, Nooksack River basin, Washington.
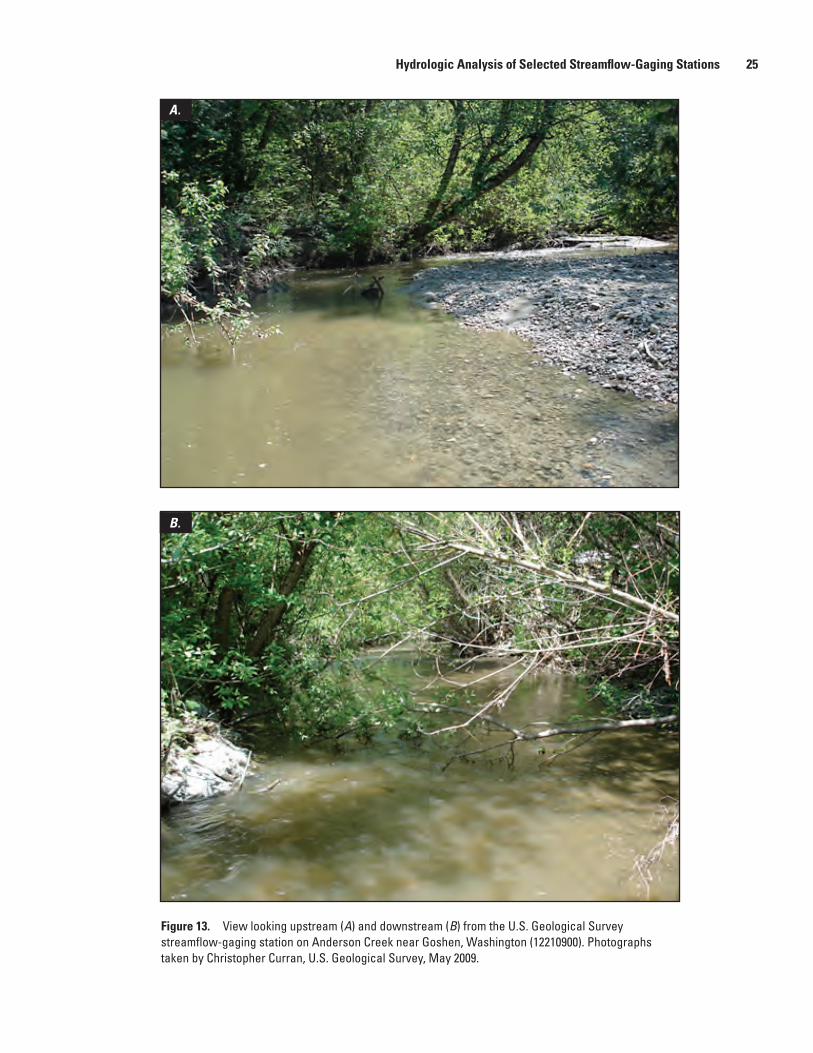
24 Estimating Low-Flow Frequency Statistics and Hydrologic Analysis, Nooksack River Basin, Washington and Canada Hydrologic Analysis of Selected Streamflow-Gaging Stations 25
Figure 13. View looking upstream (A) and downstream (B) from the U.S. Geological Survey streamflow-gaging station on Anderson Creek near Goshen, Washington (12210900). Photographs taken by Christopher Curran, U.S. Geological Survey, May 2009.
watac09-0390_fig 13a,b
A.
B.
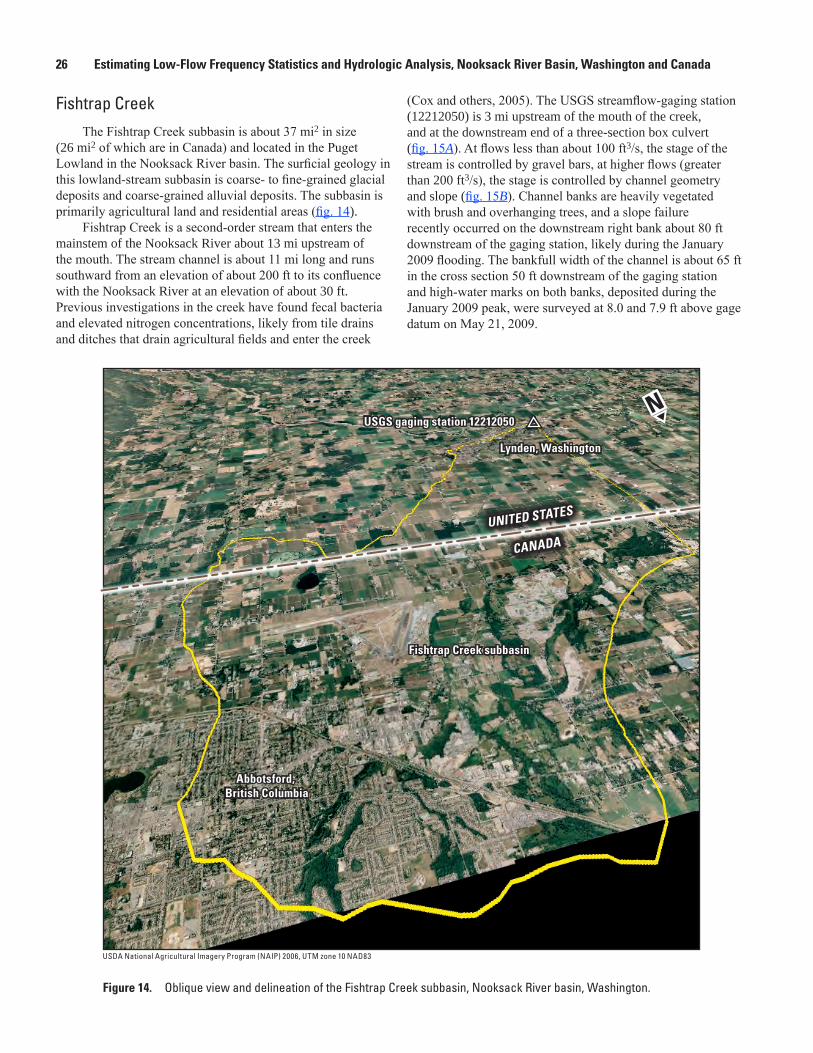
26 Estimating Low-Flow Frequency Statistics and Hydrologic Analysis, Nooksack River Basin, Washington and Canada
Fishtrap CreekThe Fishtrap Creek subbasin is about 37 mi2 in size
(26 mi2 of which are in Canada) and located in the Puget Lowland in the Nooksack River basin. The surficial geology in this lowland-stream subbasin is coarse- to fine-grained glacial deposits and coarse-grained alluvial deposits. The subbasin is primarily agricultural land and residential areas (fig. 14).
Fishtrap Creek is a second-order stream that enters the mainstem of the Nooksack River about 13 mi upstream of the mouth. The stream channel is about 11 mi long and runs southward from an elevation of about 200 ft to its confluence with the Nooksack River at an elevation of about 30 ft. Previous investigations in the creek have found fecal bacteria and elevated nitrogen concentrations, likely from tile drains and ditches that drain agricultural fields and enter the creek
watac09-0390_fig 14-FishtrapCreek
Lynden, WashingtonLynden, Washington
USGS gaging station 12212050USGS gaging station 12212050
Fishtrap Creek subbasinFishtrap Creek subbasin
Abbotsford, British Columbia
Abbotsford, British Columbia
USDA National Agricultural Imagery Program (NAIP) 2006, UTM zone 10 NAD83
(Cox and others, 2005). The USGS streamflow-gaging station (12212050) is 3 mi upstream of the mouth of the creek, and at the downstream end of a three-section box culvert (fig. 15A). At flows less than about 100 ft3/s, the stage of the stream is controlled by gravel bars, at higher flows (greater than 200 ft3/s), the stage is controlled by channel geometry and slope (fig. 15B). Channel banks are heavily vegetated with brush and overhanging trees, and a slope failure recently occurred on the downstream right bank about 80 ft downstream of the gaging station, likely during the January 2009 flooding. The bankfull width of the channel is about 65 ft in the cross section 50 ft downstream of the gaging station and high-water marks on both banks, deposited during the January 2009 peak, were surveyed at 8.0 and 7.9 ft above gage datum on May 21, 2009.
Figure 14. Oblique view and delineation of the Fishtrap Creek subbasin, Nooksack River basin, Washington.
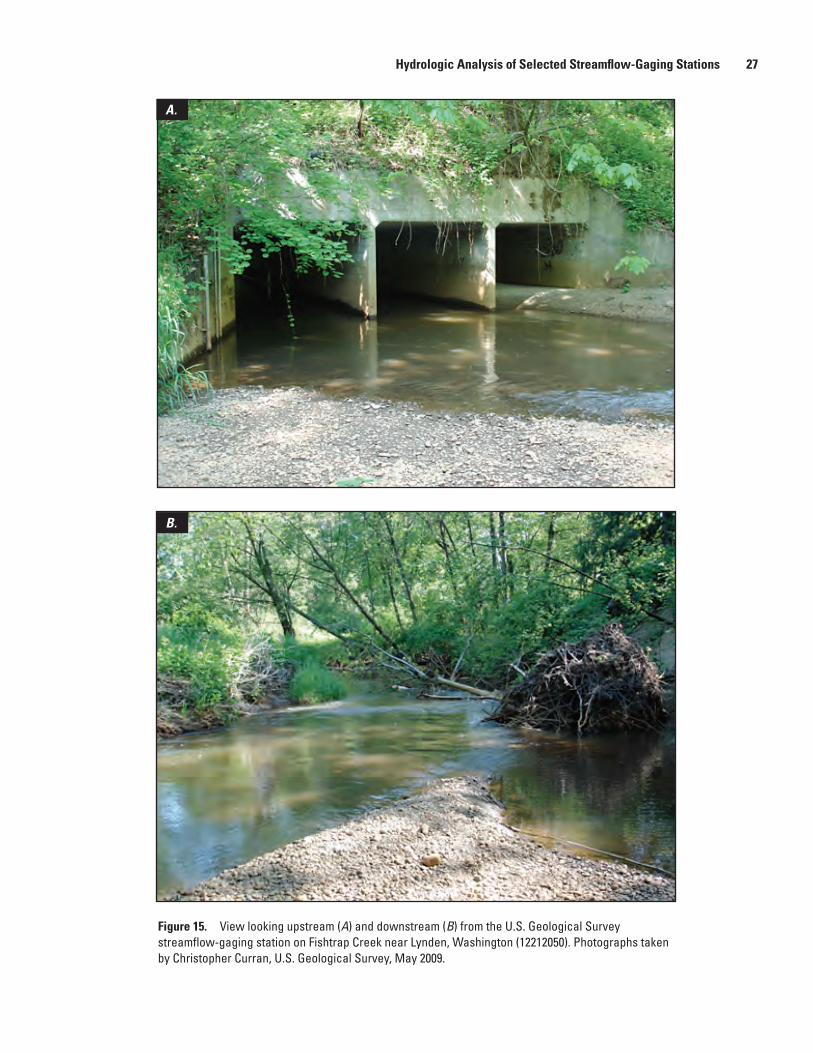
26 Estimating Low-Flow Frequency Statistics and Hydrologic Analysis, Nooksack River Basin, Washington and Canada Hydrologic Analysis of Selected Streamflow-Gaging Stations 27
Figure 15. View looking upstream (A) and downstream (B) from the U.S. Geological Survey streamflow-gaging station on Fishtrap Creek near Lynden, Washington (12212050). Photographs taken by Christopher Curran, U.S. Geological Survey, May 2009.
watac09-0390_fig 15a,b
A.
B.

28 Estimating Low-Flow Frequency Statistics and Hydrologic Analysis, Nooksack River Basin, Washington and Canada
Evaluation of Redundancy in the Streamflow-Gaging Station Network
In addition to developing regional regression equations for low-flow frequency statistics, the Lummi Nation requested that the USGS determine whether some of the six streamflow-gaging stations were collecting redundant streamflow information and whether some of the gaging stations could be removed from the network without significant loss of information. Redundancy in this study is defined as similarity in the timing, magnitude and frequency of streamflow. Because identifying and removing redundancy in the streamflow-gaging station network is essentially optimizing the network, it is helpful to define an optimal network. An optimal streamflow-gaging station network is one that contains the fewest number of gaging stations and yet provides streamflow information that represents the spectrum of hydrologic variability in the basin, while satisfying the data needs for various present and future water-resource studies and management alternatives. Reducing redundancy in a network thus involves identifying elements of hydrologic variability (for example the magnitude, frequency, and timing of streamflow) and determining which gaging stations are essential for explaining the observed variability and which are not.
Four methods were used for considering data redundancy: hydrograph comparison, daily-value correlation, variable space, and flow-duration ratios. Each method involves some aspect of hydrologic variability that can be either qualitatively or quantitatively evaluated. The results from each method should be considered along with the intended long-term use of the data-collection network. For example, the daily-value-correlation method is useful in determining which gaging stations might provide the best estimate of daily mean streamflow in the six subbasins and possibly other subbasins of the Nooksack River basin. However, the daily-value-correlation method does not address whether the network is adequate for improving future regional regressions for low- or high-flow frequency statistics. Other methods such as variable space, hydrograph comparison, and possibly flow-duration ratios are better suited to determine redundancy in the network for the purpose of improving future regional regression equations for low- and high-flow frequency statistics.
Hydrograph Comparison MethodHydrograph comparison is a method for examining
the similarities and differences of streamflow patterns (the timing and magnitude of flow) between gaging stations. A hydrograph is a plot of streamflow over time at a gaging station, and hydrographs that are similar in the timing and magnitude of streamflow share a redundancy in streamflow
information. Because of the difference in scale between large and small streams, hydrograph comparison usually is done with streamflow plotted on a logarithmic scale to make visual comparisons easier. Physical scaling effects between streams also can be further reduced and similarities in streamflow patterns can be more easily discerned by normalizing streamflow, by dividing daily flow at each gaging station by its subbasin drainage area (this ratio also is referred to as ‘streamflow runoff’). A visual inspection of the normalized hydrographs for all six gaging stations in water year 2003 (a near-average water year) shows many similarities in the timing and relative magnitude of streamflow patterns as well as some differences (fig. 16). Although most mountain-stream gaging stations (Racehorse, Warm, Clearwater, and Skookum Creeks) have a similar runoff response to storm events during the winter and spring seasons (mid-October to mid-June), runoff patterns are different during the summer season (mid-June to mid-October) when baseflow conditions exist. For example, mountain-stream gaging stations began the 2003 winter season with similar streamflow runoff, but as summer progressed, Racehorse Creek was less sustained by baseflow and Warm Creek had high runoff due to snowmelt contributions. Streamflow runoff generally is less in lowland streams than in mountain streams, likely due to lower precipitation amounts. Of the two lowland streams, Anderson Creek is the only stream with periods of zero flow, whereas streamflow in Fishtrap Creek appears more sustained from baseflow during the summer season.
A closer inspection of streamflow hydrographs at the 15-minute time interval during the period of July 11–31, 2002 (during a wetter than average water year) shows similarities and differences in baseflow-recession characteristics between the six gaging stations (fig. 17). The slope of the baseflow-recession curve can be quantified as the baseflow-recession time constant or simply ‘tau’ (Eng and Milly, 2008), and has implications for groundwater recharge to streams. During low-flow periods without significant precipitation, streams with large tau exhibit a gradual decrease in streamflow indicating more contribution from groundwater recharge, whereas streams with smaller tau lack this recharge (possibly losing water to the groundwater system) and recede more quickly. The value of tau can be determined as follows (Eng and Milly, 2008):
/ ln( / ) ,
whereis the baseflow-recession constant or , in days;is the number of days between streamflow
measurements;is the streamflow after days, andis the streamflow at the b
t t t
t t
t
t Q Q
taut
Q tQ
+∆
+∆
τ = ∆
τ∆
∆eginning of days.t∆
(1)
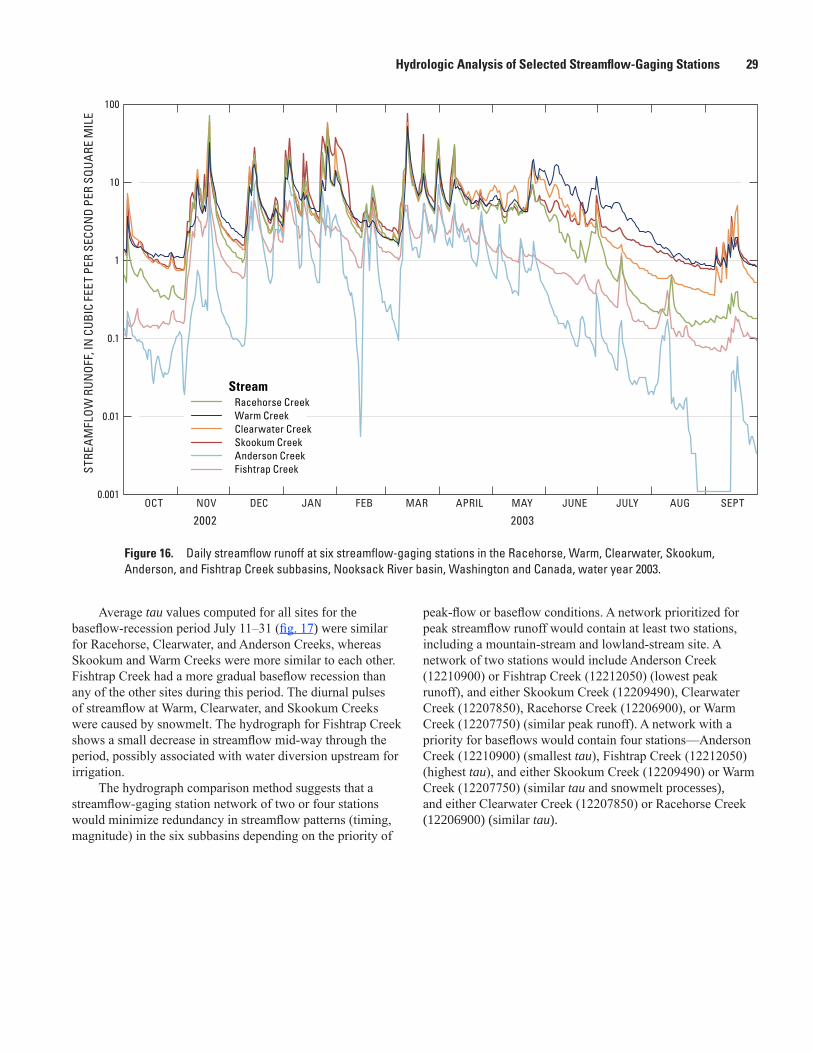
28 Estimating Low-Flow Frequency Statistics and Hydrologic Analysis, Nooksack River Basin, Washington and Canada Hydrologic Analysis of Selected Streamflow-Gaging Stations 29
Figure 16. Daily streamflow runoff at six streamflow-gaging stations in the Racehorse, Warm, Clearwater, Skookum, Anderson, and Fishtrap Creek subbasins, Nooksack River basin, Washington and Canada, water year 2003.
watac09-0390_fig 16
0.001
0.01
0.1
1
10
100ST
REA
MFL
OW
RU
NO
FF, I
N C
UBI
C FE
ET P
ER S
ECO
ND
PER
SQU
ARE
MIL
E
OCT NOV DEC
2002 2003JAN FEB MAR APRIL MAY JULY AUG SEPTJUNE
Racehorse CreekStream
Warm CreekClearwater CreekSkookum CreekAnderson CreekFishtrap Creek
Average tau values computed for all sites for the baseflow-recession period July 11–31 (fig. 17) were similar for Racehorse, Clearwater, and Anderson Creeks, whereas Skookum and Warm Creeks were more similar to each other. Fishtrap Creek had a more gradual baseflow recession than any of the other sites during this period. The diurnal pulses of streamflow at Warm, Clearwater, and Skookum Creeks were caused by snowmelt. The hydrograph for Fishtrap Creek shows a small decrease in streamflow mid-way through the period, possibly associated with water diversion upstream for irrigation.
The hydrograph comparison method suggests that a streamflow-gaging station network of two or four stations would minimize redundancy in streamflow patterns (timing, magnitude) in the six subbasins depending on the priority of
peak-flow or baseflow conditions. A network prioritized for peak streamflow runoff would contain at least two stations, including a mountain-stream and lowland-stream site. A network of two stations would include Anderson Creek (12210900) or Fishtrap Creek (12212050) (lowest peak runoff), and either Skookum Creek (12209490), Clearwater Creek (12207850), Racehorse Creek (12206900), or Warm Creek (12207750) (similar peak runoff). A network with a priority for baseflows would contain four stations—Anderson Creek (12210900) (smallest tau), Fishtrap Creek (12212050) (highest tau), and either Skookum Creek (12209490) or Warm Creek (12207750) (similar tau and snowmelt processes), and either Clearwater Creek (12207850) or Racehorse Creek (12206900) (similar tau).
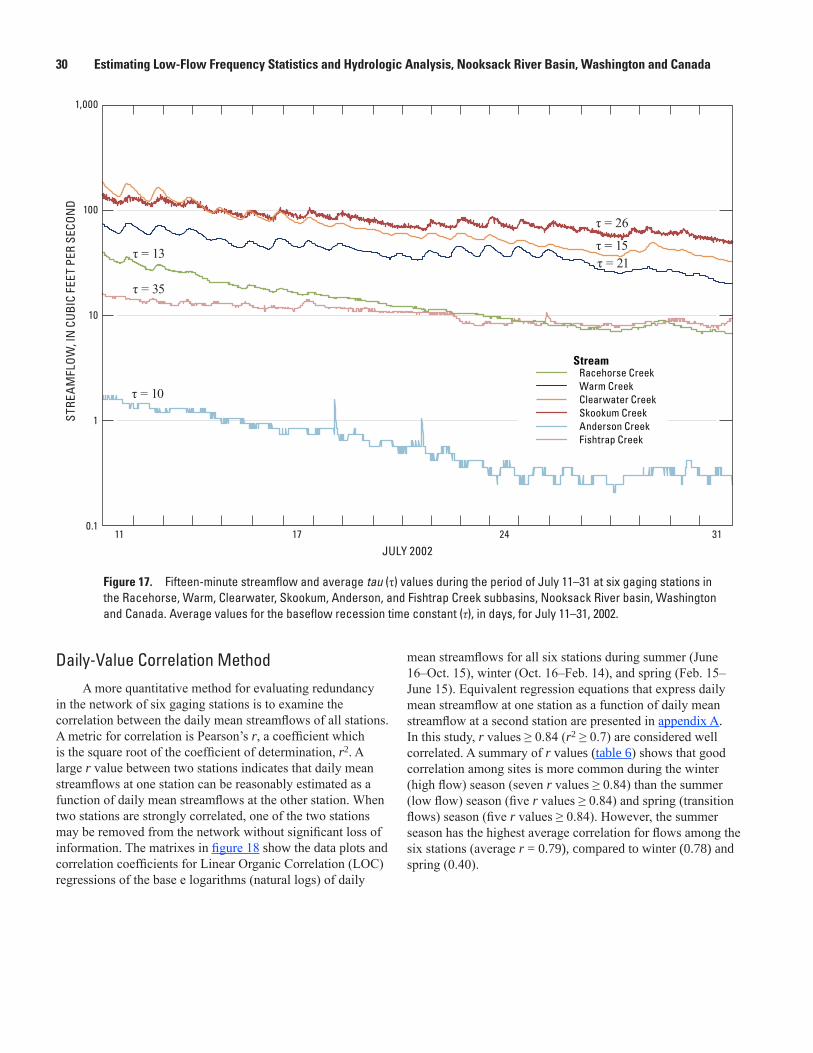
30 Estimating Low-Flow Frequency Statistics and Hydrologic Analysis, Nooksack River Basin, Washington and Canada
Daily-Value Correlation MethodA more quantitative method for evaluating redundancy
in the network of six gaging stations is to examine the correlation between the daily mean streamflows of all stations. A metric for correlation is Pearson’s r, a coefficient which is the square root of the coefficient of determination, r2. A large r value between two stations indicates that daily mean streamflows at one station can be reasonably estimated as a function of daily mean streamflows at the other station. When two stations are strongly correlated, one of the two stations may be removed from the network without significant loss of information. The matrixes in figure 18 show the data plots and correlation coefficients for Linear Organic Correlation (LOC) regressions of the base e logarithms (natural logs) of daily
mean streamflows for all six stations during summer (June 16–Oct. 15), winter (Oct. 16–Feb. 14), and spring (Feb. 15–June 15). Equivalent regression equations that express daily mean streamflow at one station as a function of daily mean streamflow at a second station are presented in appendix A. In this study, r values ≥ 0.84 (r2 ≥ 0.7) are considered well correlated. A summary of r values (table 6) shows that good correlation among sites is more common during the winter (high flow) season (seven r values ≥ 0.84) than the summer (low flow) season (five r values ≥ 0.84) and spring (transition flows) season (five r values ≥ 0.84). However, the summer season has the highest average correlation for flows among the six stations (average r = 0.79), compared to winter (0.78) and spring (0.40).
STRE
AM
FLO
W, I
N C
UBI
C FE
ET P
ER S
ECO
ND 100
1,000
10
1
0.111
JULY 200217 24 31
Racehorse CreekStream
Warm CreekClearwater CreekSkookum CreekAnderson CreekFishtrap Creek
τ = 10
τ = 13
τ = 35
τ = 21
τ = 26
τ = 15
Figure 17. Fifteen-minute streamflow and average tau (τ) values during the period of July 11–31 at six gaging stations in the Racehorse, Warm, Clearwater, Skookum, Anderson, and Fishtrap Creek subbasins, Nooksack River basin, Washington and Canada. Average values for the baseflow recession time constant (τ), in days, for July 11–31, 2002.
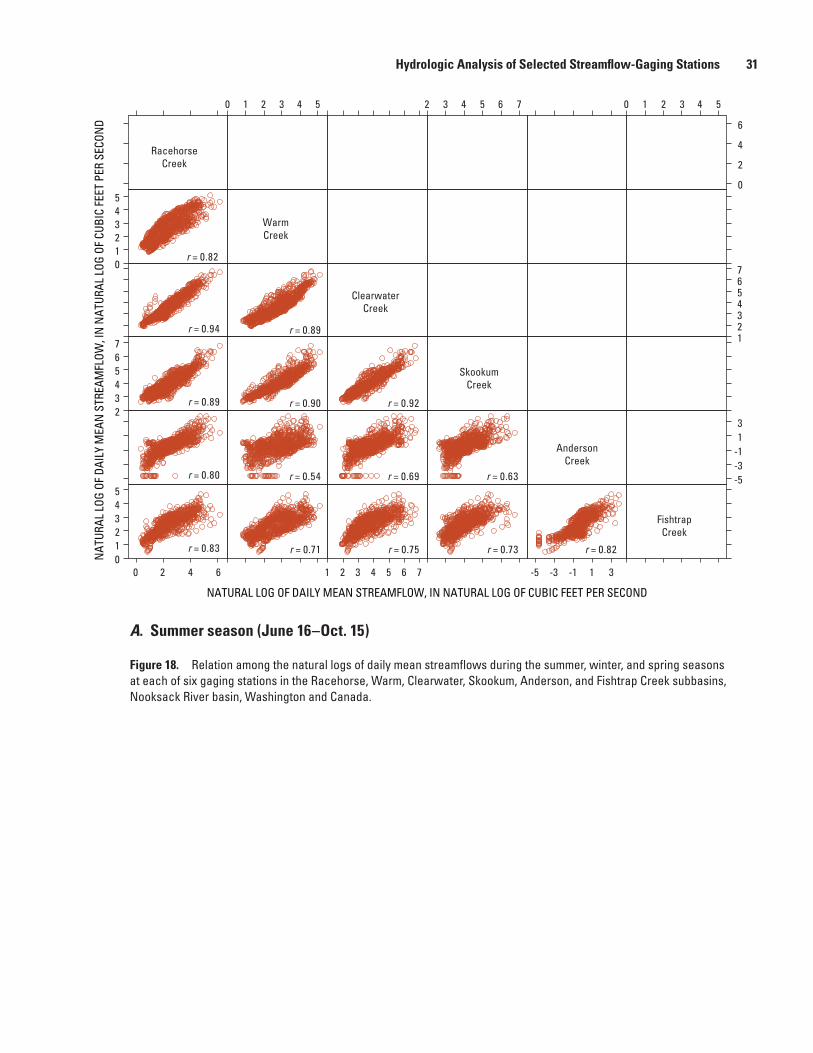
30 Estimating Low-Flow Frequency Statistics and Hydrologic Analysis, Nooksack River Basin, Washington and Canada Hydrologic Analysis of Selected Streamflow-Gaging Stations 31
watac09-0390_fig 18A
NATURAL LOG OF DAILY MEAN STREAMFLOW, IN NATURAL LOG OF CUBIC FEET PER SECOND
NAT
URAL
LOG
OF
DAIL
Y M
EAN
STR
EAM
FLOW
, IN
NAT
URAL
LOG
OF
CUBI
C FE
ET P
ER S
ECON
D
A. Summer season (June 16–Oct. 15)
012345
234567
012345
0 2 4 6
0 1 2 3 4 5
1 2 3 4 5 6 7
2 3 4 5 6 7
-5 -3 -1 1 3
0
2
4
6
0 1 2 3 4 5
1234567
-5-3-113
RacehorseCreek
WarmCreek
ClearwaterCreek
SkookumCreek
AndersonCreek
FishtrapCreek
r = 0.82
r = 0.94
r = 0.89
r = 0.80
r = 0.83
r = 0.89
r = 0.90
r = 0.54
r = 0.71
r = 0.92
r = 0.69
r = 0.75
r = 0.63
r = 0.73 r = 0.82
Figure 18. Relation among the natural logs of daily mean streamflows during the summer, winter, and spring seasons at each of six gaging stations in the Racehorse, Warm, Clearwater, Skookum, Anderson, and Fishtrap Creek subbasins, Nooksack River basin, Washington and Canada.
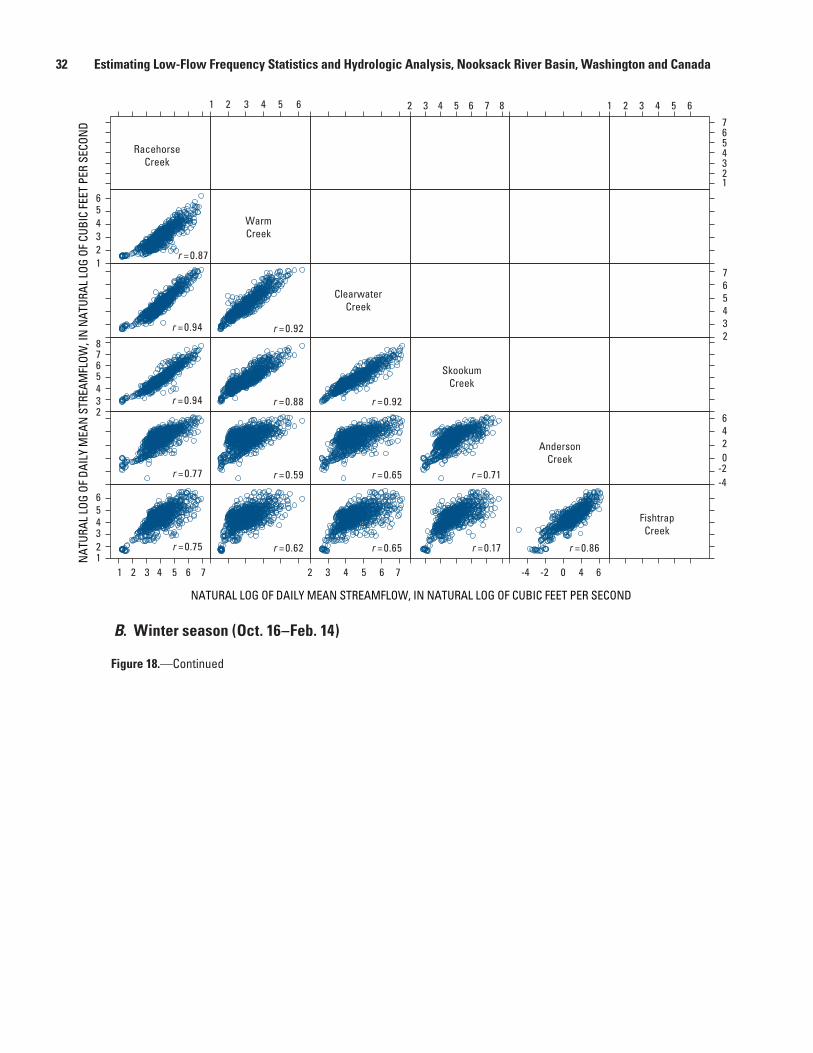
32 Estimating Low-Flow Frequency Statistics and Hydrologic Analysis, Nooksack River Basin, Washington and Canada
watac09-0390_fig 18B
B. Winter season (Oct. 16–Feb. 14)
123456
2345678
123456
1 2 3 4 5 6 7
1 2 3 4 5 6
2 3 4 5 6 7
2 3 4 5 6 7 8
-4 -2 0 4 6
1234567
1 2 3 4 5 6
234
20
46
567
-4-2
RacehorseCreek
WarmCreek
ClearwaterCreek
SkookumCreek
AndersonCreek
FishtrapCreek
r =0.87
r =0.94
r =0.94
r =0.77
r =0.75
r =0.92
r =0.88
r =0.59
r =0.62
r =0.92
r =0.65
r =0.65
r =0.71
r =0.17 r =0.86
NATURAL LOG OF DAILY MEAN STREAMFLOW, IN NATURAL LOG OF CUBIC FEET PER SECOND
NAT
URAL
LOG
OF
DAIL
Y M
EAN
STR
EAM
FLOW
, IN
NAT
URAL
LOG
OF
CUBI
C FE
ET P
ER S
ECON
D
Figure 18.—Continued
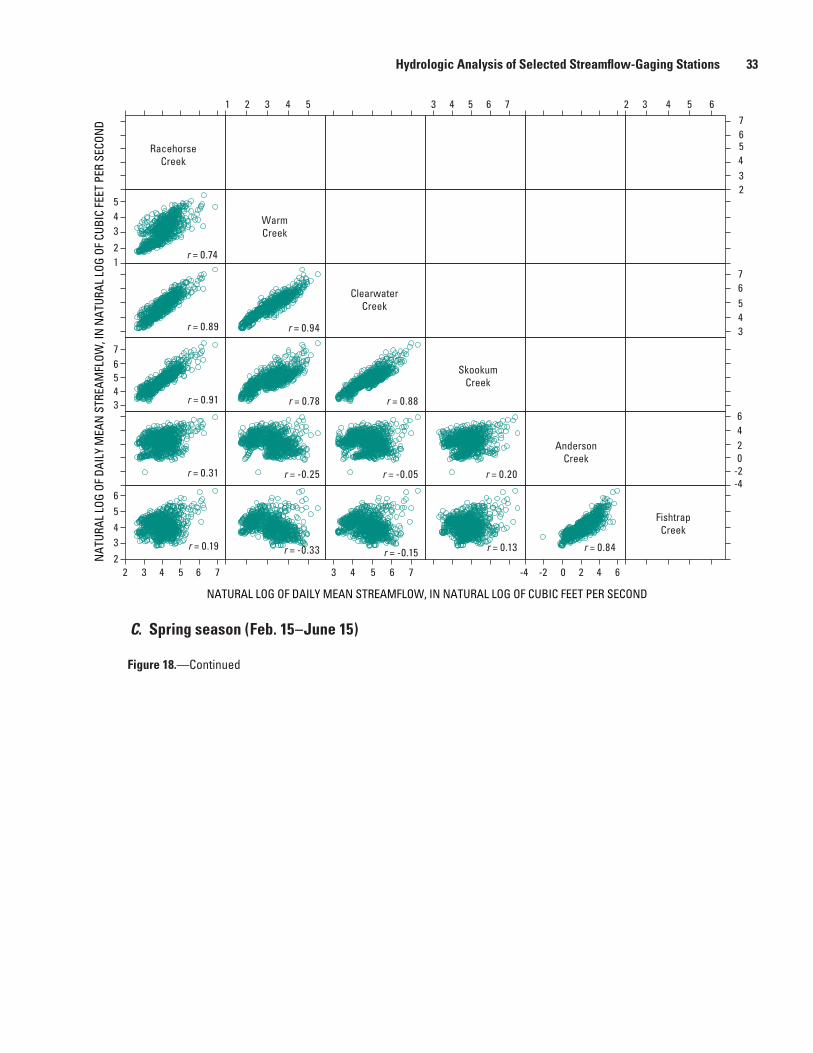
32 Estimating Low-Flow Frequency Statistics and Hydrologic Analysis, Nooksack River Basin, Washington and Canada Hydrologic Analysis of Selected Streamflow-Gaging Stations 33
watac09-0390_fig 18C
C. Spring season (Feb. 15–June 15)
12
345
34567
23456
2 3 4 5 6 7 3 4 5 6 7
1 2 3 4 5 3 4 5 6 7
-4 -2 0 2 4 6
2
543
76
2 3 4 5 6
34567
-4-202
64
RacehorseCreek
WarmCreek
ClearwaterCreek
SkookumCreek
AndersonCreek
FishtrapCreek
r = 0.74
r = 0.89
r = 0.91
r = 0.31
r = 0.19
r = 0.94
r = 0.78
r = -0.25
r = -0.33
r = 0.88
r = -0.05
r = -0.15
r = 0.20
r = 0.13 r = 0.84
NAT
URAL
LOG
OF
DAIL
Y M
EAN
STR
EAM
FLOW
, IN
NAT
URAL
LOG
OF
CUBI
C FE
ET P
ER S
ECON
D
NATURAL LOG OF DAILY MEAN STREAMFLOW, IN NATURAL LOG OF CUBIC FEET PER SECOND
Figure 18.—Continued
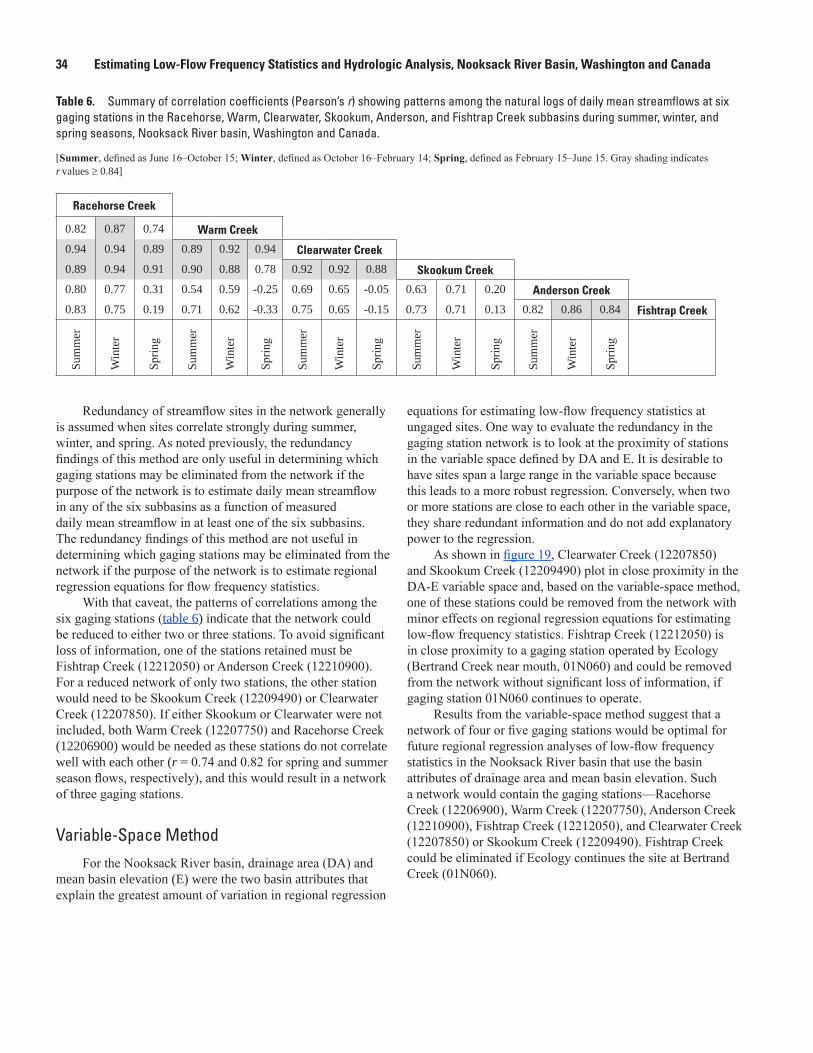
34 Estimating Low-Flow Frequency Statistics and Hydrologic Analysis, Nooksack River Basin, Washington and Canada
Redundancy of streamflow sites in the network generally is assumed when sites correlate strongly during summer, winter, and spring. As noted previously, the redundancy findings of this method are only useful in determining which gaging stations may be eliminated from the network if the purpose of the network is to estimate daily mean streamflow in any of the six subbasins as a function of measured daily mean streamflow in at least one of the six subbasins. The redundancy findings of this method are not useful in determining which gaging stations may be eliminated from the network if the purpose of the network is to estimate regional regression equations for flow frequency statistics.
With that caveat, the patterns of correlations among the six gaging stations (table 6) indicate that the network could be reduced to either two or three stations. To avoid significant loss of information, one of the stations retained must be Fishtrap Creek (12212050) or Anderson Creek (12210900). For a reduced network of only two stations, the other station would need to be Skookum Creek (12209490) or Clearwater Creek (12207850). If either Skookum or Clearwater were not included, both Warm Creek (12207750) and Racehorse Creek (12206900) would be needed as these stations do not correlate well with each other (r = 0.74 and 0.82 for spring and summer season flows, respectively), and this would result in a network of three gaging stations.
Variable-Space MethodFor the Nooksack River basin, drainage area (DA) and
mean basin elevation (E) were the two basin attributes that explain the greatest amount of variation in regional regression
equations for estimating low-flow frequency statistics at ungaged sites. One way to evaluate the redundancy in the gaging station network is to look at the proximity of stations in the variable space defined by DA and E. It is desirable to have sites span a large range in the variable space because this leads to a more robust regression. Conversely, when two or more stations are close to each other in the variable space, they share redundant information and do not add explanatory power to the regression.
As shown in figure 19, Clearwater Creek (12207850) and Skookum Creek (12209490) plot in close proximity in the DA-E variable space and, based on the variable-space method, one of these stations could be removed from the network with minor effects on regional regression equations for estimating low-flow frequency statistics. Fishtrap Creek (12212050) is in close proximity to a gaging station operated by Ecology (Bertrand Creek near mouth, 01N060) and could be removed from the network without significant loss of information, if gaging station 01N060 continues to operate.
Results from the variable-space method suggest that a network of four or five gaging stations would be optimal for future regional regression analyses of low-flow frequency statistics in the Nooksack River basin that use the basin attributes of drainage area and mean basin elevation. Such a network would contain the gaging stations—Racehorse Creek (12206900), Warm Creek (12207750), Anderson Creek (12210900), Fishtrap Creek (12212050), and Clearwater Creek (12207850) or Skookum Creek (12209490). Fishtrap Creek could be eliminated if Ecology continues the site at Bertrand Creek (01N060).
Table 6. Summary of correlation coefficients (Pearson’s r) showing patterns among the natural logs of daily mean streamflows at six gaging stations in the Racehorse, Warm, Clearwater, Skookum, Anderson, and Fishtrap Creek subbasins during summer, winter, and spring seasons, Nooksack River basin, Washington and Canada.
[Summer, defined as June 16–October 15; Winter, defined as October 16–February 14; Spring, defined as February 15–June 15. Gray shading indicates r values ≥ 0.84]
Racehorse Creek
0.82 0.87 0.74 Warm Creek
0.94 0.94 0.89 0.89 0.92 0.94 Clearwater Creek
0.89 0.94 0.91 0.90 0.88 0.78 0.92 0.92 0.88 Skookum Creek
0.80 0.77 0.31 0.54 0.59 -0.25 0.69 0.65 -0.05 0.63 0.71 0.20 Anderson Creek
0.83 0.75 0.19 0.71 0.62 -0.33 0.75 0.65 -0.15 0.73 0.71 0.13 0.82 0.86 0.84 Fishtrap Creek
Sum
mer
Win
ter
Sprin
g
Sum
mer
Win
ter
Sprin
g
Sum
mer
Win
ter
Sprin
g
Sum
mer
Win
ter
Sprin
g
Sum
mer
Win
ter
Sprin
g
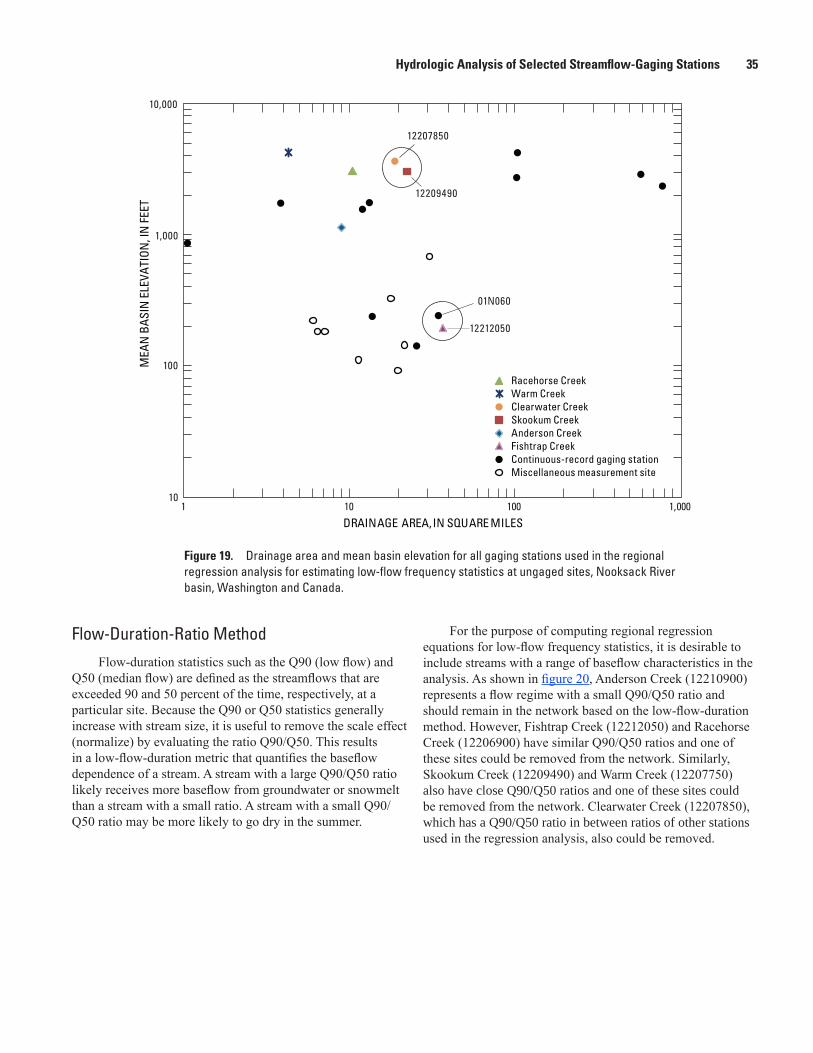
34 Estimating Low-Flow Frequency Statistics and Hydrologic Analysis, Nooksack River Basin, Washington and Canada Hydrologic Analysis of Selected Streamflow-Gaging Stations 35
wataco9-0390_fig 19
MEA
N B
ASIN
ELE
VATI
ON, I
N F
EET
100
1,000
10,000
101 10 100 1,000
01N060
12207850
12209490
12212050
DRAINAGE AREA, IN SQUARE MILES
Continuous-record gaging stationMiscellaneous measurement site
Racehorse CreekWarm CreekClearwater CreekSkookum CreekAnderson CreekFishtrap Creek
Figure 19. Drainage area and mean basin elevation for all gaging stations used in the regional regression analysis for estimating low-flow frequency statistics at ungaged sites, Nooksack River basin, Washington and Canada.
Flow-Duration-Ratio MethodFlow-duration statistics such as the Q90 (low flow) and
Q50 (median flow) are defined as the streamflows that are exceeded 90 and 50 percent of the time, respectively, at a particular site. Because the Q90 or Q50 statistics generally increase with stream size, it is useful to remove the scale effect (normalize) by evaluating the ratio Q90/Q50. This results in a low-flow-duration metric that quantifies the baseflow dependence of a stream. A stream with a large Q90/Q50 ratio likely receives more baseflow from groundwater or snowmelt than a stream with a small ratio. A stream with a small Q90/Q50 ratio may be more likely to go dry in the summer.
For the purpose of computing regional regression equations for low-flow frequency statistics, it is desirable to include streams with a range of baseflow characteristics in the analysis. As shown in figure 20, Anderson Creek (12210900) represents a flow regime with a small Q90/Q50 ratio and should remain in the network based on the low-flow-duration method. However, Fishtrap Creek (12212050) and Racehorse Creek (12206900) have similar Q90/Q50 ratios and one of these sites could be removed from the network. Similarly, Skookum Creek (12209490) and Warm Creek (12207750) also have close Q90/Q50 ratios and one of these sites could be removed from the network. Clearwater Creek (12207850), which has a Q90/Q50 ratio in between ratios of other stations used in the regression analysis, also could be removed.
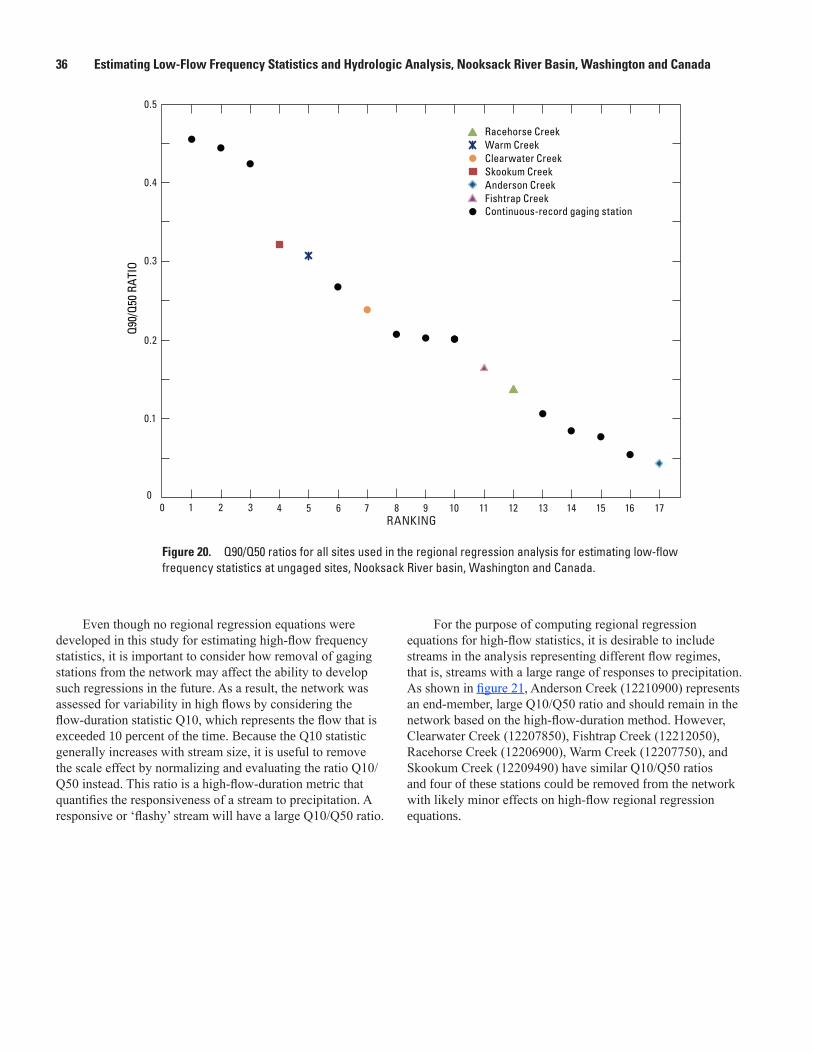
36 Estimating Low-Flow Frequency Statistics and Hydrologic Analysis, Nooksack River Basin, Washington and Canada
Even though no regional regression equations were developed in this study for estimating high-flow frequency statistics, it is important to consider how removal of gaging stations from the network may affect the ability to develop such regressions in the future. As a result, the network was assessed for variability in high flows by considering the flow-duration statistic Q10, which represents the flow that is exceeded 10 percent of the time. Because the Q10 statistic generally increases with stream size, it is useful to remove the scale effect by normalizing and evaluating the ratio Q10/Q50 instead. This ratio is a high-flow-duration metric that quantifies the responsiveness of a stream to precipitation. A responsive or ‘flashy’ stream will have a large Q10/Q50 ratio.
For the purpose of computing regional regression equations for high-flow statistics, it is desirable to include streams in the analysis representing different flow regimes, that is, streams with a large range of responses to precipitation. As shown in figure 21, Anderson Creek (12210900) represents an end-member, large Q10/Q50 ratio and should remain in the network based on the high-flow-duration method. However, Clearwater Creek (12207850), Fishtrap Creek (12212050), Racehorse Creek (12206900), Warm Creek (12207750), and Skookum Creek (12209490) have similar Q10/Q50 ratios and four of these stations could be removed from the network with likely minor effects on high-flow regional regression equations.
wataco9-0390_fig 20
Q90/
Q50
RATI
O
0
0.1
0.2
0.3
0.4
0.5
0 1 2 3 4 5 6 7 8 9 10 11 12 13 14 15 16 17RANKING
Continuous-record gaging station
Racehorse CreekWarm CreekClearwater CreekSkookum CreekAnderson CreekFishtrap Creek
Figure 20. Q90/Q50 ratios for all sites used in the regional regression analysis for estimating low-flow frequency statistics at ungaged sites, Nooksack River basin, Washington and Canada.
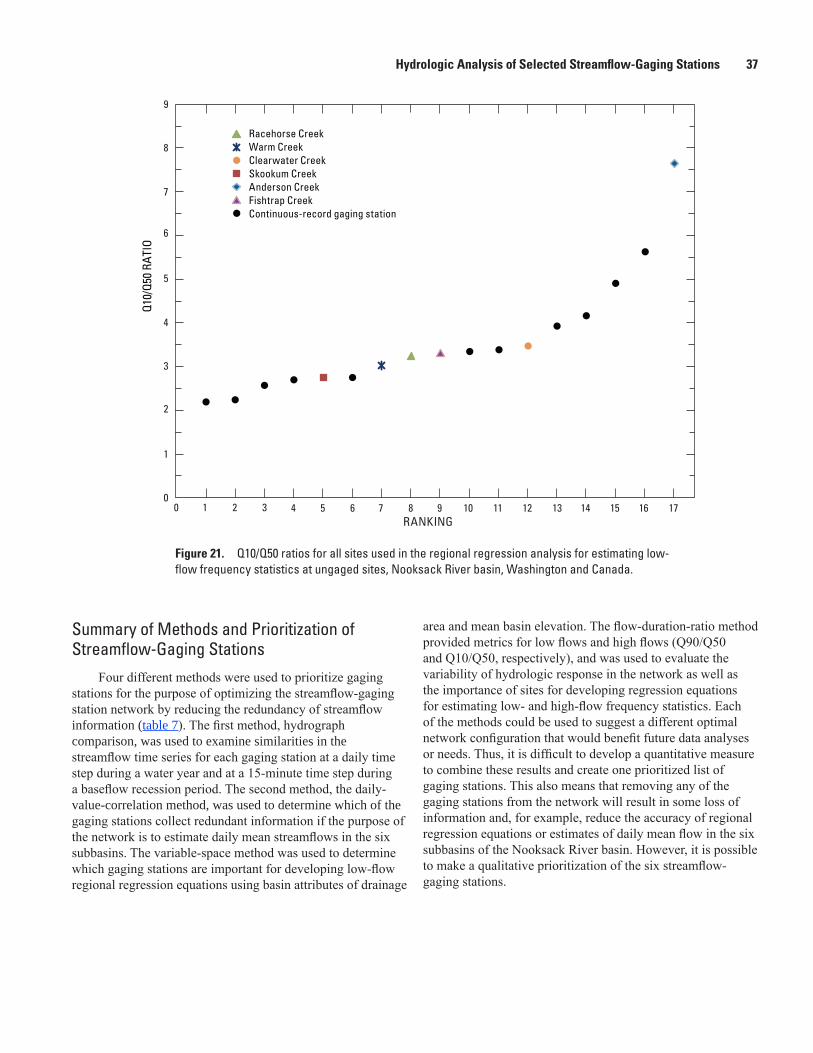
36 Estimating Low-Flow Frequency Statistics and Hydrologic Analysis, Nooksack River Basin, Washington and Canada Hydrologic Analysis of Selected Streamflow-Gaging Stations 37
wataco9-0390_fig 21
Q10/
Q50
RATI
O
RANKING
0
5
4
3
2
1
6
7
8
9
0 1 2 3 4 5 6 7 8 9 10 11 12 13 14 15 16 17
Continuous-record gaging station
Racehorse CreekWarm CreekClearwater CreekSkookum CreekAnderson CreekFishtrap Creek
Figure 21. Q10/Q50 ratios for all sites used in the regional regression analysis for estimating low-flow frequency statistics at ungaged sites, Nooksack River basin, Washington and Canada.
Summary of Methods and Prioritization of Streamflow-Gaging Stations
Four different methods were used to prioritize gaging stations for the purpose of optimizing the streamflow-gaging station network by reducing the redundancy of streamflow information (table 7). The first method, hydrograph comparison, was used to examine similarities in the streamflow time series for each gaging station at a daily time step during a water year and at a 15-minute time step during a baseflow recession period. The second method, the daily-value-correlation method, was used to determine which of the gaging stations collect redundant information if the purpose of the network is to estimate daily mean streamflows in the six subbasins. The variable-space method was used to determine which gaging stations are important for developing low-flow regional regression equations using basin attributes of drainage
area and mean basin elevation. The flow-duration-ratio method provided metrics for low flows and high flows (Q90/Q50 and Q10/Q50, respectively), and was used to evaluate the variability of hydrologic response in the network as well as the importance of sites for developing regression equations for estimating low- and high-flow frequency statistics. Each of the methods could be used to suggest a different optimal network configuration that would benefit future data analyses or needs. Thus, it is difficult to develop a quantitative measure to combine these results and create one prioritized list of gaging stations. This also means that removing any of the gaging stations from the network will result in some loss of information and, for example, reduce the accuracy of regional regression equations or estimates of daily mean flow in the six subbasins of the Nooksack River basin. However, it is possible to make a qualitative prioritization of the six streamflow-gaging stations.
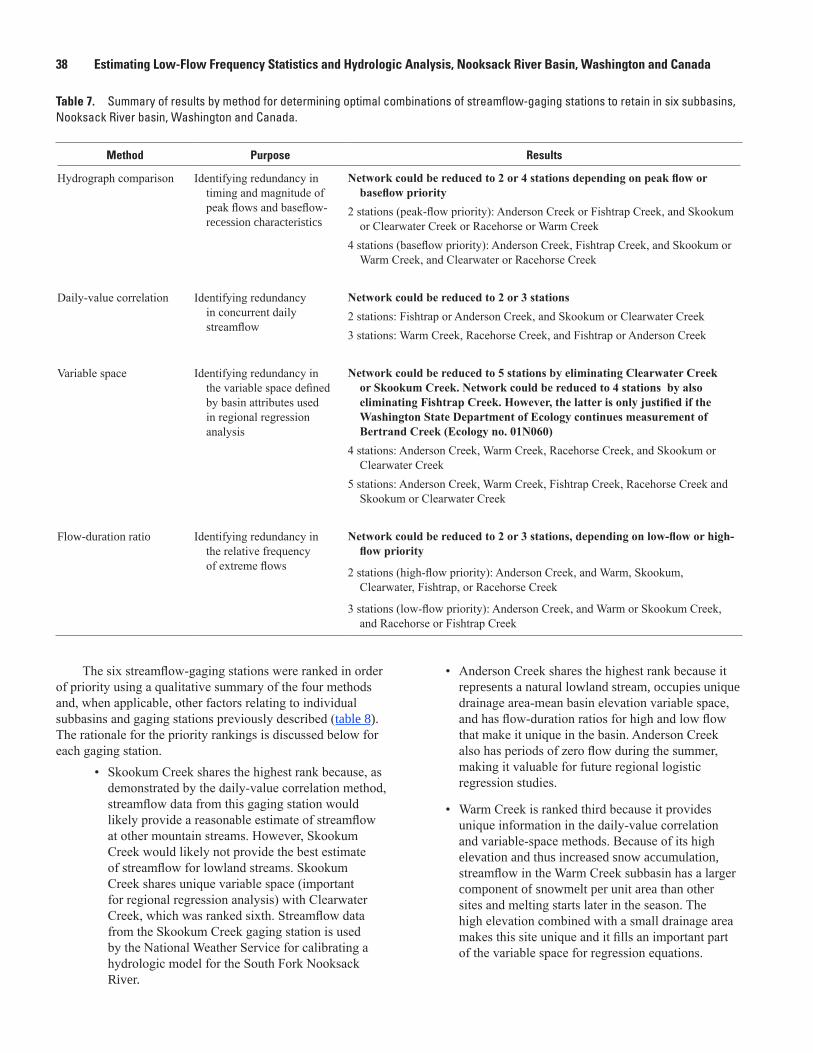
38 Estimating Low-Flow Frequency Statistics and Hydrologic Analysis, Nooksack River Basin, Washington and Canada
The six streamflow-gaging stations were ranked in order of priority using a qualitative summary of the four methods and, when applicable, other factors relating to individual subbasins and gaging stations previously described (table 8). The rationale for the priority rankings is discussed below for each gaging station.
• Skookum Creek shares the highest rank because, as demonstrated by the daily-value correlation method, streamflow data from this gaging station would likely provide a reasonable estimate of streamflow at other mountain streams. However, Skookum Creek would likely not provide the best estimate of streamflow for lowland streams. Skookum Creek shares unique variable space (important for regional regression analysis) with Clearwater Creek, which was ranked sixth. Streamflow data from the Skookum Creek gaging station is used by the National Weather Service for calibrating a hydrologic model for the South Fork Nooksack River.
Table 7. Summary of results by method for determining optimal combinations of streamflow-gaging stations to retain in six subbasins, Nooksack River basin, Washington and Canada.
Method Purpose Results
Hydrograph comparison Identifying redundancy in timing and magnitude of peak flows and baseflow-recession characteristics
Network could be reduced to 2 or 4 stations depending on peak flow or baseflow priority
2 stations (peak-flow priority): Anderson Creek or Fishtrap Creek, and Skookum or Clearwater Creek or Racehorse or Warm Creek
4 stations (baseflow priority): Anderson Creek, Fishtrap Creek, and Skookum or Warm Creek, and Clearwater or Racehorse Creek
Daily-value correlation Identifying redundancy in concurrent daily streamflow
Network could be reduced to 2 or 3 stations 2 stations: Fishtrap or Anderson Creek, and Skookum or Clearwater Creek3 stations: Warm Creek, Racehorse Creek, and Fishtrap or Anderson Creek
Variable space Identifying redundancy in the variable space defined by basin attributes used in regional regression analysis
Network could be reduced to 5 stations by eliminating Clearwater Creek or Skookum Creek. Network could be reduced to 4 stations by also eliminating Fishtrap Creek. However, the latter is only justified if the Washington State Department of Ecology continues measurement of Bertrand Creek (Ecology no. 01N060)
4 stations: Anderson Creek, Warm Creek, Racehorse Creek, and Skookum or Clearwater Creek
5 stations: Anderson Creek, Warm Creek, Fishtrap Creek, Racehorse Creek and Skookum or Clearwater Creek
Flow-duration ratio Identifying redundancy in the relative frequency of extreme flows
Network could be reduced to 2 or 3 stations, depending on low-flow or high-flow priority
2 stations (high-flow priority): Anderson Creek, and Warm, Skookum, Clearwater, Fishtrap, or Racehorse Creek
3 stations (low-flow priority): Anderson Creek, and Warm or Skookum Creek, and Racehorse or Fishtrap Creek
• Anderson Creek shares the highest rank because it represents a natural lowland stream, occupies unique drainage area-mean basin elevation variable space, and has flow-duration ratios for high and low flow that make it unique in the basin. Anderson Creek also has periods of zero flow during the summer, making it valuable for future regional logistic regression studies.
• Warm Creek is ranked third because it provides unique information in the daily-value correlation and variable-space methods. Because of its high elevation and thus increased snow accumulation, streamflow in the Warm Creek subbasin has a larger component of snowmelt per unit area than other sites and melting starts later in the season. The high elevation combined with a small drainage area makes this site unique and it fills an important part of the variable space for regression equations.
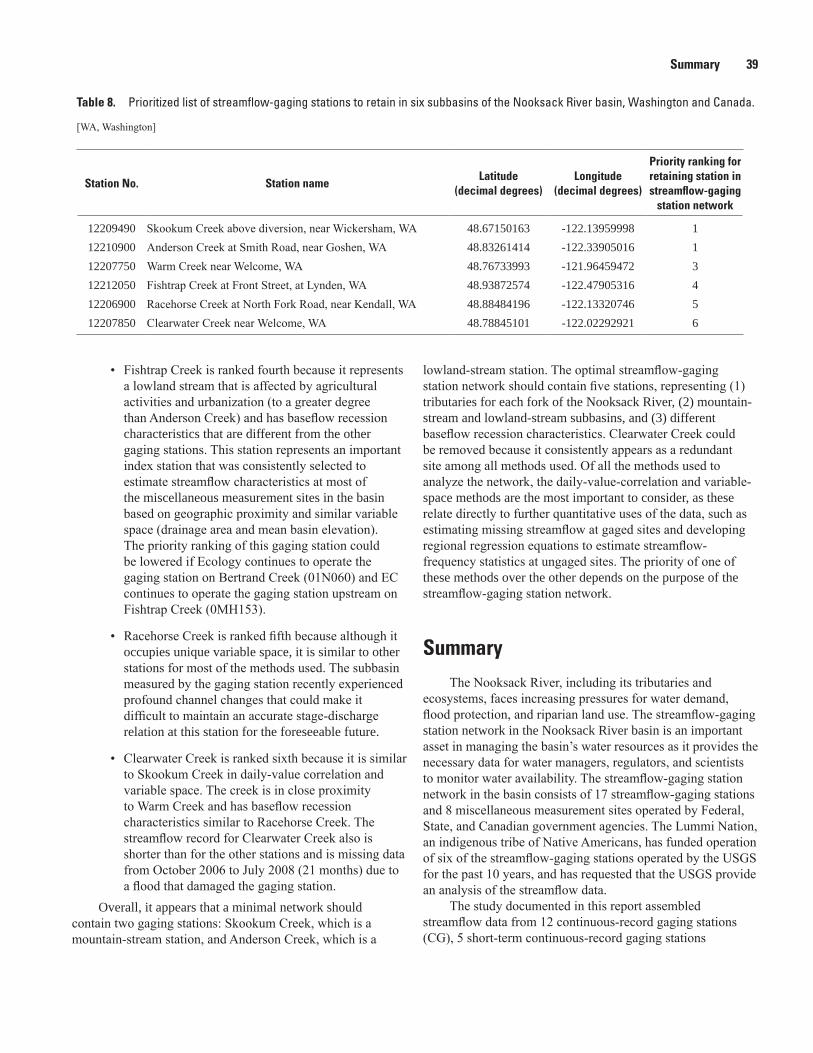
38 Estimating Low-Flow Frequency Statistics and Hydrologic Analysis, Nooksack River Basin, Washington and Canada Summary 39
• Fishtrap Creek is ranked fourth because it represents a lowland stream that is affected by agricultural activities and urbanization (to a greater degree than Anderson Creek) and has baseflow recession characteristics that are different from the other gaging stations. This station represents an important index station that was consistently selected to estimate streamflow characteristics at most of the miscellaneous measurement sites in the basin based on geographic proximity and similar variable space (drainage area and mean basin elevation). The priority ranking of this gaging station could be lowered if Ecology continues to operate the gaging station on Bertrand Creek (01N060) and EC continues to operate the gaging station upstream on Fishtrap Creek (0MH153).
• Racehorse Creek is ranked fifth because although it occupies unique variable space, it is similar to other stations for most of the methods used. The subbasin measured by the gaging station recently experienced profound channel changes that could make it difficult to maintain an accurate stage-discharge relation at this station for the foreseeable future.
• Clearwater Creek is ranked sixth because it is similar to Skookum Creek in daily-value correlation and variable space. The creek is in close proximity to Warm Creek and has baseflow recession characteristics similar to Racehorse Creek. The streamflow record for Clearwater Creek also is shorter than for the other stations and is missing data from October 2006 to July 2008 (21 months) due to a flood that damaged the gaging station.
Overall, it appears that a minimal network should contain two gaging stations: Skookum Creek, which is a mountain-stream station, and Anderson Creek, which is a
lowland-stream station. The optimal streamflow-gaging station network should contain five stations, representing (1) tributaries for each fork of the Nooksack River, (2) mountain-stream and lowland-stream subbasins, and (3) different baseflow recession characteristics. Clearwater Creek could be removed because it consistently appears as a redundant site among all methods used. Of all the methods used to analyze the network, the daily-value-correlation and variable-space methods are the most important to consider, as these relate directly to further quantitative uses of the data, such as estimating missing streamflow at gaged sites and developing regional regression equations to estimate streamflow-frequency statistics at ungaged sites. The priority of one of these methods over the other depends on the purpose of the streamflow-gaging station network.
SummaryThe Nooksack River, including its tributaries and
ecosystems, faces increasing pressures for water demand, flood protection, and riparian land use. The streamflow-gaging station network in the Nooksack River basin is an important asset in managing the basin’s water resources as it provides the necessary data for water managers, regulators, and scientists to monitor water availability. The streamflow-gaging station network in the basin consists of 17 streamflow-gaging stations and 8 miscellaneous measurement sites operated by Federal, State, and Canadian government agencies. The Lummi Nation, an indigenous tribe of Native Americans, has funded operation of six of the streamflow-gaging stations operated by the USGS for the past 10 years, and has requested that the USGS provide an analysis of the streamflow data.
The study documented in this report assembled streamflow data from 12 continuous-record gaging stations (CG), 5 short-term continuous-record gaging stations
Table 8. Prioritized list of streamflow-gaging stations to retain in six subbasins of the Nooksack River basin, Washington and Canada.
[WA, Washington]
Station No. Station nameLatitude
(decimal degrees)Longitude
(decimal degrees)
Priority ranking for retaining station in streamflow-gaging
station network
12209490 Skookum Creek above diversion, near Wickersham, WA 48.67150163 -122.13959998 112210900 Anderson Creek at Smith Road, near Goshen, WA 48.83261414 -122.33905016 112207750 Warm Creek near Welcome, WA 48.76733993 -121.96459472 312212050 Fishtrap Creek at Front Street, at Lynden, WA 48.93872574 -122.47905316 412206900 Racehorse Creek at North Fork Road, near Kendall, WA 48.88484196 -122.13320746 512207850 Clearwater Creek near Welcome, WA 48.78845101 -122.02292921 6
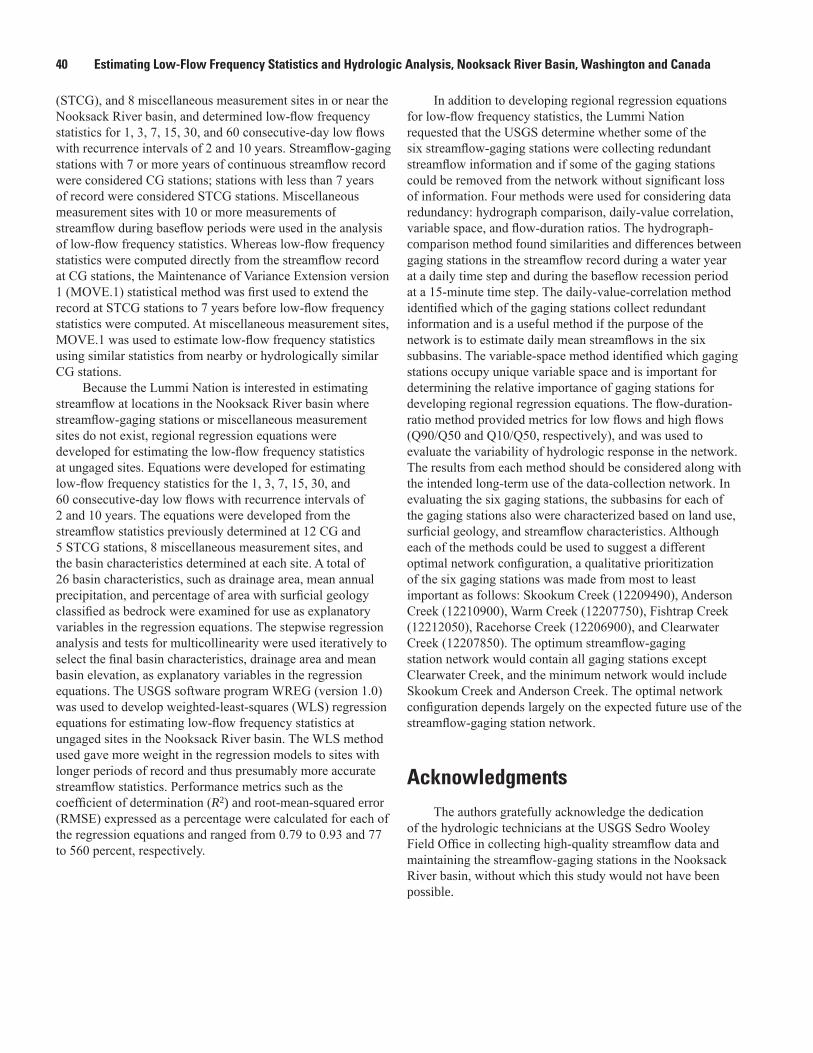
40 Estimating Low-Flow Frequency Statistics and Hydrologic Analysis, Nooksack River Basin, Washington and Canada
(STCG), and 8 miscellaneous measurement sites in or near the Nooksack River basin, and determined low-flow frequency statistics for 1, 3, 7, 15, 30, and 60 consecutive-day low flows with recurrence intervals of 2 and 10 years. Streamflow-gaging stations with 7 or more years of continuous streamflow record were considered CG stations; stations with less than 7 years of record were considered STCG stations. Miscellaneous measurement sites with 10 or more measurements of streamflow during baseflow periods were used in the analysis of low-flow frequency statistics. Whereas low-flow frequency statistics were computed directly from the streamflow record at CG stations, the Maintenance of Variance Extension version 1 (MOVE.1) statistical method was first used to extend the record at STCG stations to 7 years before low-flow frequency statistics were computed. At miscellaneous measurement sites, MOVE.1 was used to estimate low-flow frequency statistics using similar statistics from nearby or hydrologically similar CG stations.
Because the Lummi Nation is interested in estimating streamflow at locations in the Nooksack River basin where streamflow-gaging stations or miscellaneous measurement sites do not exist, regional regression equations were developed for estimating the low-flow frequency statistics at ungaged sites. Equations were developed for estimating low-flow frequency statistics for the 1, 3, 7, 15, 30, and 60 consecutive-day low flows with recurrence intervals of 2 and 10 years. The equations were developed from the streamflow statistics previously determined at 12 CG and 5 STCG stations, 8 miscellaneous measurement sites, and the basin characteristics determined at each site. A total of 26 basin characteristics, such as drainage area, mean annual precipitation, and percentage of area with surficial geology classified as bedrock were examined for use as explanatory variables in the regression equations. The stepwise regression analysis and tests for multicollinearity were used iteratively to select the final basin characteristics, drainage area and mean basin elevation, as explanatory variables in the regression equations. The USGS software program WREG (version 1.0) was used to develop weighted-least-squares (WLS) regression equations for estimating low-flow frequency statistics at ungaged sites in the Nooksack River basin. The WLS method used gave more weight in the regression models to sites with longer periods of record and thus presumably more accurate streamflow statistics. Performance metrics such as the coefficient of determination (R2) and root-mean-squared error (RMSE) expressed as a percentage were calculated for each of the regression equations and ranged from 0.79 to 0.93 and 77 to 560 percent, respectively.
In addition to developing regional regression equations for low-flow frequency statistics, the Lummi Nation requested that the USGS determine whether some of the six streamflow-gaging stations were collecting redundant streamflow information and if some of the gaging stations could be removed from the network without significant loss of information. Four methods were used for considering data redundancy: hydrograph comparison, daily-value correlation, variable space, and flow-duration ratios. The hydrograph-comparison method found similarities and differences between gaging stations in the streamflow record during a water year at a daily time step and during the baseflow recession period at a 15-minute time step. The daily-value-correlation method identified which of the gaging stations collect redundant information and is a useful method if the purpose of the network is to estimate daily mean streamflows in the six subbasins. The variable-space method identified which gaging stations occupy unique variable space and is important for determining the relative importance of gaging stations for developing regional regression equations. The flow-duration-ratio method provided metrics for low flows and high flows (Q90/Q50 and Q10/Q50, respectively), and was used to evaluate the variability of hydrologic response in the network. The results from each method should be considered along with the intended long-term use of the data-collection network. In evaluating the six gaging stations, the subbasins for each of the gaging stations also were characterized based on land use, surficial geology, and streamflow characteristics. Although each of the methods could be used to suggest a different optimal network configuration, a qualitative prioritization of the six gaging stations was made from most to least important as follows: Skookum Creek (12209490), Anderson Creek (12210900), Warm Creek (12207750), Fishtrap Creek (12212050), Racehorse Creek (12206900), and Clearwater Creek (12207850). The optimum streamflow-gaging station network would contain all gaging stations except Clearwater Creek, and the minimum network would include Skookum Creek and Anderson Creek. The optimal network configuration depends largely on the expected future use of the streamflow-gaging station network.
AcknowledgmentsThe authors gratefully acknowledge the dedication
of the hydrologic technicians at the USGS Sedro Wooley Field Office in collecting high-quality streamflow data and maintaining the streamflow-gaging stations in the Nooksack River basin, without which this study would not have been possible.
40 Estimating Low-Flow Frequency Statistics and Hydrologic Analysis, Nooksack River Basin, Washington and Canada References Cited 41
References Cited
Cox, S.E., Simonds, F.W., Doremus, Llyn, Huffman, R.L., and Defawe, R.M., 2005, Groundwater/surface water interactions and quality of discharging groundwater in streams of the lower Nooksack River Basin, Whatcom County, Washington: U.S. Geological Survey Scientific Investigations Report 2005-5255, 46 p.
Cummans, J.E., 1976, Low-flow characteristics of streams on the Kitsap Peninsula and selected adjacent islands, Washington: U.S. Geological Survey Open-File Report 76-704, 44 p.
Dragovich, J.D., Dunn, A., Parkinson, K.T., Kahle, S.C., and Pringle, P.T., 1997b, Quaternary stratigraphy and cross-sections, Nooksack, Columbia, and Saar Creek Valleys, Kendall and Deming 7.5-minute quadrangles, Western Whatcom County, Washington: Washington Division of Geology and Earth Resources Open-File Report 97-4, 13 p.
Easterbrook, D.J., Kovanen, D.J., and Slaymaker, O., 2007, New developments in late Pleistocene and Holocene glaciations and volcanism in the Fraser Lowland and North Cascades, Washington, in Stelling P., and Tucker, D.S., eds., Floods, Faults and Fire: Geological Field Trips in Washington State and Southwest British Columbia: Geological Society of America Field Guide 9, p. 31-56.
Eng, K., and Milly, P.C.D., 2007, Relating low-flow characteristics to the base flow recession time constant at partial record stream gauges: Water Resources Research, v. 43, 8 p.
Funkouser, J.E., Eng, K., and Moix, M.W., 2008, Low-flow characteristics and regionalization of low-flow characteristics for selected streams in Arkansas: U.S. Geological Survey Scientific Investigations Report 2008-5065, 170 p.
Haushild, W.L., and LaFrance, D.E., 1977, Low-flow characteristics of streams on the Olympic Peninsula, Washington: U.S. Geological Survey Open-File Report 77-812, 25 p.
Hidaka, F.T., 1973, Low-flow characteristics of streams in the Puget Sound Region, Washington: U.S. Geological Survey Open-File Report 72-163, 55 p., 1 map sheet.
Hirsch, R.M., 1982, A comparison of four streamflow record extension techniques: Water Resources Research, v. 18, no. 4., p. 1081-1088.
Hortness, J.E., 2006, Estimating low-flow frequency statistics for unregulated streams in Idaho: U.S. Geological Survey Scientific Investigations Report 2006-5035, 31 p.
Jones, M.A., 1999, Geologic framework of the Puget Sound aquifer system, Washington and British Columbia: U.S. Geological Survey Professional Paper 1424-C, 31 p.
Linneman, S., Pittman, P., and Vaugeois, L., 2007, Lively Landscapes: Major Holocene Geomorphic Events in the Nooksack –Sumas Valley, in Stelling P., and Tucker, D.S., eds., Floods, Faults and Fire: Geological Field Trips in Washington State and Southwest British Columbia: Geological Society of America Field Guide 9, p. 99-119.
Multi-Resolution Land Characteristics Consortium (MRLC), 2001, National Land Cover Database 2001, accessed March 2009 at URL: http://www.mrlc.gov/index.php
National Oceanic and Atmospheric Administration, 2007, Climatological Data, Annual Summary, Washington, 2007 (Bellingham and Clearbrook stations): National Climatic Data Center, Asheville, NC, v. 111, no. 13, 30 p.
PRISM Climate Group, 1998, accessed March 2009 at URL http://www.prism.oregonstate.edu/index.phtml
Ries, K.G., and Friesz, P.J., 2000, Methods for estimating low-flow statistics for Massachusetts streams: Water-Resources Investigation Report 2000-4135, 81 p.
Riggs, H.C., 1972, Low-flow investigations: U.S. Geological Survey Techniques of Water-Resource Investigations, book 4, chap. B1, 18 p.
Risley, J., Stonewall, A., and Haluska, T., 2008, Estimating flow-duration and low-flow frequency statistics for unregulated streams in Oregon: U.S. Geological Survey Scientific Investigations Report 2008-5126, 22 p.
TIBCO Software Inc., 2008, Spotfire S+ Version 8.1 for Windows.
U.S. Census Bureau, 2000, United States Census 2000, accessed April 2009 at URL http://www.census.gov/main/www/cen2000.html
U.S. Geological Survey, 2008, Water-Data Report 2008: USGS 12213100 Nooksack River at Ferndale, Washington, accessed May 2009, at URL http://wdr.water.usgs.gov/wy2008/pdfs/12213100.2008.pdf
Vaccaro, J.J., Hansen, A.J., and Jones, M.A., 1998, Hydrogeologic framework of the Puget Sound aquifer system, Washington and British Columbia: U.S. Geological Survey Professional Paper 1424-D, 77 p.
Washington Department of Fish and Wildlife, 2002, Salmonid Stock Inventory, accessed May 2009 at URL http://wdfw.wa.gov/fish/sasi/
Washington State Department of Ecology, 1985, Nooksack water resources inventory area: Instream resources protection program including administrative rules (Water Resource Inventory Area 1), State Water Program, W.W.I.R.P.P. series, no. 11, Washington State Department of Ecology, Olympia, WA., 193 p.

42 Estimating Low-Flow Frequency Statistics and Hydrologic Analysis, Nooksack River Basin, Washington and Canada
This page intentionally left blank.
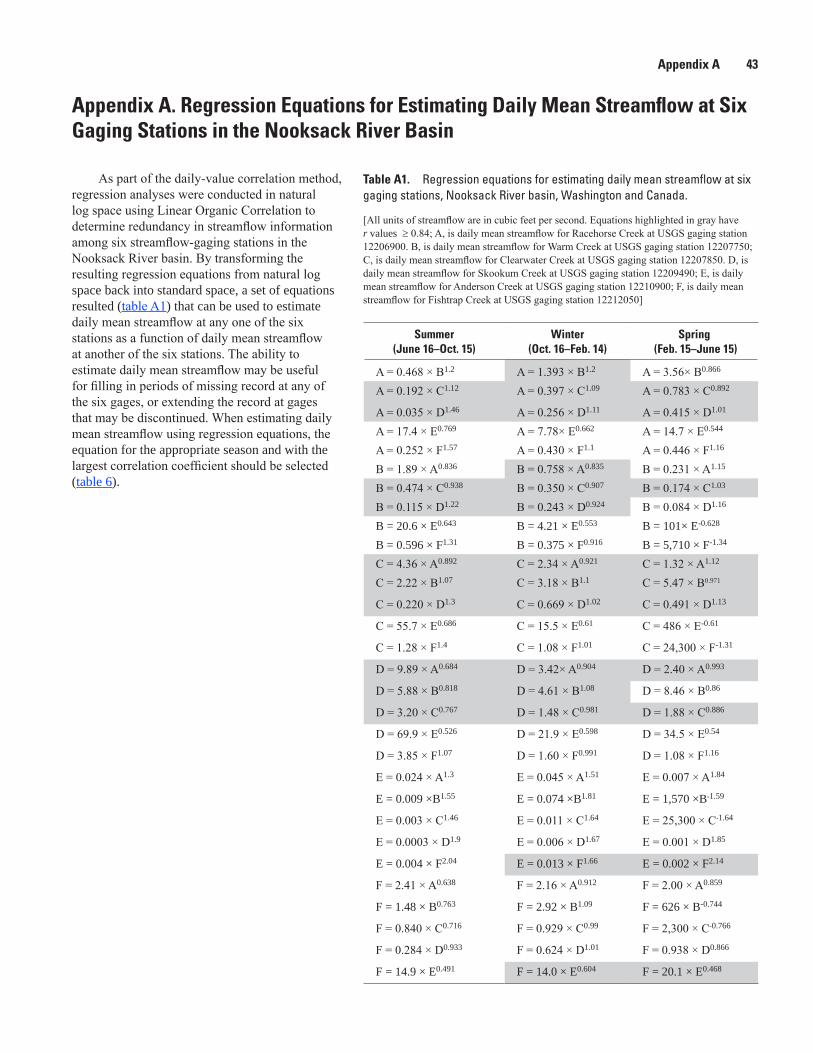
42 Estimating Low-Flow Frequency Statistics and Hydrologic Analysis, Nooksack River Basin, Washington and Canada Appendix A 43
Appendix A. Regression Equations for Estimating Daily Mean Streamflow at Six Gaging Stations in the Nooksack River Basin
As part of the daily-value correlation method, regression analyses were conducted in natural log space using Linear Organic Correlation to determine redundancy in streamflow information among six streamflow-gaging stations in the Nooksack River basin. By transforming the resulting regression equations from natural log space back into standard space, a set of equations resulted (table A1) that can be used to estimate daily mean streamflow at any one of the six stations as a function of daily mean streamflow at another of the six stations. The ability to estimate daily mean streamflow may be useful for filling in periods of missing record at any of the six gages, or extending the record at gages that may be discontinued. When estimating daily mean streamflow using regression equations, the equation for the appropriate season and with the largest correlation coefficient should be selected (table 6).
Table A1. Regression equations for estimating daily mean streamflow at six gaging stations, Nooksack River basin, Washington and Canada.
[All units of streamflow are in cubic feet per second. Equations highlighted in gray have r values ≥ 0.84; A, is daily mean streamflow for Racehorse Creek at USGS gaging station 12206900. B, is daily mean streamflow for Warm Creek at USGS gaging station 12207750; C, is daily mean streamflow for Clearwater Creek at USGS gaging station 12207850. D, is daily mean streamflow for Skookum Creek at USGS gaging station 12209490; E, is daily mean streamflow for Anderson Creek at USGS gaging station 12210900; F, is daily mean streamflow for Fishtrap Creek at USGS gaging station 12212050]
Summer(June 16–Oct. 15)
Winter (Oct. 16–Feb. 14)
Spring (Feb. 15–June 15)
A = 0.468 × B1.2 A = 1.393 × B1.2 A = 3.56× B0.866
A = 0.192 × C1.12 A = 0.397 × C1.09 A = 0.783 × C0.892
A = 0.035 × D1.46 A = 0.256 × D1.11 A = 0.415 × D1.01
A = 17.4 × E0.769 A = 7.78× E0.662 A = 14.7 × E0.544
A = 0.252 × F1.57 A = 0.430 × F1.1 A = 0.446 × F1.16
B = 1.89 × A0.836 B = 0.758 × A0.835 B = 0.231 × A1.15
B = 0.474 × C0.938 B = 0.350 × C0.907 B = 0.174 × C1.03
B = 0.115 × D1.22 B = 0.243 × D0.924 B = 0.084 × D1.16
B = 20.6 × E0.643 B = 4.21 × E0.553 B = 101× E-0.628
B = 0.596 × F1.31 B = 0.375 × F0.916 B = 5,710 × F-1.34
C = 4.36 × A0.892 C = 2.34 × A0.921 C = 1.32 × A1.12
C = 2.22 × B1.07 C = 3.18 × B1.1 C = 5.47 × B0.971
C = 0.220 × D1.3 C = 0.669 × D1.02 C = 0.491 × D1.13
C = 55.7 × E0.686 C = 15.5 × E0.61 C = 486 × E-0.61
C = 1.28 × F1.4 C = 1.08 × F1.01 C = 24,300 × F-1.31
D = 9.89 × A0.684 D = 3.42× A0.904 D = 2.40 × A0.993
D = 5.88 × B0.818 D = 4.61 × B1.08 D = 8.46 × B0.86
D = 3.20 × C0.767 D = 1.48 × C0.981 D = 1.88 × C0.886
D = 69.9 × E0.526 D = 21.9 × E0.598 D = 34.5 × E0.54
D = 3.85 × F1.07 D = 1.60 × F0.991 D = 1.08 × F1.16
E = 0.024 × A1.3 E = 0.045 × A1.51 E = 0.007 × A1.84
E = 0.009 ×B1.55 E = 0.074 ×B1.81 E = 1,570 ×B-1.59
E = 0.003 × C1.46 E = 0.011 × C1.64 E = 25,300 × C-1.64
E = 0.0003 × D1.9 E = 0.006 × D1.67 E = 0.001 × D1.85
E = 0.004 × F2.04 E = 0.013 × F1.66 E = 0.002 × F2.14
F = 2.41 × A0.638 F = 2.16 × A0.912 F = 2.00 × A0.859
F = 1.48 × B0.763 F = 2.92 × B1.09 F = 626 × B-0.744
F = 0.840 × C0.716 F = 0.929 × C0.99 F = 2,300 × C-0.766
F = 0.284 × D0.933 F = 0.624 × D1.01 F = 0.938 × D0.866
F = 14.9 × E0.491 F = 14.0 × E0.604 F = 20.1 × E0.468

44 Estimating Low-Flow Frequency Statistics and Hydrologic Analysis, Nooksack River Basin, Washington and Canada
This page intentionally left blank.

Publishing support provided by the U.S. Geological SurveyPublishing Network, Tacoma Publishing Service Center
For more information concerning the research in this report, contact the Director, Washington Water Science Center U.S. Geological Survey
934 Broadway — Suite 300 Tacoma, Washington 98402 http://wa.water.usgs.gov
Curran and Olsen— Estim
ating Low-Flow
Frequency Statistics, Nooksack River Basin, N
orthwestern W
ashington and Canada—Scientific Investigations Report 2009–5170
![Rainfall Frequency Analysis Using Order Statistics ... · PDF fileRainfall Frequency Analysis Using Order Statistics Approach of ... (AERB) [2] guidelines ... Hissar for the period](https://img.pdfslide.net/doc/110x75/5aabe4277f8b9a8f498c8aca/rainfall-frequency-analysis-using-order-statistics-frequency-analysis-using.jpg)