Embed Size (px)
Citation preview

Manuscript received May 19, 2014; revised August 1, 2014.
Lecture Notes on Information Theory Vol. 2, No. 2, June 2014
158©2014 Engineering and Technology Publishingdoi: 10.12720/lnit.2.2.158-162
Estimating Resource Distribution Using Satellite
Images to Utilize Woody Biomass
Yu Ohya, Katsutoshi Kanamori, and Hayato Ohwada Tokyo University of Science, Japan
Email: [email protected], {katsu, ohwada}@rs.tus.ac.jp
Abstract—This study proposes estimating resource
distribution using coarse and comprehensive satellite images
in order to utilize woody biomass. Woody biomass has
potential and there is a large amount of unused forest.
Therefore, determining the location and quantity of forest
resources is important. Lfand-cover classification is
beneficial for finding forest. For such classification, using
high-resolution remote-sensing images has the
disadvantages of high cost and narrow range. This study
used Landsat 8, which provides free coarse satellite images
and employed experimental land-cover classification using
the Normalized Difference Vegetation Index (NDVI). In
addition, this study selected an optimum combination of
satellite images. The proposed method was implemented in
order to develop a resource-distribution map reflecting
latitude and longitude in an unknown forest region. As a
result, this study determined the quantity and location of
biomass and demonstrated the capability of coarse satellite
images.
Index Terms—woody biomass, resource-distribution map,
remote sensing, satellite image, image analysis, GIS
I. INTRODUCTION
Woody biomass has potential for environment and
energy issues. Despite the large quantity of uncontrolled
forest, woody biomass resources, especially tree biomass,
are not used. For harnessing tree biomass, it is important
to determine the resource distribution. However, much
manpower, money, and time are required. Thus, it is
necessary to develop a resource-distribution map that
indicates resource location and quantity.
Remote sensing can be used for classifying land cover
(e.g., water and urban vegetation) for the purpose of
forest preservation. Remote sensing offers such technical
advantages as high resolution; however, its narrow range
makes it inappropriate for finding biomass.
Therefore, this study attempts to develop a
resource-distribution map using free coarse satellite
images to classify land cover in order to clarify the
quantity and location of resources. In addition, this study
seeks to develop optimal transportation using the
resource-distribution map. Thus, this study classified
satellite images using the object-based
maximum-likelihood method. Classification groups (e.g.,
water, urban, castanopsis, live oak, cryptomeria japonica,
and Japanese cypress) were established. In addition, an
optimized combination of satellite images was utilized,
since the use of coarse satellite images affected
classification. This study evaluated precision using a
vegetation index. Furthermore, the quantity of woody
biomass resources was estimated based on classification
results, a resource-distribution map was developed with
the addition of location information, and the use of
selected biomass resources was investigated.
II. RELATED WORK
This section presents related literature on woody
biomass. With the recent broad array of environment
issues promoting nature restoration, the use of biomass
has received much attention. The Geographic Information
System (GIS) has been used in the development of
distribution maps, determination of transportation
distance, and analysis of site conditions. GIS reflects
characteristics of the region that impact system
performance, cost, energy use, and CO2 emission.
Therefore, many previous works used GIS. Moler et al.
investigated the cost of transporting woody biomass to
the Combined Heat and Power (CHP) plant in Denmark
[1], and Shi et al. reported on biofuel plant locational
conditions in Indonesia [2]. There are also such works in
Japan [3], [4]. However, no studies have addressed
realistic utilizable resource amounts of each tree biomass.
Yamamoto et al. did propose transport optimization
utilizing herbaceous biomass [5].
Moriguchi et al. studied the possibility of using
logging residue [6]. Japan uses a thinning system for
forestry preservation. However, there are many
uncontrolled forest areas in Japan. Terada et al. proposed
a forest administration capability [7]; however, utilizing
uncontrolled forest areas requires many people and much
money and time. Therefore, this study proposes remote
sensing for automatically estimating resource
distributions in unused forests.
Alan developed the method of prior probabilities in
maximum-likelihood classification of remotely sensed
data [8]. In addition, Kamagata et al. performed
object-based image analysis on Very High Resolution
(VHR) remote-sensing data [9]. However, VHR is very
expensive and has a narrow range, with no capability for
finding woody biomass resources.
Therefore, the objective of this study is to develop a
resource-distribution map using free coarse satellite

Lecture Notes on Information Theory Vol. 2, No. 2, June 2014
159©2014 Engineering and Technology Publishing
images to classify land cover in order to clarify the
quantity and location of resources. In addition, this study
seeks to optimize transportation using the
resource-distribution map.
III. METHOD
This section presents methods of developing
land-cover classification and estimating woody biomass
resources.
Fig. 1 depicts the methods three-part structure: (A)
preparing satellite images, (B) developing land-cover
classification in categories, and (C) estimating woody
biomass resources with the addition of location
information.
In the first part, many categories are used in an effort
to understand biomass resources. However, classification
becomes increasingly difficult with an increase in the
number of categories. Therefore, we employ object-based
classification, which classifies remote-sensing data
object-by-object rather than pixel-by-pixel and is
composed of neighboring and similar pixels.
Multi-pixels in an object are likely to be in the same
classification group. This resembles human visual
recognition. Thus, object-based classification potentially
has higher accuracy than pixel-based classification.
Moreover, we employ choices using remote-sensing data,
eliminating negative impact data, and creating positive
impact data for classification, in an effort to increase the
accuracy of land-cover classification. Section III-A
describes this method of selection in detail.
In the second part, after preparation of remote-sensing
data, this study develops land-cover classification using
the maximum-likelihood method. Section III-B describes
this method of classification in detail.
In the third part, based on classification results, this
study estimates woody biomass resources with the
addition of location information. Section III-C describes
this method of resource estimation in detail.
A. Selection of Satellite Images
This study establishes many categories in an effort to
understand biomass resources. Thus, accuracy may be
reduced with the use of conventional land-cover
classification. Therefore, negative impact data is
eliminated and positive impact data is created for
classification.
1) Elimination data: A satellite image consists of data
acquired at certain wavelengths. The satellite images,
called "bands," record reflectance ratios of the
wavelengths, and there are many bands. There are some
bands which prevent making a classification. In other
word, using all bands has possibilities to reduce the
accuracy of classification. Thus, the band is likely to have
an adverse impact on classification if one band has
different features than other bands. Therefore, in a certain
classification group, we find a band to band relation, and
avoid the use of non-relation bands in all group.
2) Additional data: We add the Normalized Difference
Vegetation Index (NDVI) to the remote-sensing data [10].
NDVI has the advantage of a correlated band in the
classification of trees, because it indicates the activation
level of vegetation. NDVI provides a difference between
a band of near-infrared (NIR) wavelengths and a band of
visible red (R) wavelengths. Equation (1) calculates the
difference.
This method is used to transform the NDVI's range
from [-1.0, 1.0] to [0, 216
]. Equation (2) is used for
conversion to an integer value.
(1)
( ) (2)
B. Land-Cover Classification
This study classifies satellite images using the
maximum-likelihood method.
( ) | | ( )
( ) (3)
Equation (3) uses a discriminant function. Here,
variable x is observed data, constant k is classification
group, variable mk is a mean vector, and variable is a
variance-covariance matrix in class k. This method
calculates them as follows.
First, observed data x is a one-dimensional vector
consisting of bands at a location. Elements of the vector
have four attributes for each band: range, maximum,
average, and standard deviation of pixels in a
segmentalized area. In this regard, variance-covariance
matrixes inverse has a chance of getting into a rank
deficient if there are too many vector elements. Therefore,
to use four xi each attribute values i, this method
calculates discriminant functions ( ) and multiplies
these functions ( ) by classificatory influence rates
. which is defined the base 10 logarithm of an
accuracy added 10. Here, the accuracy is results of a
classification by the attribute only.
Second, mean vectors mk and variance-covariance
matrixes are vector spaces. They are composed of
training data x. Therefore, in order to use correct data,
this method calculates the vector spaces of mk and
using area data randomly selected from each
classification group. In addition, it is necessary to have
more than one trial, since classifications influences
selected areas. In this study, there are ten trials.
For the above reasons, the maximum-likelihood
method in this study is:
( ) ∑∑ ( )
(4)
When a discriminant function ( ) is minimum, the
land-cover area is group k.
C. Woody Biomass Resources
This study estimates woody biomass resources with
the addition of location information using the
classification results. This method regards the annual
allowable cut as forest growth increments. In other words,
Lecture Notes on Information Theory Vol. 2, No. 2, June 2014
160©2014 Engineering and Technology Publishing
woody biomass resources are less than the amount of
forest growth. Based on this idea, this method calculates
in the order of pixel number, wood-cover area,
forest-growth increments, and woody biomass resources.
First, this method numerates forest cover pixels based
on classification results and converts them to the real
wood-cover area. The wood-cover area is the product of
pixels and the square of resolution performance.
However, the reduced scale depends on images sent from
artificial satellites. The forest-growth increments are thus
calculated using the relationship between wood area and
volume. Table I indicates the timber volume per hectare.
Next, utilizable resources are estimated based on the
relationship between wood volume and mass. Table II
indicates the quantity of energy available per cubic meter.
Wood mass is assumed to have normal distribution
according to median and standard deviation of
Table II, with a confidence level of 95%. NDVI of
Equation (3) is in the range [-1.0, 1.0] and activation
level; thus, this method regards NDVI as an indicator of
deviation from the average value . This presents that
the higher NDVI the more resources.
TABLE I. RELATIONSHIP BETWEEN WOOD AREA AND VOLUME
Species I [m3/ha]
Conifer 6.2 Broadleaf tree 1.2
TABLE II. RELATIONSHIPS BETWEEN WOOD VOLUME AND MASS
Species Range of Value
[kg/m3]
Conifer 418.6 79.6 262.6 - 574.5 Broadleaf tree 650.0 91.8 470.1 - 829.9
For these reasons, this method estimates woody
biomass resources based on real wood-cover area S
hectare.
( ) (5)
IV. EXPERIMENT
This section presents experiments to demonstrate the
usefulness of this method. We developed land-cover
classification and estimated woody biomass resources
with the addition of location information using MATLAB,
which is numerical software that allows digital-image
processing.
A. Data Set
The target region was Kamakura City, Kanagawa
Prefecture, Japan. There were 12 classification groups.
Correct data was a vegetation map drafted by a nature
conservation research group in 2000. Satellite images
were acquired by Landsat 8, launched in 2013. Landsat 8
provided the world's first free satellite images. Its
Operational Land Imager (OLI) and Thermal Infrared
Sensor (TIRS) images consist of nine spectral bands with
a spatial resolution of 30 meters for Bands 1 to 7 and 9.
Thermal Bands 10 and 11 are useful in providing more
accurate surface temperatures and are collected at
100-meter intervals. These bands have 16-bit pixel values.
They are not hyper spectral images but coarser
multi-spectral images.
B. Experiment Details
First, we made a true color image compound from
Band 4 (Red), Band 3 (Green), and Band 2 (Blue), and
segmented it into small area compounds from similar and
neighboring pixels using the Watershed Algorithm [11].
Results indicated that the target region had 11,138 areas.
Table III indicates the number of segmentation areas in
each classification group.
Second, we selected correlated bands. Based on the
result, Bands 1 to 5, 7 to 8, 10 to 11, and added were selected.
We then classified the land cover using those bands
and estimated woody biomass resources. This study
regarded wood-cover areas of less than 4.5ha as having
no resources. In addition, this study put Group 8 of Table
III as non-biomass resources due to evergreen
broad-leaved trees.
TABLE III. RESULTS OF SEGMENTATION
Classification group Number of areas
1 Water areas 4,0333
2 Factories 221
3 Urban areas 3,217
4 Residential areas with forest 877
5 Bare ground 75
6 Weed, Grass areas 144
7 Golf course 77
8 Castanopsis, Live oak 163
9 Quercus acutissima Carruth 54
10 Quercus serrate Thunb 1,549
11 Mallotus japonicas, Zanthoxylum 235
12 Cryptomeria Japonica, Japanese Cypress 493
In contrast, this study regarded resources of Group 12
as architectural material, we was able to use 30% of
Group 12 as biomass fuel. Based on these assumptions,
we developed a resource-distribution map using Google
Maps API on MATLAB.
Next, we calculated the kappa coefficient [12], which
is one of the most reliable classification coincidence
indicators.
TABLE IV. CONFUSION MATRIX
Classification group
1 2 3 4 5 6 7 8 9 10 11 12
Co
rrect data
1 3665 8 3 3 298 3 1 5 16 16 10 0
2 0 66 28 13 9 18 0 8 17 36 17 3
3 0 344 1424 320 111 193 34 141 205 291 80 60
4 3 62 220 129 41 54 26 50 49 138 47 24
5 4 0 5 2 41 5 6 5 3 4 4 0
6 0 11 22 9 8 35 18 8 6 15 23 5
7 0 3 5 0 0 1 38 2 1 15 11 1
8 0 10 12 7 3 14 5 46 4 43 48 6
9 0 7 13 5 3 8 0 2 32 16 3 4
10 0 55 150 42 14 49 29 112 54 458 577 51
11 0 1 8 3 2 6 6 3 0 4 195 4
12 0 14 33 15 8 16 13 36 10 76 238 57
kappa coefficient = 0.4454

Lecture Notes on Information Theory Vol. 2, No. 2, June 2014
161©2014 Engineering and Technology Publishing
TABLE V. QUANTITY OF WOODY BIOMASS RESOURCES
Class Species Quantity [kg]
9 86,397.29
10 Broadleaf tree 668,846.94
11 763,832.65
12 Conifer 61,922.55
TABLE VI. RESULTS OF ADDED TRANSPORT SCENARIO
Total resources quantity 1,580,999 kg
Generated energy 18,066,868 MJ-HHV Drying energy 1,861,627 MJ
Recycling energy 1,139,020 kWh
Transportation cost 18,857,205 JPY Unit cost 16.556 JPY/kWh
Last, we added a transport scenario using the results of
estimated resources. This scenario is nearly a real transit
plan. Resources were transported to the nearest thermal
power plants, the Yokosuka and Minami-Yokohama
plants. After transport, the plants dried the resources and
generated electricity [13], [14].
C. Experiment Results
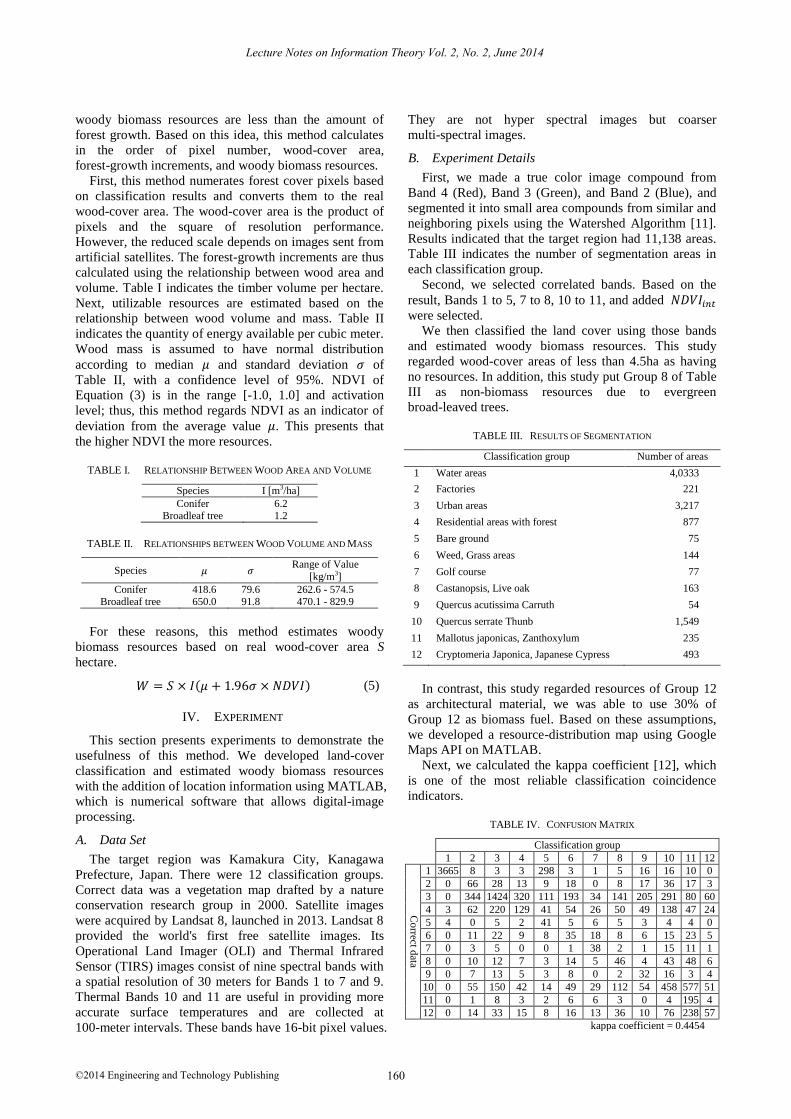
Fig. 2 depicts a correct vegetation map, Fig. 3 presents
the results of land-cover classification, and Table IV
indicates the results. In Table IV, rows are correct groups,
columns are classification result groups, and elements are
the number of areas. Diagonal elements are right
classification. Kappa coefficient K is 0.4454 based on the
confusion matrix of Table IV. This is moderate due to the
range [0.41, 0.60].
Figure. 2. Correct land-cover data
Figure. 3. Results of land-cover classification
Table V indicates the amount of estimated resources,
Fig. 4 depicts a resource-distribution map reflecting
latitude and longitude, and Table VI presents the results
of the transport scenario.
Figure. 4. Resource-distribution map
V. DISCUSSION
Comparing Fig. 2 and Fig. 3, we confirm that the
land-cover classification is correct, since there are a lot of
area in diagonal elements of Table IV. In addition, Table
VII compares the results of Kamagata et al. and those of
this study. These two studies had the same coincidence
degree, although this study used coarser images and had
more classification groups. In a strict sense, this study
had a lower kappa coefficient, because it had more
difference in time between satellite images and
vegetation map.
TABLE VII. COMPARISON WITH PREVIOUS WORKS
Kamagata This study
Target area Kamakura Kamakura Region Mountainous plain
Area 25km2 102,724km2 larger
Satellite image IKONOS Landsat 8
Spatial resolution 4m 30m coarser Classification groups 7 12 more
Kappa coefficient 0.526 0.445
Degree of coincidence
moderate moderate same
Looking at Table IV, much area of Group 3 and 4 was
divided into vegetation region because this study focused
on vegetation regions and employed NDVI. In addition,
much area of Group 8 to 12 was divided into Group 11
because vegetation of Group 11 was a strong tree crown.
In either case, in order to use the latest correct data, we
must validate the evidence.
This study estimated resources in order to distinguish
between conifer and broadleaf trees. However, this
reduced this study's advantage of having many
classification groups. Therefore, we need to investigate
more detailed relationships among wooded areas, volume,
and mass.

Lecture Notes on Information Theory Vol. 2, No. 2, June 2014
162©2014 Engineering and Technology Publishing
Regarding the added transport scenario, the recycling
energy in Table VI was equal to the annual electrical
usage of 316 family units, or 5.3% of the people in
Kamakura City. For this reason, woody biomass
resources may provide realizable energy to see unit cost
of Table VI.
VI. CONCLUSIONS
This study employed experimental land-cover
classification by NDVI and selected satellite images. It
then estimated woody biomass resources using the results
of the classification and relationships among wooded area,
volume, and mass. This allowed investigation of a
resource-distribution map reflecting latitude and
longitude in an unknown forest region.
Today, natural regeneration energy has attracted
attention and advances the coefficient of utilization. And,
there are a large amount of woody biomass resources as
one of the new energy. However, it is necessary to
investigate the unknown location of forest resources. This
study is able to estimate resources distribution using
satellite images to utilize woody biomass, and find
resource location quickly and easily. In future work, in
order to use realistic biomass quantity, it is necessary to
optimize the transport scenario using geographical
information.
REFERENCES
[1] B. Moller and P. S. Nielsenb, “Analysing transport costs of
Danish forest wood chip resources by means of continuous cost
surfaces,” Biomass and Bioenergy, vol. 31, pp. 291-298, 2007. [2] X. Shi, A. Elmore, X. Li, N. J. Gorence, H. M. Jin, X. H. Zhang,
and F. Wang, “Analysing transport costs of Danish forest wood
chip resources by means of continuous cost surfaces,” Biomass and Bioenergy, vol. 32, pp. 35-43, 2008.
[3] M. Iuchi, “Development of the support system for biomass energy business plans-the data base and evaluation models to simulate the
collection cost-,” Central Research Institute of Electric Power
Industry Report, no. Y03023, 2004. [4] T. Kinoshita, K. Inoue, K. Iwao, H. Kagemoto, and Y. Yamagata,
“A spatial evaluation of forest biomass usage using GIS,” Applied
Energy, vol. 86, pp. 1-6, 2009. [5] H. Yamamoto, T. Nakata, and K. Yabe, “Design of biomass
co-firing system considering resource distribution and
transportation optimization,” Journal of Japan Institute of Energy,
vol. 89, pp. 42-52, 2010.
[6] K. Moriguchi, Y. Suzuki, J. Gotou, H. Inatsuki, T. Yamagushi, Y.
Shiraishi, and T. Ohara, “Cost of comminution and transportation in the case of using logging residue as woody biofuel,” Japanese
Forestry Society, vol. 86, pp. 121-128, 2004.
[7] T. Terada, M. Yokohari, and N. Tanaka, “Potential of utilizing woody biomass from satoyama woods on plateaus assessed by the
estimation of harvesting and collecting costs,” Landscape Research Japan, vol.73, pp. 663-666, 2010.
[8] A. H. Strahler, “The use of prior probabilities in maximum
likelihood classification of remotely sensed data,” Remote Sensing of Environment, vol. 10, pp. 135-163, 1980.
[9] N. Kamagata and K. Hara, “Vegetation mapping by object-based
image analysis: Evaluation of classification accuracy and boundary extraction in a mountainous region of central Honshu,
Japan,” Vegetation Science, vol. 27, pp. 83-94, 2010.
[10] J. R. Dong, R. K. Kaufmann, R. B. Myneni, C. J. Tucker, P. E. Kauppi, J. Liski, et al., “Remote sensing estimates of boreal and
temperate forest woody biomass: Carbon pools, sources, and
sinks,” Remote Sensing of Environment, vol. 84, pp. 393-410, 2003.
[11] K. Saarinen, “Color image segmentation by a watershed algorithm
and region adjacency graph processing,” IEEE Image Processing, vol. 3, pp. 1021-1025, 1994.
[12] R. G. Congalton, “A review of assessing the accuracy of
classifications of remotely sensed data,” Remote Sensing of Environment, vol. 37, pp. 35-46, 1991.
[13] K. Yagi and T. Nakata, “Economic analysis on small-scale forest
biomass gasification considering regional resource distribution and technical characteristics,” Journal of the Japan Institute of
Energy, vol. 86, pp. 109-118, 2007.
[14] Y. Makino, T. Kato, and Y. Suzuoki, “Potential of co-firing of woody biomass in coal fired power plant,” IEEJ Transactions on
Power and Energy, vol. 125, pp. 1129-1135, 2005.
Yu Ohya is a graduate student of Industrial
Administration, Tokyo University of Science,
Japan. He received a Bachelor of Engineering from Tokyo University of Science 2014. He
has been working on Image Analysis and Data
Mining.
Katsutoshi Kanamori is an assistant
professor of Industrial Administration, Tokyo
University of Science, Japan. He received a Doctor of Science from Tokyo University of
Science 2009. He has been working on
Artificial Intelligence and Formulation of Creativity.
Ohwada Hayato is a professor of Industrial Administration and Director of the Division of
Next Generation Data Mining Technology,
Tokyo University of Science, Japan. He received a Doctor of Engineering from Tokyo
University of Science 1988. He has been
working on Machine Learning and Inductive Logic Programming.