Embed Size (px)
Citation preview
This article was downloaded by: [University of Nebraska, Lincoln]On: 20 August 2013, At: 12:14Publisher: Taylor & FrancisInforma Ltd Registered in England and Wales Registered Number: 1072954 Registered office: Mortimer House,37-41 Mortimer Street, London W1T 3JH, UK
Journal of the Air & Waste Management AssociationPublication details, including instructions for authors and subscription information:http://www.tandfonline.com/loi/uawm20
Estimating surface visibility at Hong Kong from ground-based LIDAR, sun photometer and operational MODISproductsMuhammad I. Shahzad a b , Janet E. Nichol a , Jun Wang b , James R. Campbell c & Pak W.Chan da The Hong Kong Polytechnic University, Department of Land Surveying and Geo-Informatics ,Hung Hom , Hong Kongb University of Nebraska, Department of Earth and Atmospheric Sciences , Lincoln , NE , USAc Naval Research Laboratory , Monterey , CA , USAd Hong Kong Observatory , Kowloon , Hong KongAccepted author version posted online: 13 May 2013.
To cite this article: Muhammad I. Shahzad , Janet E. Nichol , Jun Wang , James R. Campbell & Pak W. Chan (2013) Estimatingsurface visibility at Hong Kong from ground-based LIDAR, sun photometer and operational MODIS products, Journal of the Air& Waste Management Association, 63:9, 1098-1110, DOI: 10.1080/10962247.2013.801372
To link to this article: http://dx.doi.org/10.1080/10962247.2013.801372
PLEASE SCROLL DOWN FOR ARTICLE
Taylor & Francis makes every effort to ensure the accuracy of all the information (the “Content”) containedin the publications on our platform. However, Taylor & Francis, our agents, and our licensors make norepresentations or warranties whatsoever as to the accuracy, completeness, or suitability for any purpose of theContent. Any opinions and views expressed in this publication are the opinions and views of the authors, andare not the views of or endorsed by Taylor & Francis. The accuracy of the Content should not be relied upon andshould be independently verified with primary sources of information. Taylor and Francis shall not be liable forany losses, actions, claims, proceedings, demands, costs, expenses, damages, and other liabilities whatsoeveror howsoever caused arising directly or indirectly in connection with, in relation to or arising out of the use ofthe Content.
This article may be used for research, teaching, and private study purposes. Any substantial or systematicreproduction, redistribution, reselling, loan, sub-licensing, systematic supply, or distribution in anyform to anyone is expressly forbidden. Terms & Conditions of access and use can be found at http://www.tandfonline.com/page/terms-and-conditions
TECHNICAL PAPER
Estimating surface visibility at Hong Kong from ground-based LIDAR,sun photometer and operational MODIS productsMuhammad I. Shahzad,1,2,* Janet E. Nichol,1 Jun Wang,2 James R. Campbell,3 andPak W. Chan41The Hong Kong Polytechnic University, Department of Land Surveying and Geo-Informatics, Hung Hom, Hong Kong2University of Nebraska, Department of Earth and Atmospheric Sciences, Lincoln, NE, USA3Naval Research Laboratory, Monterey, CA, USA4Hong Kong Observatory, Kowloon, Hong Kong⁄Please address correspondence to: Muhammad I. Shahzad, Department of Land Surveying and Geo-Informatics, The Hong Kong PolytechnicUniversity, Hung Hom, Hong Kong; e-mail: [email protected]
Hong Kong’s surface visibility has decreased in recent years due to air pollution from rapid social and economic development in theregion. In addition to deteriorating health standards, reduced visibility disrupts routine civil and public operations, most notablytransportation and aviation. Regional estimates of visibility solved operationally using available ground and satellite-based estimatesof aerosol optical properties and vertical distribution may prove more effective than standard reliance on a few existing surfacevisibility monitoring stations. Previous studies have demonstrated that such satellite measurements correlate well with near-surfaceoptical properties, despite these sensors do not consider range-resolved information and indirect parameterizations necessary to solverelevant parameters. By expanding such analysis to include vertically resolved aerosol profile information from an autonomousground-based lidar instrument, this work develops six models for automated assessment of surface visibility. Regional visibility isestimated using co-incident ground-based lidar, sun photometer, visibility meter, and MODerate-resolution maging Spectroradiometer(MODIS) aerosol optical depth data sets. Using a 355 nm extinction coefficient profile solved from the lidar, MODIS AOD (aerosoloptical depth) is scaled down to the surface to generate a regional composite depiction of surface visibility. These results demonstratethe potential for applying passive satellite depictions of broad-scale aerosol optical properties together with a ground-based surfacelidar and zenith-viewing sun photometer for improving quantitative assessments of visibility in a city such as Hong Kong.
Implications: The study presents methods to estimate surface level visibility using remote sensing techniques, thus reducing thecost and effort required to estimate visibility at regional level. This helps to address environmental and health effects of ambient airpollution related to visibility for areas with no existing air quality monitoring stations. Policy regulation and hazard assessmentsimpacting transportation and navigation can be improved by integrating the remotely estimated surface visibility with a real-timeenvironmental data network.
Introduction
Hong Kong’s skyline and mountain horizons are obscured20% of the time due to reduced visibility (visual range [VR]below 8 km; e.g., Chang and Koo, 1986; Lai and Sequeira,2001). The percentage of hours with such reduced visibility(excluding fog, rain, or mist) has risen from 2% in 1970 to18% in 2004 (Hong Kong Observatory [HKO], 2005). This isprimarily the result of high aerosol particulate loading, withmean annual aerosol optical depth (AOD) values exceeding0.60 at 550 nm (Wu et al., 2005). Air quality in urban HongKong is considered worse than in surrounding rural areas (Louieet al., 2005), and, for context, is worse than most urbanizedcoastal areas of eastern USA (Yuan et al., 2002).
Hong Kong’s declining visibility is closely related to local andregional air pollution (Chan and Yao, 2008), as light extinction
correlates strongly with concentrations of respirable suspendedparticles (RSPs; particles with diameter of less than 10 mm)within the planetary boundary layer (PBL) (Chin, 1997; Leeand Gervat, 1995; Sequeira and Lai, 1998). Optical propertiesof these aerosols depend on their emission source (Cui et al.,2011). Local anthropogenic activities, as well as aerosol particletransport, most commonly in the form of sulfate (SO4) fromneighboring China, are primary contributors (Cheung et al.,2005; Qun et al., 2009; Zhuang et al., 1999). Lai and Sequeira(2001) show that NO2 and RSPs are responsible for 79% of lightextinction in Hong Kong. In comparison, Wan et al., (2011)report a high correlation between visibility and PM10 (particulatematterwith an aerodynamic diameter �10 mm) when the latterdecreases by 0.004 mg/m3 and with NO2 when NO2 decreasesfrom 0.02 to 0.05 mg/m3 in the nearby Pearl River Delta (PRD)region during 2001 to 2008. Deteriorating visibility has
1098
Journal of the Air & Waste Management Association, 63(9):1098–1110, 2013. Copyright © 2013 A&WMA. ISSN: 1096-2247 printDOI: 10.1080/10962247.2013.801372
Dow
nloa
ded
by [
Uni
vers
ity o
f N
ebra
ska,
Lin
coln
] at
12:
14 2
0 A
ugus
t 201
3
prompted concern for health as well as transportation, aviation,and other routine civil operations (Thach et al., 2010).
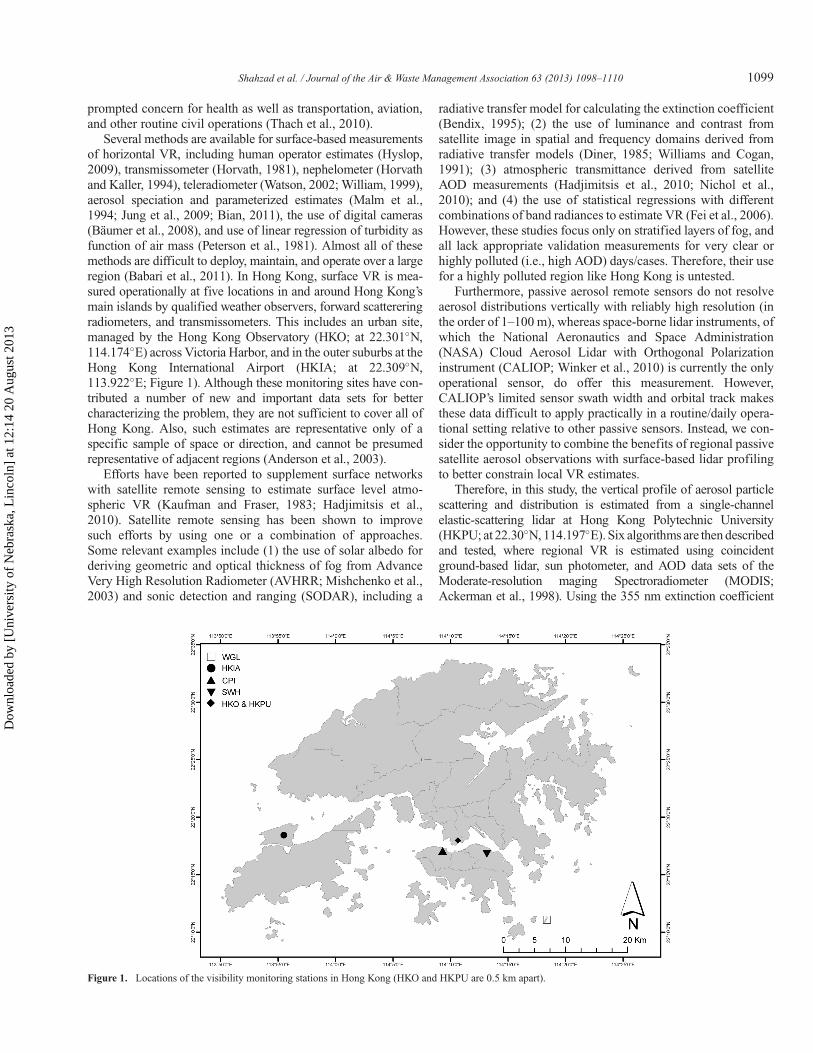
Several methods are available for surface-based measurementsof horizontal VR, including human operator estimates (Hyslop,2009), transmissometer (Horvath, 1981), nephelometer (Horvathand Kaller, 1994), teleradiometer (Watson, 2002; William, 1999),aerosol speciation and parameterized estimates (Malm et al.,1994; Jung et al., 2009; Bian, 2011), the use of digital cameras(Bäumer et al., 2008), and use of linear regression of turbidity asfunction of air mass (Peterson et al., 1981). Almost all of thesemethods are difficult to deploy, maintain, and operate over a largeregion (Babari et al., 2011). In Hong Kong, surface VR is mea-sured operationally at five locations in and around Hong Kong’smain islands by qualified weather observers, forward scattereringradiometers, and transmissometers. This includes an urban site,managed by the Hong Kong Observatory (HKO; at 22.301�N,114.174�E) across Victoria Harbor, and in the outer suburbs at theHong Kong International Airport (HKIA; at 22.309�N,113.922�E; Figure 1). Although these monitoring sites have con-tributed a number of new and important data sets for bettercharacterizing the problem, they are not sufficient to cover all ofHong Kong. Also, such estimates are representative only of aspecific sample of space or direction, and cannot be presumedrepresentative of adjacent regions (Anderson et al., 2003).
Efforts have been reported to supplement surface networkswith satellite remote sensing to estimate surface level atmo-spheric VR (Kaufman and Fraser, 1983; Hadjimitsis et al.,2010). Satellite remote sensing has been shown to improvesuch efforts by using one or a combination of approaches.Some relevant examples include (1) the use of solar albedo forderiving geometric and optical thickness of fog from AdvanceVery High Resolution Radiometer (AVHRR; Mishchenko et al.,2003) and sonic detection and ranging (SODAR), including a
radiative transfer model for calculating the extinction coefficient(Bendix, 1995); (2) the use of luminance and contrast fromsatellite image in spatial and frequency domains derived fromradiative transfer models (Diner, 1985; Williams and Cogan,1991); (3) atmospheric transmittance derived from satelliteAOD measurements (Hadjimitsis et al., 2010; Nichol et al.,2010); and (4) the use of statistical regressions with differentcombinations of band radiances to estimate VR (Fei et al., 2006).However, these studies focus only on stratified layers of fog, andall lack appropriate validation measurements for very clear orhighly polluted (i.e., high AOD) days/cases. Therefore, their usefor a highly polluted region like Hong Kong is untested.
Furthermore, passive aerosol remote sensors do not resolveaerosol distributions vertically with reliably high resolution (inthe order of 1–100 m), whereas space-borne lidar instruments, ofwhich the National Aeronautics and Space Administration(NASA) Cloud Aerosol Lidar with Orthogonal Polarizationinstrument (CALIOP; Winker et al., 2010) is currently the onlyoperational sensor, do offer this measurement. However,CALIOP’s limited sensor swath width and orbital track makesthese data difficult to apply practically in a routine/daily opera-tional setting relative to other passive sensors. Instead, we con-sider the opportunity to combine the benefits of regional passivesatellite aerosol observations with surface-based lidar profilingto better constrain local VR estimates.
Therefore, in this study, the vertical profile of aerosol particlescattering and distribution is estimated from a single-channelelastic-scattering lidar at Hong Kong Polytechnic University(HKPU; at 22.30�N, 114.197�E). Six algorithms are thendescribedand tested, where regional VR is estimated using coincidentground-based lidar, sun photometer, and AOD data sets of theModerate-resolution maging Spectroradiometer (MODIS;Ackerman et al., 1998). Using the 355 nm extinction coefficient
Figure 1. Locations of the visibility monitoring stations in Hong Kong (HKO and HKPU are 0.5 km apart).
Shahzad et al. / Journal of the Air & Waste Management Association 63 (2013) 1098–1110 1099
Dow
nloa
ded
by [
Uni
vers
ity o
f N
ebra
ska,
Lin
coln
] at
12:
14 2
0 A
ugus
t 201
3
profile derived from the lidar measurements at one location,MODIS AOD data are scaled down to the surface to generate aregional composite depictionof surfaceVR.Weassume theverticaldistribution of aerosol particle mass concentration over the HongKong studydomain is constant relative to its horizontal distribution.We evaluate this assumption by comparing our results with inde-pendent VR measurements at locations where lidar data do notexist. By applying this technique, it is possible to optimize informa-tion froma relatively limited number of available groundvisibilitiesto estimate VR across the entire area from passive remote sensingdata sets, which provide the necessary spatial coverage.
Research Tools
Study area
The Hong Kong domain studied here represents an aggregatesurface area of 1104 km2, located in a subtropical region sur-rounded by the South China Sea to the east, south, and west, andbordering Shenzhen, China, to the north. The maximum altitudeabove mean sea level (MSL) is 957 m and approximately 40% ofthe land area is preserved as country park lands. Hong Kongexperiences local as well as regional transboundary air pollution.In the warm summer months, southwesterly winds bring freshmarine air, resulting in a relatively clean, hot, and humid atmo-sphere (Cheng et al., 2006). From October to April, cold airmasses from South China transport regional pollutants (Chenget al., 2006), making air quality poor. Local visibility is highest inthe hot humid summer, with southerly winds from South ChinaSea, and lowest in the winter and spring, with dry northerly windsfrom continental China (Chang and Koo, 1986; Mui et al., 2009).
Data used
This study considers hourly average data sets collected with a355 nm elastic scattering lidar instrument, a multichannel sunphotometer, deployed as part of NASA’s federated AerosolRobotic Network (AERONET; Holben et al., 1998), and a visibi-lity meter (Vaisala, Finland), all installed on the urban campus ofHKPU at 22.30�N, 114.197�E. Data are evaluated from April2011, beginning with the availability of routine lidar observationsat HKPU, through October 2011, corresponding with the avail-ability of quality-assured Level 2 AERONET products that arecloud screened as well as pre- and post-field calibrated. However,in order to sample a larger number of MODIS data for validatingour method, we extend the study period beyond October 2011 toSeptember 2012 using only Level 1.5 AERONET data, which arecloud screened but without a final postoperation calibrationapplied. Overall, though, only six data points were used fromLevel 1.5 data of AERONET for our validation study.
MODIS. MODIS was first launched on the Terra satellite in1999 in a descending node that passes the equator at 1030 localtime. A second MODIS, on the Aqua platform, was launched in2001 in an ascending node, which passes the equator at 1:30 p.m.local time. With 36 wavebands at 250 m, 500 m, and 1 kmresolution, MODIS can be used for atmospheric, oceanic, andland studies at both local and global scales (e.g., Remer et al.,2005; Wong et al., 2011). The MODIS Science Team generates
specific value-added data products describing aerosol physicaland optical properties, including ocean color, land cover, and firelocations (Schaaf et al., 2002; Moody et al., 2008). The currentMODIS operational products (MOD04—from Terra andMYD04—from Aqua), with 10 km horizontal resolution, repre-sent Collection 5 (Levy et al., 2007). The AOD from MOD04and MYD04 are extracted for the HKPU (tMU) and HKIA (tMA)sites using spatial windows of 5 � 5 pixels, which are thencompared with hourly average values of data from AERONET,the lidar, and visibility meter. These temporal and spatial win-dows were designed in accordance with Anderson et al. (2003),who report a significant correlation (r > 0.90) between AODmeasurements from ground, air, and space using a temporalwindowof less than 3 hr and a spatial windowof less than 60 km.
AERONET data. The AERONET sun photometer databaseincludes AOD over a range of wavelengths (0.35–1.05 µm), withan accuracy of �0.015 (Rainwater and Gregory, 2005).Instruments are generally calibrated annually. Typically, measure-ments are collected and reported at 15 min resolution. Value-added Level 2 products (i.e., aside from AOD) include aerosolsingle-scattering albedo, size distribution, fine and coarse modefractions, phase function, and asymmetric function (Dubovik andKing, 2000). AERONET data arewidely used for the validation ofsatellite AOD retrievals and model simulations (Yu et al., 2003).
We note recent work suggesting that Level 2 AERONETscreening algorithms may be limited by optically thin cirrusclouds, most common in tropical and subtropical locales, thusleading to a positive-definite AOD bias of 0.03–0.06 when suchclouds go unscreened (Chew et al., 2011). In Singapore, forinstance, this can approach 35% of the Level 2 sample. In thisstudy, however, we apply the Level 2 archive directly and presumethe cloud-screening procedures are robust. Despite the presence oflidar measurements, during daytime, when the passive radiometricobservations used here are available, the Atmospheric LidarSystem (ALS; Lolli et al., 2011) proves insensitive to cloudpresence at heights and temperatures most commonly associatedwith optically thin tropical cirrus. Thus, no consideration ofpotential cloud bias in the AERONET sample is possible.
LIDAR data. The ALS at HKPU collects data at 15 m and 1min spatial and temporal resolutions, respectively. The ALS is asingle-channel elastic backscatter lidar, operated at 355 nm, withan outgoing energy pulse near 16 µJ at 20 Hz. The ALS data usedin this study do not account for Rayleigh scattering and gas andparticle absorption. Signals are processed for a relative back-scattering coefficient (b; m�1sr�1), which can be interpreted forsignificant aerosol particle layers, such as the surface-detachedmixed aerosol layer (referred to as mixing layer—low; ML-Low)and diffuse elevated layers decoupled from the primary surfacelayer and advecting within the free troposphere (ML-High).Further processing can yield an estimated extinction coefficient(sLS; m
�1), where AOD (tLU) is either constrained and extinc-tion solved iteratively through an inversion solution to the lidarequation (Fernald, 1984; Klett, 1985), or by setting the relation-ship between extinction and backscatter coefficients constantwithin an assumed turbid layer and again constraining total
Shahzad et al. / Journal of the Air & Waste Management Association 63 (2013) 1098–11101100
Dow
nloa
ded
by [
Uni
vers
ity o
f N
ebra
ska,
Lin
coln
] at
12:
14 2
0 A
ugus
t 201
3
transmission to solve extinction bin-by-bin from the top of thelayer to the surface.
In this work, the latter technique for solving the extinction isapplied using built-in software provided by the ALS manufac-turer, which includes a predefined set of extinction-to-backscatter ratios. The extinction-to-backscatter ratio can fluc-tuate depending on the region of interest, particularly inSoutheast Asia (Campbell et al., 2012). At Hong Kong, it isfound to fluctuate seasonally between 18 and 44 sr at 532 nm(He, 2006). This led us to choose a value ratio of 36 sr(e.g., Ackerman et al., 1998), thus reflecting urban pollution asthe primary aerosol type regionally. Note that overlap of the ALSsystem is achieved at a range approximating 170 m. Thus, inorder to estimate near-surface VR effectively, we use data asclose to the surface as possible and extrapolate downward(described below). Therefore, the hourly average extinctioncoefficient (sLU) at 355 nm is retrieved from the LIDAR mea-surements at heights between 75 and 150 m.
Surface visibility data. AVaisala visibility meter is collocatedwith the sun photometer and lidar at HKPU. This meter uses aforward-scattering method to estimate visual range at 875 nm.Intensity of infrared light scattered at 33� is measured and con-verted to VR. VR readings from this station (VHKPU) are usedbelow to construct model estimates. VR readings from a similar
visibility meter deployed at HKIA (VHKIA) are used for valida-tion. Human observations of visibility are also important forsuch a study but could not be used, as none were available forHKPU.
Descriptive statistics
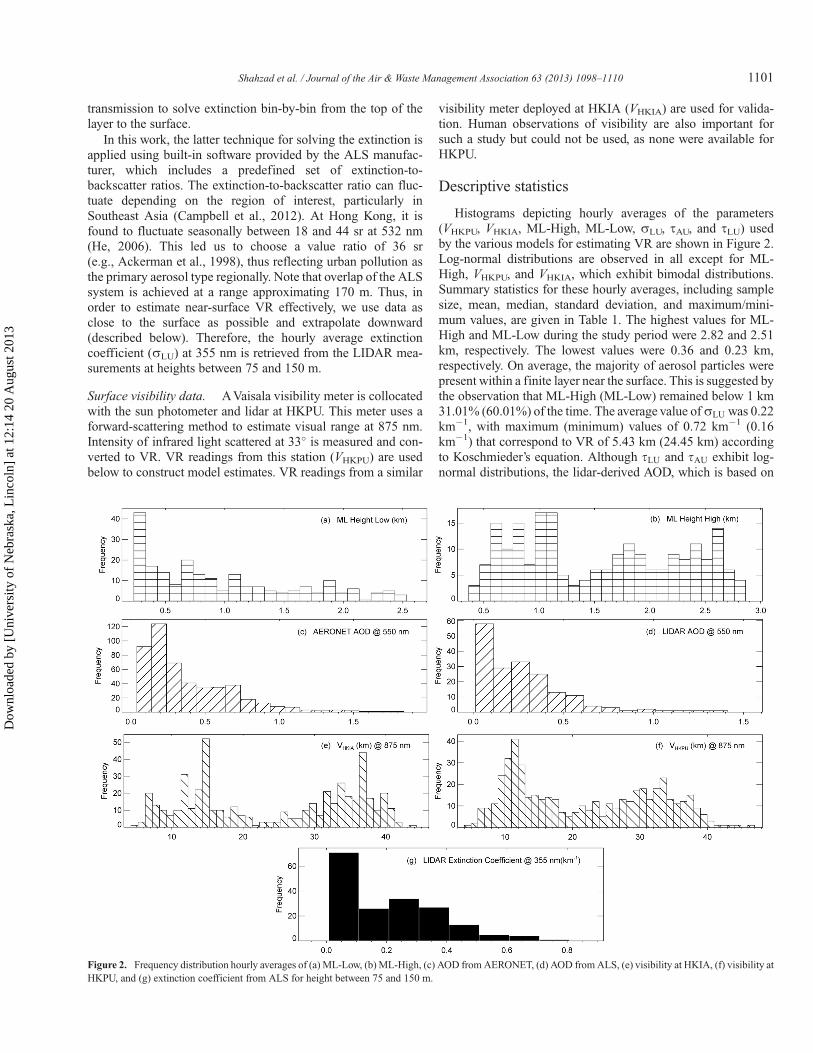
Histograms depicting hourly averages of the parameters(VHKPU, VHKIA, ML-High, ML-Low, sLU, tAU, and tLU) usedby the various models for estimating VR are shown in Figure 2.Log-normal distributions are observed in all except for ML-High, VHKPU, and VHKIA, which exhibit bimodal distributions.Summary statistics for these hourly averages, including samplesize, mean, median, standard deviation, and maximum/mini-mum values, are given in Table 1. The highest values for ML-High and ML-Low during the study period were 2.82 and 2.51km, respectively. The lowest values were 0.36 and 0.23 km,respectively. On average, the majority of aerosol particles werepresent within a finite layer near the surface. This is suggested bythe observation that ML-High (ML-Low) remained below 1 km31.01% (60.01%) of the time. The average value ofsLU was 0.22km�1, with maximum (minimum) values of 0.72 km�1 (0.16km�1) that correspond to VR of 5.43 km (24.45 km) accordingto Koschmieder’s equation. Although tLU and tAU exhibit log-normal distributions, the lidar-derived AOD, which is based on
Figure 2. Frequency distribution hourly averages of (a) ML-Low, (b) ML-High, (c) AOD fromAERONET, (d) AOD fromALS, (e) visibility at HKIA, (f) visibility atHKPU, and (g) extinction coefficient from ALS for height between 75 and 150 m.
Shahzad et al. / Journal of the Air & Waste Management Association 63 (2013) 1098–1110 1101
Dow
nloa
ded
by [
Uni
vers
ity o
f N
ebra
ska,
Lin
coln
] at
12:
14 2
0 A
ugus
t 201
3
an assumption of constant extinction-to-backscatter ratio, waslow compared with AERONET retrievals. Average values of tLUand tAU were 0.28 and 0.39, respectively. These smaller valuesof tLU can be reconciled by using eq 4 to represent VHKPU.
We note that VR between 20 and 30 km was more frequentthan VR below 20 km or above 30 km for both HKIA andHKPU. The peak frequency at HKPU was �11�12, and that atHKIA was �15 and standard deviation and mean values forVHKPU and VHKIA are significantly different (P value ¼ 0.00),with values of VHKPU and VHKIA of 21.77 � 10.41 and 24.28 �11.39 km, respectively. This supports our assumption of spatialvariability of aerosol mass concentrations in Hong Kong.
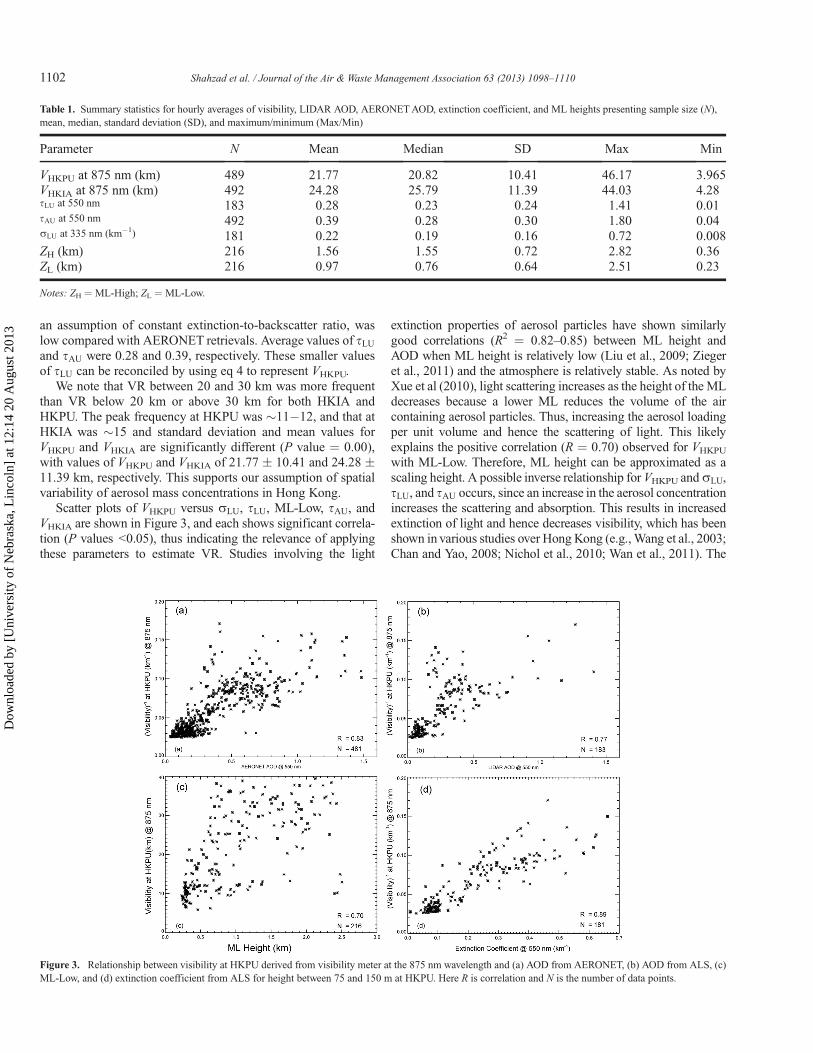
Scatter plots of VHKPU versus sLU, tLU, ML-Low, tAU, andVHKIA are shown in Figure 3, and each shows significant correla-tion (P values <0.05), thus indicating the relevance of applyingthese parameters to estimate VR. Studies involving the light
extinction properties of aerosol particles have shown similarlygood correlations (R2 ¼ 0.82–0.85) between ML height andAOD when ML height is relatively low (Liu et al., 2009; Ziegeret al., 2011) and the atmosphere is relatively stable. As noted byXue et al (2010), light scattering increases as the height of the MLdecreases because a lower ML reduces the volume of the aircontaining aerosol particles. Thus, increasing the aerosol loadingper unit volume and hence the scattering of light. This likelyexplains the positive correlation (R ¼ 0.70) observed for VHKPU
with ML-Low. Therefore, ML height can be approximated as ascaling height. A possible inverse relationship for VHKPU andsLU,tLU, and tAU occurs, since an increase in the aerosol concentrationincreases the scattering and absorption. This results in increasedextinction of light and hence decreases visibility, which has beenshown in various studies over HongKong (e.g.,Wang et al., 2003;Chan and Yao, 2008; Nichol et al., 2010; Wan et al., 2011). The
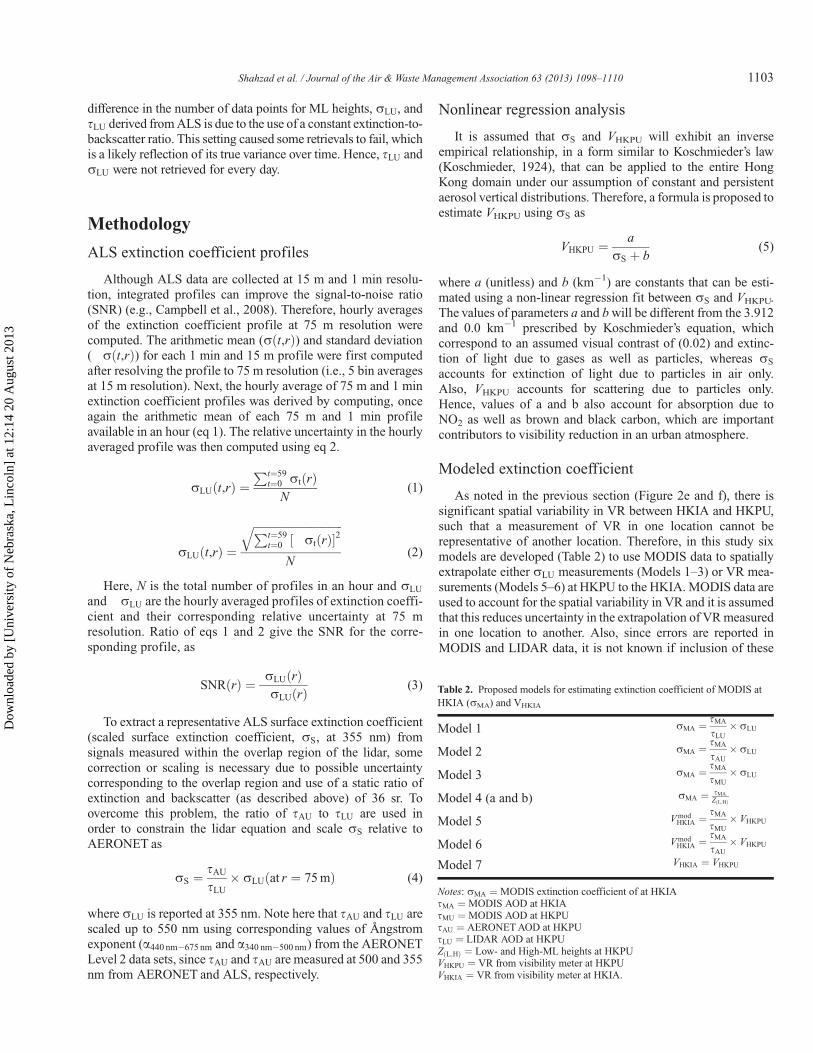
Table 1. Summary statistics for hourly averages of visibility, LIDAR AOD, AERONETAOD, extinction coefficient, and ML heights presenting sample size (N),mean, median, standard deviation (SD), and maximum/minimum (Max/Min)
Parameter N Mean Median SD Max Min
VHKPU at 875 nm (km) 489 21.77 20.82 10.41 46.17 3.965VHKIA at 875 nm (km) 492 24.28 25.79 11.39 44.03 4.28tLU at 550 nm 183 0.28 0.23 0.24 1.41 0.01tAU at 550 nm 492 0.39 0.28 0.30 1.80 0.04sLU at 335 nm (km�1) 181 0.22 0.19 0.16 0.72 0.008ZH (km) 216 1.56 1.55 0.72 2.82 0.36ZL (km) 216 0.97 0.76 0.64 2.51 0.23
Notes: ZH ¼ ML-High; ZL ¼ ML-Low.
Figure 3. Relationship between visibility at HKPU derived from visibility meter at the 875 nm wavelength and (a) AOD from AERONET, (b) AOD from ALS, (c)ML-Low, and (d) extinction coefficient from ALS for height between 75 and 150 m at HKPU. Here R is correlation and N is the number of data points.
Shahzad et al. / Journal of the Air & Waste Management Association 63 (2013) 1098–11101102
Dow
nloa
ded
by [
Uni
vers
ity o
f N
ebra
ska,
Lin
coln
] at
12:
14 2
0 A
ugus
t 201
3
difference in the number of data points for ML heights, sLU, andtLU derived fromALS is due to the use of a constant extinction-to-backscatter ratio. This setting caused some retrievals to fail, whichis a likely reflection of its true variance over time. Hence, tLU andsLU were not retrieved for every day.
Methodology
ALS extinction coefficient profiles
Although ALS data are collected at 15 m and 1 min resolu-tion, integrated profiles can improve the signal-to-noise ratio(SNR) (e.g., Campbell et al., 2008). Therefore, hourly averagesof the extinction coefficient profile at 75 m resolution werecomputed. The arithmetic mean (sðt,rÞ) and standard deviation(�sðt,rÞ) for each 1 min and 15 m profile were first computedafter resolving the profile to 75 m resolution (i.e., 5 bin averagesat 15 m resolution). Next, the hourly average of 75 m and 1 minextinction coefficient profiles was derived by computing, onceagain the arithmetic mean of each 75 m and 1 min profileavailable in an hour (eq 1). The relative uncertainty in the hourlyaveraged profile was then computed using eq 2.
sLUðt,rÞ ¼Pt¼59
t¼0 stðrÞN
(1)
�sLUðt,rÞ ¼ffiffiffiffiffiffiffiffiffiffiffiffiffiffiffiffiffiffiffiffiffiffiffiffiffiffiffiffiffiffiffiffiPt¼59
t¼0 ½�stðrÞ�2q
N(2)
Here, N is the total number of profiles in an hour and sLU
and�sLU are the hourly averaged profiles of extinction coeffi-cient and their corresponding relative uncertainty at 75 mresolution. Ratio of eqs 1 and 2 give the SNR for the corre-sponding profile, as
SNRðrÞ ¼ sLUðrÞ�sLUðrÞ (3)
To extract a representative ALS surface extinction coefficient(scaled surface extinction coefficient, sS, at 355 nm) fromsignals measured within the overlap region of the lidar, somecorrection or scaling is necessary due to possible uncertaintycorresponding to the overlap region and use of a static ratio ofextinction and backscatter (as described above) of 36 sr. Toovercome this problem, the ratio of tAU to tLU are used inorder to constrain the lidar equation and scale sS relative toAERONET as
sS ¼ tAUtLU
� sLUðat r ¼ 75mÞ (4)
where sLU is reported at 355 nm. Note here that tAU and tLU arescaled up to 550 nm using corresponding values of Ångstromexponent (a440 nm�675 nm and a340 nm�500 nm) from the AERONETLevel 2 data sets, since tAU and tAU are measured at 500 and 355nm from AERONET and ALS, respectively.
Nonlinear regression analysis
It is assumed that sS and VHKPU will exhibit an inverseempirical relationship, in a form similar to Koschmieder’s law(Koschmieder, 1924), that can be applied to the entire HongKong domain under our assumption of constant and persistentaerosol vertical distributions. Therefore, a formula is proposed toestimate VHKPU using sS as
VHKPU ¼ a
sS þ b(5)
where a (unitless) and b (km�1) are constants that can be esti-mated using a non-linear regression fit between sS and VHKPU.The values of parameters a and bwill be different from the 3.912and 0.0 km�1 prescribed by Koschmieder’s equation, whichcorrespond to an assumed visual contrast of (0.02) and extinc-tion of light due to gases as well as particles, whereas sS
accounts for extinction of light due to particles in air only.Also, VHKPU accounts for scattering due to particles only.Hence, values of a and b also account for absorption due toNO2 as well as brown and black carbon, which are importantcontributors to visibility reduction in an urban atmosphere.
Modeled extinction coefficient
As noted in the previous section (Figure 2e and f), there issignificant spatial variability in VR between HKIA and HKPU,such that a measurement of VR in one location cannot berepresentative of another location. Therefore, in this study sixmodels are developed (Table 2) to use MODIS data to spatiallyextrapolate either sLU measurements (Models 1–3) or VR mea-surements (Models 5–6) at HKPU to the HKIA.MODIS data areused to account for the spatial variability in VR and it is assumedthat this reduces uncertainty in the extrapolation of VRmeasuredin one location to another. Also, since errors are reported inMODIS and LIDAR data, it is not known if inclusion of these
Table 2. Proposed models for estimating extinction coefficient of MODIS atHKIA (sMA) and VHKIA
Model 1 sMA ¼ tMA
tLU� sLU
Model 2 sMA ¼ tMA
tAU� sLU
Model 3 sMA ¼ tMA
tMU� sLU
Model 4 (a and b) sMA ¼ tMAZðL;HÞ
Model 5 VmodHKIA ¼ tMA
tMU� VHKPU
Model 6 VmodHKIA ¼ tMA
tAU� VHKPU
Model 7 VHKIA ¼ VHKPU
Notes: sMA ¼ MODIS extinction coefficient of at HKIAtMA ¼ MODIS AOD at HKIAtMU ¼ MODIS AOD at HKPUtAU ¼ AERONETAOD at HKPUtLU ¼ LIDAR AOD at HKPUZðL;HÞ ¼ Low- and High-ML heights at HKPUVHKPU ¼ VR from visibility meter at HKPUVHKIA ¼ VR from visibility meter at HKIA.
Shahzad et al. / Journal of the Air & Waste Management Association 63 (2013) 1098–1110 1103
Dow
nloa
ded
by [
Uni
vers
ity o
f N
ebra
ska,
Lin
coln
] at
12:
14 2
0 A
ugus
t 201
3
data adds useful information to the estimates. To evaluate theusefulness of the MODIS data in estimating VR, a “referencemodel” (Model 7) is also developed where VR at HKIA andHKPU are compared.
Models 1–4 estimate MODIS-derived surface level extinctioncoefficient (sMA) at 355 nm by using AOD and VR from theHKPU ground station along with MODIS data at HKIA andHKPU (tMA—MODIS AOD at HKIA and tMU—MODIS AODat HKPU; each included in Table 1). Models 1–3 use AOD fromthe ALS and sun photometer along with sLU to compute sMA.However Model 4 uses only ML heights retrieved from the lidarto scale the MODIS AOD and simultaneously compute the near-surface extinction coefficient. This is reasonable since on aver-age the majority of AOD measured at Hong Kong is the result ofparticle scattering below ML-Low (He et al., 2008; Campbellet al., 2012). Similar to eq 5, sMA from Models 1–4 is used toestimate Vmod
HKIA at 875 nm wavelength as
VmodHKIA ¼ a
sMA þ b(6)
where values of a and b are the same as in eq 5. As mentionedabove, eq 5 uses sS at 355 nm to derive VHKPU at 875 nm.Therefore, sMA should also be at 355 nm. Hence, sMA fromModel 4 was also scaled to 355 nm using Ångstrom exponentvalues from AERONET.
To study the effect of possible uncertainties involved inretrieval of ALS products due to use of a constant extinction tobackscatter ratio, Models 5 and 6 were developed to be indepen-dent of the lidar. They use AOD and VHKPU reported at wave-lengths of 550 and 875 nm, respectively, and they directly reportVmodHKIA at 875 nm without involving eqs 4 and 5. Equation 5 and
all models are based on data from HKPU, and all are validatedusing data at HKIA. This allows an independent validation ofalgorithm performance at HKIA using in situ VR (VHKIA).
Results and Discussion
Model fitting
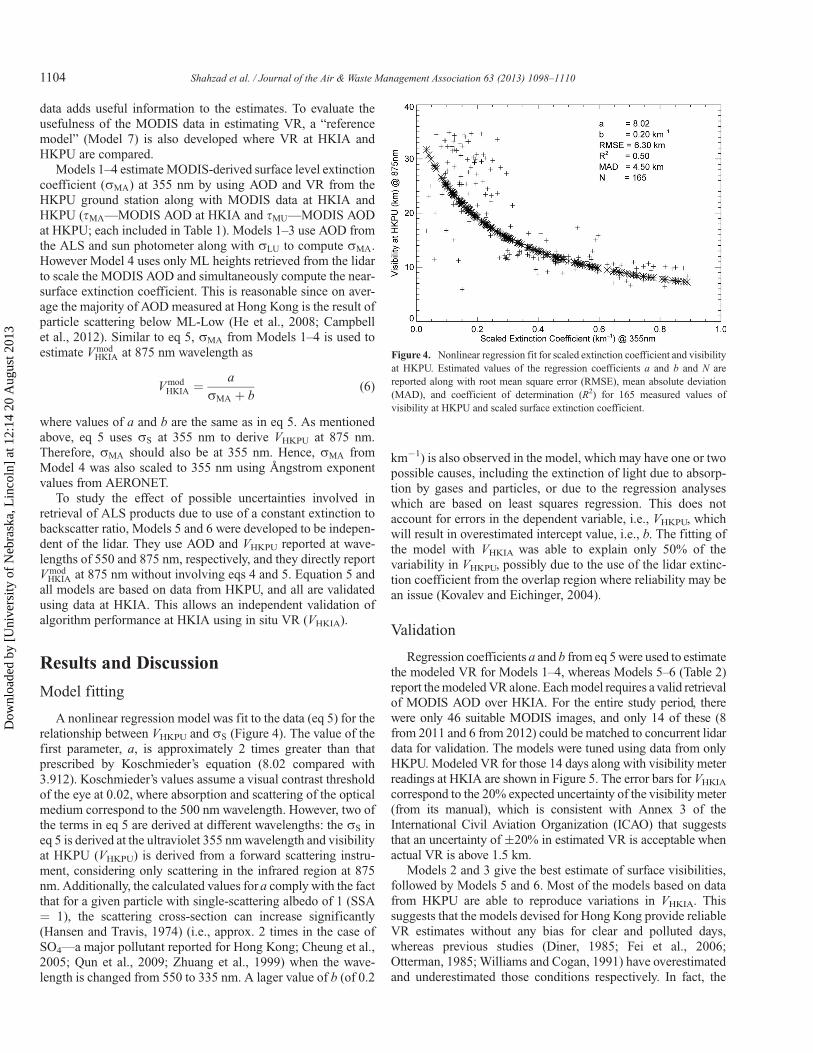
A nonlinear regression model was fit to the data (eq 5) for therelationship between VHKPU and sS (Figure 4). The value of thefirst parameter, a, is approximately 2 times greater than thatprescribed by Koschmieder’s equation (8.02 compared with3.912). Koschmieder’s values assume a visual contrast thresholdof the eye at 0.02, where absorption and scattering of the opticalmedium correspond to the 500 nm wavelength. However, two ofthe terms in eq 5 are derived at different wavelengths: the sS ineq 5 is derived at the ultraviolet 355 nmwavelength and visibilityat HKPU (VHKPU) is derived from a forward scattering instru-ment, considering only scattering in the infrared region at 875nm. Additionally, the calculated values fora comply with the factthat for a given particle with single-scattering albedo of 1 (SSA¼ 1), the scattering cross-section can increase significantly(Hansen and Travis, 1974) (i.e., approx. 2 times in the case ofSO4—a major pollutant reported for Hong Kong; Cheung et al.,2005; Qun et al., 2009; Zhuang et al., 1999) when the wave-length is changed from 550 to 335 nm. A lager value of b (of 0.2
km�1) is also observed in the model, which may have one or twopossible causes, including the extinction of light due to absorp-tion by gases and particles, or due to the regression analyseswhich are based on least squares regression. This does notaccount for errors in the dependent variable, i.e., VHKPU, whichwill result in overestimated intercept value, i.e., b. The fitting ofthe model with VHKIA was able to explain only 50% of thevariability in VHKPU, possibly due to the use of the lidar extinc-tion coefficient from the overlap region where reliability may bean issue (Kovalev and Eichinger, 2004).
Validation
Regression coefficients a and b from eq 5were used to estimatethe modeled VR for Models 1–4, whereas Models 5–6 (Table 2)report themodeledVR alone. Eachmodel requires a valid retrievalof MODIS AOD over HKIA. For the entire study period, therewere only 46 suitable MODIS images, and only 14 of these (8from 2011 and 6 from 2012) could be matched to concurrent lidardata for validation. The models were tuned using data from onlyHKPU. Modeled VR for those 14 days along with visibility meterreadings at HKIA are shown in Figure 5. The error bars for VHKIAcorrespond to the 20% expected uncertainty of the visibility meter(from its manual), which is consistent with Annex 3 of theInternational Civil Aviation Organization (ICAO) that suggeststhat an uncertainty of �20% in estimated VR is acceptable whenactual VR is above 1.5 km.
Models 2 and 3 give the best estimate of surface visibilities,followed by Models 5 and 6. Most of the models based on datafrom HKPU are able to reproduce variations in VHKIA. Thissuggests that the models devised for Hong Kong provide reliableVR estimates without any bias for clear and polluted days,whereas previous studies (Diner, 1985; Fei et al., 2006;Otterman, 1985; Williams and Cogan, 1991) have overestimatedand underestimated those conditions respectively. In fact, the
Figure 4. Nonlinear regression fit for scaled extinction coefficient and visibilityat HKPU. Estimated values of the regression coefficients a and b and N arereported along with root mean square error (RMSE), mean absolute deviation(MAD), and coefficient of determination (R2) for 165 measured values ofvisibility at HKPU and scaled surface extinction coefficient.
Shahzad et al. / Journal of the Air & Waste Management Association 63 (2013) 1098–11101104
Dow
nloa
ded
by [
Uni
vers
ity o
f N
ebra
ska,
Lin
coln
] at
12:
14 2
0 A
ugus
t 201
3
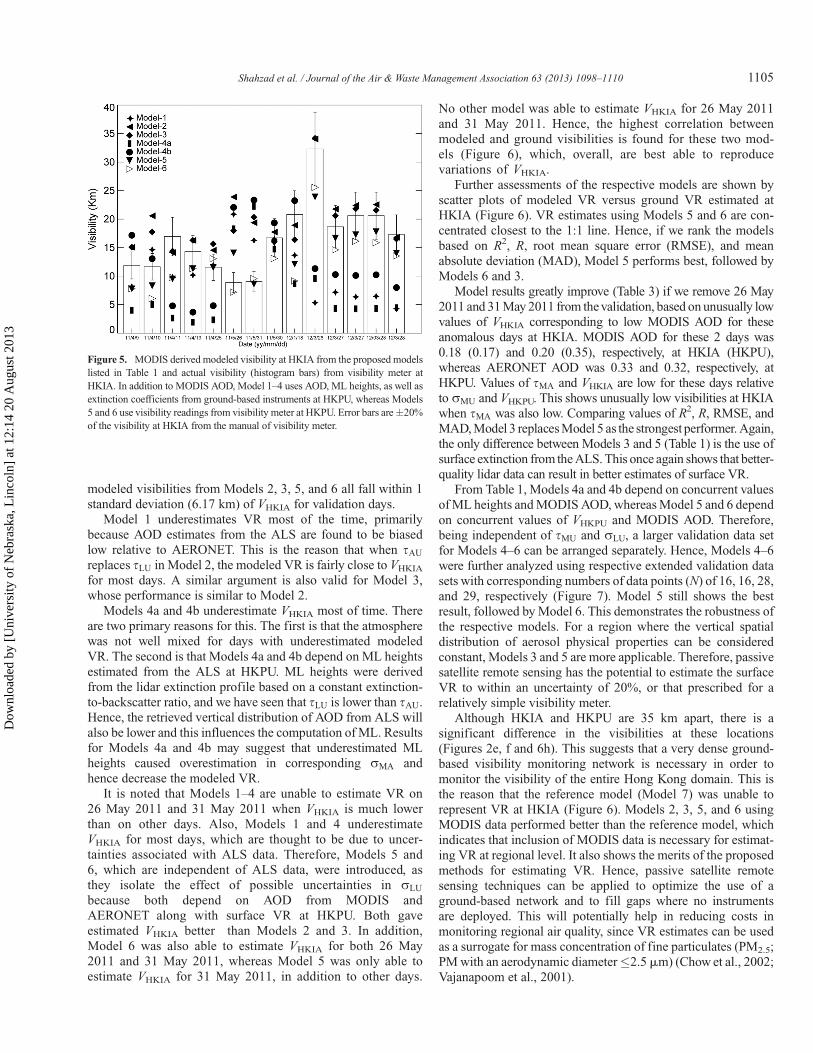
modeled visibilities from Models 2, 3, 5, and 6 all fall within 1standard deviation (6.17 km) of VHKIA for validation days.
Model 1 underestimates VR most of the time, primarilybecause AOD estimates from the ALS are found to be biasedlow relative to AERONET. This is the reason that when tAUreplaces tLU in Model 2, the modeled VR is fairly close to VHKIA
for most days. A similar argument is also valid for Model 3,whose performance is similar to Model 2.
Models 4a and 4b underestimate VHKIA most of time. Thereare two primary reasons for this. The first is that the atmospherewas not well mixed for days with underestimated modeledVR. The second is that Models 4a and 4b depend on ML heightsestimated from the ALS at HKPU. ML heights were derivedfrom the lidar extinction profile based on a constant extinction-to-backscatter ratio, and we have seen that tLU is lower than tAU.Hence, the retrieved vertical distribution of AOD from ALS willalso be lower and this influences the computation of ML. Resultsfor Models 4a and 4b may suggest that underestimated MLheights caused overestimation in corresponding sMA andhence decrease the modeled VR.
It is noted that Models 1–4 are unable to estimate VR on26 May 2011 and 31 May 2011 when VHKIA is much lowerthan on other days. Also, Models 1 and 4 underestimateVHKIA for most days, which are thought to be due to uncer-tainties associated with ALS data. Therefore, Models 5 and6, which are independent of ALS data, were introduced, asthey isolate the effect of possible uncertainties in sLU
because both depend on AOD from MODIS andAERONET along with surface VR at HKPU. Both gaveestimated VHKIA better than Models 2 and 3. In addition,Model 6 was also able to estimate VHKIA for both 26 May2011 and 31 May 2011, whereas Model 5 was only able toestimate VHKIA for 31 May 2011, in addition to other days.
No other model was able to estimate VHKIA for 26 May 2011and 31 May 2011. Hence, the highest correlation betweenmodeled and ground visibilities is found for these two mod-els (Figure 6), which, overall, are best able to reproducevariations of VHKIA.
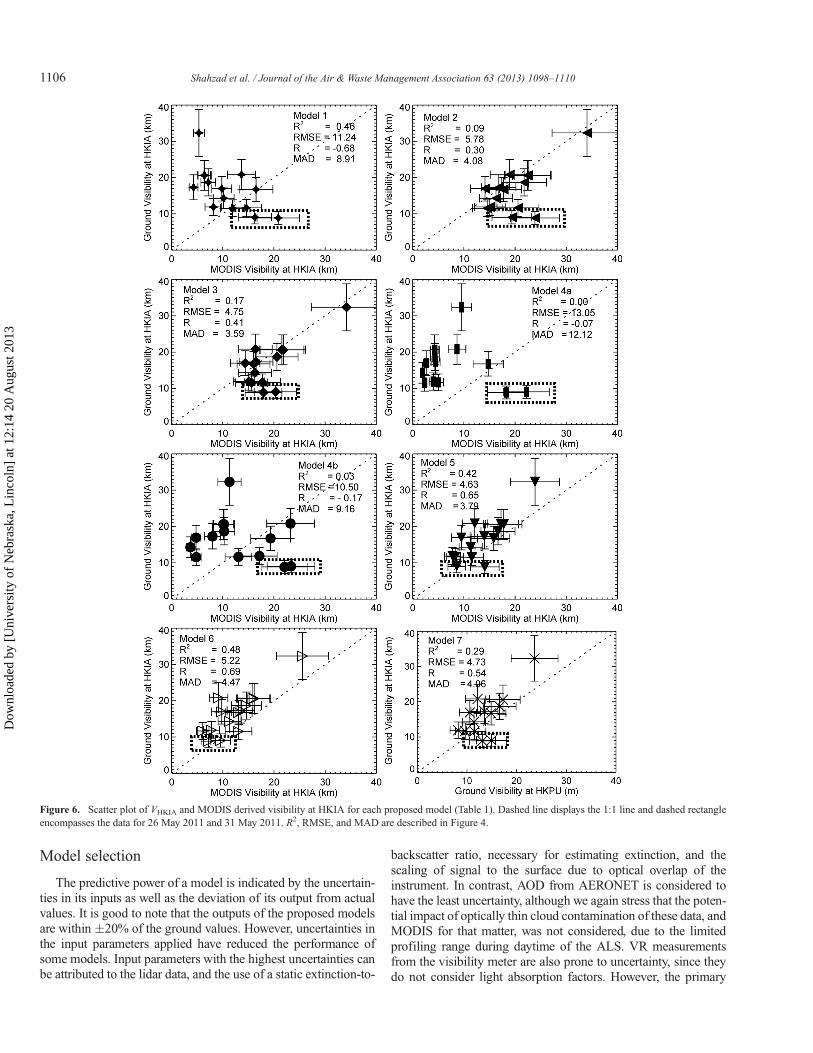
Further assessments of the respective models are shown byscatter plots of modeled VR versus ground VR estimated atHKIA (Figure 6). VR estimates using Models 5 and 6 are con-centrated closest to the 1:1 line. Hence, if we rank the modelsbased on R2, R, root mean square error (RMSE), and meanabsolute deviation (MAD), Model 5 performs best, followed byModels 6 and 3.
Model results greatly improve (Table 3) if we remove 26 May2011 and 31May 2011 from thevalidation, based on unusually lowvalues of VHKIA corresponding to low MODIS AOD for theseanomalous days at HKIA. MODIS AOD for these 2 days was0.18 (0.17) and 0.20 (0.35), respectively, at HKIA (HKPU),whereas AERONET AOD was 0.33 and 0.32, respectively, atHKPU. Values of tMA and VHKIA are low for these days relativeto sMU and VHKPU. This shows unusually low visibilities at HKIAwhen tMA was also low. Comparing values of R2, R, RMSE, andMAD,Model 3 replacesModel 5 as the strongest performer.Again,the only difference between Models 3 and 5 (Table 1) is the use ofsurface extinction from theALS. This once again shows that better-quality lidar data can result in better estimates of surface VR.
From Table 1, Models 4a and 4b depend on concurrent valuesofML heights andMODIS AOD, whereasModel 5 and 6 dependon concurrent values of VHKPU and MODIS AOD. Therefore,being independent of tMU and sLU, a larger validation data setfor Models 4–6 can be arranged separately. Hence, Models 4–6were further analyzed using respective extended validation datasets with corresponding numbers of data points (N) of 16, 16, 28,and 29, respectively (Figure 7). Model 5 still shows the bestresult, followed byModel 6. This demonstrates the robustness ofthe respective models. For a region where the vertical spatialdistribution of aerosol physical properties can be consideredconstant, Models 3 and 5 are more applicable. Therefore, passivesatellite remote sensing has the potential to estimate the surfaceVR to within an uncertainty of 20%, or that prescribed for arelatively simple visibility meter.
Although HKIA and HKPU are 35 km apart, there is asignificant difference in the visibilities at these locations(Figures 2e, f and 6h). This suggests that a very dense ground-based visibility monitoring network is necessary in order tomonitor the visibility of the entire Hong Kong domain. This isthe reason that the reference model (Model 7) was unable torepresent VR at HKIA (Figure 6). Models 2, 3, 5, and 6 usingMODIS data performed better than the reference model, whichindicates that inclusion of MODIS data is necessary for estimat-ing VR at regional level. It also shows the merits of the proposedmethods for estimating VR. Hence, passive satellite remotesensing techniques can be applied to optimize the use of aground-based network and to fill gaps where no instrumentsare deployed. This will potentially help in reducing costs inmonitoring regional air quality, since VR estimates can be usedas a surrogate for mass concentration of fine particulates (PM2.5;PMwith an aerodynamic diameter�2.5mm) (Chow et al., 2002;Vajanapoom et al., 2001).
Figure 5. MODIS derived modeled visibility at HKIA from the proposed modelslisted in Table 1 and actual visibility (histogram bars) from visibility meter atHKIA. In addition to MODIS AOD, Model 1–4 uses AOD, ML heights, as well asextinction coefficients from ground-based instruments at HKPU, whereas Models5 and 6 use visibility readings from visibility meter at HKPU. Error bars are�20%of the visibility at HKIA from the manual of visibility meter.
Shahzad et al. / Journal of the Air & Waste Management Association 63 (2013) 1098–1110 1105
Dow
nloa
ded
by [
Uni
vers
ity o
f N
ebra
ska,
Lin
coln
] at
12:
14 2
0 A
ugus
t 201
3
Model selection
The predictive power of a model is indicated by the uncertain-ties in its inputs as well as the deviation of its output from actualvalues. It is good to note that the outputs of the proposed modelsare within �20% of the ground values. However, uncertainties inthe input parameters applied have reduced the performance ofsome models. Input parameters with the highest uncertainties canbe attributed to the lidar data, and the use of a static extinction-to-
backscatter ratio, necessary for estimating extinction, and thescaling of signal to the surface due to optical overlap of theinstrument. In contrast, AOD from AERONET is considered tohave the least uncertainty, although we again stress that the poten-tial impact of optically thin cloud contamination of these data, andMODIS for that matter, was not considered, due to the limitedprofiling range during daytime of the ALS. VR measurementsfrom the visibility meter are also prone to uncertainty, since theydo not consider light absorption factors. However, the primary
Figure 6. Scatter plot of VHKIA and MODIS derived visibility at HKIA for each proposed model (Table 1). Dashed line displays the 1:1 line and dashed rectangleencompasses the data for 26 May 2011 and 31 May 2011. R2, RMSE, and MAD are described in Figure 4.
Shahzad et al. / Journal of the Air & Waste Management Association 63 (2013) 1098–11101106
Dow
nloa
ded
by [
Uni
vers
ity o
f N
ebra
ska,
Lin
coln
] at
12:
14 2
0 A
ugus
t 201
3

source of uncertainty involved in the estimation of VR in ourmodels is due to the error term corresponding with the nonlinearregression step, since it is found to explain only 50% of thevariations in sS and VHKPU. A larger data set of sS and VHKPU
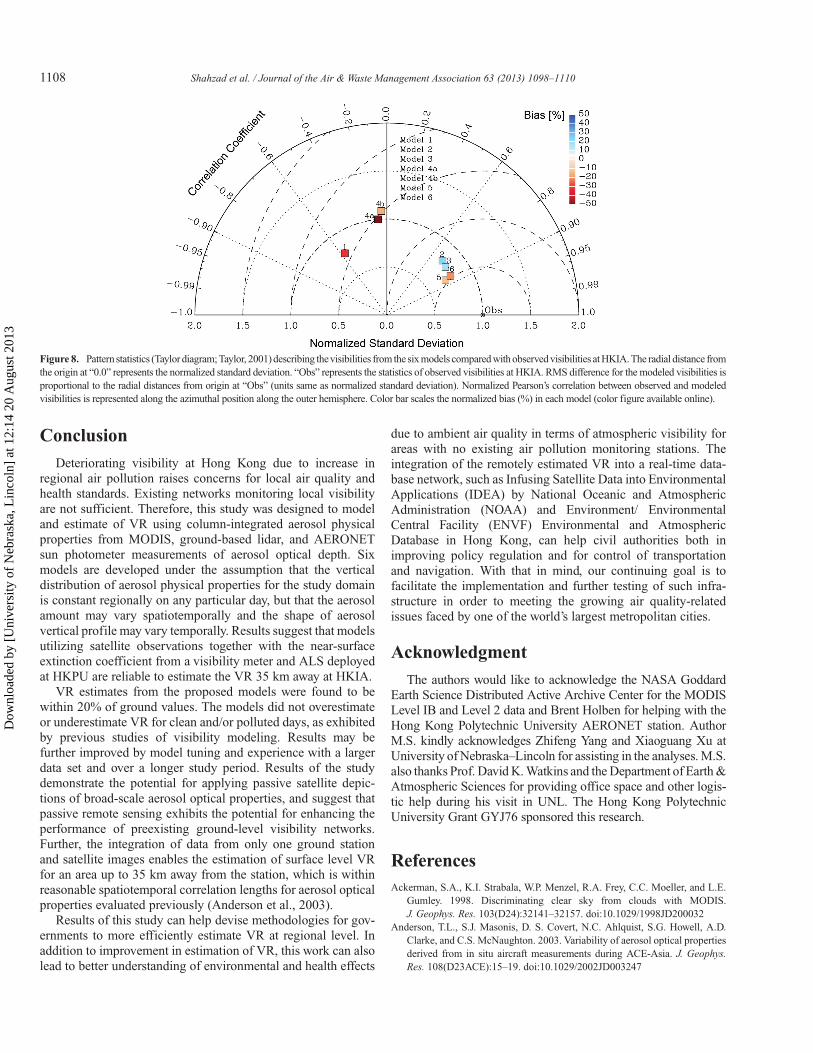
is needed to further improve the regression fitting.To further the skill of the proposed models, a Taylor diagram
(Taylor, 2001) was built (Figure 8). Taylor diagrams depict astatistical summary of how well patterns of estimated andobserved values match based on their correlation, standarddeviation, and root mean square error. The radial distance fromthe origin at “0.0” represents the normalized standard deviation.“Obs” represents the statistics of observed visibilities atHKIA. RMS differences for the modeled visibilities are propor-tional to the radial distances from the origin at “Obs” (units sameas normalized standard deviation). Normalized Pearson’s corre-lations between observed and modeled visibilities are
represented along the azimuthal position along the outer hemi-sphere. The color bar scales the bias (%) in each model.
Pattern statistics describing the six modeled visibilities com-pared with observed visibilities at HKIA show that Models 2, 3,5, and 6 outperform Models 1, 4a and 4b. The correlations forModels 5 and 6 are higher than for Models 2 and 3, whereasnormalized standard deviations for Models 2, 3, and 6 are similarand higher for Model 5. Models 2 and 3 can be improved byusing ALS data of better quality. However, the percentage biasesfor Models 5 and 3 are less than for Models 2 and 6. Overall,Model 5 appears to be the best model for the estimation of VRusing MODIS AOD at HKPU and HKIA, along with VR fromHKPU (Figure 8). Performance of these models is expected tofurther improve by retrieving AOD fromMODIS at a high spatialresolution such as 3 � 3 km2, which is planned for MODISCollection 6 products (Levy et al., 2013).
Table 3. Comparison of model’s performances before and after removal of data for 26 May 2011 and 31 May 2011
Before Removal After Removal
Model R2 RMSE R MAD R2 RMSE R MAD
Model 1 0.46 11.24 �0.68 8.91 0.28 11.45 �0.53 8.80Model 2 0.09 5.78 0.30 4.08 0.49 3.35 0.70 2.65Model 3 0.17 4.75 0.41 3.59 0.44 2.96 0.66 2.48Model 4a 0.00 13.05 �0.07 12.12 0.22 13.29 0.46 12.25Model 4b 0.03 10.50 �0.17 9.16 0.05 9.85 0.22 8.40Model 5 0.42 4.63 0.65 3.79 0.59 4.77 0.77 3.95Model 6 0.48 5.22 0.69 4.47 0.49 5.61 0.63 5.03Model 7 0.29 4.73 0.54 4.06 0.59 4.67 0.77 3.89
Note: Italicized values represent those of the best model.
Figure 7. Scatter plot of VHKIA and MODIS derived visibility at HKIA for Models 4–6 with extended validation data sets. Dashed line displays the 1:1 line. R2,RMSE, and MAD are described in Figure 4 and N is the available number of data points for validation.
Shahzad et al. / Journal of the Air & Waste Management Association 63 (2013) 1098–1110 1107
Dow
nloa
ded
by [
Uni
vers
ity o
f N
ebra
ska,
Lin
coln
] at
12:
14 2
0 A
ugus
t 201
3
Conclusion
Deteriorating visibility at Hong Kong due to increase inregional air pollution raises concerns for local air quality andhealth standards. Existing networks monitoring local visibilityare not sufficient. Therefore, this study was designed to modeland estimate of VR using column-integrated aerosol physicalproperties from MODIS, ground-based lidar, and AERONETsun photometer measurements of aerosol optical depth. Sixmodels are developed under the assumption that the verticaldistribution of aerosol physical properties for the study domainis constant regionally on any particular day, but that the aerosolamount may vary spatiotemporally and the shape of aerosolvertical profile may vary temporally. Results suggest that modelsutilizing satellite observations together with the near-surfaceextinction coefficient from a visibility meter and ALS deployedat HKPU are reliable to estimate the VR 35 km away at HKIA.
VR estimates from the proposed models were found to bewithin 20% of ground values. The models did not overestimateor underestimate VR for clean and/or polluted days, as exhibitedby previous studies of visibility modeling. Results may befurther improved by model tuning and experience with a largerdata set and over a longer study period. Results of the studydemonstrate the potential for applying passive satellite depic-tions of broad-scale aerosol optical properties, and suggest thatpassive remote sensing exhibits the potential for enhancing theperformance of preexisting ground-level visibility networks.Further, the integration of data from only one ground stationand satellite images enables the estimation of surface level VRfor an area up to 35 km away from the station, which is withinreasonable spatiotemporal correlation lengths for aerosol opticalproperties evaluated previously (Anderson et al., 2003).
Results of this study can help devise methodologies for gov-ernments to more efficiently estimate VR at regional level. Inaddition to improvement in estimation of VR, this work can alsolead to better understanding of environmental and health effects
due to ambient air quality in terms of atmospheric visibility forareas with no existing air pollution monitoring stations. Theintegration of the remotely estimated VR into a real-time data-base network, such as Infusing Satellite Data into EnvironmentalApplications (IDEA) by National Oceanic and AtmosphericAdministration (NOAA) and Environment/ EnvironmentalCentral Facility (ENVF) Environmental and AtmosphericDatabase in Hong Kong, can help civil authorities both inimproving policy regulation and for control of transportationand navigation. With that in mind, our continuing goal is tofacilitate the implementation and further testing of such infra-structure in order to meeting the growing air quality-relatedissues faced by one of the world’s largest metropolitan cities.
Acknowledgment
The authors would like to acknowledge the NASA GoddardEarth Science Distributed Active Archive Center for the MODISLevel IB and Level 2 data and Brent Holben for helping with theHong Kong Polytechnic University AERONET station. AuthorM.S. kindly acknowledges Zhifeng Yang and Xiaoguang Xu atUniversity of Nebraska–Lincoln for assisting in the analyses.M.S.also thanks Prof. DavidK.Watkins and theDepartment of Earth&Atmospheric Sciences for providing office space and other logis-tic help during his visit in UNL. The Hong Kong PolytechnicUniversity Grant GYJ76 sponsored this research.
ReferencesAckerman, S.A., K.I. Strabala, W.P. Menzel, R.A. Frey, C.C. Moeller, and L.E.
Gumley. 1998. Discriminating clear sky from clouds with MODIS.J. Geophys. Res. 103(D24):32141–32157. doi:10.1029/1998JD200032
Anderson, T.L., S.J. Masonis, D. S. Covert, N.C. Ahlquist, S.G. Howell, A.D.Clarke, and C.S. McNaughton. 2003. Variability of aerosol optical propertiesderived from in situ aircraft measurements during ACE-Asia. J. Geophys.Res. 108(D23ACE):15–19. doi:10.1029/2002JD003247
Figure 8. Pattern statistics (Taylor diagram;Taylor, 2001)describing thevisibilities from the sixmodels comparedwithobservedvisibilities atHKIA.The radial distance fromthe origin at “0.0” represents the normalized standard deviation. “Obs” represents the statistics of observed visibilities at HKIA. RMS difference for the modeled visibilities isproportional to the radial distances from origin at “Obs” (units same as normalized standard deviation). Normalized Pearson’s correlation between observed and modeledvisibilities is represented along the azimuthal position along the outer hemisphere. Color bar scales the normalized bias (%) in each model (color figure available online).
Shahzad et al. / Journal of the Air & Waste Management Association 63 (2013) 1098–11101108
Dow
nloa
ded
by [
Uni
vers
ity o
f N
ebra
ska,
Lin
coln
] at
12:
14 2
0 A
ugus
t 201
3
Babari, R., N. Hautière, É. Dumont, R. Brémond, and N. Paparoditis. 2011. Amodel-driven approach to estimate atmospheric visibility with ordinary cam-eras. Atmos. Environ. 45:5316–5324. doi:10.1016/j.atmosenv.2011.06.053
Bäumer, D., S. Versick, and B. Vogel. 2008. Determination of the visibility usinga digital panorama camera. Atmos. Environ. 42:2593–2602. doi:10.1016/j.atmosenv.2007.10.017. xxx (accessed 24 January 2012).
Bendix, J. 1995. Determination of fog horizontal visibility by means of NOAA-AVHRR. Quantitative Remote Sensing for Science and Applications 3:1847,1849. doi:10.1109/IGARSS.1995.524045
Bian, Q. 2011. Study of visibility degradation over the Pearl River delta region:Source apportionment and impact of chemical characteristics.Ph.D. dissertation, The Hong Kong University of Science and Technology,Hong Kong.
Campbell, J.R., J.S. Reid, D.L. Westphal, J. Zhang, J.L. Tackett, B.N. Chew, E.J.Welton, A. Shimizu, N. Sugimoto, K. Aoki, and D.M. Winker. 2012.Characterizing the vertical profile of aerosol particle extinction and lineardepolarization over Southeast Asia and the Maritime Continent: The 2007–2009 view from CALIOP. Atmos. Res. 122:520–543. doi:10.1016/j.atmosres.2012.05.007
Campbell, J.R., K. Sassen, and E.J. Welton. 2008. Elevated cloud and aerosollayer retrievals from micropulse lidar signal profiles. J. Atmos. Ocean.Technol. 25:685–700. doi:10.1175/2007JTECHA1034.1
Chan, C.K., and X. Yao. 2008. Air pollution in mega cities in China. Atmos.Environ. 42:1–42. doi:10.1016/j.atmosenv.2007.09.003
Chang, W.L., and E.H. Koo. 1986. A study of visibility trends in Hong Kong(1968–1982). Atmos. Environ. 20:1847–1858. doi:10.1016/0004-6981(86)90325-2
Cheng, A.Y. S., M.H. Chan, and X. Yang. 2006. Study of aerosol optical thick-ness in Hong Kong, validation, results, and dependence on meteorologicalparameters. Atmos. Environ. 40:4469–4477. doi:10.1016/j.atmosenv.2006.04.022
Cheung, H.C., T. Wang, K. Baumann, and H. Guo. 2005. Influence of regionalpollution outflow on the concentrations of fine particulate matter and visibi-lity in the coastal area of southern china. Atmos. Environ. 39:6463–6474.doi:10.1016/j.atmosenv.2005.07.033
Chew, B.N., J.R. Campbell, J.S. Reid, D.M. Giles, E.J. Welton, S.V. Salinas, andS.C. Liew. 2011. Tropical cirrus cloud contamination in sun photometer data.Atmos. Environ. 45:6724–6731. doi:10.1016/j.atmosenv.2011.08.017
Chin, H.C. P. 1997. Visibility Impairment in Hong Kong. Hong Kong:Environmental Protection Department of Hong Kong.
Chow, J.C., J.G. Watson, D.H. Lowenthal, and L.W. Richards. 2002.Comparability between PM2.5 and particle light scattering measurements.Environ. Monit. Assess. 79:29–45. doi:10.1023/A:1020047307117.
Cui, G.M., M. Zhang, Z. Han, and Y. Liu. 2011. Episode simulation of Asian duststorms with an air quality modeling system. Adv. Atmos. Sci. 28:511–520.doi:10.1007/s00376-010-0091-3
Diner, D. 1985. Influence of aerosol scattering on atmospheric blurring of surfacefeatures. IEEE Trans. Geosci. Remote Sens. GE-23:618–624. doi:10.1109/TGRS.1985.289379
Dubovik, O., and D.K.Michael. 2000. A flexible inversion algorithm for retrievalof aerosol optical properties from sun and sky radiance measurements.J. Geophys. Res. 105(D16):20673–20696. doi:10.1029/2000JD900282
Fei, H., W. Hong, Q. Junping, and W. Guofu. 2006. Retrieval of atmospherichorizontal visibility by statistical regression from NOAA/AVHRR satellitedata. J. Ocean Univ. China 5:207–212. doi:10.1007/s11802-006-0003-4
Fernald, F. 1984. Analysis of atmospheric lidar observations: Some comments.Appl. Opt. 23:652–653. doi:10.1364/AO.23.000652
Hadjimitsis, D.G., C. Clayton, and L. Toulios. 2010. Retrieving visibility valuesusing satellite remote sensing data. Phys. Chem Earth A/B/C 35:121–124.doi:10.5194/nhess-10-89-2010
Hansen, J.E., and L.D. Travis. 1974. Light scattering in planetary atmospheres.Space Sci. Rev. 16:527–610. doi:10.1007/BF00168069
He, Q.S. 2006. A study on aerosol extinction-to-backscatter ratio with combina-tion of micro-pulse lidar and MODIS over Hong Kong. Atmos. Chem. Phys.Discuss. 6:3099–3133. doi:10.5194/acpd-6-3099-2006
He, Q., C. Li, J. Mao, A.K.H. Lau, and D.A. Chu. 2008. Analysis of aerosolvertical distribution and variability in Hong Kong, J. Geophys. Res. 113(D14): D14211.1–D14211.13, doi:10.1029/2008JD009778
Holben, B.N., T.F. Eck, I. Slutsker, D. Tanré, J.P. Buis, A. Setzer, E. Vermote.1998. AERONET—A federated instrument network and data archive foraerosol characterization. Remote Sens. Environ. 66:1–16. doi:10.1016/S0034-4257(98)00031-5
Hong Kong Observatory. Press release. 2005. http://www.hko.gov.hk/wxinfo/news/2005/pre0106e.htm (accessed October 29, 2012).
Horvath, H. 1981. The university of Vienna telephotometer. Atmos. Environ.15:2537–2546. doi:10.1016/0004-6981(81)90069-X.
Horvath, H., andW. Kaller. 1994. Calibration of integrating nephelometers in thepost-halocarbon era. Atmos. Environ. 28:1219–1223. doi:10.1016/1352-2310(94)90299-2
Hyslop, N.P. 2009. Impaired visibility: The air pollution people see. Atmos.Environ. 43:182–195. doi:10.1016/j.atmosenv.2008.09.067
Jung, J., H. Lee, Y.J. Kim, X. Liu, Y. Zhang, J. Gu, and S. Fan. 2009. Aerosolchemistry and the effect of aerosol water content on visibility impairment andradiative forcing in Guangzhou during the 2006 Pearl River Delta campaign.J. Environ. Manage. 90:3231–3244. doi:10.1016/j.jenvman.2009.04.021
Kaufman, Y.J., and R.S. Fraser. 1983. Light extinction by aerosols during sum-mer air pollution. J. Climate Appl. Meteorol. 22:1694–1706. doi:10.1175/1520-0450(1983)022<1694:LEBADS>2.0.CO;2
Klett, J.D. 1985. Lidar inversion with variable backscatter/extinction ratios. Appl.Opt. 24:1638–1643. doi:10.1364/AO.24.001638
Koschmieder, H. 1924. Theorie der horizontalen sichtweite. Beitr. Phys. Frei.Atmos. 12:33–171.
Kovalev, V.A., and W.E. Eichinger. 2004. Elastic Lidar: Theory, Practice, andAnalysis Methods. Hoboken, NJ: John Wiley.
Lai, L.Y., and R. Sequeira. 2001. Visibility degradation across Hong Kong: Itscomponents and their relative contributions. Atmos. Environ. 35:5861–5872.doi:10.1016/S1352-2310(01)00395-8
Lee, F.Y.P., and G.P. Gervat. 1995. Visibility Degradation and Its Relationship toAir Quality. Hong Kong: Environmental Protection Department of HongKong.
Levy, R.C., S. Mattoo, L.A. Munchak, L.A. Remer, A.M. Sayer, and N.C. Hsu.2013. The Collection 6MODIS aerosol products over land and ocean, Atmos.Meas. Tech. Discuss. 6:159–259. doi:10.5194/amtd-6-159-2013
Levy, R.C., L.A. Remer, S. Mattoo, E.F. Vermote, and Y.J. Kaufman. 2007.Second-generation operational algorithm: Retrieval of aerosol properties overland from inversion of moderate resolution imaging spectroradiometer spectralreflectance. J. Geophys. Res. 112(D13): 2–21. doi:10.1029/2006JD007811
Liu, P., C. Zhao, Q. Zhang, Z. Deng,M. Huang, X.Ma, and X. Tie. 2009. Aircraftstudy of aerosol vertical distributions over Beijing and their optical proper-ties. Tellus B 61:756–767. doi:10.1111/j.1600-0889.2009.00440.x
Lolli, S., L. Sauvage, S. Loaec, and M. Lardier. 2011. EZ Lidar: A newcompact autonomous eye-safe scanning aerosol Lidar for extinctionmeasurements and PBL height detection. Validation of the performancesagainst other instruments and intercomparison campaigns. Opt. PuraAppl. 44:33–41.
Louie, P.K., J.C. Chow, L.W. Chen, J.G. Watson, G. Leung, and D.W. Sin. 2005.PM2.5 chemical composition in Hong Kong: Urban and regional variations.Sci. Total Environ. 338:267–281. doi:10.1016/j.scitotenv.2004.07.021
Malm, W.C., K.A. Gebhart, J. Molenar, T. Cahill, R. Eldred, and D. Huffman.1994. Examining the relationship between atmospheric aerosols and lightextinction at Mount Rainier and north cascades national parks. Atmos.Environ. 28:347–360. doi:10.1016/1352-2310(94)90110-4
Mishchenko, M.I., I.V. Geogdzhayev, L. Liu, J.A. Ogren, A.A. Lacis, W.B.Rossow, J.W. Hovenier, H. Volten, and O. Muñoz. 2003. Aerosol retrievalsfrom AVHRR radiances: Effects of particle nonsphericity and absorption andan updated long-term global climatology of aerosol properties. J. Quant.Spectrosc. Radiat. Transfer. 79–80:953–972. doi:10.1016/S0022-4073(02)00331-X
Moody, E.G., M.D. King, C.B. Schaaf, and S. Platnick. 2008. MODIS-derivedspatially complete surface albedo products: Spatial and temporal pixel
Shahzad et al. / Journal of the Air & Waste Management Association 63 (2013) 1098–1110 1109
Dow
nloa
ded
by [
Uni
vers
ity o
f N
ebra
ska,
Lin
coln
] at
12:
14 2
0 A
ugus
t 201
3
distribution and zonal averages. J. Appl. Meteorol. Climatol. 47:2879–2894.doi:10.1175/2008JAMC1795.1
Mui, K.W., L.T. Wong, and P.S. Hui. 2009. Screening strategies of an indoor airquality express assessment protocol (EAP) for air-conditioned offices. IndoorBuilt Environ. 18:77–82. doi:10.1177/1420326X08101529
Nichol, J.E., M.S. Wong, and J. Wang. 2010. A 3D aerosol and visibilityinformation system for urban areas using remote sensing and GIS. Atmos.Environ. 44:2501–2506. doi:10.1016/j.atmosenv.2010.04.036
Otterman, J. 1985. Satellite measurements of surface albedo and temperatures insemi-desert. J. Climate Appl. Meteorol. 24:228–235. doi:10.1175/1520-0450(1985)024<0228:SMOSAA>2.0.CO;2
Peterson, J.T., E.C. Flowers, G.J. Berri, C.L. Reynolds, and J.H. Rudisill. 1981.Atmospheric turbidity over central North Carolina. J. Appl. Meteorol.Climatol. 20:229–241. doi:10.1175/1520-0450(1981)020<0229:ATOCNC>2.0.CO;2
Qun, L.S., L. Mang, W.J. Ming, C.C. Yu, and S.X. Fang. 2009. Characterizationand relationship of long-term visibility and air pollutant changes in the HongKong region. China Environ. Sci. 29:351–356.
Rainwater, M., and L. Gregory. 2005. Cimel Sun Photometer (CSPHOT)Handbook. ARM TR-056, U.S. Department of Energy, Office of Science,Office of Biological and Environmental Research. http://www.arm.gov/instruments/
Remer, L.A., Y.J. Kaufman, D. Tanré, S. Mattoo, D.A. Chu, J.V. Martins, R.R Li.2005. The MODIS aerosol algorithm, products and validation. J. Atmos. Sci.62:947–973. doi:10.1175/JAS3385.1
Schaaf, C.B., F. Gao, A.H. Strahler, W. Lucht, X. Li, T. Tsang, N.C. Strugnell.2002. First operational BRDF, albedo nadir reflectance products fromMODIS. Remote Sens. Environ. 83:135–148. doi:10.1016/S0034-4257(02)00091-3
Sequeira, R., and K.H. Lai. 1998. The effect of meteorological parameters andaerosol constituents on visibility in urban Hong Kong. Atmos. Environ.32:2865–2871. doi:10.1016/S1352-2310(97)00494-9
Taylor, E.K. 2001. Summarizing multiple aspects of model performance in asingle diagram. J. Geophys. Res. 106:7183–7192. doi:10.1029/2000JD900719
Thach, T.Q., C.M. Wong, K.P. Chan, Y.K. Chau, Y.N. Chung, C.Q. Ou, L. Yang,and A.J. Hedley. 2010. Daily visibility and mortality: Assessment of healthbenefits from improved visibility in Hong Kong. Environ. Res. 110:617–623.doi:10.1016/j.envres.2010.05.005
Vajanapoom, N., C.M. Shy, L.M. Neas, and D. Loomis. 2001. Estimation ofparticulate matter from visibility in Bangkok, Thailand. J. Expos. Anal.Environ. Epidemiol. 11:97–102. doi:10.1038/sj.jea.7500148
Wan, J.M., M. Lin, C.Y. Chan, Z.S. Zhang, G. Engling, X.M. Wang, I.N. Chan,and S.Y. Li. 2011. Change of air quality and its impact on atmosphericvisibility in central-western Pearl River delta. Environ. Monit. Assess.172:339–351. doi:10.1007/s10661-010-1338-2
Wang, T., C.N. Poon, Y.H. Kwok, and Y.S. Li. 2003. Characterizing the temporalvariability and emission patterns of pollution plumes in the Pearl River deltaof China. Atmos. Environ. 37:3539–3550. doi:10.1016/S1352-2310(03)00363-7
Watson, J.G. 2002. Visibility: Science and regulation. J. Air Waste Manage.Assoc. 52:628–713. doi:10.1080/10473289.2002.10470813
William, C.M. 1999. Introduction to Visibility. Fort Collins, CO CooperativeInstitute for Research in the Atmosphere, NPS Visibility Program, ColoradoState University. http://www.epa.gov/visibility/pdfs/introvis.pdf.
Williams, D.H., and J.L. Cogan. 1991. Estimation of visibility from satelliteimagery. Appl. Opt. 30:400–414. doi:10.1364/AO.30.000414
Winker, D.M., J. Pelon, J.A. Coakley, S.A. Ackerman, R.J. Charlson,P.R. Colarco, P. Flamant. 2010. The CALIPSO mission: A global 3D viewof aerosols and clouds. Bull. Am. Meteorol. Soc. 91:1211–1229. doi:10.1175/2010BAMS3009.1.
Wong, M.S., J.E. Nichol, and K.H. Lee. 2011. An operational MODIS aerosolretrieval algorithm at high spatial resolution, and its application over acomplex urban region. Atmos. Res. 99:579–589. doi:10.1016/j.atmosres.2010.12.015
Wu, D., X. Tie, C. Li, Z. Ying, A.K.H. Lau, J. Huang, X. Deng, and X. Bi. 2005.An extremely low visibility event over the Guangzhou region: A case study.Atmos. Environ. 39:6568–6577. doi:10.1016/j.atmosenv.2005.07.061.
Xue, M., F. Kong, K.W. Thomas, Y. Wang, K. Brewster, J. Gao, X. Wang, S.J.Weiss, A.J. Clark, J.S. Kain, M.C. Coniglio, J. Du, T.L. Jensen, and Y.H. Kuo.2010. CAPS real time storm scale ensemble and high resolution forecasts forthe NOAA hazardous weather test bed. 2010 spring experiment. In 25thConference on Severe Local Storms, Denver, CO, October 11, 2010,American Meteorological Society, Paper 7B.3.
Yu, H.B., R.E. Dickinson, M. Chin, Y.J. Kaufman, B.N. Holben, I.V.Geogdzhayev, and M.I. Mishchenko. 2003. Annual cycle of global distribu-tions of aerosol optical depth from integration of MODIS retrievals andGOCART model simulations. J. Geophys. Res. 108(D3):1–14. doi:10.1029/2002JD002717
Yuan, C.S., C.G. Lee, S.H. Liu, C. Yuan, H.Y. Yang, and C.T.A. Chen. 2002.Developing strategies for improving urban visual air quality. Aerosol AirQual. Res. 2:9–22. doi:10.4209/2002.06.0002
Zhuang, H., C.K. Chan, M. Fang, and A.S. Wexler. 1999. Size distributions ofparticulate sulfate, nitrate, and ammonium at a coastal site in Hong Kong.Atmos. Environ. 33:843–853. doi:10.1016/S1352-2310(98)00305-7.
Zieger, P., E. Weingartner, J. Henzing, M. Moerman, G. de Leeuw, J. Mikkilä, M.Ehn. 2011. Comparison of ambient aerosol extinction coefficients obtainedfrom in-situ, MAX-DOAS and LIDAR measurements at Cabauw. Atmos.Chem. Phys. 11:2603–2624. doi:10.5194/acp-11-2603-2011
About the AuthorsMuhammad I. Shahzad is a Ph.D. candidate at the Department of LandSurveying and Geo-Informatics, The Hong Kong Polytechnic University, HungHom, HongKong. Presently, he is a visiting research scholar at the Department ofEarth and Atmospheric Sciences, University of Nebraska, Lincoln, Nebraska,USA.
Janet E. Nichol is a professor at the Department of Land Surveying and Geo-Informatics, The Hong Kong Polytechnic University, Hung Hom, Hong Kong.
Jun Wang is a professor at the Department of Earth and Atmospheric Sciences,University of Nebraska, Lincoln, Nebraska, USA.
James R. Campbell is a meteorologist assigned to the Aerosol and RadiationSection at the Naval Research Laboratory in Monterey, California, USA.
PakW. Chan is a senior scientific officer at Hong Kong Observatory, Kowloon,Hong Kong.
Shahzad et al. / Journal of the Air & Waste Management Association 63 (2013) 1098–11101110
Dow
nloa
ded
by [
Uni
vers
ity o
f N
ebra
ska,
Lin
coln
] at
12:
14 2
0 A
ugus
t 201
3