Embed Size (px)
Citation preview

Estimating the E�ect of Urban Environment on
Swedish Firm Productivity
Ziada Ghebremikael Tareke∗
September 30, 2011
∗Master Thesis in Econometrics. Course code: EC 9901. Department of Economics,
Stockholm University, SE 106 91, Stockholm. Supervisor: Martin Flodén.
1
1 Introduction
A country's economic growth is determined by its level of productivity, mak-
ing the study of factors driving productivity growth an area of great interest
to Economics. There are many di�erent factors that drive the productiv-
ity forward - Agglomeration Economies are often considered as one of them.
The theory of Agglomeration Economies highlights the importance of urban
environment on productivity. The theory suggests that if an environment
consists of a high concentration of �rms from di�erent industries - it con-
tributes to larger and more diverse cities, which the Agglomeration refers to
as Urbanization Economies.
The purpose of this thesis is to study the extent to which the e�ects of urban-
ization are present in the Swedish economy and to investigate if the e�ects are
associated with the levels of human capital. Furthermore, this study aims to
investigate how the e�ects of urbanization change over time.Previous studies
have found support for the existence of Urbanization Economies, implying
that productivity increases with an increase of the size of the city. It is ac-
knowledged that larger and more diverse cities allow individuals as well as
�rms to exchange and acquire knowledge to a higher extent. The presence of
knowledge diversity combined with close proximity simpli�es the possibility
for individuals as well as �rms to interact - leading to a spread of new ideas
and thereby an increase in productivity. If larger cities enhance the produc-
tivity levels of Swedish �rms and thereby increase the growth levels in the
economy as a whole, it would be crucial for Swedish policy makers to sup-
port economic activity in larger cities, for example taking into consideration
factors such as housing shortages becomes important.1 The lack of housing
today has prevented university students from settling in Stockholm, forcing
1Stenkula and Zenou (2011) and Edward Gleaser makes similar suggestions.
1
them to study elsewhere (Dagens Nyheter 23 Aug. 2011, Svenska Dagbladet
30 Aug. 2011). Hence, it suggests a need to improvement the housing supply
in order to encourage economic activity.
On the other hand, new and advanced Information Technology (IT) is chang-
ing the logic of businesses and the structure of the market (SNS Economic
policy group report 2001). Information Technology is thus changing society's
way of exchanging knowledge. Online university courses internet forums and
blogs are all important examples of factors changing ways of spreading knowl-
edge. The factors previously mentioned all make the proximity aspect less
important in communicating. Banking errands done online are also an exam-
ple of how the importance of being located in larger cities may be changing.
Does this imply a change in the importance of Urbanization Economies? Is
the e�ect of larger cities on productivity growth diminishing over time? It
should be noted that the authors of the SNS report also point out that it
might take a long time before we can see the IT sector's e�ects on produc-
tivity. The meaning of "a long time" is, however, not de�ned. This study
focuses on the time frame between 2001 and 2008 to be relatively long and
investigates if the urbanization has diminished as an e�ect of a blooming IT
sector making it less important to locate in concentrated agglomerations.
This study uses data from by Statistics Sweden to estimate the e�ect of
agglomeration on productivity levels. The data covers the time period be-
tween1997 and 2008. It includes information of �rm level output, interme-
diate inputs, human capital, ownership structures and city sizes. A Cobb-
Douglas production function will be estimated using three di�erent methods;
pooled OLS, Fixed E�ects and Random E�ects. These methods will be used
in order to validate the structure of the data and control for possible un-
2

observed e�ects. The results from the study indicate that larger cities are
important for �rm productivity. In addition, it also con�rms that one of
the underlying generators of Agglomeration Economics is the level of human
capital among workers. Thus, implying that when workers spread ideas and
learn from each other their productivity levels increases. Moreover, the re-
sults indicate some support for the idea of a diminishing e�ect of urbanization
on productivity. This can perhaps be due to advances in the IT sector. The
signi�cance of these results, however, are slightly weaker when estimating
the �xed e�ects model.
The following parts of this paper are structured as follows: section 2 will
discuss possible factors generating Urbanization Economies and what pre-
vious studies have found. The data used for estimation will be discussed
in section 3. The empirical framework is explained in section 4 followed by
section 5 where the results are given. In section 6, the concluding remarks
will be presented.
3
2 The Theory of Urbanization Economies
Urbanization is a concept within Agglomeration Economics, which refers to
the bene�ts gained due to the spatial concentration of �rms across di�erent
industries or from the size of the city. The theory focuses on exploring the
choices of individuals and �rms from di�erent industries, to locating close to
each other. It is these choices that can result in the development of larger and
more diverse cities. When �rm productivity bene�ts from the surrounding
environment - external economies arise.2There are four underlying reasons
that generate Urbanization Economies and leading to increasing labor pro-
ductivity, O'Sullivan (2009).
They are summarized as followed. The �rst generator is that �rms often share
the same intermediate inputs. An example is banking services, which is gen-
erally used by all �rms, regardless of industry. Furthermore, �rms located
near each other will experience the same city features, and thus experience
the same public infrastructure. Highways, ports, harbors and universities are
all factors that can be bene�cial to a wide range of �rms and individuals.
The e�ect of this can be lower prices due to shared intermediate inputs which
can have a positive e�ect on productivity.
The second generator is based on the assumption that; a key incentive for
�rms to cluster is the competition for labor and the possibility of varying
wages when the �rm faces good and bad times. When a �rm's demand
varies, labor pooling makes it possible to relocate workers from unsuccessful
�rms to successful ones. Hence the coordination makes it possible to in-
crease total productivity. Firms facing more idiosyncratic shocks are more
spatially concentrated facilitating the relocation of workers, Overman and
Puga (2009).
2See O' Sullivan (2009) for the 5 axioms of urban economics.
4
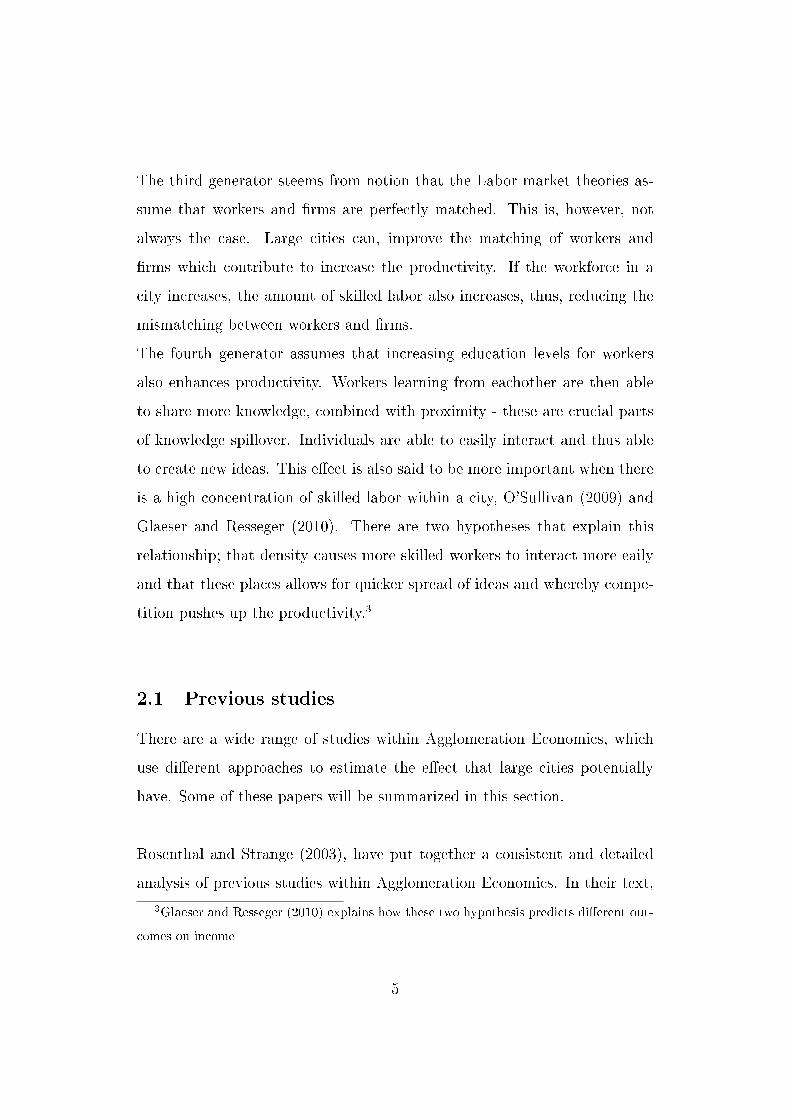
The third generator steems from notion that the Labor market theories as-
sume that workers and �rms are perfectly matched. This is, however, not
always the case. Large cities can, improve the matching of workers and
�rms which contribute to increase the productivity. If the workforce in a
city increases, the amount of skilled labor also increases, thus, reducing the
mismatching between workers and �rms.
The fourth generator assumes that increasing education levels for workers
also enhances productivity. Workers learning from eachother are then able
to share more knowledge, combined with proximity - these are crucial parts
of knowledge spillover. Individuals are able to easily interact and thus able
to create new ideas. This e�ect is also said to be more important when there
is a high concentration of skilled labor within a city, O'Sullivan (2009) and
Glaeser and Resseger (2010). There are two hypotheses that explain this
relationship; that density causes more skilled workers to interact more eaily
and that these places allows for quicker spread of ideas and whereby compe-
tition pushes up the productivity.3
2.1 Previous studies
There are a wide range of studies within Agglomeration Economics, which
use di�erent approaches to estimate the e�ect that large cities potentially
have. Some of these papers will be summarized in this section.
Rosenthal and Strange (2003), have put together a consistent and detailed
analysis of previous studies within Agglomeration Economics. In their text,
3Glaeser and Resseger (2010) explains how these two hypothesis predicts di�erent out-
comes on income
5
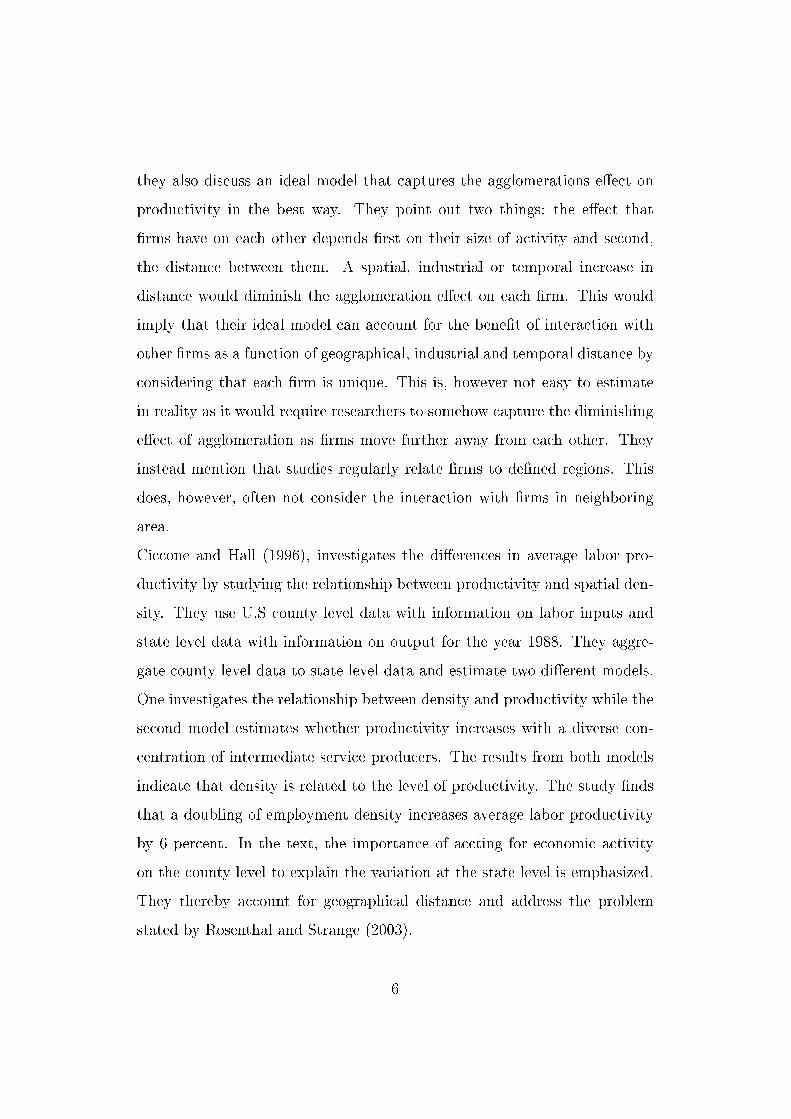
they also discuss an ideal model that captures the agglomerations e�ect on
productivity in the best way. They point out two things; the e�ect that
�rms have on each other depends �rst on their size of activity and second,
the distance between them. A spatial, industrial or temporal increase in
distance would diminish the agglomeration e�ect on each �rm. This would
imply that their ideal model can account for the bene�t of interaction with
other �rms as a function of geographical, industrial and temporal distance by
considering that each �rm is unique. This is, however not easy to estimate
in reality as it would require researchers to somehow capture the diminishing
e�ect of agglomeration as �rms move further away from each other. They
instead mention that studies regularly relate �rms to de�ned regions. This
does, however, often not consider the interaction with �rms in neighboring
area.
Ciccone and Hall (1996), investigates the di�erences in average labor pro-
ductivity by studying the relationship between productivity and spatial den-
sity. They use U.S county level data with information on labor inputs and
state level data with information on output for the year 1988. They aggre-
gate county level data to state level data and estimate two di�erent models.
One investigates the relationship between density and productivity while the
second model estimates whether productivity increases with a diverse con-
centration of intermediate service producers. The results from both models
indicate that density is related to the level of productivity. The study �nds
that a doubling of employment density increases average labor productivity
by 6 percent. In the text, the importance of accting for economic activity
on the county level to explain the variation at the state level is emphasized.
They thereby account for geographical distance and address the problem
stated by Rosenthal and Strange (2003).
6
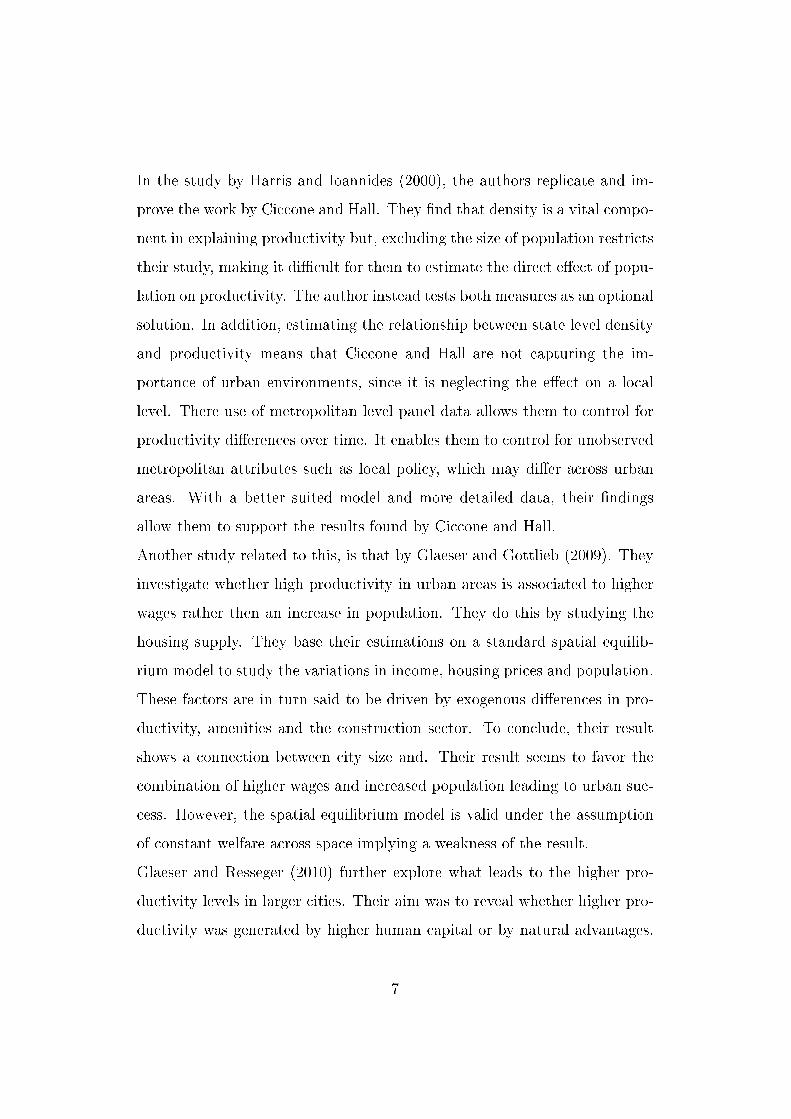
In the study by Harris and Ioannides (2000), the authors replicate and im-
prove the work by Ciccone and Hall. They �nd that density is a vital compo-
nent in explaining productivity but, excluding the size of population restricts
their study, making it di�cult for them to estimate the direct e�ect of popu-
lation on productivity. The author instead tests both measures as an optional
solution. In addition, estimating the relationship between state level density
and productivity means that Ciccone and Hall are not capturing the im-
portance of urban environments, since it is neglecting the e�ect on a local
level. There use of metropolitan level panel data allows them to control for
productivity di�erences over time. It enables them to control for unobserved
metropolitan attributes such as local policy, which may di�er across urban
areas. With a better suited model and more detailed data, their �ndings
allow them to support the results found by Ciccone and Hall.
Another study related to this, is that by Glaeser and Gottlieb (2009). They
investigate whether high productivity in urban areas is associated to higher
wages rather then an increase in population. They do this by studying the
housing supply. They base their estimations on a standard spatial equilib-
rium model to study the variations in income, housing prices and population.
These factors are in turn said to be driven by exogenous di�erences in pro-
ductivity, amenities and the construction sector. To conclude, their result
shows a connection between city size and. Their result seems to favor the
combination of higher wages and increased population leading to urban suc-
cess. However, the spatial equilibrium model is valid under the assumption
of constant welfare across space implying a weakness of the result.
Glaeser and Resseger (2010) further explore what leads to the higher pro-
ductivity levels in larger cities. Their aim was to reveal whether higher pro-
ductivity was generated by higher human capital or by natural advantages.
7
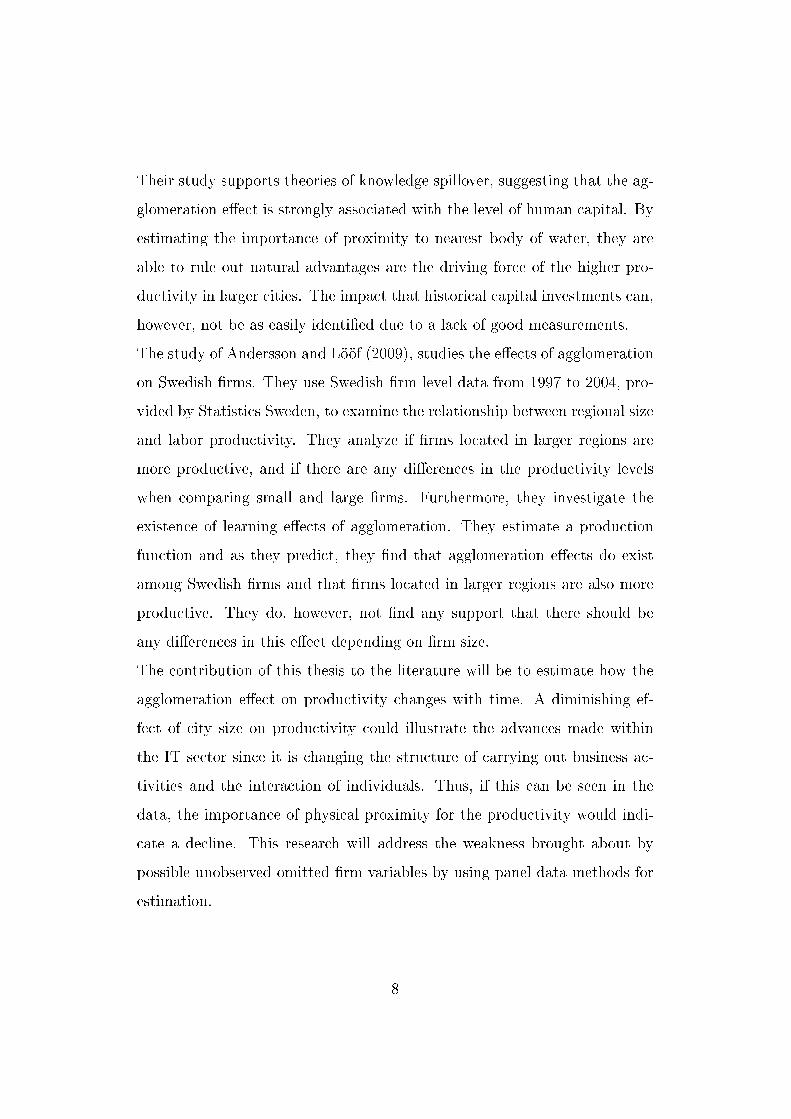
Their study supports theories of knowledge spillover, suggesting that the ag-
glomeration e�ect is strongly associated with the level of human capital. By
estimating the importance of proximity to nearest body of water, they are
able to rule out natural advantages are the driving force of the higher pro-
ductivity in larger cities. The impact that historical capital investments can,
however, not be as easily identi�ed due to a lack of good measurements.
The study of Andersson and Lööf (2009), studies the e�ects of agglomeration
on Swedish �rms. They use Swedish �rm level data from 1997 to 2004, pro-
vided by Statistics Sweden, to examine the relationship between regional size
and labor productivity. They analyze if �rms located in larger regions are
more productive, and if there are any di�erences in the productivity levels
when comparing small and large �rms. Furthermore, they investigate the
existence of learning e�ects of agglomeration. They estimate a production
function and as they predict, they �nd that agglomeration e�ects do exist
among Swedish �rms and that �rms located in larger regions are also more
productive. They do, however, not �nd any support that there should be
any di�erences in this e�ect depending on �rm size.
The contribution of this thesis to the literature will be to estimate how the
agglomeration e�ect on productivity changes with time. A diminishing ef-
fect of city size on productivity could illustrate the advances made within
the IT sector since it is changing the structure of carrying out business ac-
tivities and the interaction of individuals. Thus, if this can be seen in the
data, the importance of physical proximity for the productivity would indi-
cate a decline. This research will address the weakness brought about by
possible unobserved omitted �rm variables by using panel data methods for
estimation.
8
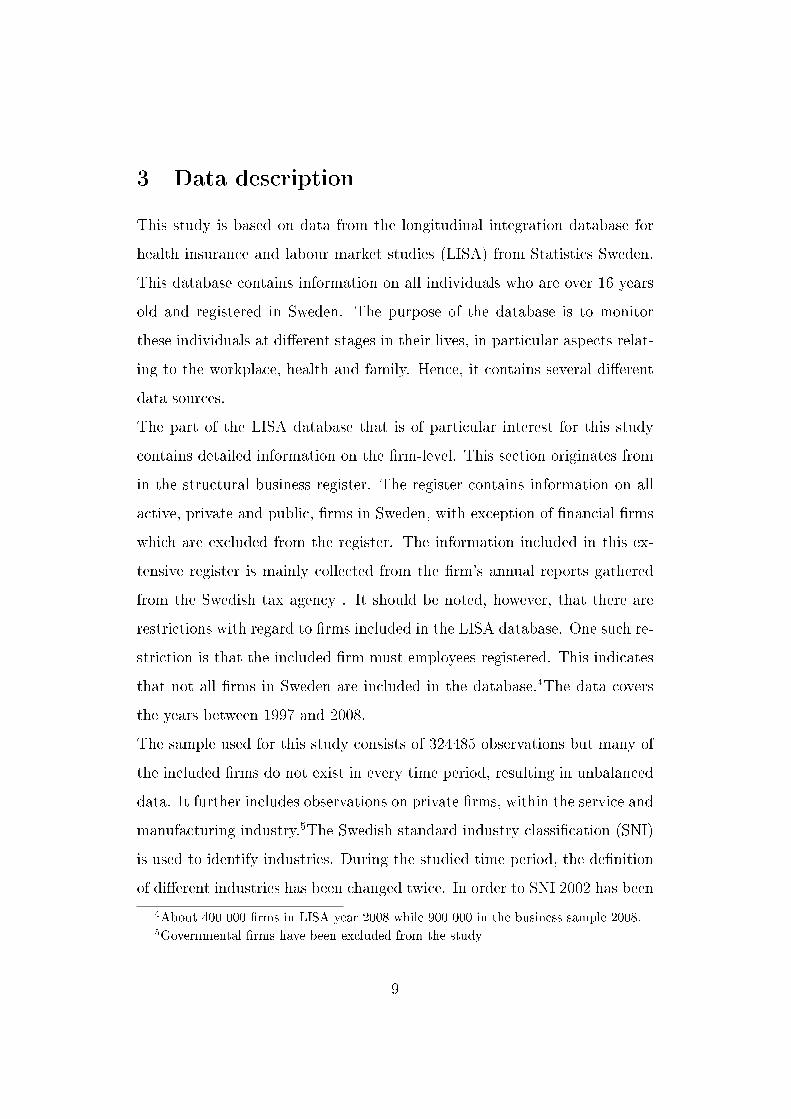
3 Data description
This study is based on data from the longitudinal integration database for
health insurance and labour market studies (LISA) from Statistics Sweden.
This database contains information on all individuals who are over 16 years
old and registered in Sweden. The purpose of the database is to monitor
these individuals at di�erent stages in their lives, in particular aspects relat-
ing to the workplace, health and family. Hence, it contains several di�erent
data sources.
The part of the LISA database that is of particular interest for this study
contains detailed information on the �rm-level. This section originates from
in the structural business register. The register contains information on all
active, private and public, �rms in Sweden, with exception of �nancial �rms
which are excluded from the register. The information included in this ex-
tensive register is mainly collected from the �rm's annual reports gathered
from the Swedish tax agency . It should be noted, however, that there are
restrictions with regard to �rms included in the LISA database. One such re-
striction is that the included �rm must employees registered. This indicates
that not all �rms in Sweden are included in the database.4The data covers
the years between 1997 and 2008.
The sample used for this study consists of 324485 observations but many of
the included �rms do not exist in every time period, resulting in unbalanced
data. It further includes observations on private �rms, within the service and
manufacturing industry.5The Swedish standard industry classi�cation (SNI)
is used to identify industries. During the studied time period, the de�nition
of di�erent industries has been changed twice. In order to SNI 2002 has been
4About 400 000 �rms in LISA year 2008 while 900 000 in the business sample 2008.5Governmental �rms have been excluded from the study
9
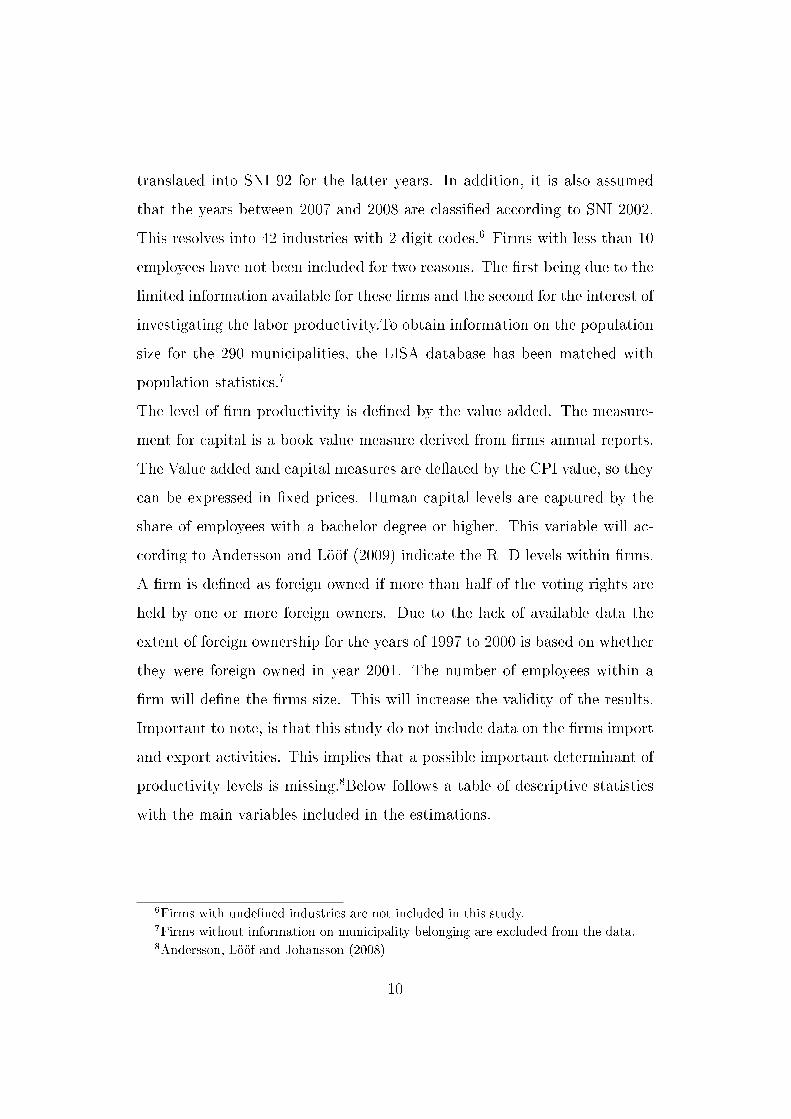
translated into SNI 92 for the latter years. In addition, it is also assumed
that the years between 2007 and 2008 are classi�ed according to SNI 2002.
This resolves into 42 industries with 2 digit codes.6 Firms with less than 10
employees have not been included for two reasons. The �rst being due to the
limited information available for these �rms and the second for the interest of
investigating the labor productivity.To obtain information on the population
size for the 290 municipalities, the LISA database has been matched with
population statistics.7
The level of �rm productivity is de�ned by the value added. The measure-
ment for capital is a book value measure derived from �rms annual reports.
The Value added and capital measures are de�ated by the CPI value, so they
can be expressed in �xed prices. Human capital levels are captured by the
share of employees with a bachelor degree or higher. This variable will ac-
cording to Andersson and Lööf (2009) indicate the R D levels within �rms.
A �rm is de�ned as foreign owned if more than half of the voting rights are
held by one or more foreign owners. Due to the lack of available data the
extent of foreign ownership for the years of 1997 to 2000 is based on whether
they were foreign owned in year 2001. The number of employees within a
�rm will de�ne the �rms size. This will increase the validity of the results.
Important to note, is that this study do not include data on the �rms import
and export activities. This implies that a possible important determinant of
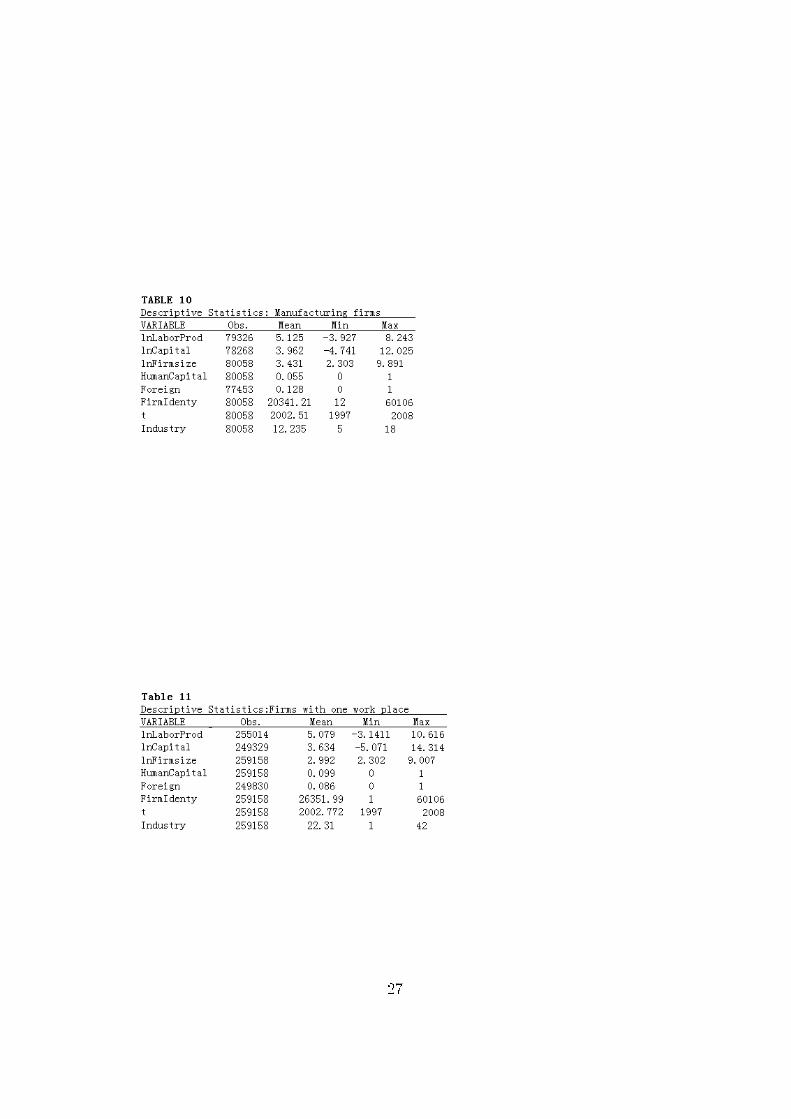
productivity levels is missing.8Below follows a table of descriptive statistics
with the main variables included in the estimations.
6Firms with unde�ned industries are not included in this study.7Firms without information on municipality belonging are excluded from the data.8Andersson, Lööf and Johansson (2008)
10
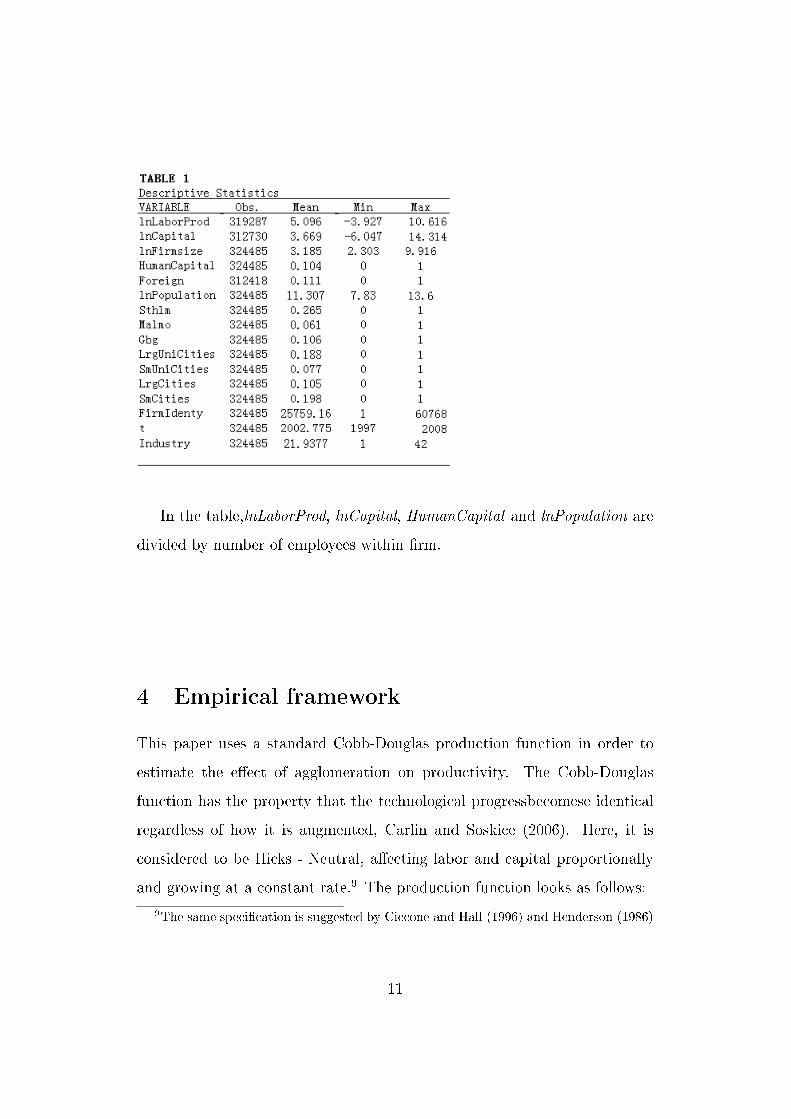
In the table,lnLaborProd, lnCapital, HumanCapital and lnPopulation are
divided by number of employees within �rm.
4 Empirical framework
This paper uses a standard Cobb-Douglas production function in order to
estimate the e�ect of agglomeration on productivity. The Cobb-Douglas
function has the property that the technological progressbecomese identical
regardless of how it is augmented, Carlin and Soskice (2006). Here, it is
considered to be Hicks - Neutral, a�ecting labor and capital proportionally
and growing at a constant rate.9 The production function looks as follows:
9The same speci�cation is suggested by Ciccone and Hall (1996) and Henderson (1986)
11
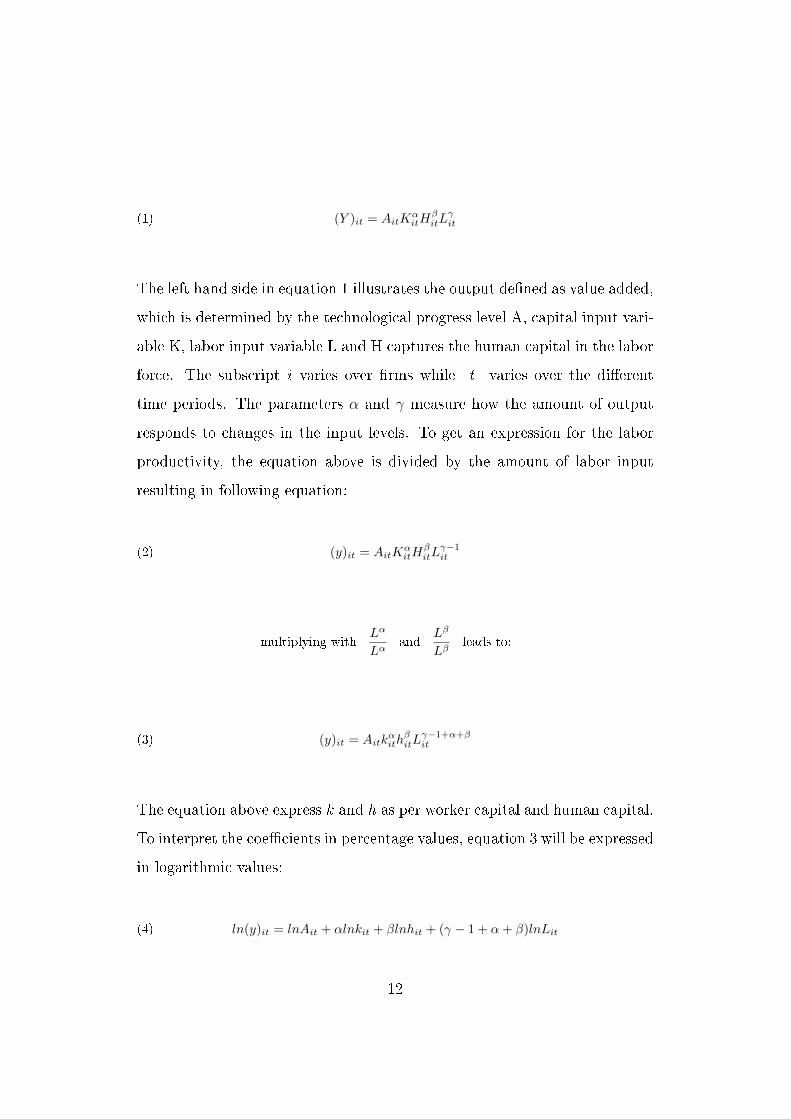
(1) (Y )it = AitKαitH
βitL
γit
The left hand side in equation 1 illustrates the output de�ned as value added,
which is determined by the technological progress level A, capital input vari-
able K, labor input variable L and H captures the human capital in the labor
force. The subscript i varies over �rms while t varies over the di�erent
time periods. The parameters α and γ measure how the amount of output
responds to changes in the input levels. To get an expression for the labor
productivity, the equation above is divided by the amount of labor input
resulting in following equation:
(2) (y)it = AitKαitH
βitL
γ−1it
multiplying withLα
Lαand
Lβ
Lβleads to:
(3) (y)it = Aitkαith
βitL
γ−1+α+βit
The equation above express k and h as per worker capital and human capital.
To interpret the coe�cients in percentage values, equation 3 will be expressed
in logarithmic values:
(4) ln(y)it = lnAit + αlnkit + βlnhit + (γ − 1 + α+ β)lnLit
12
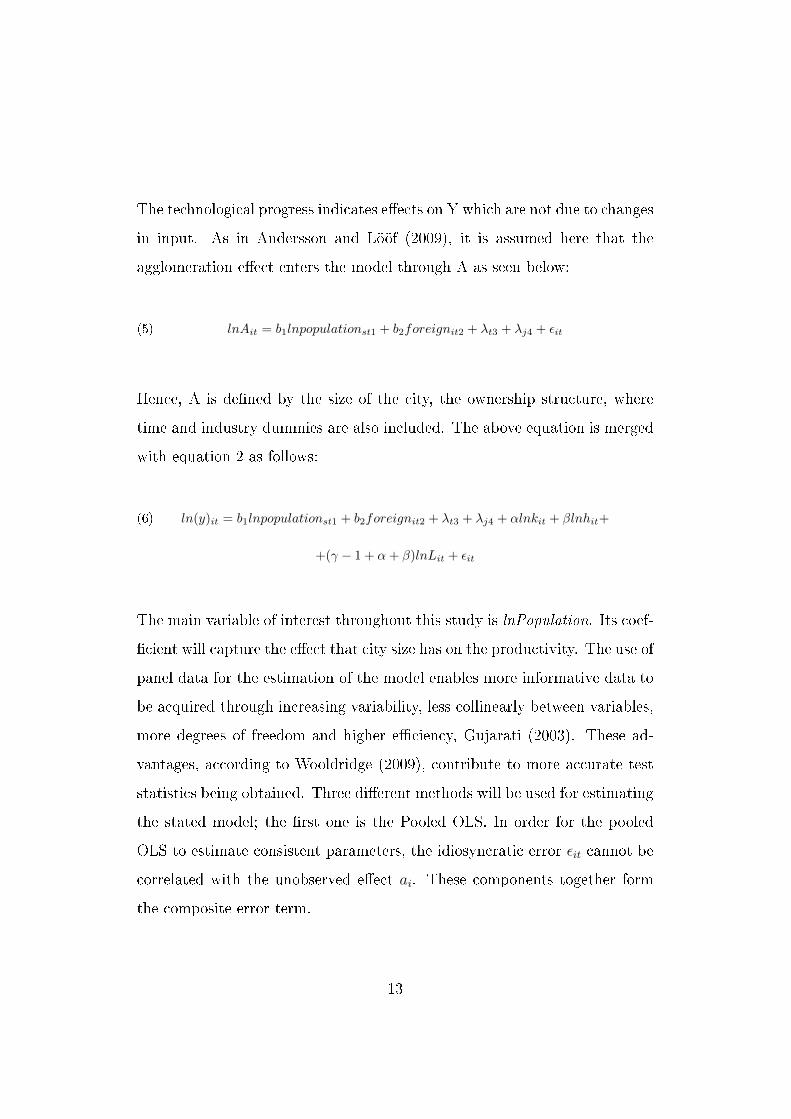
The technological progress indicates e�ects on Y which are not due to changes
in input. As in Andersson and Lööf (2009), it is assumed here that the
agglomeration e�ect enters the model through A as seen below:
(5) lnAit = b1lnpopulationst1 + b2foreignit2 + λt3 + λj4 + εit
Hence, A is de�ned by the size of the city, the ownership structure, where
time and industry dummies are also included. The above equation is merged
with equation 2 as follows:
(6) ln(y)it = b1lnpopulationst1 + b2foreignit2 + λt3 + λj4 + αlnkit + βlnhit+
+(γ − 1 + α+ β)lnLit + εit
The main variable of interest throughout this study is lnPopulation. Its coef-
�cient will capture the e�ect that city size has on the productivity. The use of
panel data for the estimation of the model enables more informative data to
be acquired through increasing variability, less collinearly between variables,
more degrees of freedom and higher e�ciency, Gujarati (2003). These ad-
vantages, according to Wooldridge (2009), contribute to more accurate test
statistics being obtained. Three di�erent methods will be used for estimating
the stated model; the �rst one is the Pooled OLS. In order for the pooled
OLS to estimate consistent parameters, the idiosyncratic error εit cannot be
correlated with the unobserved e�ect ai. These components together form
the composite error term.
13
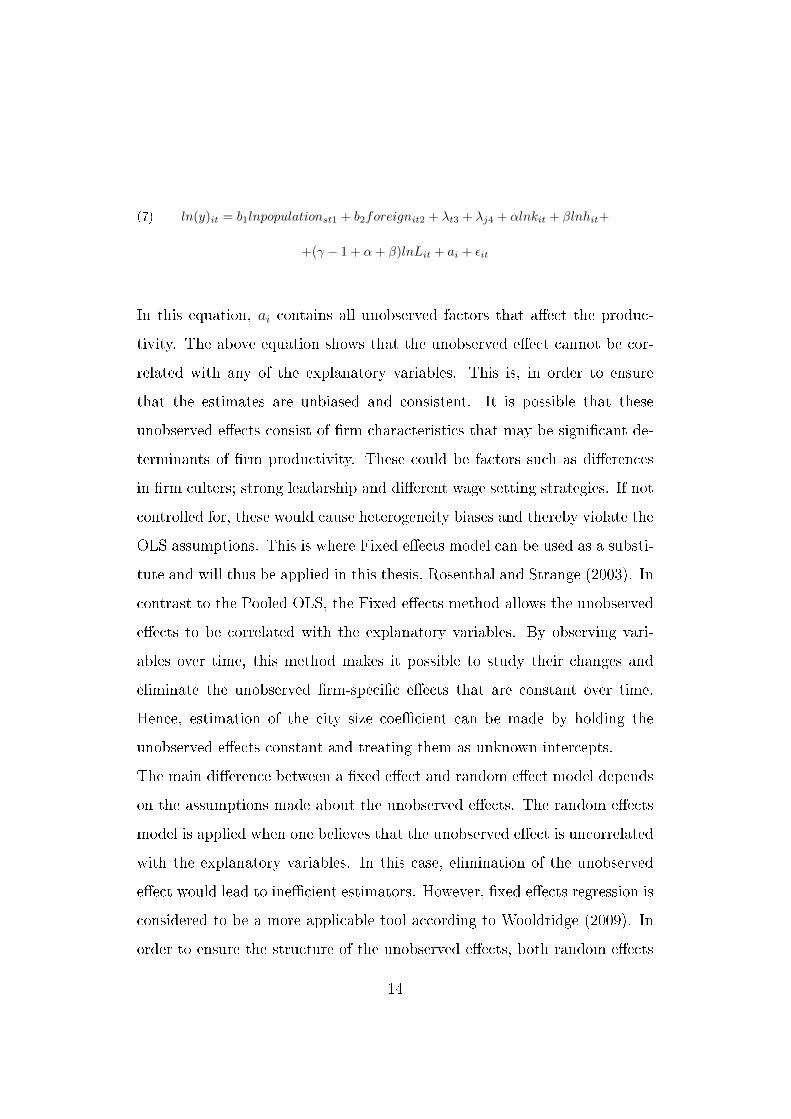
(7) ln(y)it = b1lnpopulationst1 + b2foreignit2 + λt3 + λj4 + αlnkit + βlnhit+
+(γ − 1 + α+ β)lnLit + ai + εit
In this equation, ai contains all unobserved factors that a�ect the produc-
tivity. The above equation shows that the unobserved e�ect cannot be cor-
related with any of the explanatory variables. This is, in order to ensure
that the estimates are unbiased and consistent. It is possible that these
unobserved e�ects consist of �rm characteristics that may be signi�cant de-
terminants of �rm productivity. These could be factors such as di�erences
in �rm culters; strong leadarship and di�erent wage setting strategies. If not
controlled for, these would cause heterogeneity biases and thereby violate the
OLS assumptions. This is where Fixed e�ects model can be used as a substi-
tute and will thus be applied in this thesis, Rosenthal and Strange (2003). In
contrast to the Pooled OLS, the Fixed e�ects method allows the unobserved
e�ects to be correlated with the explanatory variables. By observing vari-
ables over time, this method makes it possible to study their changes and
eliminate the unobserved �rm-speci�c e�ects that are constant over time.
Hence, estimation of the city size coe�cient can be made by holding the
unobserved e�ects constant and treating them as unknown intercepts.
The main di�erence between a �xed e�ect and random e�ect model depends
on the assumptions made about the unobserved e�ects. The random e�ects
model is applied when one believes that the unobserved e�ect is uncorrelated
with the explanatory variables. In this case, elimination of the unobserved
e�ect would lead to ine�cient estimators. However, �xed e�ects regression is
considered to be a more applicable tool according to Wooldridge (2009). In
order to ensure the structure of the unobserved e�ects, both random e�ects
14
and �xed e�ects will be applied and a Hausman test will be performed to
determine the signi�cance of the coe�cients.
Although, both the Fixed and Random e�ects approaches are appreciated
methods for Panel data analysis, some argues, Anderson and Loof (2009),
and Soderbom and Sato (2011), that these methods are not always su�-
cient if data su�ers from autocorrelation, heteroskedasticity and endogenity
problems. An alternative approach would be to estimate General Method
of Moments (GMM), which allows for heteroskedasticity and serial correla-
tion over time. It is, however, also mentioned that the GMM estimator can
generate invalid estimates. Henderson (2003) evaluates which models that
are best suited to estimate the e�ect of agglomeration . He �nds that �xed
e�ect regression with metropolitan time-�xed e�ect and �rm �xed e�ect is
preferred when controlling for endogenity and therefore this paper will not
treat the GMM estimator.
Since it is likely that the error term is correlated within a �rm across time,
robust clustered standard errors are applied. An example of this is where
the development of the �rm in one year is likely to be correlated with the
development in the previous year. Since the study does not have any infor-
mation of �rms' import and export activity, omitted variable bias might be
captured in the estimates.
5 Regression results
This section presents the results, which is conducted by using the pooled
OLS, �xed e�ects and random e�ects methods. The measure of the city size
will be base the population of the 290 municipalities. The signi�cance of the
results will be determined by the coe�cients p-value. The result from the
15
Hausman-test will determine the structure of possible unobserved �rm spe-
ci�c e�ects, indicating the best suited estimation method. Throughout all
regressions the coe�cients of the random e�ect have been shown to be incon-
sistent, and the null hypothesis of the test is therefore rejected. Although the
�xed e�ect is preferred, the results from the random e�ect will be partially
illustrated in this section. The standard errors are clustered and robust as
an attempt to correct for heteroscdastisity and serial autocorrelation. All
regressions are estimated including time and industry dummies. The results
are valid under the condition that all �rms are located at the same place
within a municipality. It is also assumed that larger cities consist of more
diverse �rms.
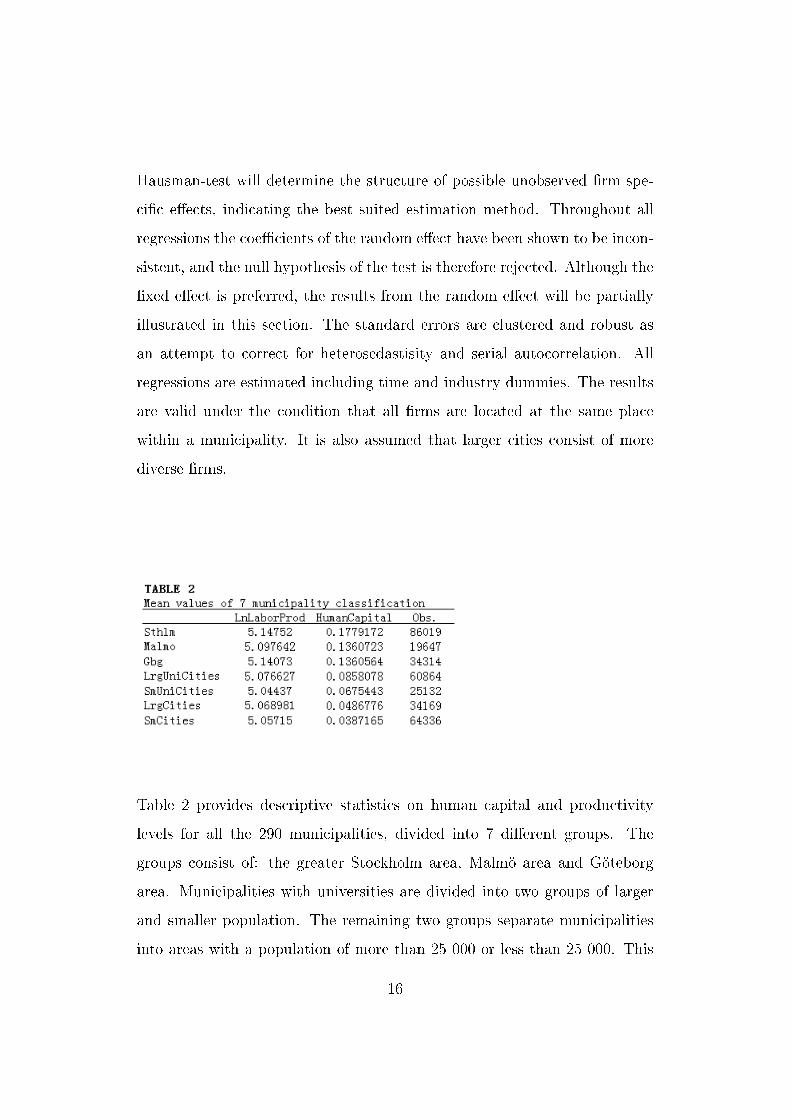
Table 2 provides descriptive statistics on human capital and productivity
levels for all the 290 municipalities, divided into 7 di�erent groups. The
groups consist of: the greater Stockholm area, Malmö area and Göteborg
area. Municipalities with universities are divided into two groups of larger
and smaller population. The remaining two groups separate municipalities
into areas with a population of more than 25 000 or less than 25 000. This
16
classi�cation is based on a de�nition from the year 2010 and thereby unable
municipalities to vary across groups. Yet, it provides the study with an al-
ternative measure of the city size. The table illustrates the mean value of
labor productivity and human capital, which indicates that the values might
increase with the city size. This alternative measure of municipality groups
will be used for estimation in table 7.
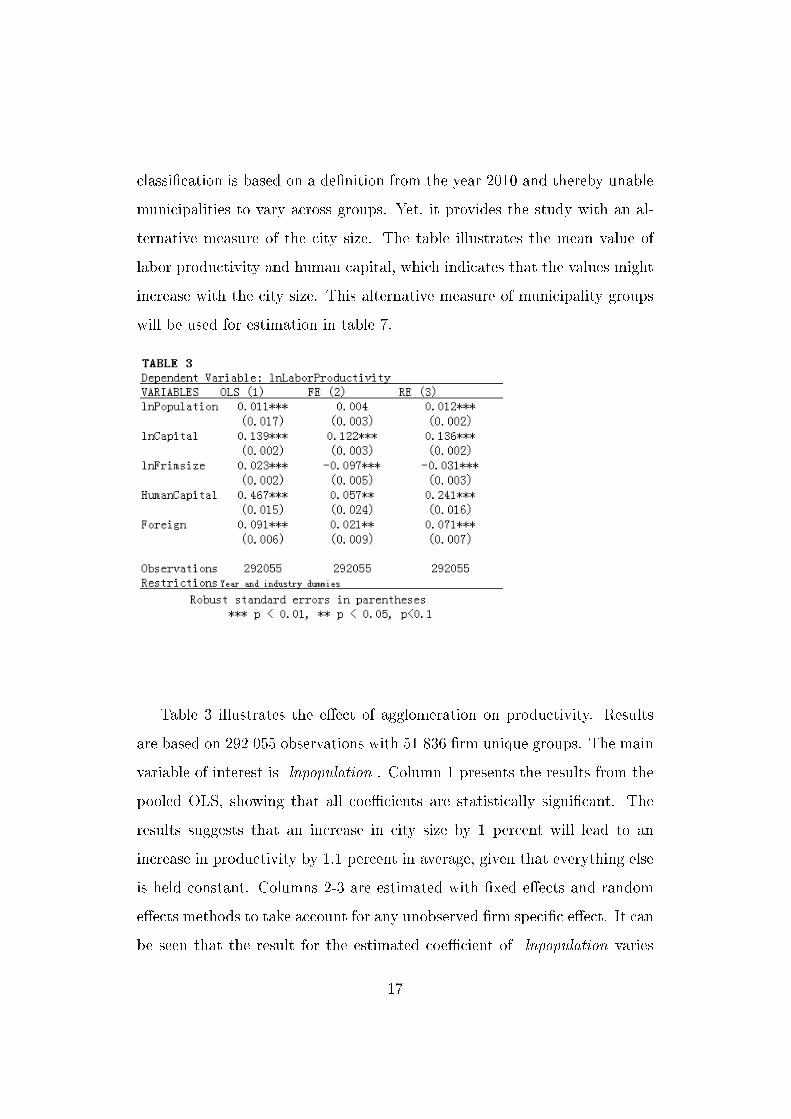
Table 3 illustrates the e�ect of agglomeration on productivity. Results
are based on 292 055 observations with 51 836 �rm unique groups. The main
variable of interest is lnpopulation . Column 1 presents the results from the
pooled OLS, showing that all coe�cients are statistically signi�cant. The
results suggests that an increase in city size by 1 percent will lead to an
increase in productivity by 1.1 percent in average, given that everything else
is held constant. Columns 2-3 are estimated with �xed e�ects and random
e�ects methods to take account for any unobserved �rm speci�c e�ect. It can
be seen that the result for the estimated coe�cient of lnpopulation varies
17
in these columns. The result from the �xed e�ects model shows a weaker
and insigni�cant e�ect of city size. Although an interpretation of this result
is not possible, it suggest a similar connection between city size and level of
productivity as shown in the pooled OLS results.
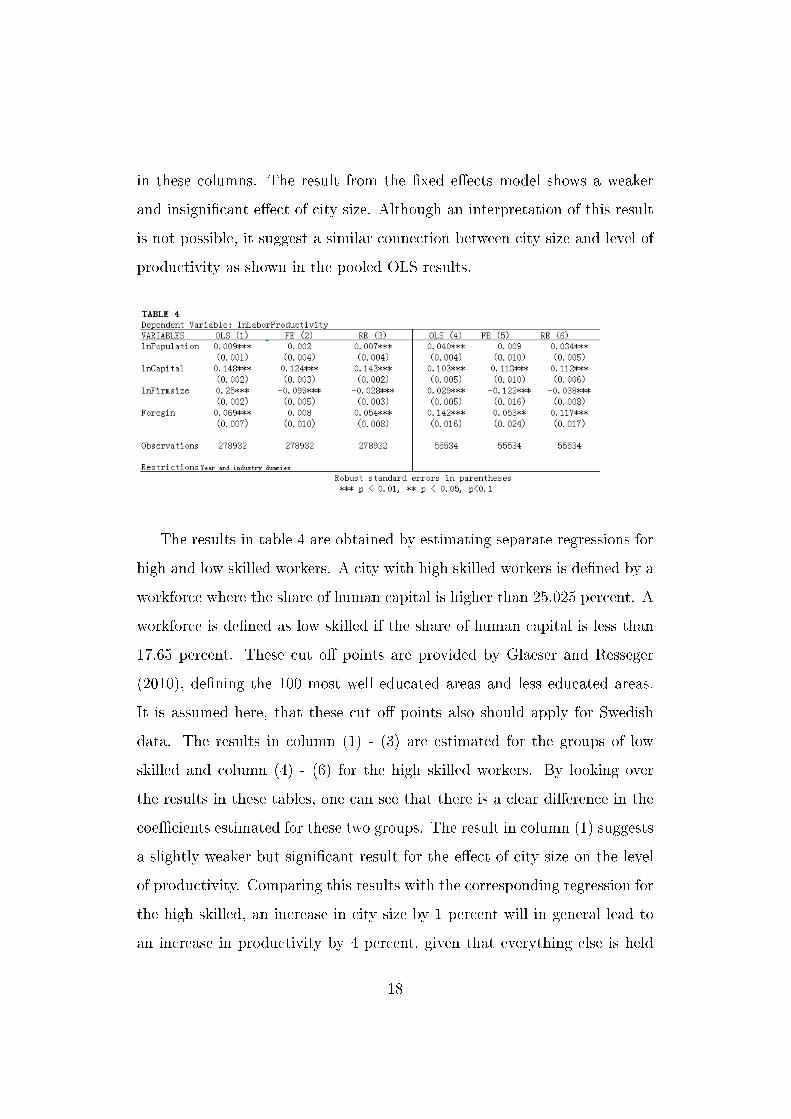
The results in table 4 are obtained by estimating separate regressions for
high and low skilled workers. A city with high skilled workers is de�ned by a
workforce where the share of human capital is higher than 25.025 percent. A
workforce is de�ned as low skilled if the share of human capital is less than
17.65 percent. These cut o� points are provided by Glaeser and Resseger
(2010), de�ning the 100 most well educated areas and less educated areas.
It is assumed here, that these cut o� points also should apply for Swedish
data. The results in column (1) - (3) are estimated for the groups of low
skilled and column (4) - (6) for the high skilled workers. By looking over
the results in these tables, one can see that there is a clear di�erence in the
coe�cients estimated for these two groups. The result in column (1) suggests
a slightly weaker but signi�cant result for the e�ect of city size on the level
of productivity. Comparing this results with the corresponding regression for
the high skilled, an increase in city size by 1 percent will in general lead to
an increase in productivity by 4 percent, given that everything else is held
18
constant. This indicates that the level of human capital is strongly generates
the e�ect that agglomeration has on productivity levels. An explanation for
this could be as the knowledge spillover theory suggests. When the workforce
contains of more educated people and are located near each other, the spread
of knowledge increase and their by leading to higher productivity. However,
the result estimated with the �xed e�ects method is not signi�cant. These
results do however not rule out that other factors may generate agglomera-
tion economies leading to higher productivity levels.
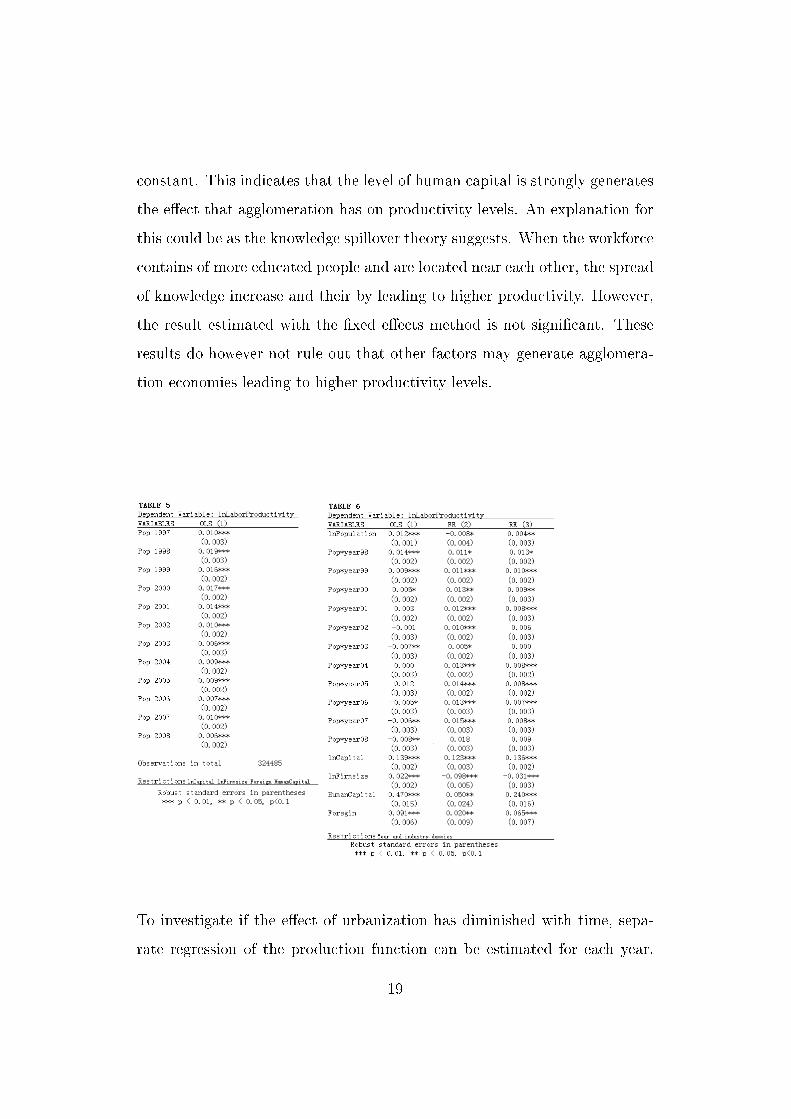
To investigate if the e�ect of urbanization has diminished with time, sepa-
rate regression of the production function can be estimated for each year.
19
The coe�cient of lnpopulation for each year will indicate the development
throughout the time period. In table 5, result from the coe�cient of inter-
est is provided, summarizing the development of the agglomeration e�ect.
The coe�cient has dropped from 0.010 in 1997 to 0.006 in 2008. This could
suggest that the e�ect of agglomeration is changing due to for example im-
provement in the IT sector, or this change is re�ecting something else. This
mentioned change can also be controlled for by estimating regression with
panel data. To control for the change, the city size variable is interacted with
year dummies. The results of each coe�cient will then show the importance
of city size given a certain year compared with the reference category. Table
5 shows the results from interacting year dummies with city size coe�cient.
From the statistically signi�cant coe�cients, the pooled OLS suggest that the
e�ect of city size is diminishing with time. This result could be generated
by advanced IT. This thesis is limited in that way that it could not ensure
that this drop is statistically signi�cant due to advanced IT. The results from
the �xed e�ects regression suggest the opposite relationship, implying that
it might be too early to estimate the e�ect IT might have on agglomeration
economies.
Table 7 shows the robustness of the e�ect of urbanization on productivity.
This is done by computing regressions with change in data sample and in the
model. Four di�erent methods are presented below. In this table, the results
from �xed e�ects regression and pooled OLS will only be demonstrated.
Firms can have more than one working places that might be located in
di�erent municipalities. This attribute is therefore account for in columns
(1) and (2) by performing regressions with �rms with only one working place.
20
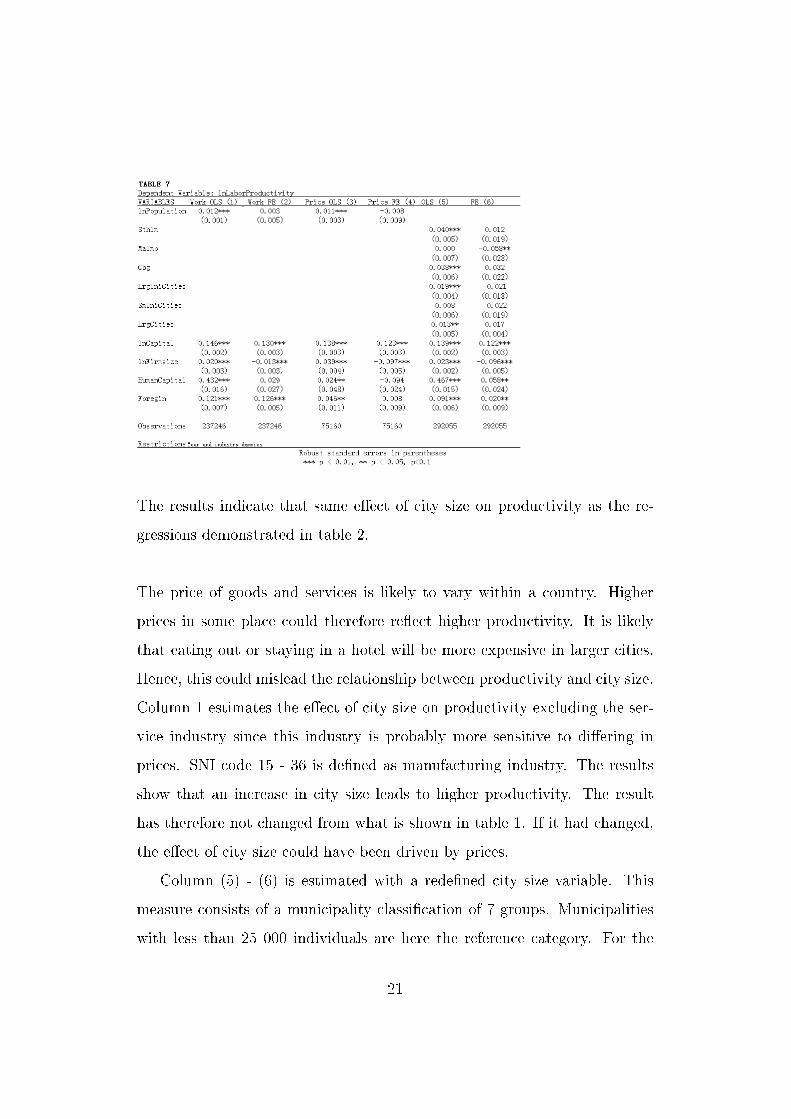
The results indicate that same e�ect of city size on productivity as the re-
gressions demonstrated in table 2.
The price of goods and services is likely to vary within a country. Higher
prices in some place could therefore re�ect higher productivity. It is likely
that eating out or staying in a hotel will be more expensive in larger cities.
Hence, this could mislead the relationship between productivity and city size.
Column 1 estimates the e�ect of city size on productivity excluding the ser-
vice industry since this industry is probably more sensitive to di�ering in
prices. SNI code 15 - 36 is de�ned as manufacturing industry. The results
show that an increase in city size leads to higher productivity. The result
has therefore not changed from what is shown in table 1. If it had changed,
the e�ect of city size could have been driven by prices.
Column (5) - (6) is estimated with a rede�ned city size variable. This
measure consists of a municipality classi�cation of 7 groups. Municipalities
with less than 25 000 individuals are here the reference category. For the
21
municipality groups with signi�cant coe�cients, it is possible to read that
�rms within large metropolitan areas are more productive compared with
�rms in less populated areas. Again, studying the results from �xed e�ects
regression in column (6), the dummy variable coe�cients indicates insigni�-
cant results. These results also favor the �xed e�ects estimates. Overall, the
�ndings from table 7 are in line with previous demonstrated results.
6 Concluding remarks
This thesis aimed to answer three questions. Does the city size have any
e�ect on �rm productivity? How has this e�ect changed over time and does
it di�er when controlling for areas with skilled and less skilled labor? The
questions were studied using mainly two di�erent estimation methods, Pooled
OLS and Fixed E�ect Method. Previous literature has stated that agglom-
eration seems to have a positive e�ect on productivity. The literature also
mentioned that an important generator is the level of human capital. This
thesis con�rmed that there is support for agglomeration e�ects in Sweden.
It also showed that it is highly generated by the level of human capital. In
order to capture the advantages of agglomeration - policy implications should
favor possibilities for �rms and individuals to mobilize more easily in, and
to, larger cities, through the expansion of the housing supply market and in-
frastructure. Stockholm is case of where these policies should apply in order
to increase the productivity, which leads to higher growth.
On the other hand, as the internet usage is heavily increased, it is changing
our way to interact, which may have a diminishing impact on the agglomer-
ation e�ect. In an attempt to estimate this e�ect, the Pooled OLS method
22

was used, which provided the study with some support for it. However, the
Fixed E�ect Method suggested the opposite. Yet, the era of the IT boom
has not reached its peak, implying that the full e�ect is still to be revealed.
The results were not as solid for the Fixed E�ect Method as it was for the
Pooled OLS. However, it would be interesting to investigate how the other
three underlying generators of agglomeration, namely intermediate inputs,
labor pooling and matching of workers and �rms are associated statistically
to agglomeration and if there is a prime generator. It would also be interest-
ing to further examine if the IT sector's e�ect will be clearer.
23
7 References
• Antonio Ciccone and Robert E. Hall (1996), Productivity and the Den-
sity of Economic Activity, The American Economic Review, , 86, 54-70.
• Arthur O' Sullivan (2009), Urban Economics, Seventh Edition, Mc-
Graw Hill.
• Damodar N. Gujarati (2003), Basic Econometrics, Fourth Edition, Mc-
Graw Hill.
• Edward L. Gleaser and Joshua D. Gottlieb (2009), The Wealth of Cities:
Agglomeration Economies and Spatial Equilibrium in the United States,
Journal of Economic Litterature, 47, 983-1028.
• Edward L. Gleaser and Matthew G. Resseger (2010), The complemen-
tarity between cities and skills, Journal of Regional Economics, 50, 221
- 224.
• Hans Söderström Et.al (2001), Sweden in the New Economic Geography
of Europe, SNS Economic Policy Group Report.
• Martin Andersson, Hans Lööf and Sara Johansson (2008), Productiv-
ity and International Trade: Firm level Evidence from a Small Open
Economy, Kiel Institute, DOI: 10.1007/s10290-008-0169-5.
• Martin Andersson and Hans Lööf (2009) , Agglomeration and produc-
tivity - Evidence from �rm-level data,
http://scripts.abe.kth.se/cesis/documents/WP170.pdf
• Mikael Stenkula and Yves Zenou (2011), Städer och entreprenörskap,
Ekonomisk Debatt, 39.
24
• Patrik Karpaty (2004), Are foreign owned-�rms more productive? Ev-
idence from Swedish �rm level data, ISSN 1403-0586.
• Stuart S. Rosenthal and William C. Strange (2003), Evidence on the
Nature and Sources of Agglomeration Economies.
http://www.econ.brown.edu/faculty/henderson/willandstuart.pdf
• Timothy F. Harris and Yannis M. Ioannides (2000), Productivity and
Metropolitan Density
http://ideas.repec.org/p/tuf/tuftec/0016.html
• Wendy Carlin and David Soskice (2006), Macroeconomics: Imerpfec-
tions Institutions and Policies, First Edition, Oxford University Press.
• Je�rey M. Wooldridge (2009), Introductory Econometrics: A Modern
Approch, Fourth Edition, South Western Cenage Learning.
• Statistics Sweden (2010), Företagens Ekonomi 2008,NV 19 SM 1002,
ISSN 1654-3548.
• LISA database
http://www.scb.se/Pages/List257742.aspx
25
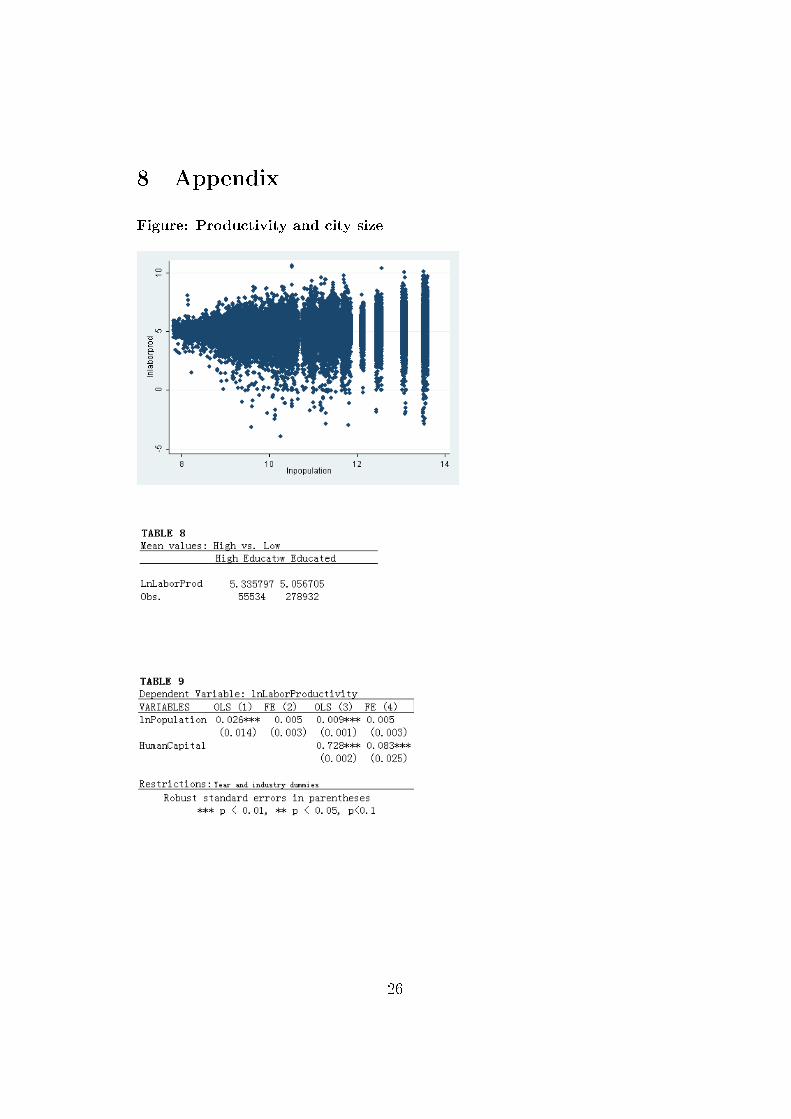
8 Appendix
Figure: Productivity and city size
26
27