Embed Size (px)
Citation preview
Estimating the Reliability of Composite Scores
Qingping He December 2009 Ofqual/10/4703
Estimating the Reliability of Composite Scores
Contents Summary 3
1. Introduction 3
2. Classical Test Theory 5
2.1 A General Composite Reliability Formula 6
2.2 The Wang and Stanley Composite Reliability Formula 7
2.3 The Generalized Spearman-Brown Formula 8
2.4 The Stratified Coefficient Alpha 8
2.5 The Standard Error of Measurement 10
2.6 Classical Test Theory Analyses of a Simulated Dataset 10
3. Generalizability Theory 13
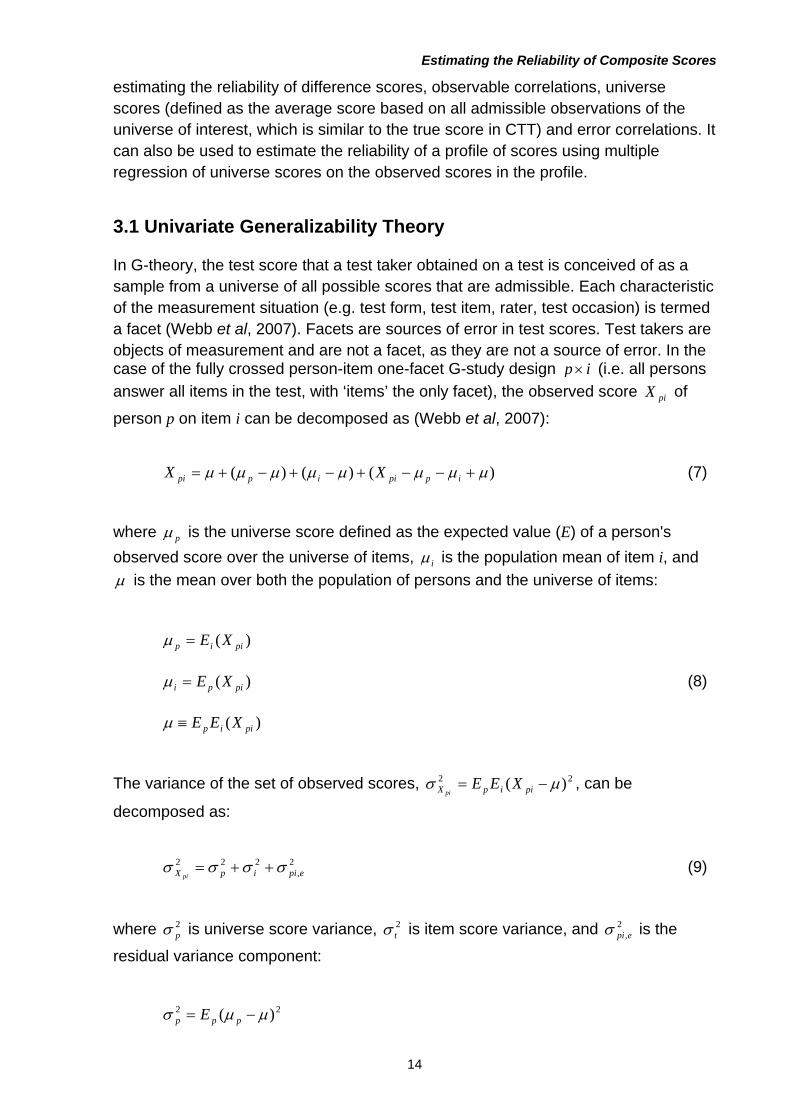
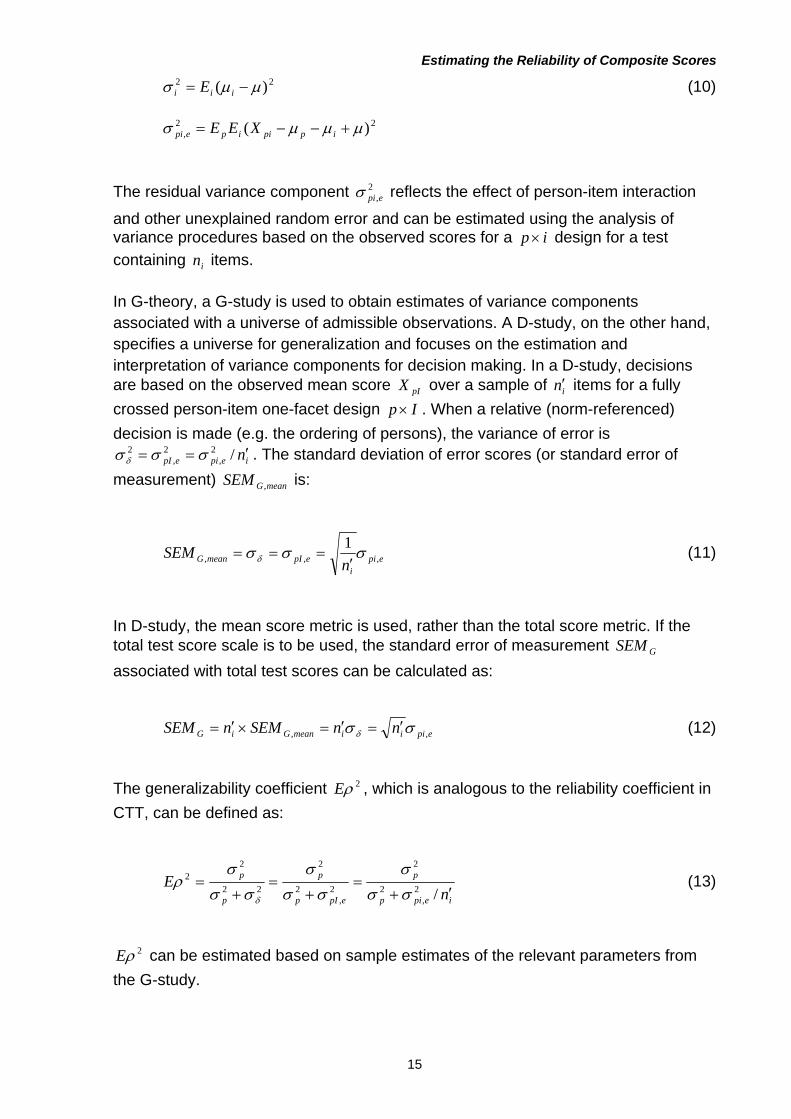
3.1 Univariate Generalizability Theory 14
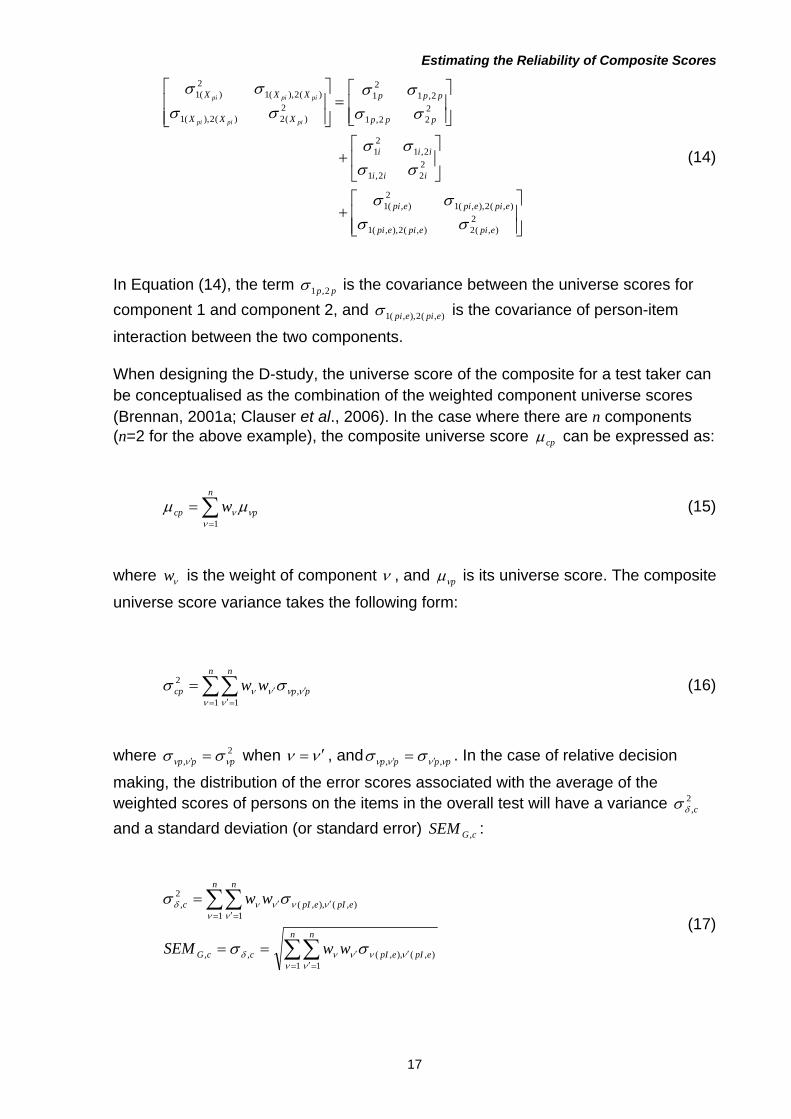
3.2 Multivariate Generalizability Theory 16
3.3 Generalizability Theory Analyses of the Simulated Dataset 19
4. Item Response Theory 21
4.1 Use of Unidimensional Item Response Theory Models 27
4.2 Use of Multidimensional Item Response Theory Models 27
4.3 Calculation of Composite Ability Measures, Standard Error and
Composite Reliability 28
4.4 Item Response Theory Analyses of the Simulated Dataset 29
5. Concluding Remarks 30
References 32
2
Estimating the Reliability of Composite Scores
Summary
The Office of Qualifications and Examinations Regulation (Ofqual) has initiated a research programme looking at the reliability of results from national tests, examinations and qualifications in England. The aim of the programme is to gather evidence to inform Ofqual on developing policy on reliability from a regulatory perspective, with a view to improving the quality of the assessment systems further. As part of the Ofqual reliability programme, this study, through a review of literature, attempts to: look at the different approaches that are employed to form composite scores from component or unit scores; investigate the implications of the use of the different approaches for the psychometric properties, particularly the reliability, of the composite scores; and identify procedures that are commonly used to estimate the reliability measure of composite scores. This report summarizes the procedures developed for classical test theory (CTT), generalizability theory (G-theory) and item response theory (IRT) that are widely used for studying the reliability of composite scores that are composed of weighted scores from component tests. The report is intended for use as a reference by researchers and test developers working in the field of educational measurement.
1. Introduction
In situations where multiple tests are administered, scores from individual tests are frequently combined to produce a composite score. For example, for many GCSE and GCE subjects tested in England, candidates are required to take a number of related components (or units) for certification at subject level, and scores/grades for individual components as well as an overall score/grade for the subject are produced, which generally involves assigning weights to individual components (see, for example, Cresswell, 1988; Gray and Shaw, 2009).
Rudner (2001) has identified two approaches involving assigning weights to component scores that are commonly deployed to combine scores from component tests: the implicit approach and the explicit approach. In the implicit approach, there are two ways to combine component scores: either simply add the raw scores from the components to obtain the composite score (which is equivalent to weighting components by their maximum scores); or use an IRT model to analyse responses from all components simultaneously to generate item and person measures. Rudner discussed the implications of adding raw component scores for the psychometric properties, including reliability and validity, of the composite score. He indicated that adding raw scores fails to recognise the differences in the relative importance of components and items in relation to the overall composite. In the case of using IRT modelling to combine component scores or IRT person ability measures, the items from all components can be calibrated simultaneously to estimate item characteristics and person ability measures on the composite ability scale. The implicit weights assigned to individual items and, therefore, to the components depend on the IRT
3
Estimating the Reliability of Composite Scores
model used. If the one-parameter logistic model (1PL) or the Rasch model are used, the result is equivalent to adding raw scores from the components (see, Lord, 1980). However, if a two-parameter logistic model (2PL) is used, the result will be equivalent to weighting the components by the discriminating power of the items. If the three-parameter logistic model (3PL) is used, the effect of weighting the components on the composite ability measure is influenced by both the item discrimination parameter and the guessing parameter (see Lord, 1980).
The explicit approach used to combine component scores generally involves assigning weights to individual items of components directly, and three explicit weighting methods are used. The first method is to weight components by the difficulty of the items. This method provides additional reward for mastering particularly difficult concepts. However, it also punishes test takers for missing more difficult items. The second method is to assign weights to component scores based on the reliability measures of the components. In this case, more weight can be given to components with higher reliability measures, and less weight to components with lower reliability measures. This way, the error associated with the composite score will be less than by simply combining raw component scores. It is also possible to produce composite scores with maximum reliability by appropriately assigning weights to different components. The third method is to weight the components by maximising the validity of the composite scores with respect to a pre-specified external criterion. In this case, multiple regression of the criterion on the composite scores (i.e. the linear combination of the component scores using weights) can also be used to derive composite scores that maximize the correlation between the external criterion and the composite scores.
As discussed by Rudner (2001), also see discussions by Govindarajulu (1988), Childs et al (2004), Feldt (2004), Rowe (2006), Bobko et al (2007), the way in which scores from individual components are combined raises a variety of methodological and policy issues, including the investigation and interpretation of the reliability and validity of the composite scores. For example, Gill and Bramley (2008) recently used a simulation study to investigate the effect of inter-marker reliability of unit scores on the grade classification consistency of aggregated scores for an A level subject. Although the effects of the reliability, or other psychometric properties of components on the reliability, and other properties of the composite scores have been extensively studied for a substantial range of assessments in many parts of the world, for example, see work by Rudner (2001), Govindarajulu (1988), Childs et al (2004), Feldt (2004), Rowe (2006), Bobko et al (2007), such studies have been relatively sparse here in England, particularly in the area of public tests and examinations such as national curriculum tests, and GCSE and A level examinations.
Three theories are commonly used to study the reliability of test and examination results: CTT, G-theory and IRT (see Lord, 1980; Cronbach et al, 1972, 1995; Shavelson and Webb, 1991; MacMillan, 2000; Brennan, 2001a; Bachman, 2004; Meadows and Billington, 2005; Kolen and Brennan, 2004; Webb et al, 2007). This study briefly reviews and summarizes the procedures developed for the three
4
Estimating the Reliability of Composite Scores
theories that are widely used to derive reliability measures for composite scores that are obtained by combining weighted component scores. A simulated dataset is used to illustrate the various procedures and to compare their results.
2. Classical Test Theory
In CTT, or true score theory, the observed score of an examinee on a test is composed of a true score, which reflects the test taker's true ability in the construct being measured, and an error score, which reflects the contribution from factors other than his/her true ability. In CTT, the reliability of test scores is defined as the proportion of observed score variance that is true score variance. Feldt and Brennan (1989), Wiliam (2000), Meadows and Billington (2005), Bachman (2004) and Johnson and Johnson (2009) discuss the various sources of measurement error and the different approaches that are used to derive reliability estimates, including internal consistency reliability estimates, the stability (test-retest) reliability estimates, the equivalence (parallel forms) reliability estimates and the rater consistency reliability estimates. They also discuss ways for improving reliability. Since the reliability estimates provide information on a specific set of test scores and cannot be used directly to interpret the effect of measurement on test scores for individual test takers (Bachman and Palmer, 1996; Bachman, 2004) the standard error of measurement, which is defined as the standard deviation of the error scores, is introduced for this purpose (Harvill, 1991; Wiliam, 2000; Bachman, 2004; Meadows and Billington, 2005; Webb et al, 2007). The standard error of measurement can be used to calculate confidence intervals for observed scores or true scores. It can also be used to compare scores from individual test takers on the same test. Bachman (2004) discusses the implications of the different reliability estimates in terms of the sources of measurement error that are accounted for. The CTT approach is to identify the sources of error that are of concern to a specific test, and the appropriate reliability estimates are used to address these sources.
Substantial research has been undertaken to study the reliability of composite scores using CTT (see Wang and Stanley, 1970; Feldt and Brennan, 1989; Rudner, 2001; Webb et al, 2007). Feldt and Brennan (1989) discuss the various procedures and mathematical formulations that can be used to estimate the reliability of composite scores. These include the generalized Spearman-Brown formula for unit-weighted composite scores, the reliability for battery composites, the stratified coefficient alpha for tests containing groups of homogeneous items, the reliability of difference scores, and the reliability of predicted scores and factor scores. Wang and Stanley (1970) developed a formula for calculating the reliability of composite scores that are composed of component scores with explicit weights. Some of the most widely used procedures used to estimate the reliability of composite scores are briefly explained below. In view of the nature of the examinations currently used by the UK qualifications system, these procedures would prove to be particularly useful for studying the overall qualification level reliability. Johnson and Johnson (2009) provide
5
Estimating the Reliability of Composite Scores
a comprehensive review of the nature of the examinations that feature in the UK assessment system.
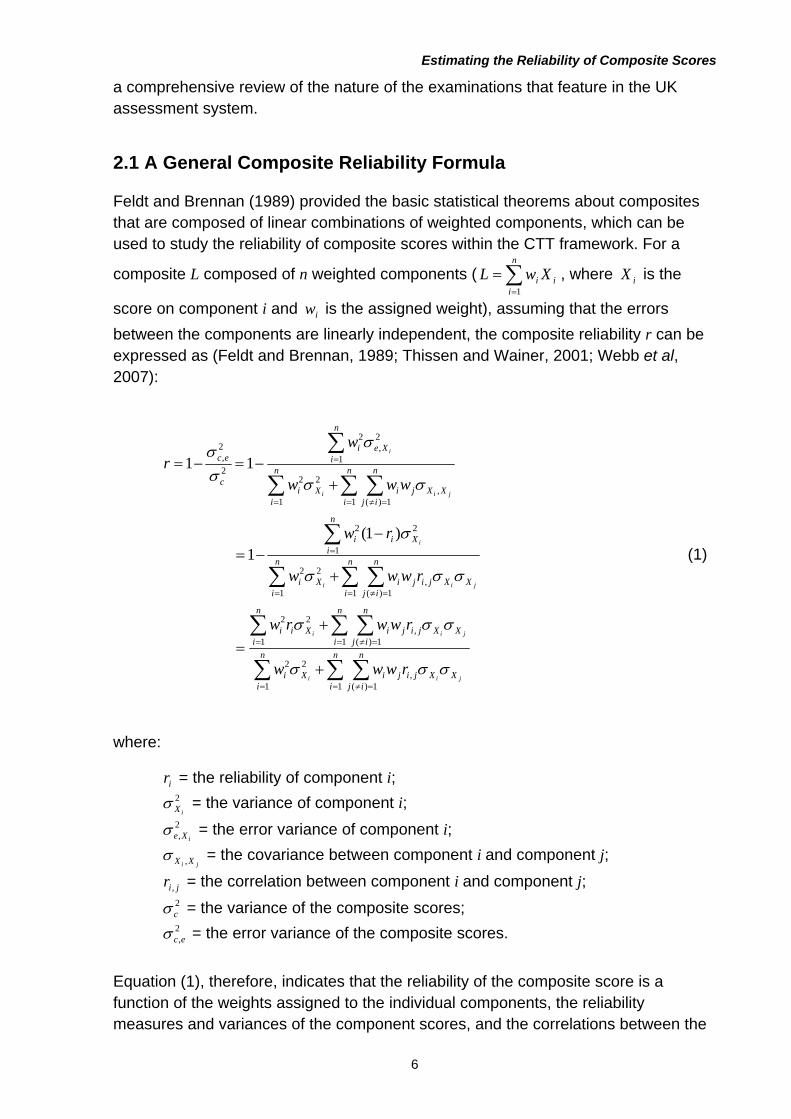
2.1 A General Composite Reliability Formula
Feldt and Brennan (1989) provided the basic statistical theorems about composites that are composed of linear combinations of weighted components, which can be used to study the reliability of composite scores within the CTT framework. For a
composite L composed of n weighted components ( , where is the
score on component i and is the assigned weight), assuming that the errors
between the components are linearly independent, the composite reliability r can be expressed as (Feldt and Brennan, 1989; Thissen and Wainer, 2001; Webb et al, 2007):
n
iii XwL
1iX
iw
n
i
n
ijXXjijiX
n
ii
n
i
n
i
n
ijXXjijiXii
n
i
n
ijXXjijiX
n
ii
n
iXii
n
i
n
ijXXjiX
n
ii
n
iXei
c
ec
jii
jii
jii
i
jii
i
rwww
rwwrw
rwww
rw
www
wr
1 1)(,
2
1
2
1 1 1)(,
22
1 1)(,
2
1
2
1
22
1 1)(,
2
1
2
1
2,
2
2
2,
)1(1
11
(1)
where:
= the reliability of component i; ir
= the variance of component i; 2
iX
= the error variance of component i; 2, iXe
ji XX , = the covariance between component i and component j;
= the correlation between component i and component j; jir ,
= the variance of the composite scores; 2c
= the error variance of the composite scores. 2,ec
Equation (1), therefore, indicates that the reliability of the composite score is a function of the weights assigned to the individual components, the reliability measures and variances of the component scores, and the correlations between the
6
Estimating the Reliability of Composite Scores
component scores. Mathematical manipulation of Equation (1) can be carried out by altering the weights assigned to individual components, to optimise the reliability of the composite score. When an external criterion is pre-specified, the composite L can also be correlated to the criterion and the correlation can be maximised to obtain optimum weights. Procedures involved in using Equation (1) for calculating the reliability of composite scores include:
Estimating the reliability of individual components; Calculating the variance of individual components; Calculating the correlation coefficients between components; Assigning weights to individual components to form the composite; Using Equation (1) to calculate the reliability of the composite score, and, if
required, manipulating Equation (1) to optimise the reliability of the composite score to determine the weights for individual components;
Calculating the standard error of measurement of the composite score.
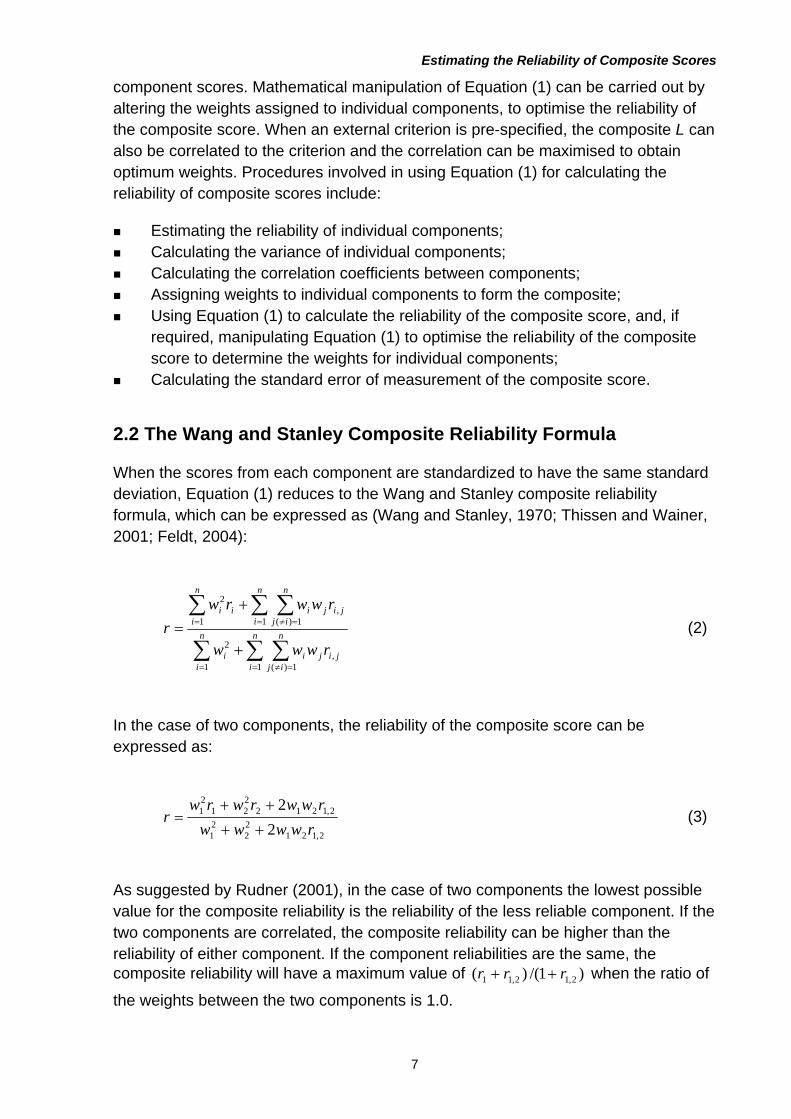
2.2 The Wang and Stanley Composite Reliability Formula
When the scores from each component are standardized to have the same standard deviation, Equation (1) reduces to the Wang and Stanley composite reliability formula, which can be expressed as (Wang and Stanley, 1970; Thissen and Wainer, 2001; Feldt, 2004):
n
i
n
i
n
ijjijii
n
i
n
i
n
ijjijiii
rwww
rwwrw
r
1 1 1)(,
2
1 1 1)(,
2
(2)
In the case of two components, the reliability of the composite score can be expressed as:
2,121
22
21
2,1212221
21
2
2
rwwww
rwwrwrwr
(3)
As suggested by Rudner (2001), in the case of two components the lowest possible value for the composite reliability is the reliability of the less reliable component. If the two components are correlated, the composite reliability can be higher than the reliability of either component. If the component reliabilities are the same, the composite reliability will have a maximum value of )1/()( 2,12,11 rrr when the ratio of
the weights between the two components is 1.0.
7
Estimating the Reliability of Composite Scores
Rudner (2001) used Equation (3) to study the effect of component weights on the reliability and validity of a composite composed of two components. Both the composite reliability and validity are functions of the component weights. His study suggested that the lowest possible value for the composite validity (defined as the correlation between the composite score and an external criterion variable) is the validity of the less valid component. The composite validity can be higher than the validity of either component. When the component validities and weights are the same, the composite has maximum validity. He also showed that if the two components are not highly correlated, composite validity can increase when composite reliability decreases. This is in contrast to the traditional view that the square root of the reliability places an upper limit on validity. It should be noted, however, that Rudner was concerned here with composite score validity as predictive validity.
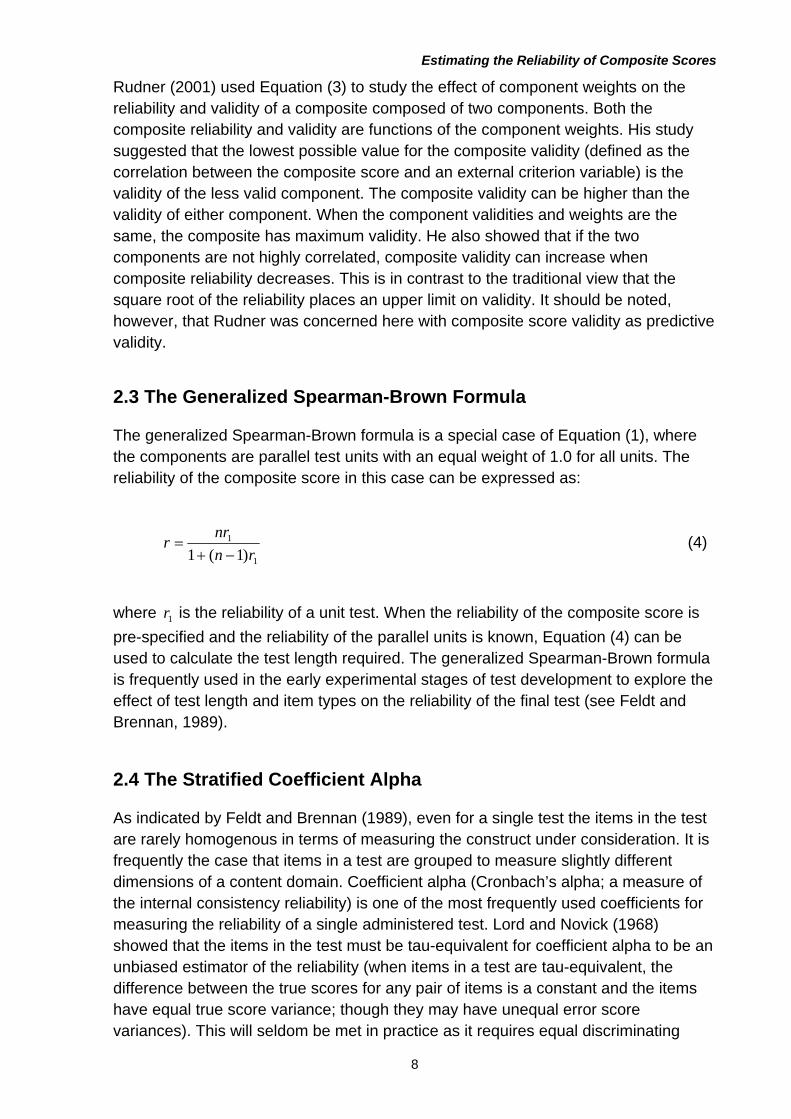
2.3 The Generalized Spearman-Brown Formula
The generalized Spearman-Brown formula is a special case of Equation (1), where the components are parallel test units with an equal weight of 1.0 for all units. The reliability of the composite score in this case can be expressed as:
1
1
)1(1 rn
nrr
(4)
where is the reliability of a unit test. When the reliability of the composite score is
pre-specified and the reliability of the parallel units is known, Equation (4) can be used to calculate the test length required. The generalized Spearman-Brown formula is frequently used in the early experimental stages of test development to explore the effect of test length and item types on the reliability of the final test (see Feldt and Brennan, 1989).
1r
2.4 The Stratified Coefficient Alpha
As indicated by Feldt and Brennan (1989), even for a single test the items in the test are rarely homogenous in terms of measuring the construct under consideration. It is frequently the case that items in a test are grouped to measure slightly different dimensions of a content domain. Coefficient alpha (Cronbach’s alpha; a measure of the internal consistency reliability) is one of the most frequently used coefficients for measuring the reliability of a single administered test. Lord and Novick (1968) showed that the items in the test must be tau-equivalent for coefficient alpha to be an unbiased estimator of the reliability (when items in a test are tau-equivalent, the difference between the true scores for any pair of items is a constant and the items have equal true score variance; though they may have unequal error score variances). This will seldom be met in practice as it requires equal discriminating
8
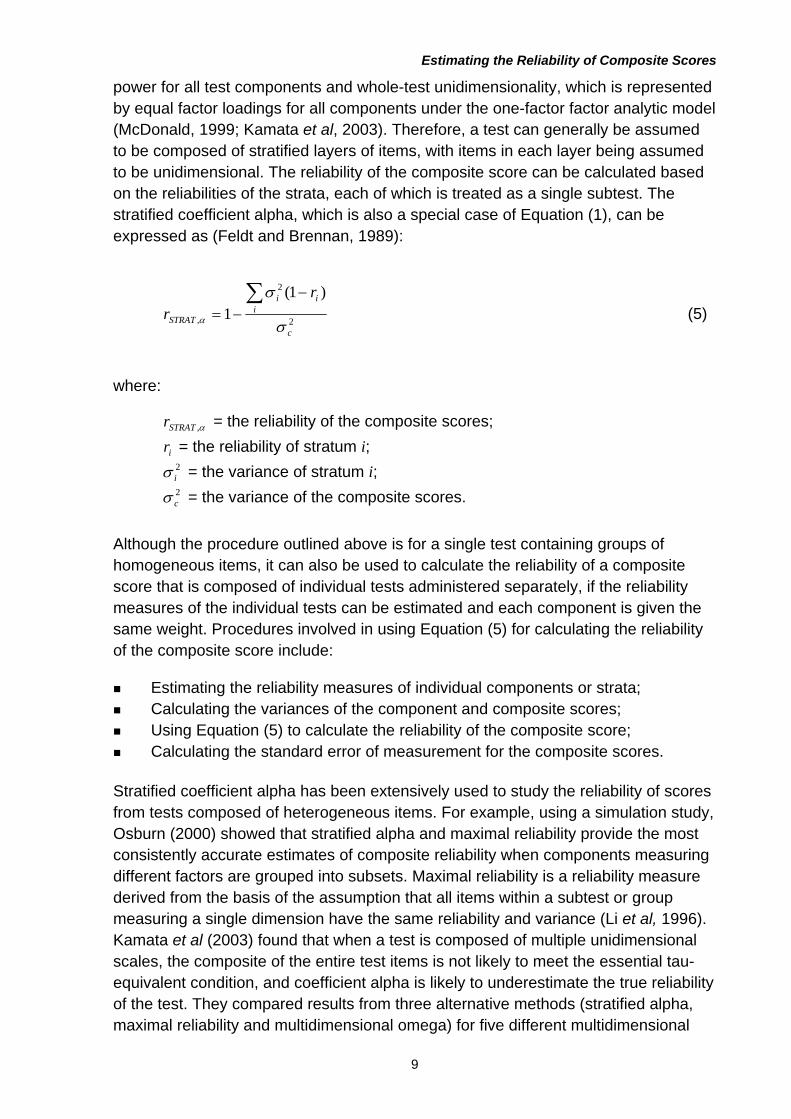
Estimating the Reliability of Composite Scores
power for all test components and whole-test unidimensionality, which is represented by equal factor loadings for all components under the one-factor factor analytic model (McDonald, 1999; Kamata et al, 2003). Therefore, a test can generally be assumed to be composed of stratified layers of items, with items in each layer being assumed to be unidimensional. The reliability of the composite score can be calculated based on the reliabilities of the strata, each of which is treated as a single subtest. The stratified coefficient alpha, which is also a special case of Equation (1), can be expressed as (Feldt and Brennan, 1989):
2
2
,
)1(1
c
iii
STRAT
rr
(5)
where:
= the reliability of the composite scores; ,STRATr
= the reliability of stratum i; ir
= the variance of stratum i; 2i
= the variance of the composite scores. 2c
Although the procedure outlined above is for a single test containing groups of homogeneous items, it can also be used to calculate the reliability of a composite score that is composed of individual tests administered separately, if the reliability measures of the individual tests can be estimated and each component is given the same weight. Procedures involved in using Equation (5) for calculating the reliability of the composite score include:
Estimating the reliability measures of individual components or strata; Calculating the variances of the component and composite scores; Using Equation (5) to calculate the reliability of the composite score; Calculating the standard error of measurement for the composite scores. Stratified coefficient alpha has been extensively used to study the reliability of scores from tests composed of heterogeneous items. For example, using a simulation study, Osburn (2000) showed that stratified alpha and maximal reliability provide the most consistently accurate estimates of composite reliability when components measuring different factors are grouped into subsets. Maximal reliability is a reliability measure derived from the basis of the assumption that all items within a subtest or group measuring a single dimension have the same reliability and variance (Li et al, 1996). Kamata et al (2003) found that when a test is composed of multiple unidimensional scales, the composite of the entire test items is not likely to meet the essential tau-equivalent condition, and coefficient alpha is likely to underestimate the true reliability of the test. They compared results from three alternative methods (stratified alpha, maximal reliability and multidimensional omega) for five different multidimensional
9
Estimating the Reliability of Composite Scores
factor-structure conditions. Multidimensional omega is a reliability measure derived from the basis of application of a one-factor factor analytic model to model observed scores (McDonald, 1999). Their results indicated that the three methods estimated the true reliability much better than coefficient alpha for all conditions. Their results also suggested that stratified alpha generally performed better than the other methods. Ray (2007) examined the relationship between stratified alpha and the reliability of a test composed of interrelated non-homogeneous items. The study demonstrated that when errors of measurement were positively correlated and the strata were tau-equivalent, stratified alpha would overestimate the true reliability. Kreiter et al (2004) and Kreiter and Bergus (2007) studied the psychometric characteristics of the composite score of two clinical performance assessments. Their results showed that the two assessments were statistically significantly correlated. They investigated how the reliability of the composite score was affected by the ratio of the weights assigned to the two assessments. Based on the results obtained, and taking into consideration logical validity and practicalities such as testing times, they suggested ways to combine component scores for course grading.
2.5 The Standard Error of Measurement
The standard error of measurement of the composite score for all of the
above cases can be calculated using the following equation:
cCTTSEM ,
ccCTTcCTT rSEM ,, 1 (6)
where is the reliability of the composite calculated using one of the methods
discussed above, and cCTTr ,
c is the standard deviation of the composite scores.
2.6 Classical Test Theory Analyses of a Simulated Dataset
To illustrate how the different procedures outlined above can be used to calculate the reliability of composite scores and to compare their results, item response patterns on two tests for 2,000 persons were generated using the WinGen2 IRT simulation software, which implements the Partial Credit Model (PCM) developed by Masters (1982) and can be accessed at www.umass.edu/remp/software/wingen. The ability of the population was assumed to be normally distributed with a mean of 0.0 logits and a standard deviation of 1.0 logits for the first test (Test 1). Logits is the unit used for person ability and item difficulty measures in IRT modelling (Wright and Stone, 1979). Test 1 contained 40 dichotomous items with a uniform difficulty distribution (with values of difficulty ranging from –3.50 to +3.50 logits and a mean of 0.0 logits). Test 2 contained 30 items, each carrying a maximum of two marks, also with values of difficulty ranging from –3.50 to +3.50 logits and a mean of 0.0 logits. To make Test 2 measure a slightly different ability dimension from that measured by Test 1, a small
10
Estimating the Reliability of Composite Scores
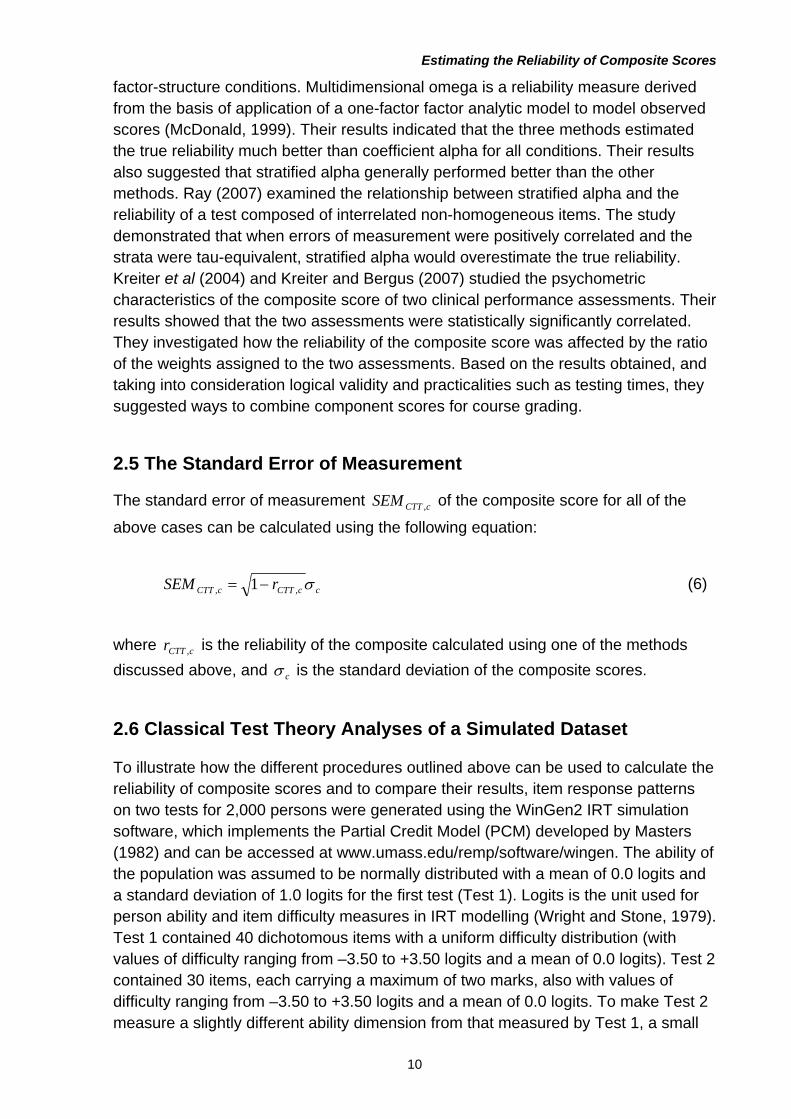
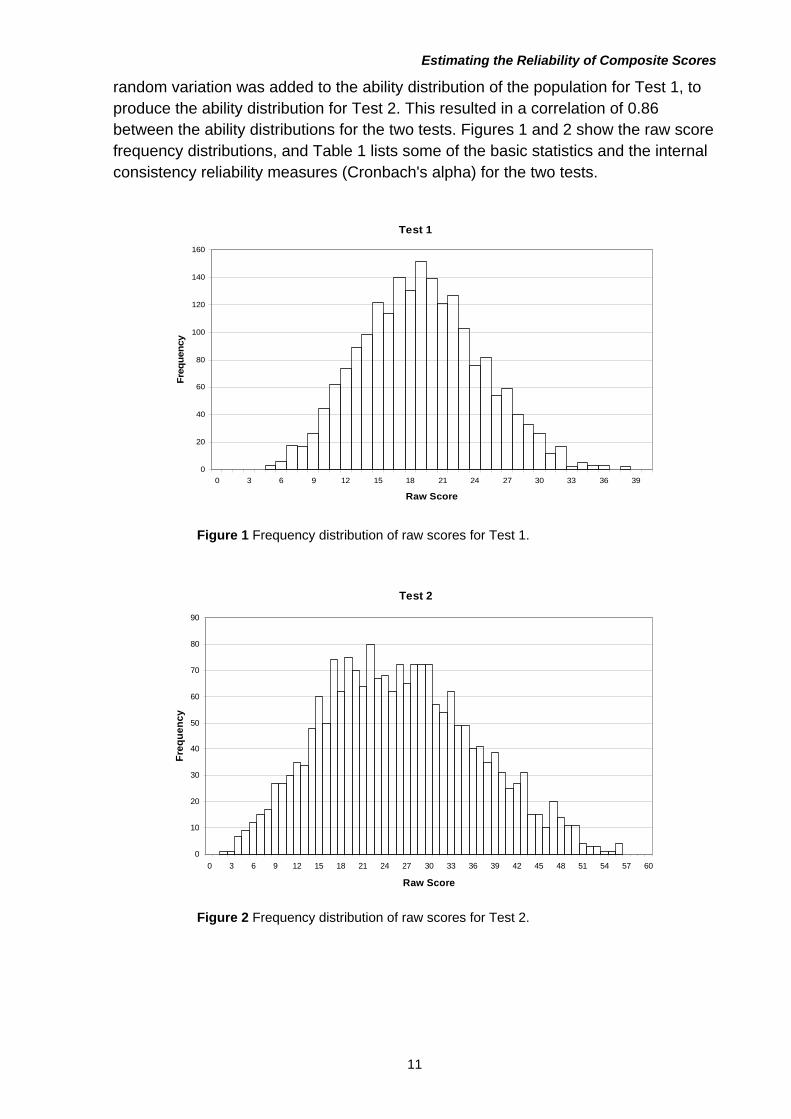
random variation was added to the ability distribution of the population for Test 1, to produce the ability distribution for Test 2. This resulted in a correlation of 0.86 between the ability distributions for the two tests. Figures 1 and 2 show the raw score frequency distributions, and Table 1 lists some of the basic statistics and the internal consistency reliability measures (Cronbach's alpha) for the two tests.
Test 1
0
20
40
60
80
100
120
140
160
0 3 6 9 12 15 18 21 24 27 30 33 36 39
Raw Score
Fre
qu
en
cy
Figure 1 Frequency distribution of raw scores for Test 1. Test 2
0
10
20
30
40
50
60
70
80
90
0 3 6 9 12 15 18 21 24 27 30 33 36 39 42 45 48 51 54 57 60
Raw Score
Fre
qu
en
cy
Figure 2 Frequency distribution of raw scores for Test 2.
11
Estimating the Reliability of Composite Scores
Table 1 Basic statistics of Test 1 and Test 2.
Test 1 Test 2
Number of items 40 30
Full mark 40 60
Mean score 19.00 26.10
Standard deviation ( i ) 5.58 10.40
Cronbach's alpha ( ) ir 0.83 0.91
Correlation between test scores ( ) 2,1r 0.77
Number of components ( ) n 2
Table 2 lists the various reliability coefficients for the composite scores of the two tests, calculated using the procedures discussed previously and the statistics presented in Table 1. Values of Cronbach’s alpha were used as the reliability measures for the two tests. The generalized Spearman-Brown coefficient was not calculated, as the two tests are not parallel. In the case of the general composite reliability formula, as shown in Equation (1), and the Wang and Stanley formula, the composite reliability was calculated for a series of weights assigned to the two tests. Since the two tests are highly correlated, the reliability of the composite can be higher than the reliability of the individual tests. When the weights for the two tests are the same (equal weights), the composite reliability measures estimated using the general composite reliability formula and the Wang and Stanley formula are the same as that estimated using the stratified coefficient alpha. This is expected, as the stratified coefficient alpha implies a weight ratio of 1.0 for the two tests. When the raw scores from the two tests are added together (equal weights for the two tests), Cronbach’s alpha for the combined scores was estimated to be 0.93, which is the same as the composite reliability measures estimated using the stratified coefficient alpha, the general composite reliability formula and the Wang and Stanley formula.
Table 2 Values of the various reliability coefficients for the composite scores of the two tests.
Reliability coefficient Stratified coefficient alpha
1w 2w General formula Wang and Stanley formula
0.10 0.90 0.92 0.92
0.25 0.75 0.92 0.93
0.50 0.50 0.93 0.93
0.75 0.25 0.90 0.89
0.90 0.10 0.87 0.86
0.93
As can be seen from the above analysis, the reliability measures estimated using the different coefficients are similar for the simulated dataset. When individual
12
Estimating the Reliability of Composite Scores
components are unidimensional, the methods outlined above will produce similar reliability measures. However, if individual components measure multidimensional constructs, then the reliability measures for each component may be estimated using the stratified coefficient alpha, which can then be used to estimate the reliability measure of the composite score using one of the above procedures. The generalized Spearman-Brown formula is particularly useful in the early experimental stages of test development to explore the effect of test length and item types on the reliability of the final test. The general composite reliability formula and the Wang and Stanley formula are useful for studying the effect of component weighting on the reliability of composite scores.
3. Generalizability Theory
As indicated by Feldt and Brennan (1989), Bachman (2004) and Webb et al (2007), there are important limitations in using CTT to estimate reliability. In particular, in CTT a specific reliability estimate for a test only addresses one source of measurement error and, therefore, cannot be used to assess the effects of multiple sources. CTT also treats error as random and cannot be used to distinguish systematic measurement error from random measurement error. Further, the reliability estimates and the standard error of measurement are assumed to be the same for all test scores. In real situations, the assumptions of CTT are rarely met.
G-theory has been developed to address some of the problems encountered in CTT (Cronbach et al, 1972, 1995; Feldt and Brennan, 1989; Brennan, 2001a; Bachman, 2004; Webb et al, 2007; Johnson and Johnson, 2009). G-theory is a measurement model that can be used to study the relative effects of multiple sources of measurement error on test scores. An important feature of G-theory is that the relative contributions from individual sources of measurement error to the overall error variance can be investigated, including the interaction between the sources. An important application of G-theory is that the model can be used to design a test suitable for a specific purpose with minimum measurement error, through a Decision-study (D-study). As indicated by Bachman (2004), CTT approaches to estimating reliability can be treated as special cases of G-theory. Further, G-theory extends CTT in other ways.
Univariate G-theory can be used to conduct simultaneous analysis of multiple sources of error variance and score dependability for a single test (score dependability or generalizability refers to the extent to which scores on a given measure would be replicated under other equivalent measurement conditions). Multivariate G-theory has been developed to address the reliability of measurements and other psychometric properties of assessments, where multiple scores representing performance on different constructs are used to produce a composite score (Shavelson and Webb, 1981; Brennan, 2001a; Webb et al, 2007). Multivariate G-theory decomposes both observed variance and covariance into components. Webb et al (2007) have suggested various applications of G-theory, including
13
Estimating the Reliability of Composite Scores
estimating the reliability of difference scores, observable correlations, universe scores (defined as the average score based on all admissible observations of the universe of interest, which is similar to the true score in CTT) and error correlations. It can also be used to estimate the reliability of a profile of scores using multiple regression of universe scores on the observed scores in the profile.
3.1 Univariate Generalizability Theory
In G-theory, the test score that a test taker obtained on a test is conceived of as a sample from a universe of all possible scores that are admissible. Each characteristic of the measurement situation (e.g. test form, test item, rater, test occasion) is termed a facet (Webb et al, 2007). Facets are sources of error in test scores. Test takers are objects of measurement and are not a facet, as they are not a source of error. In the case of the fully crossed person-item one-facet G-study design ip (i.e. all persons
answer all items in the test, with ‘items’ the only facet), the observed score of
person p on item i can be decomposed as (Webb et al, 2007):
piX
)()()( ippiippi XX (7)
where p is the universe score defined as the expected value (E) of a person's
observed score over the universe of items, i is the population mean of item i, and
is the mean over both the population of persons and the universe of items:
)( piip XE
)( pipi XE (8)
)( piip XEE
The variance of the set of observed scores, , can be
decomposed as:
22 )( piipX XEEpi
(9) 2
,222
epiipX pi
where is universe score variance, is item score variance, and is the
residual variance component:
2p 2
t 2,epi
22 )( ppp E
14
Estimating the Reliability of Composite Scores
(10) 22 )( iii E
22, )( ippiipepi XEE
The residual variance component reflects the effect of person-item interaction
and other unexplained random error and can be estimated using the analysis of variance procedures based on the observed scores for a
2,epi
ip design for a test
containing items. in
In G-theory, a G-study is used to obtain estimates of variance components associated with a universe of admissible observations. A D-study, on the other hand, specifies a universe for generalization and focuses on the estimation and interpretation of variance components for decision making. In a D-study, decisions are based on the observed mean score over a sample of items for a fully
crossed person-item one-facet design pIX
Ipin
. When a relative (norm-referenced)
decision is made (e.g. the ordering of persons), the variance of error is . The standard deviation of error scores (or standard error of
measurement) is: iepiepI n /2
,2
,2
SEM meanG ,
epii
epImeanG nSEM ,,,
1 (11)
In D-study, the mean score metric is used, rather than the total score metric. If the total test score scale is to be used, the standard error of measurement
associated with total test scores can be calculated as: GSEM
epiiimeanGiG nnSEMnSEM ,, (12)
The generalizability coefficient , which is analogous to the reliability coefficient in
CTT, can be defined as:
2E
iepip
p
epIp
p
p
p
nE
/2,
2
2
2,
2
2
22
22
(13)
2E can be estimated based on sample estimates of the relevant parameters from
the G-study.
15
Estimating the Reliability of Composite Scores
Brennan (2001a) and Webb et al (2007) have provided detailed mathematical derivations for estimating the generalizability coefficient of tests involving multiple sources of error. Recently, Johnson and Johnson (2009) have explored the potential for using G-theory to study the reliability of assessment results and the contribution to measurement errors from various sources, including item-related, marker-related and other sources, in the context of the examinations commonly used by the UK general qualification systems. They have also discussed how the absolute standard error of measurement or absolute generalizability coefficients provided by G-theory could be used to investigate the reliability of competence-based assessments such as those used by the UK vocational and occupational qualifications. Given unavoidable operational and financial constraints, a realistic G-theory study design would need to take into consideration the number of major facets to be investigated and the size of the dataset needed to produce stable estimates for component variances.
Procedures for using univariate generalizability analysis to estimate the generalizability of the composite include:
Assigning weights to components (if weights are 1.0, then all test components are equally weighted);
Analysing all weighted (or unweighted) components together using G-theory analysis software;
The generalizability coefficient thus produced will be for the composite.
Brennan (2001a) and Webb et al (2007) have discussed the various approaches that can be used for estimating the reliability of composite scores involving multiple facets.
3.2 Multivariate Generalizability Theory
While univariate G-theory can be used to estimate variance components and score dependability for the overall test, multivariate G-theory can be used to investigate universe score correlations among test components (or component tests) and the conditions of their combination to produce maximum reliability for the composite score (Brennan, 2001a; Lee, 2006; Webb et al, 2007). Information about the correlation between test components is important to verify the suitability of combining test components to form a composite (Lee, 2006).
To extend the univariate one-facet G-study design ip to multivariate G-study for a
test containing two components (or subtests), the observed score of a person on an item in the two components can be denoted as and , and the variances
and covariance of the observed scores across the population and the universe of items can be decomposed as (Brennan, 2001a; Webb et al., 2007):
)piX(1 )(2 piX
16
Estimating the Reliability of Composite Scores
(14)
2),(2),(2),,(1
),(2),,(12
),(1
222,1
2,121
222,1
2,121
2)(2)(2),(1
)(2),(12
)(1
epiepiepi
epiepiepi
iii
iii
ppp
ppp
XXX
XXX
pipipi
pipipi
In Equation (14), the term pp 2,1 is the covariance between the universe scores for
component 1 and component 2, and ),(2),,(1 epiepi is the covariance of person-item
interaction between the two components.
When designing the D-study, the universe score of the composite for a test taker can be conceptualised as the combination of the weighted component universe scores (Brennan, 2001a; Clauser et al., 2006). In the case where there are n components (n=2 for the above example), the composite universe score cp can be expressed as:
(15)
n
pcp w1
where is the weight of component w , and p is its universe score. The composite
universe score variance takes the following form:
(16)
n n
ppcp ww1 1
,2
where when 2
, ppp , and pppp ,, . In the case of relative decision
making, the distribution of the error scores associated with the average of the weighted scores of persons on the items in the overall test will have a variance
and a standard deviation (or standard error) :
2,c
cG ,SEM
n n
epIepIccG
n n
epIepIc
wwSEM
ww
1 1),(),,(,,
1 1),(),,(
2,
(17)
17
Estimating the Reliability of Composite Scores
where when 2),(),(),,( epIepIepI , and ),(),,(),(),,( epIepIepIepI . The
composite generalizability coefficient is defined as (Brennan, 2001a; Lee, 2005, 2006; Clauser et al, 2006):
n n
epIepIpp
n n
pp
ccp
cp
ww
wwE
1 1),(),,(,
1 1,
2,
2
22
][
(18)
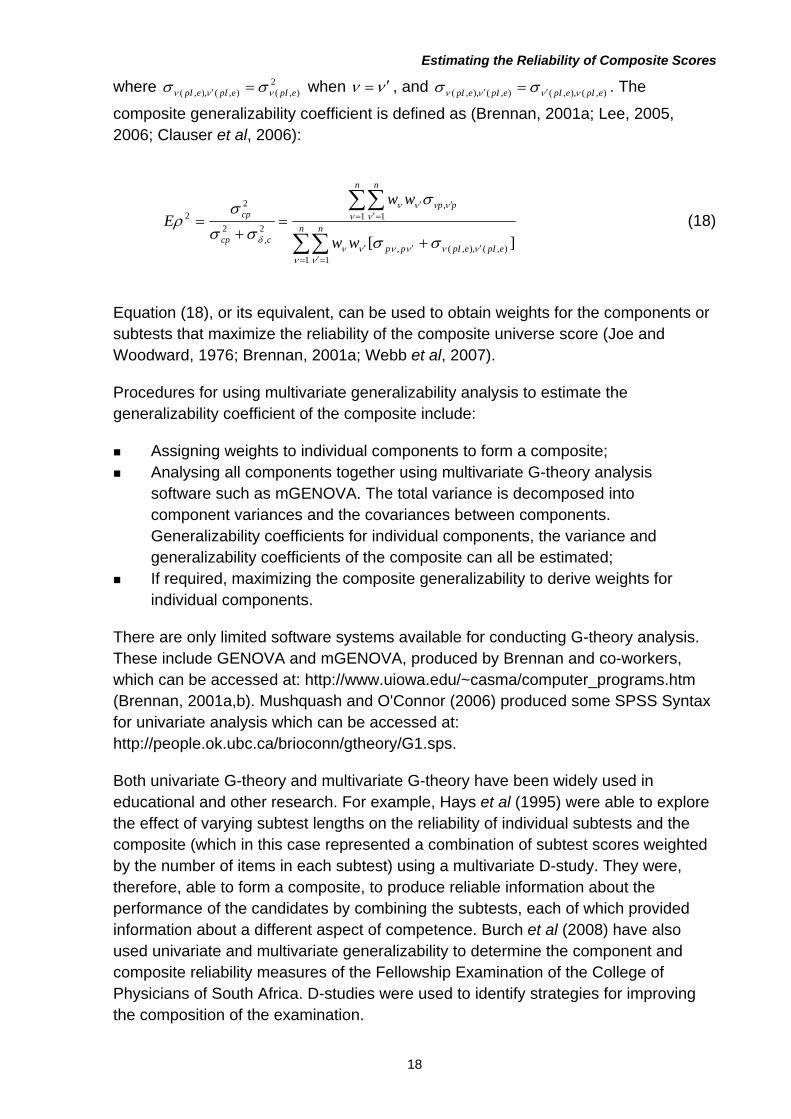
Equation (18), or its equivalent, can be used to obtain weights for the components or subtests that maximize the reliability of the composite universe score (Joe and Woodward, 1976; Brennan, 2001a; Webb et al, 2007).
Procedures for using multivariate generalizability analysis to estimate the generalizability coefficient of the composite include:
Assigning weights to individual components to form a composite; Analysing all components together using multivariate G-theory analysis
software such as mGENOVA. The total variance is decomposed into component variances and the covariances between components. Generalizability coefficients for individual components, the variance and generalizability coefficients of the composite can all be estimated;
If required, maximizing the composite generalizability to derive weights for individual components.
There are only limited software systems available for conducting G-theory analysis. These include GENOVA and mGENOVA, produced by Brennan and co-workers, which can be accessed at: http://www.uiowa.edu/~casma/computer_programs.htm (Brennan, 2001a,b). Mushquash and O'Connor (2006) produced some SPSS Syntax for univariate analysis which can be accessed at: http://people.ok.ubc.ca/brioconn/gtheory/G1.sps.
Both univariate G-theory and multivariate G-theory have been widely used in educational and other research. For example, Hays et al (1995) were able to explore the effect of varying subtest lengths on the reliability of individual subtests and the composite (which in this case represented a combination of subtest scores weighted by the number of items in each subtest) using a multivariate D-study. They were, therefore, able to form a composite, to produce reliable information about the performance of the candidates by combining the subtests, each of which provided information about a different aspect of competence. Burch et al (2008) have also used univariate and multivariate generalizability to determine the component and composite reliability measures of the Fellowship Examination of the College of Physicians of South Africa. D-studies were used to identify strategies for improving the composition of the examination.
18
Estimating the Reliability of Composite Scores
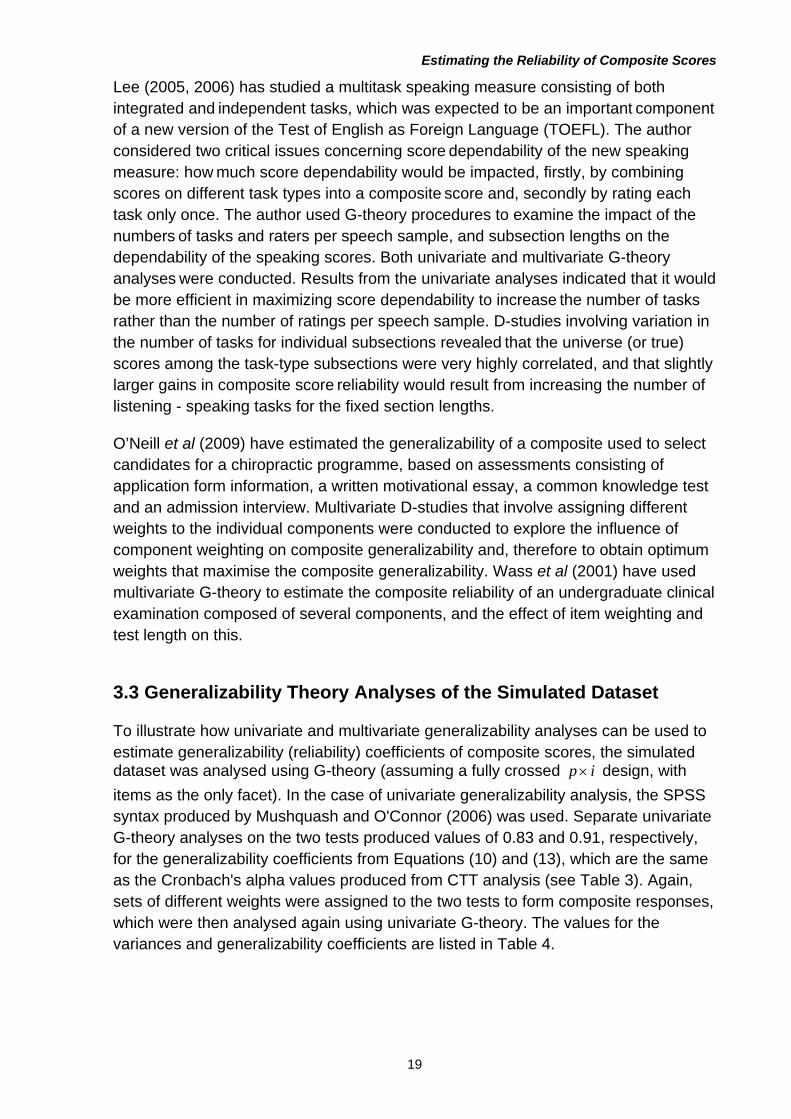
Lee (2005, 2006) has studied a multitask speaking measure consisting of both integrated and independent tasks, which was expected to be an important component of a new version of the Test of English as Foreign Language (TOEFL). The author considered two critical issues concerning score dependability of the new speaking measure: how much score dependability would be impacted, firstly, by combining
scores on different task types into a composite score and, secondly by rating each task only once. The author used G-theory procedures to examine the impact of the numbers of tasks and raters per speech sample, and subsection lengths on the dependability of the speaking scores. Both univariate and multivariate G-theory analyses were conducted. Results from the univariate analyses indicated that it would be more efficient in maximizing score dependability to increase the number of tasks rather than the number of ratings per speech sample. D-studies involving variation in the number of tasks for individual subsections revealed that the universe (or true) scores among the task-type subsections were very highly correlated, and that slightly larger gains in composite score reliability would result from increasing the number of listening - speaking tasks for the fixed section lengths.
O’Neill et al (2009) have estimated the generalizability of a composite used to select candidates for a chiropractic programme, based on assessments consisting of application form information, a written motivational essay, a common knowledge test and an admission interview. Multivariate D-studies that involve assigning different weights to the individual components were conducted to explore the influence of component weighting on composite generalizability and, therefore to obtain optimum weights that maximise the composite generalizability. Wass et al (2001) have used multivariate G-theory to estimate the composite reliability of an undergraduate clinical examination composed of several components, and the effect of item weighting and test length on this.
3.3 Generalizability Theory Analyses of the Simulated Dataset
To illustrate how univariate and multivariate generalizability analyses can be used to estimate generalizability (reliability) coefficients of composite scores, the simulated dataset was analysed using G-theory (assuming a fully crossed ip design, with
items as the only facet). In the case of univariate generalizability analysis, the SPSS syntax produced by Mushquash and O'Connor (2006) was used. Separate univariate G-theory analyses on the two tests produced values of 0.83 and 0.91, respectively, for the generalizability coefficients from Equations (10) and (13), which are the same as the Cronbach's alpha values produced from CTT analysis (see Table 3). Again, sets of different weights were assigned to the two tests to form composite responses, which were then analysed again using univariate G-theory. The values for the variances and generalizability coefficients are listed in Table 4.
19
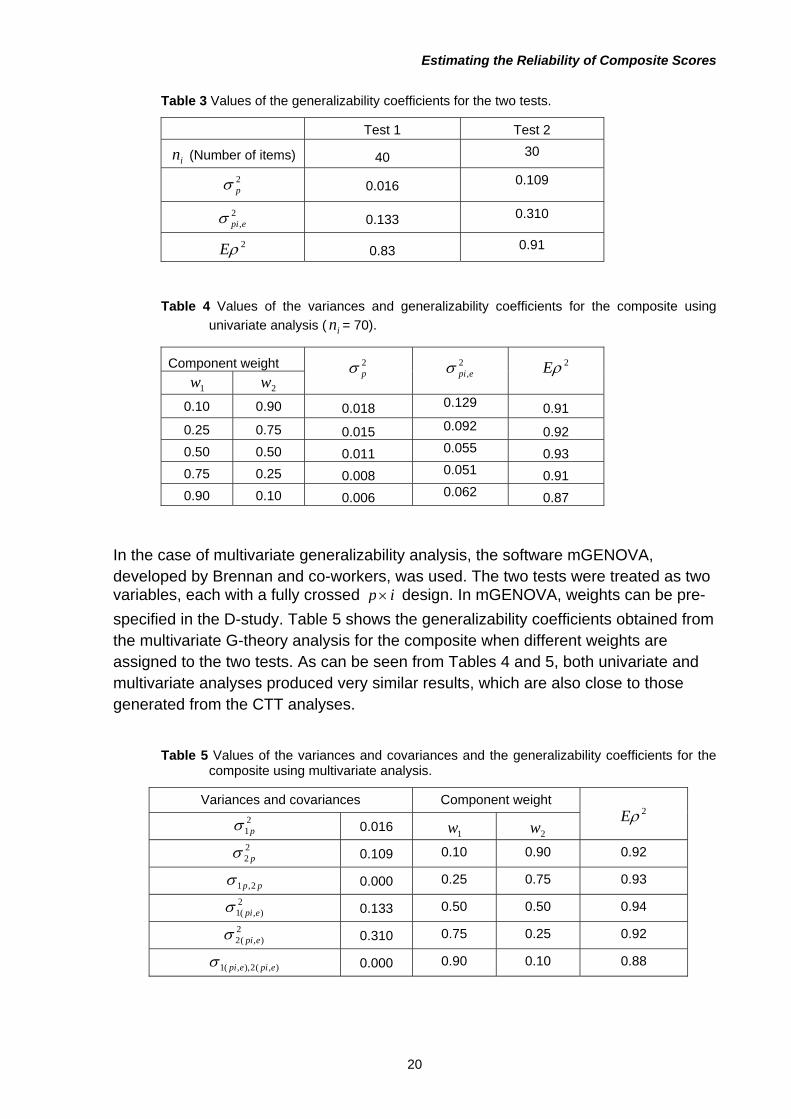
Estimating the Reliability of Composite Scores
Table 3 Values of the generalizability coefficients for the two tests.
Test 1 Test 2
in (Number of items) 40 30
2p 0.016 0.109
2,epi 0.133 0.310
2E 0.83 0.91
Table 4 Values of the variances and generalizability coefficients for the composite using
univariate analysis ( = 70). in
Component weight
1w 2w
2p 2
,epi 2E
0.10 0.90 0.018 0.129 0.91
0.25 0.75 0.015 0.092 0.92
0.50 0.50 0.011 0.055 0.93
0.75 0.25 0.008 0.051 0.91
0.90 0.10 0.006 0.062 0.87 In the case of multivariate generalizability analysis, the software mGENOVA, developed by Brennan and co-workers, was used. The two tests were treated as two variables, each with a fully crossed ip design. In mGENOVA, weights can be pre-
specified in the D-study. Table 5 shows the generalizability coefficients obtained from the multivariate G-theory analysis for the composite when different weights are assigned to the two tests. As can be seen from Tables 4 and 5, both univariate and multivariate analyses produced very similar results, which are also close to those generated from the CTT analyses.
Table 5 Values of the variances and covariances and the generalizability coefficients for the
composite using multivariate analysis.
Variances and covariances Component weight
21p 0.016
1w 2w
2E
22 p 0.109 0.10 0.90 0.92
pp 2,1 0.000 0.25 0.75 0.93
2),(1 epi 0.133 0.50 0.50 0.94
2),(2 epi 0.310 0.75 0.25 0.92
),(2),,(1 epiepi 0.000 0.90 0.10 0.88
20
Estimating the Reliability of Composite Scores
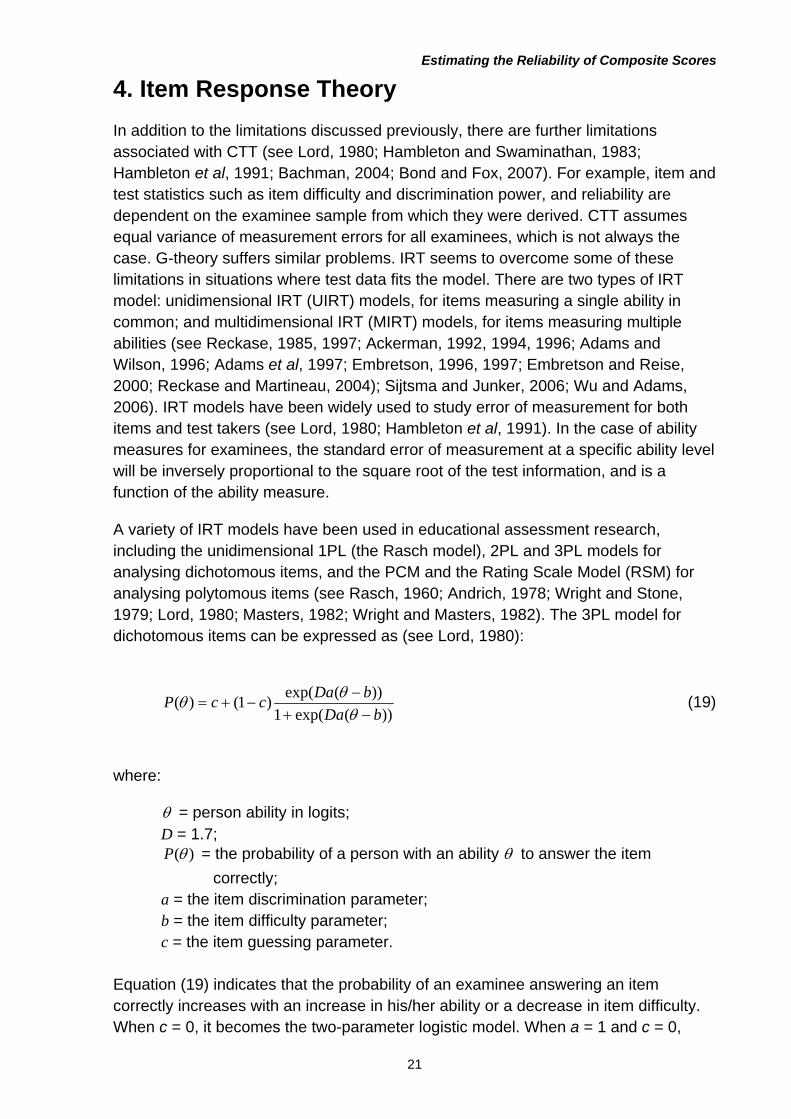
4. Item Response Theory
In addition to the limitations discussed previously, there are further limitations associated with CTT (see Lord, 1980; Hambleton and Swaminathan, 1983; Hambleton et al, 1991; Bachman, 2004; Bond and Fox, 2007). For example, item and test statistics such as item difficulty and discrimination power, and reliability are dependent on the examinee sample from which they were derived. CTT assumes equal variance of measurement errors for all examinees, which is not always the case. G-theory suffers similar problems. IRT seems to overcome some of these limitations in situations where test data fits the model. There are two types of IRT model: unidimensional IRT (UIRT) models, for items measuring a single ability in common; and multidimensional IRT (MIRT) models, for items measuring multiple abilities (see Reckase, 1985, 1997; Ackerman, 1992, 1994, 1996; Adams and Wilson, 1996; Adams et al, 1997; Embretson, 1996, 1997; Embretson and Reise, 2000; Reckase and Martineau, 2004); Sijtsma and Junker, 2006; Wu and Adams, 2006). IRT models have been widely used to study error of measurement for both items and test takers (see Lord, 1980; Hambleton et al, 1991). In the case of ability measures for examinees, the standard error of measurement at a specific ability level will be inversely proportional to the square root of the test information, and is a function of the ability measure.
A variety of IRT models have been used in educational assessment research, including the unidimensional 1PL (the Rasch model), 2PL and 3PL models for analysing dichotomous items, and the PCM and the Rating Scale Model (RSM) for analysing polytomous items (see Rasch, 1960; Andrich, 1978; Wright and Stone, 1979; Lord, 1980; Masters, 1982; Wright and Masters, 1982). The 3PL model for dichotomous items can be expressed as (see Lord, 1980):
))(exp(1
))(exp()1()(
bDa
bDaccP
(19)
where:
= person ability in logits; D = 1.7; )(P = the probability of a person with an ability to answer the item
correctly; a = the item discrimination parameter; b = the item difficulty parameter; c = the item guessing parameter.
Equation (19) indicates that the probability of an examinee answering an item correctly increases with an increase in his/her ability or a decrease in item difficulty. When c = 0, it becomes the two-parameter logistic model. When a = 1 and c = 0,
21
Estimating the Reliability of Composite Scores
Equation (19) reduces to the Rasch model. For the Rasch model, when the item difficulty is close to the person ability, the test taker will have a 50 per cent chance of answering the item correctly.
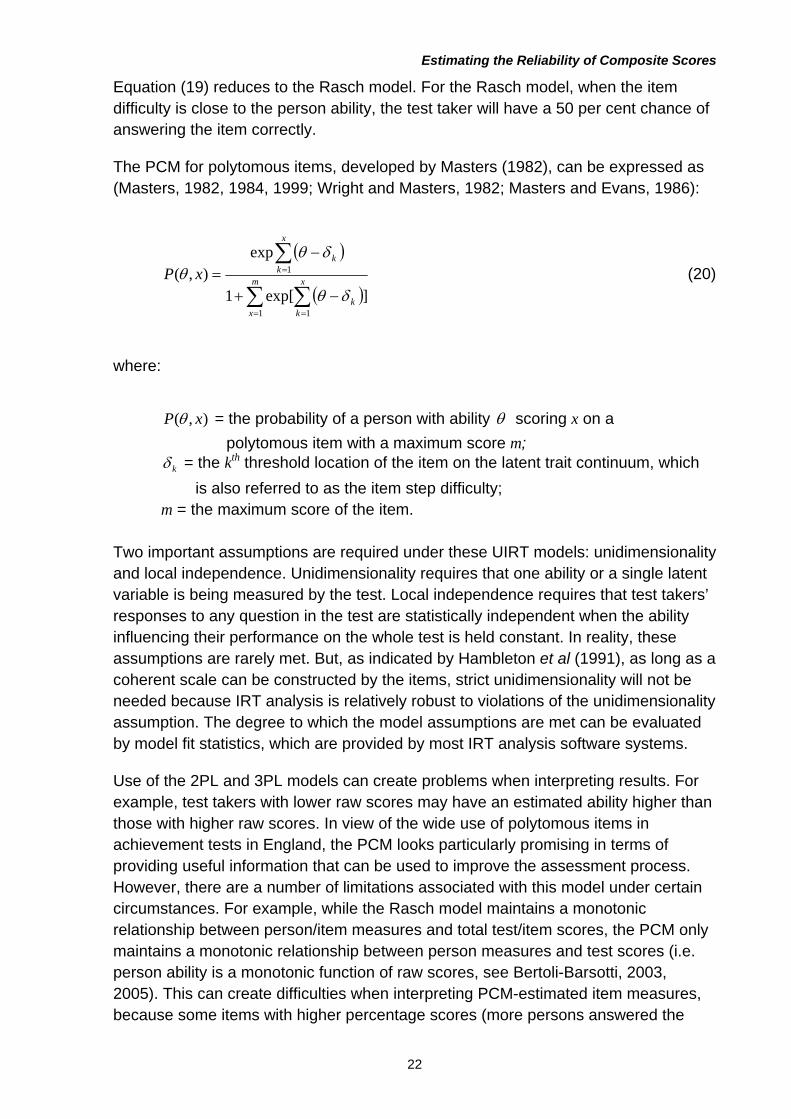
The PCM for polytomous items, developed by Masters (1982), can be expressed as (Masters, 1982, 1984, 1999; Wright and Masters, 1982; Masters and Evans, 1986):
m
x
x
kk
x
kk
xP
1 1
1
]exp[1
exp),(
(20)
where:
),( xP = the probability of a person with ability scoring x on a
polytomous item with a maximum score m; k = the kth threshold location of the item on the latent trait continuum, which
is also referred to as the item step difficulty; m = the maximum score of the item.
Two important assumptions are required under these UIRT models: unidimensionality and local independence. Unidimensionality requires that one ability or a single latent variable is being measured by the test. Local independence requires that test takers’ responses to any question in the test are statistically independent when the ability influencing their performance on the whole test is held constant. In reality, these assumptions are rarely met. But, as indicated by Hambleton et al (1991), as long as a coherent scale can be constructed by the items, strict unidimensionality will not be needed because IRT analysis is relatively robust to violations of the unidimensionality assumption. The degree to which the model assumptions are met can be evaluated by model fit statistics, which are provided by most IRT analysis software systems.
Use of the 2PL and 3PL models can create problems when interpreting results. For example, test takers with lower raw scores may have an estimated ability higher than those with higher raw scores. In view of the wide use of polytomous items in achievement tests in England, the PCM looks particularly promising in terms of providing useful information that can be used to improve the assessment process. However, there are a number of limitations associated with this model under certain circumstances. For example, while the Rasch model maintains a monotonic relationship between person/item measures and total test/item scores, the PCM only maintains a monotonic relationship between person measures and test scores (i.e. person ability is a monotonic function of raw scores, see Bertoli-Barsotti, 2003, 2005). This can create difficulties when interpreting PCM-estimated item measures, because some items with higher percentage scores (more persons answered the
22
Estimating the Reliability of Composite Scores
items correctly) may appear to be more difficult than items with lower percentage scores (fewer persons answered the items correctly).
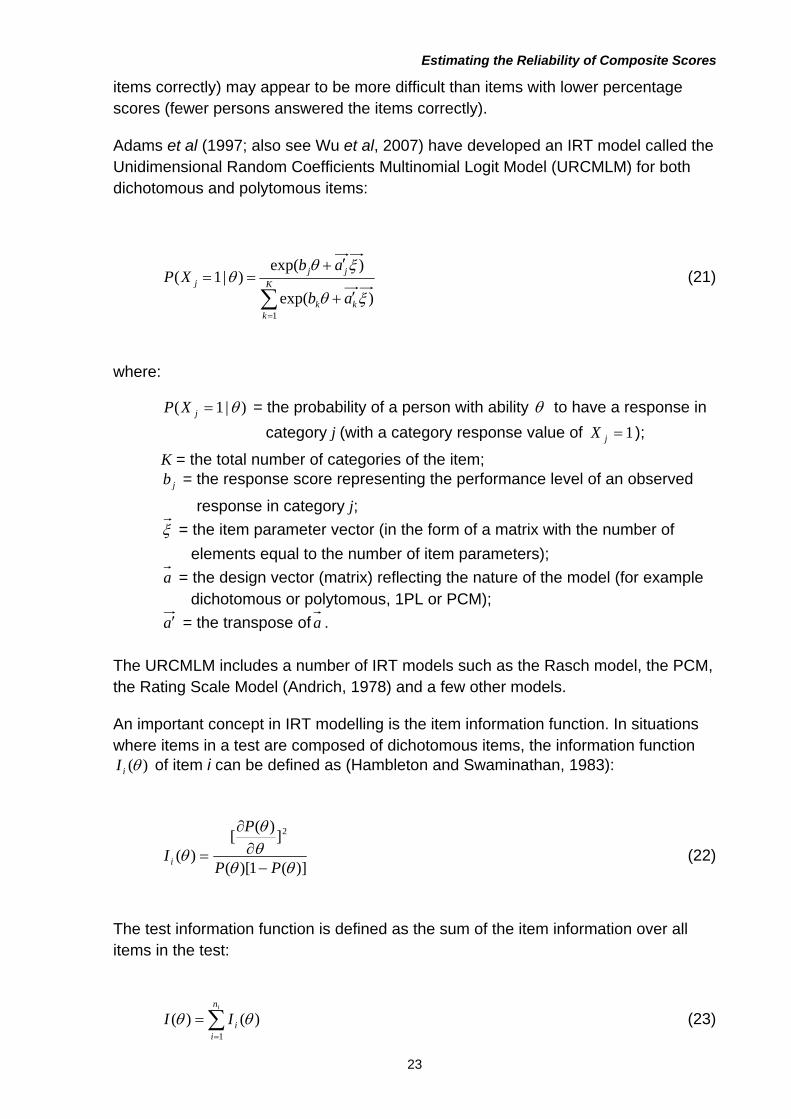
Adams et al (1997; also see Wu et al, 2007) have developed an IRT model called the Unidimensional Random Coefficients Multinomial Logit Model (URCMLM) for both dichotomous and polytomous items:
K
kkk
jjj
ab
abXP
1
)exp(
)exp()|1(
(21)
where:
)|1( jXP = the probability of a person with ability to have a response in
category j (with a category response value of ); 1jX
K = the total number of categories of the item; = the response score representing the performance level of an observed jb
response in category j;
= the item parameter vector (in the form of a matrix with the number of
elements equal to the number of item parameters);
a = the design vector (matrix) reflecting the nature of the model (for example dichotomous or polytomous, 1PL or PCM);
a = the transpose of a . The URCMLM includes a number of IRT models such as the Rasch model, the PCM, the Rating Scale Model (Andrich, 1978) and a few other models.
An important concept in IRT modelling is the item information function. In situations where items in a test are composed of dichotomous items, the information function
)(iI of item i can be defined as (Hambleton and Swaminathan, 1983):
)](1)[(
])(
[)(
2
PP
P
Ii
(22)
The test information function is defined as the sum of the item information over all items in the test:
(23)
in
iiII
1
)()(
23
Estimating the Reliability of Composite Scores
where is the number of items in the test. For polytomous items, Wright and
Masters (1982), Masters (1982), and Embretson and Reise (2000) have provided detailed discussions on the formulation of item and test information functions and their applications. The standard error (standard deviation) of a person ability measure is inversely proportional to the test information:
in
)(
12
ISEM IRTIRT (24)
Since the test information is a function of person ability, the standard error of person ability is also a function of ability. This is different from CTT, where the standard error of measurement is generally assumed to be the same at all score points. Johnson and Johnson (2009, and the references cited therein) have contrasted IRT-based measurement error and CTT-based measurement error and argued that in the case of IRT, the item parameters are predetermined and fixed, and, therefore, the measurement error does not reflect the effect of external factors such as content sampling. However, since IRT-based measurement error is a function of the items in a test, it could be interpreted as a reflection of the effect of sampling of items from the universe of items in estimating person reliability measures (assuming that the items are accurately marked). Rudner (2005) has interpreted the IRT-based measurement error as the standard deviation of the observed scores (ability) about the true score (ability) and has used it to calculate the expected classification accuracy. Recently, many-facet Rasch models have been used to study the consistency of rating between raters (see Linacre, 1994; Lumley and McNamara, 1995; Smith and Kulikowich, 2004). The person ability measurement error could be interpreted as reflecting the combined contribution from errors related to both items and raters in this case. As indicated by Webb et al (2007), in the case of IRT modelling, it is not possible to quantify the relative contributions of different error sources to measurement error, so that this information can be used, as in G-theory, to optimise the design of a future measurement using different samples of items and raters. Recently, researchers have attempted to bring together the sampling model of G-theory with IRT models (Kolen and Harris, 1987; Briggs and Wilson, 2004; Webb et al, 2007).
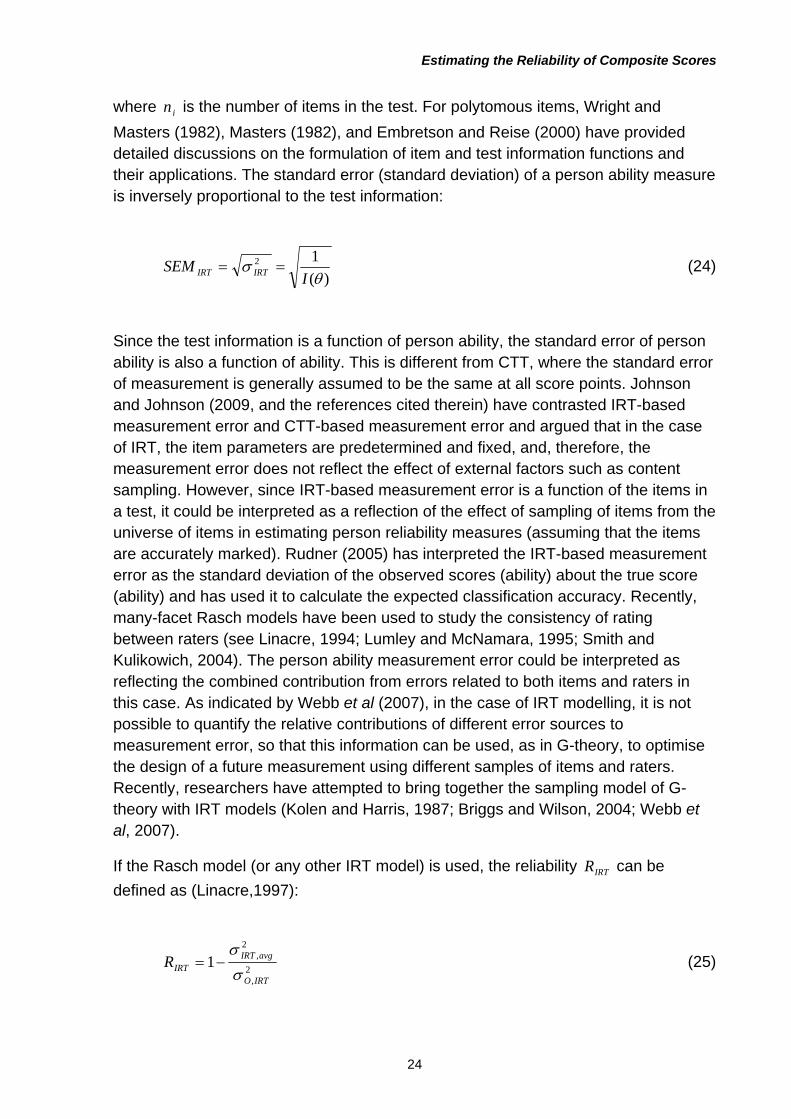
If the Rasch model (or any other IRT model) is used, the reliability can be
defined as (Linacre,1997): IRTR
2
,
2,1IRTO
avgIRTIRTR
(25)
24
Estimating the Reliability of Composite Scores
where is the average of the person measure error variance, and is the
observed person measure variance.
2,avgIRT 2
,IRTO
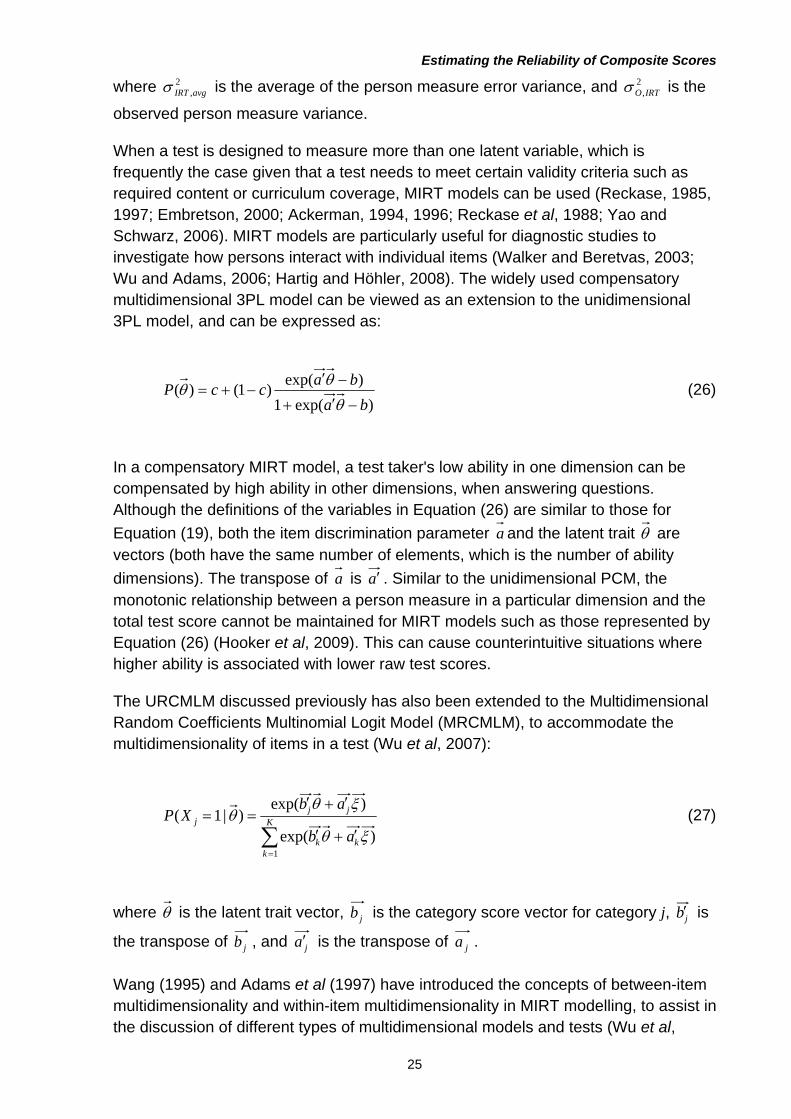
When a test is designed to measure more than one latent variable, which is frequently the case given that a test needs to meet certain validity criteria such as required content or curriculum coverage, MIRT models can be used (Reckase, 1985, 1997; Embretson, 2000; Ackerman, 1994, 1996; Reckase et al, 1988; Yao and Schwarz, 2006). MIRT models are particularly useful for diagnostic studies to investigate how persons interact with individual items (Walker and Beretvas, 2003; Wu and Adams, 2006; Hartig and Höhler, 2008). The widely used compensatory multidimensional 3PL model can be viewed as an extension to the unidimensional 3PL model, and can be expressed as:
)exp(1
)exp()1()(
ba
baccP
(26)
In a compensatory MIRT model, a test taker's low ability in one dimension can be compensated by high ability in other dimensions, when answering questions. Although the definitions of the variables in Equation (26) are similar to those for
Equation (19), both the item discrimination parameter a and the latent trait are vectors (both have the same number of elements, which is the number of ability
dimensions). The transpose of a is a . Similar to the unidimensional PCM, the monotonic relationship between a person measure in a particular dimension and the total test score cannot be maintained for MIRT models such as those represented by Equation (26) (Hooker et al, 2009). This can cause counterintuitive situations where higher ability is associated with lower raw test scores.
The URCMLM discussed previously has also been extended to the Multidimensional Random Coefficients Multinomial Logit Model (MRCMLM), to accommodate the multidimensionality of items in a test (Wu et al, 2007):
K
kkk
jjj
ab
abXP
1
)exp(
)exp()|1(
(27)
where is the latent trait vector, jb is the category score vector for category j, jb is
the transpose of jb , and ja is the transpose of ja .
Wang (1995) and Adams et al (1997) have introduced the concepts of between-item multidimensionality and within-item multidimensionality in MIRT modelling, to assist in the discussion of different types of multidimensional models and tests (Wu et al,
25
Estimating the Reliability of Composite Scores
2007). In the case of between-item multidimensionality, each item in a test measures just one distinct ability dimension, and items measuring the same latent dimension are grouped to form a subscale (for example, a mathematics test may contain some items measuring geometry ability and some items measuring algebra ability). In this case, the actual MIRT model reduces to a combination of UIRT models for individual item groups. In the case of within-item multidimensionality, an item may measure more than one latent dimension. Between-item multidimensionality is easier to deal with, mathematically and computationally, than within-item multidimensionality.
Both UIRT and MIRT models have been used to analyse tests and items. For example, Luecht and Miller (1992) presented and evaluated a two-stage process that considers the multidimensionality of tests under the framework of UIRT. They first clustered the items in a multidimensional latent space with respect to their direction of maximum discrimination. These item clusters were then calibrated separately using a UIRT model, to provide item parameter and trait estimates for composite traits in the context of the multidimensional trait space. Similarly, Childs et al (2004) have presented an approach to calculating the standard errors of weighted scores while maintaining a link to the IRT score metric. They used the unidimensional 3PL model for dichotomous items and the Graded Response model (GR model, see Samejima, 1969) for structured response questions, to calibrate a mathematics test containing three item types: multiple choice questions; short-answer free-response questions; and extended constructed-response questions. They then grouped the items as three subtests, according to their item types, and recalculated the corresponding IRT ability measures and raw scores. Different weights were then assigned to the subtests, and a composite ability score was formed as a linear combination of the subtest ability measures. The composite ability measures were then correlated to the overall test scores and the original IRT ability measures, to study the effects of subtest weighting.
Hartig and Höhler (2008) have recognised the importance of using MIRT in modelling performance in complex domains, simultaneously taking into account multiple basic abilities. They illustrated the relationship between a two-dimensional IRT model with between-item multidimensionality and a nested-factor model with within-item multidimensionality, and the different substantive meanings of the ability dimensions in the two models. They applied the two models to empirical data from a large-scale assessment of reading and listening comprehension in a foreign language assessment. In the between-item model, performance in the reading and listening items was modelled by two separate dimensions. In the within-item model, one dimension represented the abilities common to both tests, and a second dimension represented abilities specific to listening comprehension. Similarly, Wu and Adams (2006) have examined students’ responses to mathematics problem-solving tasks and applied a general MIRT model at the response category level. They used IRT modelling to identify cognitive processes and to extract additional information. They have demonstrated that MIRT models can be powerful tools for extracting information from responses from a limited number of items, by looking at the within-item multidimensionality. Through the analysis, they were able to understand how
26
Estimating the Reliability of Composite Scores
students interacted with the items and how the items were linked together. They were, therefore, able to construct problem-solving profiles for students.
4.1 Use of Unidimensional Item Response Theory Models
In the case of using UIRT models to produce composite ability measures and composite reliability, procedures include:
Selecting a UIRT model; Selecting an appropriate person sample for item calibration; Calibrating all items from all components simultaneously, to obtain the
composite person measures and measurement errors using IRT analysis software (assuming the components measure the same latent trait), and: Evaluating the degree to which the model assumptions are met; Calculating the reliability of the composite ability;
Or calibrating the items separately for individual components, using an IRT analysis software, to obtain person measures on the components (the components may measure different ability dimensions), and: Evaluating the degree to which the model assumptions are met; Assigning weights to components and calculate the composite person
measure as the linear combination of the component measures (see below);
Calculating the error for the composite person measure; Calculating the reliability of the composite ability.
4.2 Use of Multidimensional Item Response Theory Models
In the case of using MIRT models to produce composite ability measures and composite reliability, procedures include:
Selecting a MIRT model and assigning ability dimensions to components; Selecting an appropriate person sample for item calibration; Calibrating the items from all components and obtaining person measures on all
dimensions using IRT analysis software; Evaluating the degree to which the model assumptions are met; Assigning weights to ability dimensions; Calculating the composite person ability measure as the linear combination of
the dimensional ability measures; Calculating the error for the composite person ability measure; Calculating the reliability of the composite ability measure.
27
Estimating the Reliability of Composite Scores
4.3 Calculation of Composite Ability Measures, Standard Error and Composite Reliability
Assuming that each component measures a single ability dimension, a composite ability measured by the components for a test taker c can be obtained by linearly
combining the ability measures on individual components:
(28)
n
iiic w
1
where i is the ability measure on component i, and n is the number of components.
It is important to note that because of the indeterminacy of IRT model parameters when analysing test data using IRT software, and the relative difficulty of individual components, the ability measures from individual components may have their own origins or means. It might be necessary to rescale the ability measures from each component, so that measures from different components have similar means and standard deviations. The standard error of measurement of the composite ability measure can be expressed as: cIRTSEM ,
n
i
n
i
n
ijjIRTiIRTjijiiIRTicIRTcIRT rwwwSEM
1 1 1)(,,,
2,
22,, (29)
where is the correlation between the ability measures for component i and
component j, and is the error variance of component i.
jir ,
2,iIRT
In the case of two components, Equation (29) can be expressed as:
IRTIRTIRTIRTcIRT rwwww ,2,12,1212,2
22
2,1
21, 2 (30)
A reliability measure for the composite can be defined as: cIRTR ,
2
,,
2,,
, 1IRTcO
avgcIRTcIRTR
(31)
28
Estimating the Reliability of Composite Scores
where is the average of the composite person measure error variance
calculated using Equation (29), and is the observed composite person
measure variance.
2,, avgcIRT
2,, IRTcO
The approach outlined above also applies for the case of multidimensional ability measures obtained from simultaneous analysis of items from all components, using a MIRT model.
There are commercial IRT and MIRT software systems available for use in IRT analysis. These include WINSTEPS, ConQuest, PARSCALE, BILOG-MG, TESTFACT, and others (see Muraki and Bock, 1996; Wu et al, 2007; Bock et al, 2003).
4.4 Item Response Theory Analyses of the Simulated Dataset
The simulated dataset was also analysed using IRT models. In the case of UIRT analyses, the responses from the two tests were first combined, and all items were analysed together using ConQuest developed by Wu et al (2007). ConQuest implements the MRCMLM model, of which Masters' PCM is a special case. Outputs from the programme include model fit statistics, person ability and item difficulty measures, and the associated standard error of measurement. An IRT-based reliability measure was estimated to be 0.93 for the combined ability measures, using the procedures outlined above.
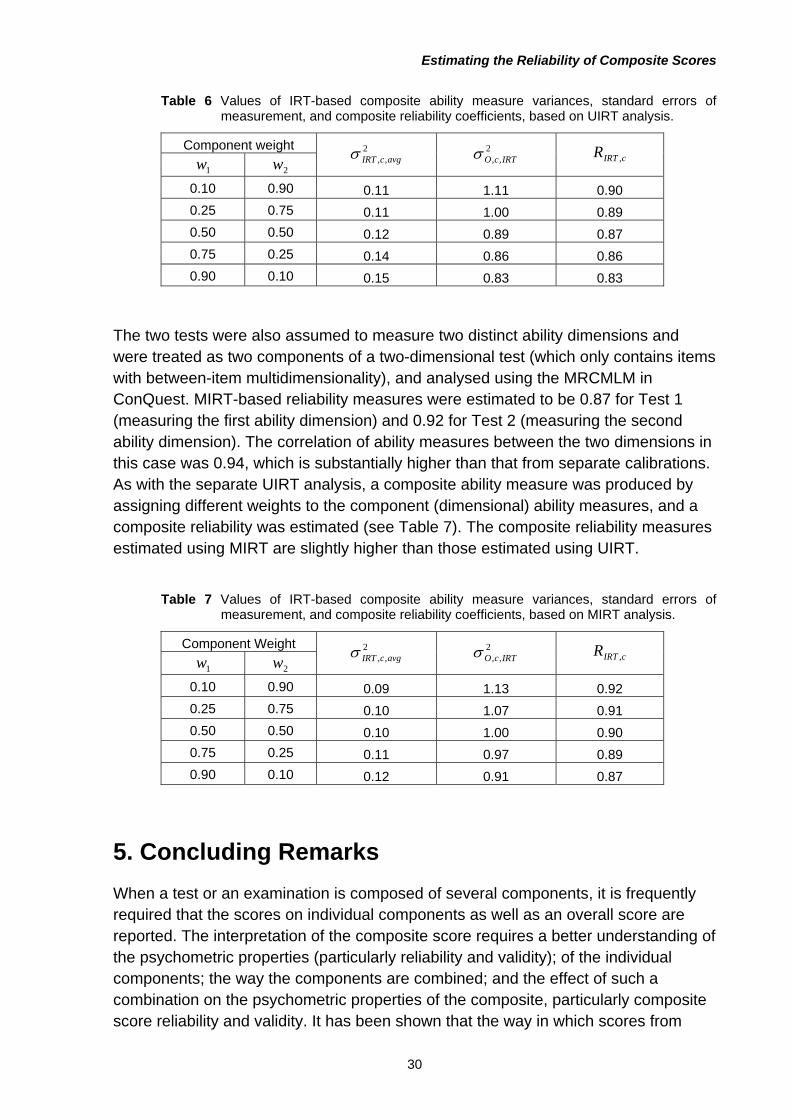
The two tests were then calibrated separately, which produced an IRT-based reliability of 0.80 for Test 1 and 0.91 for Test 2. These values are close to those produced using CTT analysis. Different weights were then assigned to the component ability measures, to produce composite ability measures. The correlation between the ability measures was estimated to be 0.77. The composite ability variances and error variances were then calculated, based on Equations (28) and (29), and the values of the composite reliability were calculated using Equation (31), based on different weights assigned to the two components as listed in Table 6. As Table 6 shows, the UIRT-based reliability coefficients for the composite are slightly lower than those obtained from CTT and G-theory analyses. The IRT-based composite reliability is also slightly lower than the higher of the reliabilities of the two components. This is different from CTT and G-theory. It has to be borne in mind that the weightings in IRT are different from CTT or G-theory, as IRT uses ability measures, not raw scores or mean scores.
29
Estimating the Reliability of Composite Scores
Table 6 Values of IRT-based composite ability measure variances, standard errors of
measurement, and composite reliability coefficients, based on UIRT analysis.
Component weight
1w 2w 2
,, avgcIRT 2,, IRTcO cIRTR ,
0.10 0.90 0.11 1.11 0.90
0.25 0.75 0.11 1.00 0.89
0.50 0.50 0.12 0.89 0.87
0.75 0.25 0.14 0.86 0.86
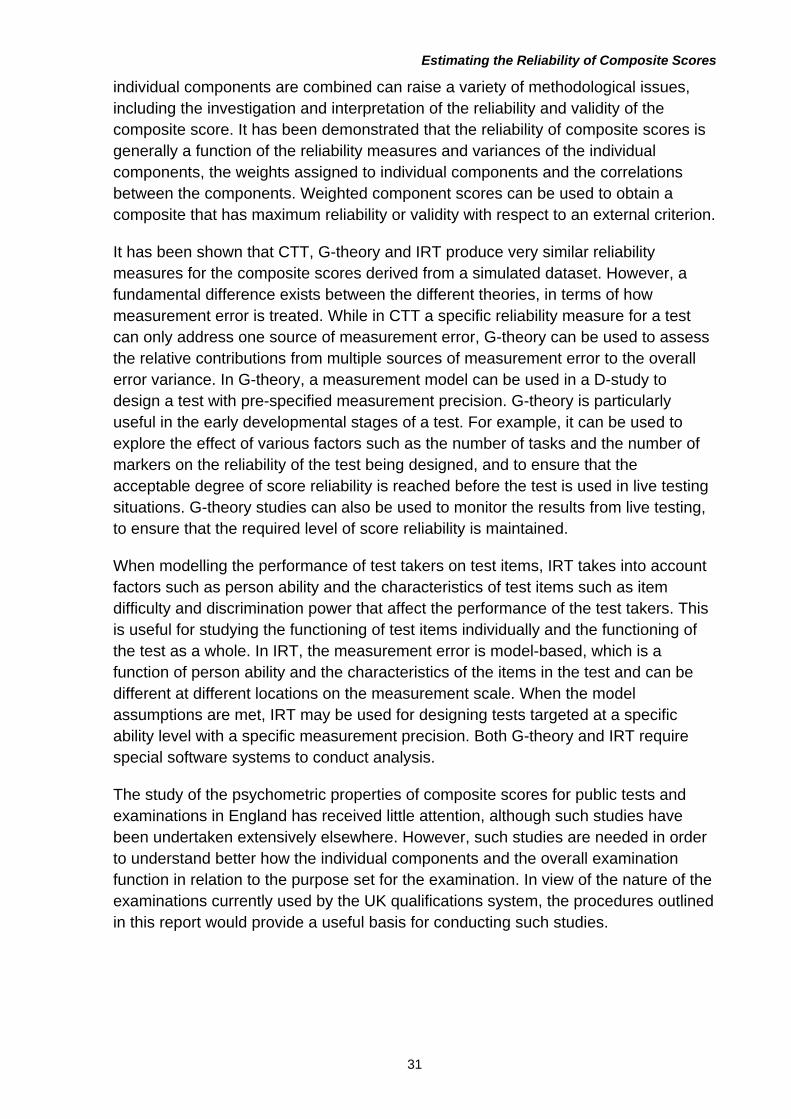
0.90 0.10 0.15 0.83 0.83 The two tests were also assumed to measure two distinct ability dimensions and were treated as two components of a two-dimensional test (which only contains items with between-item multidimensionality), and analysed using the MRCMLM in ConQuest. MIRT-based reliability measures were estimated to be 0.87 for Test 1 (measuring the first ability dimension) and 0.92 for Test 2 (measuring the second ability dimension). The correlation of ability measures between the two dimensions in this case was 0.94, which is substantially higher than that from separate calibrations. As with the separate UIRT analysis, a composite ability measure was produced by assigning different weights to the component (dimensional) ability measures, and a composite reliability was estimated (see Table 7). The composite reliability measures estimated using MIRT are slightly higher than those estimated using UIRT.
Table 7 Values of IRT-based composite ability measure variances, standard errors of
measurement, and composite reliability coefficients, based on MIRT analysis.
Component Weight
1w 2w 2
,, avgcIRT 2,, IRTcO cIRTR ,
0.10 0.90 0.09 1.13 0.92
0.25 0.75 0.10 1.07 0.91
0.50 0.50 0.10 1.00 0.90
0.75 0.25 0.11 0.97 0.89
0.90 0.10 0.12 0.91 0.87
5. Concluding Remarks
When a test or an examination is composed of several components, it is frequently required that the scores on individual components as well as an overall score are reported. The interpretation of the composite score requires a better understanding of the psychometric properties (particularly reliability and validity); of the individual components; the way the components are combined; and the effect of such a combination on the psychometric properties of the composite, particularly composite score reliability and validity. It has been shown that the way in which scores from
30
Estimating the Reliability of Composite Scores
individual components are combined can raise a variety of methodological issues, including the investigation and interpretation of the reliability and validity of the composite score. It has been demonstrated that the reliability of composite scores is generally a function of the reliability measures and variances of the individual components, the weights assigned to individual components and the correlations between the components. Weighted component scores can be used to obtain a composite that has maximum reliability or validity with respect to an external criterion.
It has been shown that CTT, G-theory and IRT produce very similar reliability measures for the composite scores derived from a simulated dataset. However, a fundamental difference exists between the different theories, in terms of how measurement error is treated. While in CTT a specific reliability measure for a test can only address one source of measurement error, G-theory can be used to assess the relative contributions from multiple sources of measurement error to the overall error variance. In G-theory, a measurement model can be used in a D-study to design a test with pre-specified measurement precision. G-theory is particularly useful in the early developmental stages of a test. For example, it can be used to explore the effect of various factors such as the number of tasks and the number of markers on the reliability of the test being designed, and to ensure that the acceptable degree of score reliability is reached before the test is used in live testing situations. G-theory studies can also be used to monitor the results from live testing, to ensure that the required level of score reliability is maintained.
When modelling the performance of test takers on test items, IRT takes into account factors such as person ability and the characteristics of test items such as item difficulty and discrimination power that affect the performance of the test takers. This is useful for studying the functioning of test items individually and the functioning of the test as a whole. In IRT, the measurement error is model-based, which is a function of person ability and the characteristics of the items in the test and can be different at different locations on the measurement scale. When the model assumptions are met, IRT may be used for designing tests targeted at a specific ability level with a specific measurement precision. Both G-theory and IRT require special software systems to conduct analysis.
The study of the psychometric properties of composite scores for public tests and examinations in England has received little attention, although such studies have been undertaken extensively elsewhere. However, such studies are needed in order to understand better how the individual components and the overall examination function in relation to the purpose set for the examination. In view of the nature of the examinations currently used by the UK qualifications system, the procedures outlined in this report would provide a useful basis for conducting such studies.
31
Estimating the Reliability of Composite Scores
Acknowledgements
I would like to thank Sandra Johnson, Andrew Boyle, Huub Verstralen and members of the Ofqual Reliability Programme Technical Advisory Group for critically reviewing this report.
References
Ackerman, T (1992) ‘A didactic explanation of item bias, item impact, and item validity from a multidimensional perspective’, Journal of Educational Measurement, 29, pp. 67-91.
Ackerman, T (1994) ‘Creating a test information profile for a two-dimensional latent space’, Applied Psychological Measurement, 18, pp. 257-276.
Ackerman, T (1996) ‘Graphical representation of multidimensional item response theory analyses’, Applied Psychological Measurement, 20, pp. 311-330.
Adams, R and Wilson, M (1996) ‘Formulating the Rasch model as a mixed coefficients multinomial logit’, Objective measurement III: Theory into practice, Norwood, NJ, USA: Ablex.
Adams, R, Wilson, M and Wang, W (1997) ‘The Multidimensional Random Coefficients Multinomial Logit Model’, Applied Psychological Measurement, 21, pp. 1-23.
Andrich, D (1978) ‘A binomial latent trait model for the study of Likert-style attitude questionnaires’, British Journal of Mathematical and Statistical Psychology, 31, pp. 84-98.
Bachman, L (2004) Statistical analyses for language assessment, Cambridge: Cambridge University Press.
Bachman, L and Palmer, A (1996) Language Testing in Practice, Oxford: Oxford University Press.
Bertoli-Barsotti, L (2003) ‘An order-preserving property of the maximum likelihood estimates for the Rasch model’, Statistics and Probability Letters, 61, pp. 91-96.
Bertoli-Barsotti, L (2005) ‘On the existence and uniqueness of JML estimates for the partial credit model’, Psychometrika, 70, pp. 517-531.
Bond, TG, and Fox, CM (2007) Applying the Rasch model: Fundamental measurement in the human sciences (2nd ed), Mahwah, NJ, USA: Lawrence Erlbaum.
Brennan, R (2001a) Generalizability Theory, New York, USA: Springer-Verlag.
32
Estimating the Reliability of Composite Scores
Brennan, R (2001b) mGENOVA (Version 2.1) computer software and manual. Available at: www.education.uiowa.edu/casma/ (Accessed: 25 January 2010).
Brennan, R (2009) ‘Notes about nominal weights in multivariate generalizability theory‘, Centre for Advanced Studies in Measurement and Assessment CASMA Technical Note No 4: University of Iowa. Available at: www.education.uiowa.edu/ casma/documents/4Nominal-weights-CASMA-note.pdf (Accessed: 25 January 2010).
Briggs, D and Wilson, M (2004) ‘Generalizability in item response modelling’, paper presented at the 2004 Annual Meeting of the Psychometric Society, Pacific Grove, CA, USA.
Bobko, P, Roth, P and Buster, M (2007) ‘The usefulness of unit weights in creating composite scores: a literature review, application to content validity, and meta-analysis’, Organizational Research Methods, 10, pp. 689-709.
Bock, R, Gibbons, R, Schilling, S, Muraki, E, Wilson, D and Wood, R (2003) TESTFACT 4.0 computer software and manual; Lincolnwood, IL, USA: Scientific Software International.
Burch, V, Norman, G, Schmidt, H and Vleuten, C (2008) ‘Are specialist certification examinations a reliable measure of physician competence?’, Advances in Health Sciences Education, 13, pp. 521-533.
Childs, R, Elgie, S, Gadalla, T, Traub, R and Jaciw, A (2004) ‘IRT-linked standard errors of weighted composites’, Practical Assessment, Research and Evaluation, 9, (13). Available at: http://PAREonline.net/getvn.asp?v=9&n=13 (Accessed: 25 January 2010).
Clauser, B, Harik, P and Margolis, M (2006) ‘A Multivariate Generalizability Analysis of Data from a Performance Assessment of Physicians' Clinical Skills’, Journal of Educational Measurement, 43, pp. 173-191.
Cresswell, M (1988) ‘Combining grades from different assessments: How reliable is the result?’, Educational Review, 40:3, pp. 361-382.
Cronbach, L, Gleser, G, Nanda, H and Rajaratnam, N (1972) The dependability of behavioural measurements: Theory of generalizability for scores and profiles, Chichester: Wiley.
Cronbach, L, Linn, L, Brennan, R and Haertel, R (1995) Generalizability Analysis for Educational Assessments, report of UCLA’s Center for the Study of Evaluation and The National Center for Research on Evaluation, Standards, and Student Testing. Avaliable at: www.cse.ucla.edu/products/evaluation/cresst_ec1995_3.pdf (Accessed: 25 January 2010).
Embretson, S (1996) ‘The new rules of measurement’, Psychological Assessment, 8, pp. 341-349.
33
Estimating the Reliability of Composite Scores
Embretson, S (1997) ‘Multicomponent response models’, Handbook of modern item response theory (W J van der Linden and R K Hambleton Eds), New York, USA: Springer-Verlag.
Embretson, S and Reise, S (2000) Item response theory for psychologists, New Jersey, USA: Lawrence Erlbaum Associates.
Feldt, L (2004) ‘Estimating the reliability of a test battery composite or a test score based on weighted item scoring’, Measurement and Evaluation in Counselling and Development, 37, pp. 184-190.
Feldt, L and Brennan, R (1989) ‘Reliability’, Educational Measurement (3rd Edition, R Linn Ed), pp. 105-146: The American Council on Education, MacMillan.
Gill, T and Bramley, T (2008) ‘Using simulated data to model the effect of inter-marker correlation on classification’, Research Matters: A Cambridge Assessment Publication, 5, pp. 29-36.
Govindarajulu, Z (1988) ‘Alternative methods for combining several test scores’, Educational and Psychological Measurement, 48, pp. 53-60.
Gray, E and Shaw, S (2009) ‘De-mystifying the role of the uniform mark in assessment practice: concepts, confusions and challenges’, Research Matters: A Cambridge Assessment Publication, 7, pp. 32-37.
Hartig, J and Höhler, J (2008) ‘Representation of competencies in multidimensional IRT models with within-item and between-item multidimensionality’, Journal of Psychology, 216, pp. 89-101.
Harvill, L (1991) ‘Standard error of measurement’: National Council on Educational Measurement, ITEMS. Available at: www.ncme.org/pubs/items/16.pdf (Accessed: 25 January 2010).
Hays, R, Fabb, W and Vleuten, C (1995) ‘Reliability of the fellowship examination of the Royal Australian College of General Practitioners’, Teaching and Learning in Medicine, 7, pp. 43-50.
Hambleton R and Swaminathan, H (1983) Item response theory: Principles and applications, the Netherlands: Kluwer-Nijoff.
Hambleton, R, Swaminathan, H, and Rogers, J (1991) Fundamentals of Item Response Theory, Newbury Park, California, USA: Sage.
Hooker, G, Finkelman, M and Schwartzman, A (2009) ‘Paradoxical results in multidimensional item response theory’, Psychometrica, 74, pp. 419-442.
Johnson, S and Johnson, R (2009) Conceptualising and interpreting reliability, Coventry: Ofqual.
34
Estimating the Reliability of Composite Scores
Joe, G and Woodward, J (1976) ‘Some developments in multivariate generalizability’, Psychometrica, 41, pp. 205-217.
Kamata, A, Turhan, A and Darandari, E (2003) ‘Scale Reliability of Multidimensional Composite Scores’. Paper presented at the annual meeting of American Educational Research Association, Chicago, April 2003.
Kolen, M and Brennan, R (2004) Test Equating, Scaling, and Linking: Methods and Practices, New York, USA: Springer.
Kolen, M and Harris, D (1987) ‘A multivariate test theory model based on item response theory and generalizability theory’. Paper presented at the annual meeting of the American Educational Research Association, Washington, USA.
Kreiter, C, Gordon, J, Elliott, S and Callaway, M (2004) ‘Recommendations for assigning weights to component tests to derive an overall course grade’, Teaching and Learning in Medicine, 16, pp. 133-138.
Kreiter, C and Bergus, G (2007) ‘A study of Two Clinical Performance Scores: Assessing the Psychometric Characteristics of a Combined Score Derived from Clinical Evaluation Forms and OSCEs’, Med. Educ. Online, 12:10.
Lee, Y (2005) ‘Dependability of scores for a new ESL speaking test: evaluating prototype tasks’, ETS TOEFL Monograph Series MS-28; USA: Educational Testing Service.
Lee, Y (2006) ‘Dependability of scores for a new ESL speaking assessment consisting of integrated and independent tasks’, Language Testing, 23, pp. 131-166.
Li, H, Rosenthal, R and Rubin, D (1996) ’Reliability of measurement in psychology: From Spearman-Brown to maximal reliability’, Psychological Methods, 1, pp. 98-107.
Linacre, J (1994) Many-facet Rasch Measurement, Chicago, IL, USA: MESA Press.
Linacre J (1997) ‘KR-20 / Cronbach Alpha or Rasch Reliability: Which Tells the "Truth"?’, Rasch Measurement Transactions, 11:3, pp. 580-1.
Lord, F (1980) Applications of Item Response Theory to Practical Testing Problems, New Jersey, USA: Lawrence Erlbaum.
Lord, F and Novick, M (1968) Statistical theories of mental test scores, Reading, MA: Addison-Wesley.
Luecht, R and Miller, T (1992) ‘Unidimensional Calibrations and Interpretations of Composite Traits for Multidimensional Tests’, Applied Psychological Measurement, 16, pp. 279-293.
Lumley, T and McNamara, T (1995) ‘Rater characteristics and rater bias: implications for training’, Language Testing, 12, pp. 54-71.
35
Estimating the Reliability of Composite Scores
MacMillan, P D (2000) ‘Classical, generalizability, and multifaceted Rasch detection of interrater variability in large, sparse data sets’, Journal of Experimental Education, 68, pp. 167-190.
Masters, G (1982) ‘A Rasch model for partial credit scoring’, Psychometrika, 47, pp. 149-174.
Masters, G (1984) ‘Constructing an item bank using partial scoring’, Journal of Educational Measurement, 21, pp. 19-31.
Masters, G (1999) ‘Partial credit model’, Advances in measurement in educational research and assessment (G Masters and J Keeves Eds), pp. 98-109, the Netherlands: Elsevier Science.
Masters, G and Evans, J (1986) ‘Banking non-dichotomously scored items’, Applied Psychological Measurement, 10, pp. 355-367.
McDonald, R (1999) Test theory: A unified treatment, New Jersey, USA: LEA.
Meadows, M and Billington, L (2005) A review of the literature on marking reliability, report to NAA. Available at : www.naa.org.uk/libraryAssets/media/Review_of_the_literature_on_marking _reliability.pdf (Accessed: 25 January 2010).
Muraki, E and Bock, R D (1996) PARSCALE: IRT based test scoring and item analysis for graded open-ended exercises and performance tasks (Version 3.0), Chicago, IL, USA: Scientific Software International.
Mushquash, C and O'Connor, B P (2006) SPSS, SAS, and MATLAB programs for generalizability theory analyses, Behavior Research Methods, 38, pp. 542-547.
O'Neill, L, Lars Korsholm, D, Wallstedt, B, Eika, B and Hartvigsen, J (2009) ‘Generalizability of a Composite Student Selection Procedure at a University-Based Chiropractic Program’, J Chiropr Educ, 23, pp. 8–16.
Osburn, H (2000) ‘Coefficient alpha and related internal consistency reliability coefficients’, Psychological Methods, 5, pp. 343-355.
Rasch, G (1960) Probabilitistic models for some intelligence and attainment tests, Copenhagen, Denmark: Denmark Paedagogiske Institute.
Ray, G (2007) ‘A note on using stratified alpha to estimate the composite reliability of a test composed of interrelated nonhomogeneous items’, Psychological Methods, 12, pp. 177-184.
Reckase, M D (1985) ‘The difficulty of test items that measure more than one ability‘, Applied Psychological Measurement, 9, pp. 401-412.
36
Estimating the Reliability of Composite Scores
Reckase, M (1997) ‘A linear logistic multidimensional model for dichotomous item response data’, Handbook of Modern Item response Theory (W van der Linden and R Hambleton Eds), pp. 271-286, New York, USA: Springer.
Reckase, M, Ackerman, T and Carlson, J (1988) ‘Building a Unidimensional Test Using Multidimensional Items’, Journal of Educational Measurement, 25, pp. 193-203.
Reckase M and Martineau, J (2004) ‘The Vertical Scaling of Science Achievement Tests’, paper commissioned by the Committee on Test Design for K-12 Science Achievement Center for Education National Research Council. Available at: www7.nationalacademies.org/bota /Vertical%20Scaling.pdf (Accessed: 25 January 2010).
Rowe, K (2002) ‘The measurement of latent and composite variables from multiple items or indicators: Applications in performance indicator systems’, Australian Council for Educational Research Report. Available at: www.acer.edu.au/documents/ Rowe_MeasurmentofComposite Variables.pdf (Accessed: 25 January 2010).
Rowe, K (2006) ‘The measurement of composite variables from multiple indicators: Applications in quality assurance and accreditation systems-Childcare’, Australian National Childcare Accreditation Council Report. Available at: www.ncac.gov.au /report_ documents/composite_ variables.pdf (Accessed: 25 January 2010).
Rudner, L (2001) ‘Informed test component weighting’, Educational Measurement: Issues and Practice, 20, pp. 16-19.
Rudner, L (2005) ‘Expected classification accuracy. Practical Assessment, Research and Evaluation’, 10, (13). Available at: http://pareonline.net/pdf/v10n13.pdf (Accessed: 25 January 2010).
Samejima, F (1969) ‘Estimation of ability using a response pattern of graded scores’, Psychometrica Monograph, No. 17.
Shavelson, R and Webb, N (1981) ‘Generalizability theory: 1973-1980’, British Journal of Mathematical and Statistical Psychology, 34, pp. 133-166.
Shavelson, R and Webb, N (1991) Generalizability Theory, Newbury Park, USA: Sage Publications.
Sijtsma, K and Junker, B (2006) ‘Item response theory: past performance, present developments, and future expectations’, Behaviormetrika, 33, pp. 75-102.
Smith, E and Kulikowich, J (2004) ‘An Application of Generalizability Theory and Many-Facet Rasch Measurement Using a Complex Problem-Solving Skills Assessment. Educational and Psychological Measurement’, 64, pp. 617-639.
37
Estimating the Reliability of Composite Scores
38
Thissen, D and Wainer, H (2001) Test Scoring, Philadelphia, USA: Lawrence Erlbaum Associates.
Walker, C and Beretvas, S (2003) ‘Comparing multidimensional and unidimensional proficiency classification: multidimensional IRT as a diagnostic aid’, Journal of Educational Measurement, 40, pp. 255-275.
Wang, W (1995) ‘Implementation and application of multidimensional random coefficients multinomial logit’, unpublished doctoral dissertation: University of California, Berkeley.
Wang, M and Stanley, J (1970) ‘Differential weighting: A review of methods and empirical studies’, Review of Educational Research, 40, pp. 663-705.
Wass, V, McGibbon, D and Van der Vleuten, C (2001) ‘Composite undergraduate clinical examinations: how should the components be combined to maximize reliability?’, Medical Education, 36, pp. 326-336.
Webb, N, Shavelson, R and Haertel, E (2007) ‘Reliability coefficient and generalizability theory’, Handbooks of Statistics 26: Psychometrics (C Rao and S Sinharay Eds), pp. 81-124, the Netherlands: Elsevier.
Wiliam, D (2000) ‘Reliability, validity, and all that jazz’, Education, 3-13 29, pp. 17-21.
Wright, B and Masters G (1982) ‘Rating scale analysis’, Rasch Measurement, Chicago, IL, USA: MESA Press.
Wright, B and Stone, M (1979) Best Test Design. Rasch Measurement, Chicago, IL, USA: MESA Press.
Wu, M and Adams, R (2006) ‘Modelling mathematics problem solving item responses using a multidimensional IRT model’, Mathematics Education Research Journal, 18, pp. 93-113.
Wu, M L, Adams, R J, and Wilson, M R (2007) ConQuest: Multi-aspect test software, Melbourne: Australian Council for Educational Research.
Yao, L and Schwarz, R (2006) ‘A Multidimensional Partial Credit Model With Associated Item and Test Statistics: An Application to Mixed-Format Tests’, Applied Psychological Measurement, 30, pp. 469-492.
Estimating the Reliability of Composite Scores
Ofqual wishes to make its publications widely accessible. Please contact us if you have any specific accessibility requirements.
First published by The Office of Qualifications and Examinations Regulation in 2010.
© Qualifications and Curriculum Authority 2010
Ofqual is part of the Qualifications and Curriculum Authority (QCA). QCA is an exempt charity under Schedule 2 of the Charities Act 1993.
Office of Qualifications and Examinations Regulation Spring Place Coventry Business Park Herald Avenue Coventry CV5 6UB
Telephone 0300 303 3344 Textphone 0300 303 3345 Helpline 0300 303 3346
www.ofqual.gov.uk