Embed Size (px)
Citation preview

Estimation of a Model of Entry in the Airline Industry
Steven T. Berry
Econometrica, Vol. 60, No. 4. (Jul., 1992), pp. 889-917.
Stable URL:
http://links.jstor.org/sici?sici=0012-9682%28199207%2960%3A4%3C889%3AEOAMOE%3E2.0.CO%3B2-F
Econometrica is currently published by The Econometric Society.
Your use of the JSTOR archive indicates your acceptance of JSTOR's Terms and Conditions of Use, available athttp://www.jstor.org/about/terms.html. JSTOR's Terms and Conditions of Use provides, in part, that unless you have obtainedprior permission, you may not download an entire issue of a journal or multiple copies of articles, and you may use content inthe JSTOR archive only for your personal, non-commercial use.
Please contact the publisher regarding any further use of this work. Publisher contact information may be obtained athttp://www.jstor.org/journals/econosoc.html.
Each copy of any part of a JSTOR transmission must contain the same copyright notice that appears on the screen or printedpage of such transmission.
The JSTOR Archive is a trusted digital repository providing for long-term preservation and access to leading academicjournals and scholarly literature from around the world. The Archive is supported by libraries, scholarly societies, publishers,and foundations. It is an initiative of JSTOR, a not-for-profit organization with a mission to help the scholarly community takeadvantage of advances in technology. For more information regarding JSTOR, please contact [email protected].
http://www.jstor.orgSun Mar 23 15:17:13 2008
Econometrics, Vol. 60, No. 4 (July, 19921, 889-917
ESTIMATION OF A MODEL OF ENTRY IN THE AIRLINE INDUSTRY
This paper considers the effect of an airline's scale of operation at an airport on the profitability of routes flown out of that airport. The empirical methodology uses the entry decisions of airlines as indicators of underlying profitability; the results extend the empirical literature on airport presence by providing a new set of estimates of the determinants of city pair profitability. The literature on empirical models of oligopoly entry is also extended, particularly via a focus on the important (and difficult) role of differences between firms.
KEYWORDS:Entry, airlines, simulation estimators.
1. INTRODUCTION
COMMENTATORS THE airline industry have long focused on ON DEREGULATED
the role of entry into airline city pair markets. While some have suggested that the entry process will enforce competitive outcomes (Bailey and Panzar (1981)), others focus on potential barriers to entry that may allow firms to earn economic profits (e.g., Borenstein (1989) and Levine (1987)). This latter litera- ture argues in part that an airline's scale of operation (or "airport presence") at the endpoint cities that constitute the city pair may give it significant advantages over other airlines.
This paper investigates the importance of airport presence in determining the profits of operating in a given city pair. The empirical methodology relies on a model of equilibrium outcomes which allows for an economic interpretation of estimated coefficients and for a preliminary study of how city pair market structure would change if city pair entry were made less costly, either by direct subsidy or by changes in airport regulation.
The paper emphasizes several methodological issues that are of particular importance in studying airline city pairs. One issue is the simultaneity of profits and market structure in oligopolistic markets. In this respect the paper bears a resemblance to the independent work, discussed below, of Bresnahan and Reiss (1987, 1990, 1991) and Reiss and Spiller (1989) on entry in oligopolistic markets. A second problem arises from the presence of a large number of heterogeneous potential entrants, where the "heterogeneity" stems from observed or unob- served variations in firm costs and demand.
The presence of heterogeneous entrants has important implications for pre- dictions about market structure. For example, heterogeneity among potential
his paper is a revision of work in my Ph.D. dissertation. I owe many thanks to my committee: Ariel Pakes, Leonard Weiss, and Ian Gale. Rob Porter, John Sutton, and participants at numerous seminars have made useful suggestions which are incorporated in this work, as have several anonymous referees. A1 Klevorick and Rick Levin made helpful, detailed comments on an earlier draft. Of course, I am responsible for remaining errors.
890 STEVEN T. BERRY
entrants provides one logical basis for the observed relationship between market size and the number of firms. Furthermore, the presence of a large number of heterogeneous potential entrants causes a substantial methodological difficulty that is not addressed in the current literature and is relevant to a large class of models. The discussion below shows that in this class of models the integral defining the probability of a given event has a very complicated region of integration. In particular, the probability of a given event can be defined as the linear combination of a very large number (into the millions in the current context) of relatively simple integrals. While each of these integrals might be solved relatively easily, a solution to all of them is computationally infeasible. Furthermore, the complexity of the region of integration is a natural conse- quence of a large class of structural economic models, rather than being imposed by some artificial assumption. Indeed, it is well known that in many game-theoretic models, the region of parameters that lead to a given equilib- rium outcome can be very complex, even when the model is relatively simple.
The paper proposes the use of the recently presented simulation estimators (McFadden (1989) and Pakes and Pollard (1989)) to solve this computational problem. This represents a new rationale for simulation estimators, as previous examples have focused on aggregation (Pakes (1986)) or on the presence of intractable integrals with simple regions of integration (e.g. McFadden (1989)). The application of simulation estimators given below is relatively straightfor- ward and appears to produce sensible parameter estimates.
The paper is organized as follows. I will begin by briefly reviewing arguments as to why airport presence matters for airline profitability and why heteroge- neous entrants are relevant in airline markets. Presented next is a straightfor- ward model of oligopolistic entry. After establishing some simple features of the model, the probability distribution of the number of firms is derived. Special cases which are amenable to maximum likelihood estimation are presented, followed by a discussion of simulation estimators.
I will then discuss the data and some descriptive results. The descriptive analysis will emphasize the role of airport presence and of differences between airlines. After a discussion of special case empirical results, estimates of the general model, obtained by a simulation estimator, are presented. These esti- mates have implications for the relative profitability of varying levels of airport presence and for a simple policy experiment.
2. PREVIOUS WORK
2.1. Models of Airline Hubbing
The existing literature contains a number of hypotheses about the role of airport presence in determining an airline's profitability on a given route (Levine (1987) provides one good review). We can divide these hypotheses into two groups. The first group emphasizes the economies of a hub and spoke route network. These can be demand-side economies that make it easier for an airline to differentiate its product (as through service scheduling and frequent flier
891 MODEL OF ENTRY
plans) or cost-side economies. Such advantages may be especially important for flights that originate out of a hub city. A second group of theories argues that the control of airports by incumbent firms grants these firms a substantial strategic advantage in preventing entry. Firms that operate a large hub at a given airport may have a particularly large influence over the operation of that airport.
Proponents of the view that hubbing increases market power often emphasize the increase in prices charged by airlines on flights departing from hub cities (Borenstein (1989)), whereas other authors emphasize the cost savings obtain- able by putting passengers who have different ultimate destinations on a single aircraft flying to a hub city. In Berry (1990) I attempt to reconcile these views with a differentiated products model that allows for hubbing to produce both higher prices and lower costs. In contrast, the current paper focuses on quantifying the profit advantage from airport presence rather than distinguish- ing among different explanations for this advantage. One example of the importance of quantifying the profit advantage from airport presence involves attempts by airlines and/or policy-makers to alter market structure. Airlines may attempt to change market structure through mergers, while the government could attempt to change market structure by easing access to airport facilities and/or offering direct subsidies to entering firms.
2.2. Empirical Entry Models
An ideal model for the study of airline networks would involve an explicit model of firm profitability as a function of its entire network and the network of its competitors. A firm's profit function would be derived from primitive assumptions on production technology and consumer demands; these primitives would in turn imply the costs of and revenues from operating a particular network, given rivals' networks. A firm might be modeled as choosing a new network structure in each period, taking into account both its own sunk investments in an existing network and its expectation of rivals' actions. Unfor- tunately, the state space of this model is the complete set of all possible networks for the firm and all of its rivals. Such a model is well beyond the scope of this paper.
Instead of modeling equilibrium choices over entire networks, I will take a more partial equilibrium approach. The unit of observation and analysis is a city pair market at a single point in time. At the beginning of the period, each firm takes its overall network structure as given and decides whether to operate in a given city pair. Artificially, firms are assumed to make independent decisions across city pairs. A firm's post-entry profits in a given city pair are specified as a function of market-level variables, of its own airport presence, and of the number of competitors it faces in the city pair. As we will see, even this simple framework introduces a considerable methodological challenge.
In the absence of any strategic considerations, a traditional discrete-choice model could be used to make inferences about firm profits. In a traditional
892 STEVEN T. BERRY
discrete-choice model of firm entry, the post-entry profits of potential firms are parameterized as a function of observable variables and a "structural" error. Entry occurs when post-entry profits are positive. Observations on the entry decision across a sample of firms can then reveal the structure of the underlying profit equation.
This paper seeks to apply the basic insight of the discrete-choice approach: that observed entry decisions are an indicator of underlying profitability. There is, however, an important difference between discrete choice models as applied to individual behavior and these same models applied to oligopolistic markets. It is appropriate to consider individual behavior as being driven by an individual utility or profit function. In an oligopolistic market, however, behavior is driven by the interaction of a number of individual decision makers. It is therefore necessary to base estimation in such markets on an oligopolistic equilibrium concept rather than on an individual choice function.
Bresnahan and Reiss (1987, 1991) make the important step of estimating an equilibrium entry model, applied to a sample of establishments in isolated markets.' The Bresnahan and Reiss approach uses information on market size and the number of firms to make inferences about the nature of competition, frequently abstracting from differences among firms.3 In contrast, the current paper focuses on inferences about firm-specific sources of profit in the presence of a large number of heterogeneous potential entrants.
The focus on a large number of entrants is empirically motivated, as the airline data presented below suggests the presence of up to twenty-six potential entrants. The modeled heterogeneity in firms' profit can stem not only from differences in airport presence or route structure, but also from differences in input costs, aircraft fleets, management talent, and labor agreements. For example, Card (1986) notes differences in mechanics wages across airlines. Some of these differences will be observable to the econometrician and some will not. Therefore, the model presented below will allow for both observed and unobserved (to the econometrician) differences between firms.
3. A FORMAL ENTRY MODEL
3.1. Assumptions and Results
In each market, the framework for formal analysis is a simple two-stage game in each market i. In the first stage of the game, each of K, potentially operating firms makes a choice to be "in" or "out" of the market. Note that both incumbent firms and other potential entrants make an effective "entry" choice
2 ~ h eearly literature on the empirical treatment of discrete games also includes Bjorn and Vuong (1985).
3~resnahan and Reiss do discuss some implications of differences between firms, particularly differences which are associated with the order of entry. They also provide some empirical estimates for the case of two heterogeneous potential entrants. By focusing on a small number of potential entrants (or on entrants that do not differ in unobserved characteristics), these authors are able to use a somewhat more general expression for variable profits than is given below.
MODEL OF ENTRY 893
in each period. In the second stage of the game, the firms that chose "in" in the first period play some game that determines post-entry profits. These profits are assumed to differ across firms in a given market.
Each firm's first period strategy space is denoted as (0, I), where "0" is no entry and "1" is entry. A strategy vector for the game is denoted s, a Ki by 1 vector of ones and zeros. Firms that do not enter receive a payoff of zero while firm k entering market i receives aik(s). I will assume throughout that firms observe all factors that influence their own and their rivals' profits.
A pure strategy equilibrium obtains when, holding the strategies of rival firms fixed, all entering firms are profitable and all firms that do not enter expect zero profits from entry. Formally, a Nash equilibrium strategy vector, s*, for this game is any vector that satisfies
s,*Tik(s*)>O and ( ~ - s , * ) T ~ ~ ( s * + ~ ) < ~ , f ~ r a l l k = l , . . . , ~ i ,
where s * + ~ is equal to s*, except that s , *+~must equal 1. To prove the existence of a (pure strategy) equilibrium, it is necessary to impose some structure on the profit function. One natural restriction is that firm profits are declining in rivals' entry decisions. In addition, I will assume that firms can be ranked in order of profitability and that this ranking does not change as the set of entering firms changes. Thus, if firm k is more profitable than firm k' given one set of rivals, firm k remains more profitable given any other set of rivals. This is a common assumption in entry models with heterogeneous firms, which I will impose by assuming that firm characteristics can be aggregated into a single index of profitability, 4 ik , that differs across firms, k, and markets, i.
It is then easy to show that a Nash equilibrium exists in each market. One such equilibrium is easy to construct: order the firms by decreasing profitability and let the firms enter in this order until the next firm would be unprofitable. By construction, all entering firms make profits and all other firms would not.
Even with a single index of profitability, this is not the only equilibrium. In particular, there may be a firm, k', that does not enter in this equilibrium but would nonetheless be willing to replace the least profitable entering firm, N. This results in at least two equilibria: one with firm N, the other with k'. Such nonuniqueness of equilibria causes problems for empirical work, as the same underlying conditions can result in different observed outcomes.
The two equilibria in the example of the last paragraph involve an equal number of firms. If all equilibria had the same number of firms, then we could base an estimation strategy on this unique number of firms. This is a specific case of a general strategy for dealing with nonunique equilibria: find some feature that is common to all equilibria.
It is necessary to place some structure on the profit function to ensure the uniqueness of N. In particular, I will assume that differences in firm characteris- tics affect only the fixed portion of profits (e.g., the negative of fixed costs). The post-entry game is symmetric, so variable profits, u, depend only on the number of entering firms, N. Naturally, profits decline in the number of entering firms.
894 STEVEN T. BERRY
This results in a profit function for firm k in market i of
with vi(.) strictly decreasing and N(s) the number of firms that enter given s. Note that the characteristics of rival firms affect firm k via the equilibrium number of firms, but do enter the profit function directly.
Equation (1)is obviously restrictive: it is trivial to construct examples in which own-firm characteristics enter nonlinearly and in which the characteristics of other firms affect profits directly. However, if we use information only on the identities of entering firms, it may be very difficult to distinguish linear vs. nonlinear and direct vs. indirect effects. Furthermore, other models may feature a multiplicity of equilibrium values for N. Equation (1) has the considerable advantage that it yields a tractable (though still complex) empirical model of entry.
Many traditional oligopoly models will produce a profit function of the form in (1). In each of these models, the term (-4,) can be thought of as a firm-specific fixed cost, while v(N) is the common "variable" portion of profits. In these models, variable profits decline in N because the entry of substitutes drives down market shares and, in imperfectly competitive models, because entry generally drives prices down. With homogeneous goods and identical marginal costs across firms, both perfect competition and Cournot competition can produce (I), as can models with symmetric product differentiation. Rather than specify a particular stylized model of competition, I will treat (1) as an approximation to this whole class of models.
Given (I), it is easy to show that the equilibrium number of firms is unique, although the actual identities of entering firms may be indeterminate:
RESULT: Given equation (I), a function vi(N) that is strictly decreasing in N, and a vector 4i, all pure strategy Nash equilibria in market i involve a unique number, N*, of entering firms.
We can prove this by first constructing an equilibrium (as above) by ordering firms according to their profitability and then showing that any equilibrium must involve the same number of entering firms.
To construct an equilibrium, let c$~ be ordered from largest to smallest so that
Also, for notational convenience, let 4, be any finite number and let vi(0) = +m.
The equilibrium number of firms is then 4*,the largest element of the set of integers, n = (0,1,. . . ,K,), that satisfies vi(n) + > 0. That is,
q * = max {n: vi(n) +~$~,>/0}, O<n<K,
where n is understood to take on only integer values. Define a strategy vector s*
895 MODEL OF ENTRY
with sz = 1 for k G N* and sz = 0 for k > N*. It is easy to see from the definition of N* that s* is an equilibrium.
As noted, there may be other equilibria, as when firm N* and N* + 1 are such that one or the other (but not both) can make profits in the presence of firms 1 to (N* - 1). It is possible to show via a proof by contradiction to the definition of N* that all equilibrium strategy vectors have the same number of entering firms. First suppose there is some equilibrium with N firms, N > N*. Note that the smallest 4, of the entering firms can be no larger than 4,. Since firms make profits in equilibrium, v(N) + 4 , >, 0, which is a contradiction to the definition of N*. The proof for N < N* follows the same logic.
Given assumptions on the distribution of unobservables, the next section discusses how to derive the probability distribution of the unique equilibrium number of firms. A later section will discuss how an assumption on the order of entry can be used to define the probability that an individual firm enters.
3.2. A Functional Form for Profits
To estimate the model, I will require a parametric specification for the post-entry profit equation. Profits are assumed to depend on exogenous data (some of which are unobserved by the econometrician) and on the endogenous number of firms; the exact functional form is chosen largely for the tractability of the resulting estimation procedure. Specify the portion of profits that is common to all firms as
where Xi is a vector of market characteristics, N is the equilibrium number of firms, h is a function which is decreasing in N, and p, 6, and p are parameters to be estimated. The term ui, represents characteristics of the market that are observed by the firms, but not the econometrician. Berry (1989) shows that (2) can be explicitly derived (in logs) from a Cournot model with constant and identical marginal costs together with a constant-elasticity demand function. Under the Cournot assumption, p is a function of the parameters of the cost and demand equations, while h is a complicated nonlinear function of N and the elasticity of demand, S. I will set the function h(S, N) equal to the simpler function -S In (N). This expression has the advantage of declining in N at a declining rate and of allowing for a simple test that the number of firms matter^.^
The firm-specific portion of profits is specified as
(3) 4 i k = Zika + ~ U i k
where Zik is a vector of firm characteristics, while u and the vector a are parameters to be estimated; the term ui, is unobserved by the econometrician,
4 ~ e l o w ,I will note that this functional form is not empirically rejected by a more general specification.
896 STEVEN T. BERRY
but observed by all the firms. Equation (3) therefore assumes that fixed costs depend on (both observed and unobserved) firm characteristics.
Under these assumptions, the profits of firm k in market i are
(4) ~ ~ ~ ( N ) = X ~ / 3 - 8 1 n ( N ) + Z ~ , a + p u ~ , + u u ~ ~ .
Note that profits depend on observed and unobserved (to the econometrician) components, where the observed component is
(4a) r ik(N) =Xi@ - 8 In ( N ) Zika
and the unobserved component is
(4b) E~~ =uuik+puio.
I will further assume that uik and ui, are distributed i.i.d. standard normal across firms and markets.' The correlation of the unobservable E ~ , across firms in a given market is then P2. As is familiar from many discrete choice models, the units of profits are not identified in the estimation procedure discussed below. I will impose the traditional constraint that the variance of the unobserv- able ( E ~ ~ ) d q . 6equal one, via the restriction u =
3.3. The Distribution of the Equilibrium Number of Firms
The equilibrium number of firms in market i has a multinomial distribution, with the (K, + 1) distinct and mutually exclusive outcomes N,* = 0,1,. ..,Ki. Under the assumptions above, 8."is unique across all equilibria, so each event is well-defined. The probability that &* equals an arbitrary value N is the probability that the unobservables fall into a region that, given the parameters and observable data, leads to N equilibrium firms.
To understand the problem in calculating these probabilities, first consider a simple case with two potential entrants and a = 0 (so that there is no systematic difference between the firms). The pair E = (E,, E,) has the joint density function (conditional on the observed data and parameters) p ( ~ ) . With two firms, the probability of an N-firm equilibrium is trivially the integral of this density over the region of R2 that yields the desired equilibrium; this, however, begs the question of defining the region of integration.
For N* = 0 and N* = 2, the region of integration is quite simple. For example, the equilibrium number of firms equals zero if and only if for both firms v(1) + E, < 0. This implies a region of integration that is a simple (open) rectangle:
5 ~ nimportant extension would allow the unobservables to be correlated for a given firm across markets. In the present specification, profits are correlated across markets only via the correlation of observables.
6 ~ h i sparameterization of the variance could be extended by allowing for heteroskedasticity in the ci,. In particular, the parameters a and p could be allowed to depend on observed data.
897 MODEL OF ENTRY
It is more difficult to describe the set of unobservables that leads to N* = 1. This occurs when at least one E, satisfies u(1) + E, > 0, but less than two of the E, satisfy 4 2 ) + E~ > 0. This set is not a rectangle (for a graphical analysis of the case Ki = 2, see Berry (1989) or Bresnahan and Reiss (1991)). Define the set
Bkj= {E: E, > -v(1) and E~ < -u(2)}.
On the set Bkj, firm k would definitely make profits if N* = 1, but firm j might not. A one firm equilibrium occurs if and only if E is an element of either B,, or B,,. Note that B,, and B,, overlap on the region where both firms would make a profit in a one firm equilibrium, but neither would make a profit in a two firm equilibrium. (Interestingly, this is the set that yields multiple equilibria: either firm can enter but not both.) This implies
Prob ( N * = 1) = Prob ( E EB,,) + Prob ( E EB,,)
where each of the right-hand side probabilities can be written as a simple integral over an (open or closed) rectangle. There are other formulae for Prob (N" = I), but since the region of integration is not a rectangle, all involve a linear combination of simpler integrals.
As the dimension of integration 6.e. the number of potential entrants, K,) increases, the region of integration becomes increasingly complicated. Consider the general case with K potential entrants that vary in their observed character- istics. To derive the probability that N firms enter, first note the (definitional) condition that there will be less than ( N + 1) firms in any equilibrium if and only if no more than N firms could make profits in an ( N + 1) firm equilibrium. That is,
where the notation "#{A)"denotes the number of elements in the set A and rk(N) is again the observable portion of profits. The vector E satisfies the inequality condition in (5) if and only if it is a member of one of the disjoint sets
(E:#{E,: E, - rk (N + I)) = j ) ( j = O , ...,N).
The probability that N* <N is then the sum of the probabilities of these ( N + 1) sets. Let the probability of one of these sets be denoted Hj(,+,,; this is the probability that exactly J firms can make profits in a ( N + 1) firm equilib- rium. Then
898 STEVEN T. BERRY
where the set S(J) is equal to {s/C,s, =J ) , and the area A,(s, N ) is:
= ( - 0 3 , - rk (N) ) else.
That is, for s, = 1, the interval defined by A,(s, N) is the region of E, draws over which the kth firm could earn profits in a N-firm equilibrium. Note that the summation in (6) is over the sets of firms that could possibly be included in a J-firm collection of entrants. To obtain Prob (N* GN), the HJfN+ ,,are summed over possible values of J from 0 to N:
N
(7) P r o b ( N * < N ) = C H J ( , + , , . J = O
The probability of an N firm equilibrium finally follows as
This expression for the probability distribution of N* can be used to obtain maximum likelihood estimates of the model parameters. However, two prob- lems present themselves in the practical application of MLE. First, the multiple integrals in (6) will not have analytic solutions for many probability density functions p(s). This occurs, for example, when there are many potential entrants and the unobserved E ~ , are distributed normally. However, in this case the integrals in the summand of (6) could each be calculated by simple numeric integration, first conditioning on uio (leaving only the independent components u,,) and then numerically integrating out over the distribution of uio.
A more fundamental problem for MLE arises from the large number of possible combinations of entering firms, which leads to the summation in (6). For J firms, the number of elements in this summation is ( K , choose J). If the number of potential entrants is at all large, the size of this summation becomes quickly prohibitive. For example, the number of potential entrants in the airline sample of this paper goes as high as 26 while the number of actually entering firms is as large as 11. Consider now that the number indicated by (26 choose 11) is greater than seven million, which even for modern computers is a large number for the order of a summation over a set of 26-dimensional numerically calculated integrals. Consider also that the computation of more than seven million 26-dimensional integrals might have to be repeated hundreds of times in the course of an iterative MLE procedure with numerical gradients. Maximum likelihood clearly imposes a severe computational burden.
Note that the nature of the computational problem here is different from the multinomial discrete-choice problem discussed, for example, in McFadden (1989). The discrete-choice problem is one of high-dimensional integrals with difficult integrands; the problem here is primarily the difficult region of integra- tion.
I will consider two solutions to this problem. The first is to impose special case restrictions on the general model that yield tractability, while a second solution is to employ simulation estimators.
899 MODEL OF ENTRY
3.4. Some Special Cases
Remember that the profits are given by (4), together with the restriction u = i g : (4') r i k ( N ) =Xi@+ Zika- S In ( N ) + pu,, + 41 -P2uik.
Special cases of this profit function can yield easier expressions for Prob(N* =
N). One special case is the traditional probit model, obtained by restricting the profit function to be constant in N (6 = 0) and by letting the market specific effect u,, be identically zero ( p = 0). The assumption 6 = 0 would be reason- able, for example, in a market where price does not decline as firms enter and firm output is set by equating a rising marginal cost curve to the fixed price. A firm would then enter if its fixed cost was less than its variable profits, regardless of its competitors actions. Prices might be constant in N if (unlike in the airline industry) they are determined by a larger world market.
If we allow v(N) to decline in N, but still make the restriction p = 0, then another computationally feasible MLE strategy can be suggested. This strategy relies on the small number of integrals in (6) when N is small. In particular, we can focus on the three outcomes N* = 0, N* = 1, and N* 2. Note that the expression for the probability that N* = 0 requires calculating only one integral, while the expression for the probability that N* G 1requires only K integrals. Given p = 0, each of these integrals is easy to calculate. However, it is difficult to use the information on more than three outcomes: the expression for the probability that N* G 2 requires the calculation of more than 600 integrals when K = 26.
These first two special cases involve no within market correlation in unobserv- able~.A third special case involves perfect correlation between the unobserv- able~, impiying no unobserved firm heterogeneity (p = 1 and c$,, = Zika). If a also equals zero and K, is very large, then this is a version of the traditional entry model which suggests that all firms are equally profitable after entry and that there is an effectively infinite supply of potential entrants. Discussions of this model often focus on the number of firms that a market can support.
This special case generates the familiar ordered probit. Profits are given by r i k ( N )= vi(N) + c$,, + u,,, where c$ik is observed. Once again, order the firms from most to least profitable so that 4i,> c$,, > . . . > The probability that N or more firms enter is then the probability that v(N) + c$, + u, > 0, which can be calculated from a single one-dimensional integral over the density of u,.
The simple ordered probit uses information on the equilibrium number of firms and not on the identities of entering firms. Note, however, that this "observed heterogeneity" model has the severe defect of placing strong restric- tions on possible combinations of entering firms. Since all heterogeneity is observed, if firm k enters and firm j does not, simple subtraction of profit functions gives
Z,a -Z ja > 6(ln(N*) - ln(N* + 1)).
900 STEVEN T. BERRY
That is, Zja cannot be much larger than Z,a. Therefore, the model defines zero probability events on the identities of entering firms: the model imposes a deterministic limit on the possible differences between the observed characteris- tics of entering and nonentering firms. Estimates provided below reject this restriction. Thus, ordered probit models do not seem appropriate for analyzing firm-specific sources of profit or the entry choices of individual firms.
The special cases above are distinguished by their assumptions on parameter values (e.g., 6 = 0 or p = 0.) A question arises as to what empirical relationships might distinguish among the different models. One commonly noted empirical pattern in regional markets is that larger markets have a larger number of firms. We will see that this relationship is not useful for distinguishing between models: the positive correlation of N" and market size can be explained both by identical firms with profits which decline in N 6.e. 6 > 0) and by firm hetero- geneity (i.e. 6 = 0 but p < 1or a # 0). However, one can show that differences in the number of potential entrants may help to distinguish between these two special cases.
Profits which decline in N are a common existing explanation for the correlation of market size with numbers of firms. Less frequently noted is that firm heterogeneity is also a sufficient explanation. Consider a set of markets with firms having heterogeneous costs and with entry occurring when costs fall below some threshold level. Suppose that there are the same number of potential entrants in each market, but that an increase in demand increases the threshold level of costs. In this case, more firms will enter a large market even if firm profits (and the threshold level itself) are not declining in the number of firms.
However, the two models are distinguished by the effect of an increase in the number of potential entrants, K,. The simple model without heterogeneity ( a = 0, p = 1) implies that the probability of an N firm equilibrium does not vary as Ki increases beyond N. This nonparametric implication follows directly from the entry condition, vi(N) + ui, > 0. Consider now the simplest probit with 6 =a =p = 0. Entry in this model is determined by the number of times a random variable crosses a common threshold. Nj:" is therefore the number of "successes" in an individual entry experiment. It follows that the expected number of firms will have an exact linear relationship to the number of potential entrants: E(N*) =pKi, where p is the probability of crossing the threshold. (When p z 0, the expected number of firms is still an exact linear function of K,.)
While I will not attempt to test these nonparametric implications, it is useful to note that there are nonparametric differences between the models, implying that identification is not exclusively a matter of functional form.
3.5. The Order of Entry
As a fourth special case, I will consider assumptions on the order of entry decisions. Such assumptions allow for probability statements about the identities
MODEL OF ENTRY 901
of entering firms. This follows from the well-known result that, within the class of models examined here, ordered entry implies a unique subgame perfect eq~ilibrium.~If more profitable firms move first, then any ambiguity as to which firm will enter is decided in favor of the more profitable firm.
If an entry order other than profitability is appropriate, the determination of the identity of entering firms is more difficult. Regardless of the order of entry, any firm that can make profits in an N + 1 equilibrium will enter in an N-firm equilibrium. Say there are L of these firms, with L g N. The remaining N -L entry positions will be filled by the first N -L movers among the firms that would be profitable in an N-firm equilibrium, but not in an N + 1 firm equilibrium.
The empirical work presented below employs two assumptions on the order of entry. The first is that the most profitable firms move first. The second assumption is that incumbents move first, with more profitable incumbents moving before other incumbents and more profitable entrants moving before other entrants.' In the airline industry, this latter assumption may be reasonable if the incumbents and the more profitable firms are those firms who control the airport bureaucracy and who thereby gain a "first mover" advantage. Unfortu- nately, no assumptions on the order of entry will provide a simple solution to the problem of an overly complex MLE procedure.
4. A SIMULATION ESTIMATOR
Simulation estimators (McFadden (1989) and Pakes and Pollard (1989)) provide a straightforward solution to the problem of calculating Prob(N* =N ) . To begin, it is useful to transform the problem into a nonlinear regression framework. Note that one can always define a "prediction error" vi,, as the difference between the observed equilibrium number of firms and the (condi- tional) expectation of the equilibrium number:
where is the exogenous data for market i (i.e. the market and firm characteristics, Xiand Zi,, k = 1,. . . ,K , ) and 19 is the vector of model parame- ters, (p ,6, a,p). By construction, when vi, is evaluated at the true parameter value, f?*, it is mean independent of the exogenous data:
Given this condition (together with some standard regularity conditions), it is possible to employ the restriction in (9) to estimate 8 via a standard nonlinear regression, or method of moments (Hansen (1982)) technique. The equation to
'~resnahan and Reiss (1991) also discuss the possibility of obtaining a unique equilibrium by imposing an entry order in empirical entry models.
8A referee has suggested that ordering entry by post-entry profitability can be justified as in Judd (1985) by assuming a post-entry "war of attrition" which would instantly eliminate less profitable firms if more than N* firms entered.
902 STEVEN T. BERRY
be estimated can be written as
N,* =R(w, ,e) +v~,,
where G(K, 8) =E[N*/K, 81. Unfortunately, # is itself difficult to compute, as its definition involves the
probability of an N-firm equilibrium: Ki
H ( w ; , B )= zn P r ( N * = n / w , 8 ) . n = l
A simulation estimator can, however, be formed in the present context by replacing the difficult to calculate expected value with a simulated, unbiased estimate. Suppose that, given some h e 9 set of random draws, G,, for each market, we could calculate an estimate, N, with the property:
(10) ~ ~ [ i C - ( w , O , o ) ]= R ( w , 8 ) .
This in turn suggests a new estimating equation
(11) &.*= i C - ( ~ , e , a ~ )+ Since Z? is an unbiased estimator of N,the new prediction error, ;,,, is also mean independent of the exogenous data at the true parameter values. This suggests that nonlinear regression (or method of moments) techniques may still be appropriate to estimate 0. Under regularity conditions which are satisfied here, McFadden (1989) and Pakes and Pollard (1989) show that this suggestion is correct.
One estimator of the form in (lo), sometimes called a "frequency estimator," is found by taking, for each market, independent draws from the distribution of the structural errors (u,,, ui,, .. . ,uiKi).A simulated estimator of profits can be constructed using a single draw from this distribution. Call one such draw Gi, a (Ki + 1) vector of standard normals. For firm k, the simulated estimator of profits is
which is just the expression for profits in (49, with the simulated draws replacing the actual structural errors. An unbiased estimate of the expected number of firms is then
(12) ri(lV., 8, Gi) = Max (n: #{k: e ik (n , li,) z 0}>, n),O < n < K ,
which, given the simulation draws, is again the largest integer n such that at least n firms are profitable in an n-firm equilibrium. The estimate in (12) can be averaged across multiple simulated draws to reduce the variance of the estimate while preserving unbiasedness. That is, one can take T draws, Gi = (G!, .. . ,GT) and calculate
903 MODEL OF ENTRY
This equation for 8can then be substituted into the estimating equation (11). If an order of entry is imposed, information on the number of entering firms can also be used. The likelihood function for the probability of entry of an individ- ual firm becomes even more complex, but the Appendix shows that it is relatively straightforward to extend the simulation estimator to account for an order of entry. This Appendix provides further details on the estimation procedure used below, including a discussion of the exact moment conditions used for estimation and of computational problems which arise.
5. DATA AND ESTIMATES
5.1. The Data
The data used in this analysis are from the Origin and Destination Survey of Air Passenger Trafic, which is commonly referred to as the O & D survey. These data were originally collected by the Civil Aeronautics Board and are now collected by the U.S. Department of Transportation.
The O&D consists in its most basic form of a 10% random sample of all airline passenger tickets issued by U.S. airlines. A summary version of the data is contained in Data Bank 4; this data bank is the source of the airline data presented in this paper. Data Bank 4 gives the number of passengers who travelled on a given airline between two cities on an "origin and destination" basis. This means that passengers are tracked from starting to ending point (on a single airline) without regard to connections which may have been made. Thus entry on an origin and destination basis need not involve any nonstop flights between the cities of a pair-adding appropriate connecting flights through hubs will suffice. Also, data bank 4 does not contain price information. In order to reduce the size of the data set, the sample used in this analysis includes only the city pair routes which connect the fifty largest U.S. cities. There are thus 1225 possible city pair combination^.^ In cities with multiple airports, data bank 4 does not distinguish service to or from different airports in the same city.
In using the O & D data, an important issue arises concerning the definition of markets and of firms that operate within markets. The origin and destination basis of the data leads naturally to a definition of a market as the market for air passenger travel between two cities, irrespective of intermediate transfer points. However, it is sometimes the case that the O & D survey will list a firm as carrying only a very few passengers between two cities. Some of these data points may represent coding errors and some may represent passengers who take a tortuous number of intermediate points to fly between two cities. It seems unreasonable to classify these firms as actively serving the indicated market. I will therefore define a firm as serving a market if at least 90 passengers appear in the 10% sample represented by the O&D survey. This is the same level adopted in Bailey, et al. (1985) and indicates approximately the
9 ~ olistings appeared for 6 city-pairs in the O&D survey. These omissions may represent coding errors, so these 6 pairs were omitted from the sample.

904 STEVEN T. BERRY
number of passengers that would be carried on a once a week flight by a medium-size jet. The special-case results presented below were affected very little by changes in this standard.
To construct entry and exit variables, it is necessary to focus on a particular unit of time. A single data tape from the O&D survey includes information from three quarters. I am therefore able, from a single tape, to compare two time periods which are six months apart. For the present analysis, the first period is the first quarter of 1980 and the second period is the third quarter of 1980. These periods are after the effective deregulation of the industry and prior to the air traffic controllers strike and the recent airline industry merger wave. The 1980 date is also interesting because many of the early studies of the deregulated industry focused on this year.
The six-month time period is probably long enough for an airline to plan and execute an entry decision, but it is not so long that fundamental cost and demand factors are likely to change. This makes it possible to focus on factors, such as strategic decisions, that may affect entry in the short run while abstracting from long-run changes in the size of markets or in factor prices.
New entry into a market is defined to occur in the sample when a firm which did not operate in a city pair market in the first period operates in the second period. Exit is defined in an analogous fashion. Note that the phrase "new entrant" thus does not include incumbent firms (who can still be thought of as second period "entrants" in the sense of the model above).
5.2. Some Descriptive Results
Before turning to estimates of the formal entry model, I will briefly consider some simple descriptive results which are consistent with the idea that airport presence is correlated with entry decisions into airline city pair markets and are also consistent with important differences in firm profitability across markets; that is, different firms appear to be heterogeneously suited to serve different markets.
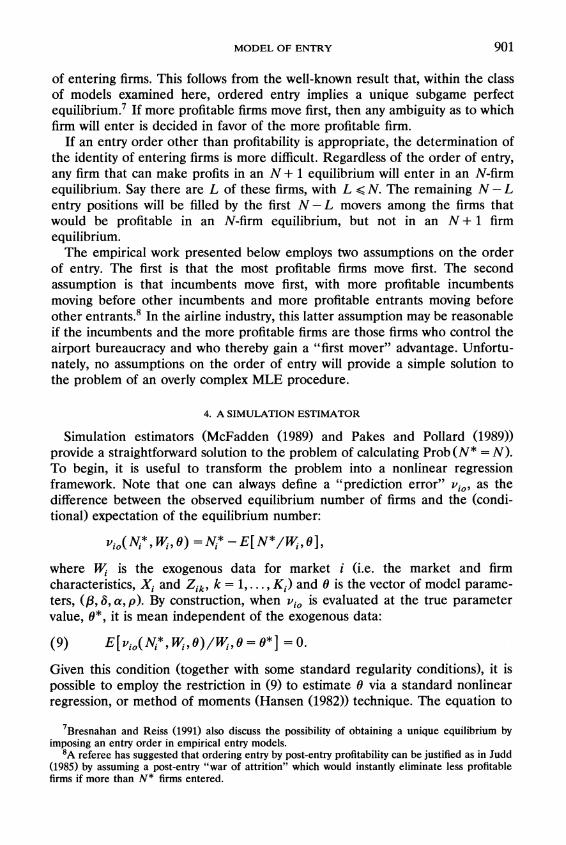
We can first note that both exit and new entry are common events in this sample: new entry occurs in over 20% of the markets while exit occurs in about 14% of the 1219 markets. Across the sample of markets, exit and new entry are slightly positively correlated. Table I gives some further insight into the joint distribution of exit and new entry across city pair markets. In 3.37% of the markets, there is both exit and new entry. Restricting attention to those markets where two firms newly enter and/or exit, we can observe that one new entrant and one exit occurs in a higher percentage of cases than two new entrants or two exits.
The positive correlation between exit and new entry is consistent with the presence of heterogeneity between firms within markets: if entry and exit are driven only by changes in market conditions that are common to a group of identical firms, then there is no reason for new entry and exit to occur in the same market. Of course, this heterogeneity need not consist entirely of different
MODEL OF ENTRY
TABLE I THE JOINT FREQUENCY OF ENTRY OF TOTALDISTR~BUTION AND EXIT,IN PERCENT
MARKETSSERVED
Number of Exits, as % of Total Markets in the Sample: 0 1 2 3 + Total
Number 0 68.50 10.01 1.07 0.00 79.57 of 1 15.09 2.63 0.41 0.00 18.13 Entrants (as %)
2 3 +
1.96 0.16
0.25 0.08
0.00 0.00
0.00 0.00
2.05 0.24
Total 85.56 12.96 1.48 0.00 100.00
TABLE I1
# of # of # of % of % of Markets Markets Markets Markets Markets
Airline Served Entered Exited Entered Exited
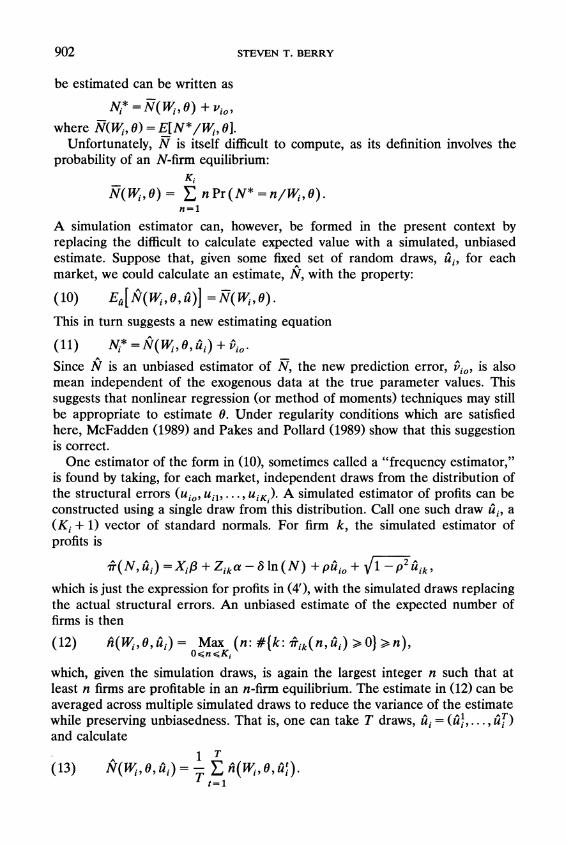
Delta Eastern United American USAir TWA Braniff Northwest Republic Continental Piedmont Western Pan Am Ozark Texas Int'l
hub structures. One possible explanation is that some airlines are simply more profitable in all situations when compared to their rivals. In this case, we will observe that some firms systematically enter new markets while other firms systematically exit markets.
Note, given the origin and destination nature of the sample, that firms need not exit from any markets in order to develop a hub system. Passengers can continue to be routed between the same city pairs but will simply transfer at hub cities. Thus, the development of hub systems does not guarantee a positive correlation between firm's new entry and exit rates.
Table I1 lists the 15 largest firms, by number of large-city sample markets served in the first period, and the number of markets newly entered and exited by each firm. The results of this table are notable in that nearly all firms (except Pan Am) exhibit both substantial entry behavior and substantial exit behavior. The correlation across firms between percentage of markets newly entered and exited is strongly positive at .695. This is again consistent with the idea that firms are heterogeneously suited to serve different markets.

STEVEN T. BERRY
TABLE 111 NUMBEROF POTENTIALENTRANTS, OF CITIESSERVEDBYNUMBER WITHIN
A C I ~ NUMBER ENTERINGPAIR,WITH AND PERCENTAGE
Total # Number of of Potential
Cities Served Entrants # Entering % Entering
0 47600 4 0.01% 1 12650 45 0.36 2 3590 232 6.46
If entry behavior provides clues to underlying profitability and if profits are related to airport presence and hubbing, then we may find a relationship between new entry and airport presence. Table I11 measures a firm's airport presence in a market simply by the number of cities in a city pair which are served by an airline which is a potential new entrant. Here, a potential new entrant is a firm which does not serve the city pair market in the first period.
To interpret Table 111, note that there are 65826 firm/market combinations in the sample. Of these combinations, 63840 represent potential new entrants and 1986 represent incumbent firms. Of the potential entrant combinations, 47600 represent firms which do not serve any route out of either city. Only 4 out of the 47600 potential entrants that did not serve either city of a pair entered into that pair in the second period. This is an entry rate for these firms of 0.01%. In contrast, 0.36% of the potential entrants which served one city of a pair, and 6.46% of the 3590 potential entrants which served both cities, decided to enter. So few of the decisions to actually enter are taken by firms which have no presence in either market that the following analysis will implicitly set the entry probability for these firms to zero.
The importance of prior service to both cities in a pair raises challenges to potential explanations of hubbing. This feature of the data, together with the within firm correlation of entry and exit, seems to indicate that firms are doing more than adding spokes to existing hubs (it is not possible to differentiate modes of entry from the pure origin and destination data). It may indicate the advantages of access to the bureaucracy of both cities' airports, to cost economies of multi-hub networks, or to city-specific product differentiation advantages.
Alternatively, perhaps firms who serve both cities are on average firms who have large hub operations out of one city. The discrete measure used in Table I11 cannot address the question of how continuous increases in airport presence will affect airline profitability. The specifications for the formal model which are given below will allow for such continuous variables in addition to the "two-city effect" uncovered here.
Table I11 presents evidence on the new entry decisions of individual firms; another way of looking at entry is to consider the determinants of the total number of firms in the market (note that the formal model integrates these approaches). Evidence on the correlates of the equilibrium number of firms will
MODEL OF ENTRY
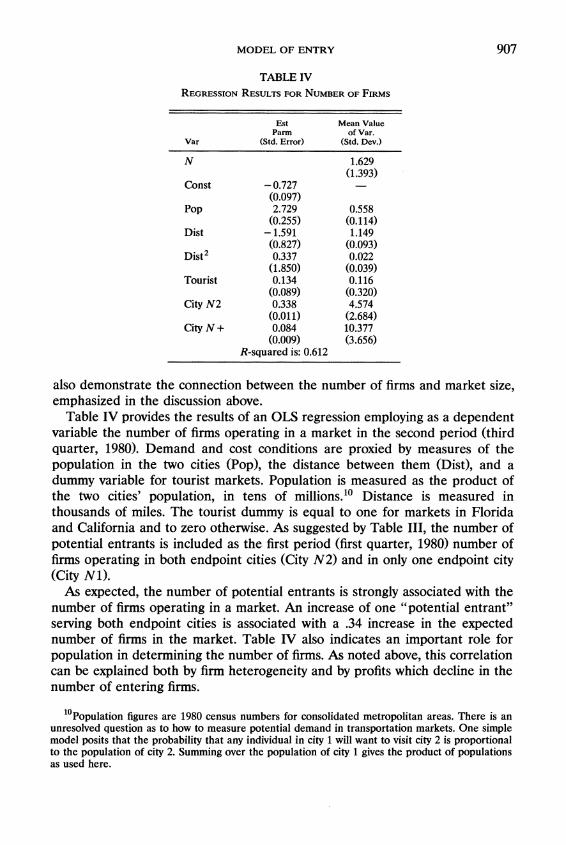
TABLE IV REGRESSIONRESULTS OF FIRMSFOR NUMBER
Est Mean Value P a m of Var.
Var (Std. Error) (Std. Dev.)
N
Const -0.727 (0.097)
POP 2.729 (0.255)
Dist -1.591 (0.827)
~ i s t 0.337 (1.850)
Tourist 0.134 (0.089)
City N 2 0.338
City N + (0.011) 0.084
(0.009) R-squared is: 0.612
also demonstrate the connection between the number of firms and market size, emphasized in the discussion above.
Table IV provides the results of an OLS regression employing as a dependent variable the number of firms operating in a market in the second period (third quarter, 1980). Demand and cost conditions are proxied by measures of the population in the two cities (Pop), the distance between them (Dist), and a dummy variable for tourist markets. Population is measured as the product of the two cities' population, in tens of millions.1° Distance is measured in thousands of miles. The tourist dummy is equal to one for markets in Florida and California and to zero otherwise. As suggested by Table 111, the number of potential entrants is included as the first period (first quarter, 1980) number of firms operating in both endpoint cities (City N2) and in only one endpoint city (City Nl).
As expected, the number of potential entrants is strongly associated with the number of firms operating in a market. An increase of one "potential entrant" serving both endpoint cities is associated with a .34 increase in the expected number of firms in the market. Table IV also indicates an important role for population in determining the number of firms. As noted above, this correlation can be explained both by firm heterogeneity and by profits which decline in the number of entering firms.
'O~opulation figures are 1980 census numbers for consolidated metropolitan areas. There is an unresolved question as to how to measure potential demand in transportation markets. One simple model posits that the probability that any individual in city 1 will want to visit city 2 is proportional to the population of city 2. Summing over the population of city 1 gives the product of populations as used here.
STEVEN T. BERRY
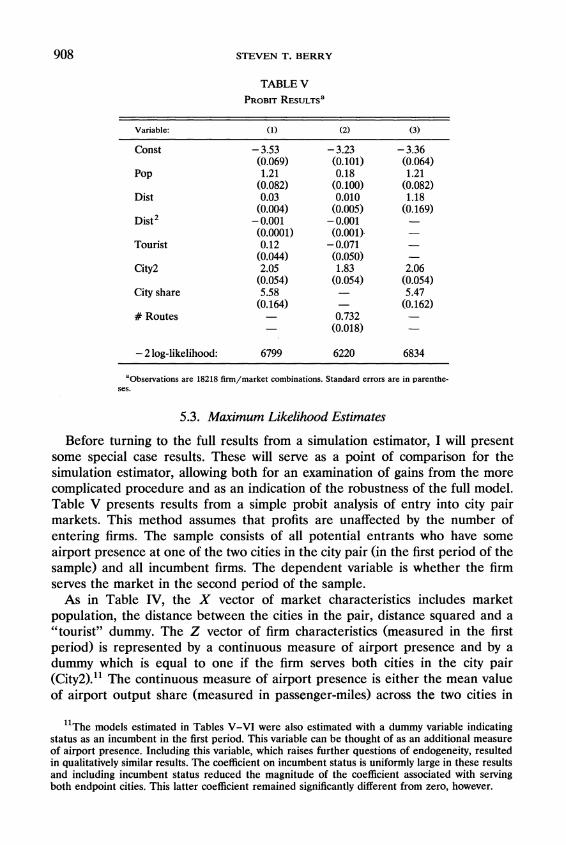
TABLE V
PROBIT RESULTS~
Variable: (1) (2) (3)
Const
POP
Dist
~ i s t '
Tourist
City2
City share
# Routes
-2 log-likelihood:
aObsewations are 18218 firm/market combinations. Standard errors are in parenthe- ses.
5.3. Maximum Likelihood Estimates
Before turning to the full results from a simulation estimator, I will present some special case results. These will serve as a point of comparison for the simulation estimator, allowing both for an examination of gains from the more complicated procedure and as an indication of the robustness of the full model. Table V presents results from a simple probit analysis of entry into city pair markets. This method assumes that profits are unaffected by the number of entering firms. The sample consists of all potential entrants who have some airport presence at one of the two cities in the city pair (in the first period of the sample) and all incumbent firms. The dependent variable is whether the firm serves the market in the second period of the sample.
As in Table IV, the X vector of market characteristics includes market population, the distance between the cities in the pair, distance squared and a "tourist" dummy. The Z vector of firm characteristics (measured in the first period) is represented by a continuous measure of airport presence and by a dummy which is equal to one if the firm serves both cities in the city pair (City2).11 The continuous measure of airport presence is either the mean value of airport output share (measured in passenger-miles) across the two cities in
h he models estimated in Tables V-VI were also estimated with a dummy variable indicating status as an incumbent in the first period. This variable can be thought of as an additional measure of airport presence. Including this variable, which raises further questions of endogeneity, resulted in qualitatively similar results. The coefficient on incumbent status is uniformly large in these results and including incumbent status reduced the magnitude of the coefficient associated with serving both endpoint cities. This latter coefficient remained significantly different from zero, however.
MODEL OF ENTRY
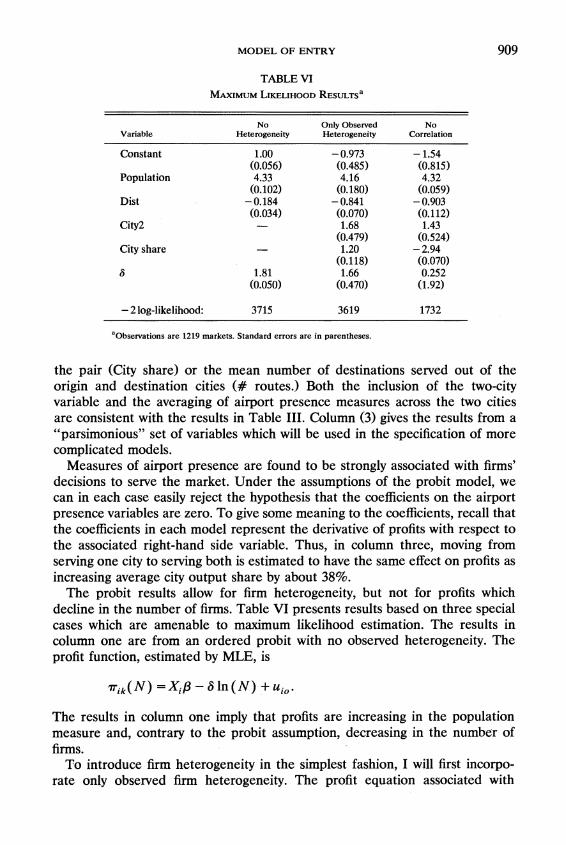
TABLE VI MAXIMUM RESULTS~LIKELIHOOD
No Only Observed No Variable Heterogeneity Heterogeneity Correlation
Constant 1.00 (0.056)
Population 4.33 (0.102)
Dist -0.184 (0.034)
City2 -
City share -
-2 log-likelihood: 3715 3619 1732
"Observations are 1219 markets. Standard errors are in parentheses.
the pair (City share) or the mean number of destinations served out of the origin and destination cities (# routes.) Both the inclusion of the two-city variable and the averaging of airport presence measures across the two cities are consistent with the results in Table 111. Column (3) gives the results from a "parsimonious" set of variables which will be used in the specification of more complicated models.
Measures of airport presence are found to be strongly associated with firms7 decisions to serve the market. Under the assumptions of the probit model, we can in each case easily reject the hypothesis that the coefficients on the airport presence variables are zero. To give some meaning to the coefficients, recall that the coefficients in each model represent the derivative of profits with respect to the associated right-hand side variable. Thus, in column three, moving from serving one city to serving both is estimated to have the same effect on profits as increasing average city output share by about 38%.
The probit results allow for firm heterogeneity, but not for profits which decline in the number of firms. Table VI presents results based on three special cases which are amenable to maximum likelihood estimation. The results in column one are from an ordered probit with no observed heterogeneity. The profit function, estimated by MLE, is
The results in column one imply that profits are increasing in the population measure and, contrary to the probit assumption, decreasing in the number of firms.
To introduce firm heterogeneity in the simplest fashion, I will first incorpo- rate only observed firm heterogeneity. The profit equation associated with
910 STEVEN T. BERRY
column two of Table VI is
r i k ( N ) =Xip+Zikcu-6ln(N) +ui,,
where Zi, is again a vector of firm-specific variables. In this model, the unobserved effect is common to all firms within a market. The observed heterogeneity is captured in column two by the same variables as in the "parsimonious" probit of Table V. The likelihood function, discussed above, uses the observed equilibrium number of firms, but not the identities of entering firms. Each of the coefficients of interest is significantly different from zero at traditional significance levels. The derivative of profits with respect to an increase in population is more than three times greater than in the correspond- ing probit case, while the coefficient on average city output share is less than one-quarter as large. This is consistent with the idea that increases in N*, ignored by the probit model, are likely to be positively correlated with popula- tion and negatively correlated with the firm's own share of city output.
As noted above, the no unobserved heterogeneity assumption places very strong restrictions on the identities of entering firms. These restrictions are frequently violated by the observed data at the parameter estimates provided in column two. Only by setting the coefficients on the observed heterogeneity very close to zero are the restrictions satisfied. Thus, the coefficients in column two are not appropriate for discussing the identities of entering firms and, as argued above, the case with only observed heterogeneity does not appear to be a satisfactory model.
As noted, it is possible to apply maximum likelihood methods to a model with no correlation in unobservables across firms, but we are restricted to consider only the outcomes N* = 0, N* = 1, and N* 2. The profit equation associated with this special case is:
r i k ( N ) =XiP + Zika- 6 l n ( N ) + uik.
The results from this model, in column three of Table VI, are surprising in that they indicate a statistically significant negative association between city output share and firm profits. Furthermore, the effect of the number of entering firms is small and statistically insignificant. We might speculate that these "contrary" results stem from the censoring of information on the number of entering firms when this number is greater than one. Or, perhaps the assumption of no common market-heterogeneity affects the results. To resolve these contradictory results, I will return to the general model.
5.4. Results from the Simulation Estimator
Table VII provides results for equation (4'). These are obtained by a simula- tion estimator that assumes an order of entry, so that the identities of entrants are empirically useful. The first column of Table VII assumes only that the most profitable firms move first, whereas the second column assumes that incumbents move first, with the remainder of the entry order set in order of profitability.
The coefficients on firm-specific characteristics in Table VII are broadly similar in sign and significance to the results in Tables V and VI. In comparing
MODEL OF ENTRY
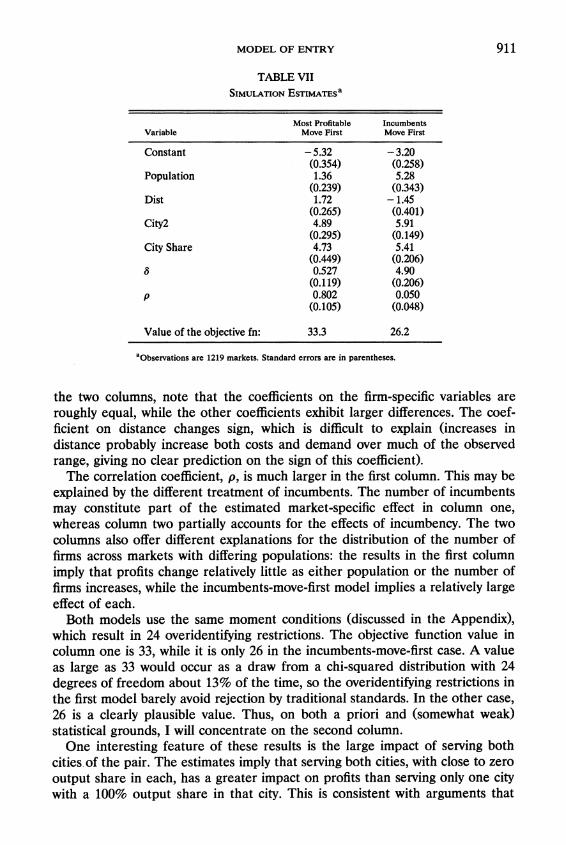
TABLE VII SIMULATIONESTIMATES~
Most Profitable Incumbents Variable Move First Move First
Constant -5.32 -3.20
Populat ion (0.354) 1.36
(0.258) 5.28
D i s t (0.239) 1.72
(0.343) -1.45
City2 (0.265) 4.89
(0.401) 5.91
(0.295) (0.149) City Share 4.73 5.41
6 (0.449) 0.527
(0.206) 4.90
(0.119) (0.206) P 0.802 0.050
(0.105) (0.048)
Value of t h e objec t ive fn: 33.3 26.2
aObse~ationsare 1219 markets. Standard errors are in parentheses.
the two columns, note that the coefficients on the firm-specific variables are roughly equal, while the other coefficients exhibit larger differences. The coef- ficient on distance changes sign, which is difficult to explain (increases in distance probably increase both costs and demand over much of the observed range, giving no clear prediction on the sign of this coefficient).
The correlation coefficient, p, is much larger in the first column. This may be explained by the different treatment of incumbents. The number of incumbents may constitute part of the estimated market-specific effect in column one, whereas column two partially accounts for the effects of incumbency. The two columns also offer different explanations for the distribution of the number of firms across markets with differing populations: the results in the first column imply that profits change relatively little as either population or the number of firms increases, while the incumbents-move-first model implies a relatively large effect of each.
Both models use the same moment conditions (discussed in the Appendix), which result in 24 overidentifying restrictions. The objective function value in column one is 33, while it is only 26 in the incumbents-move-first case. A value as large as 33 would occur as a draw from a chi-squared distribution with 24 degrees of freedom about 13% of the time, so the overidentifying restrictions in the first model barely avoid rejection by traditional standards. In the other case, 26 is a clearly plausible value. Thus, on both a priori and (somewhat weak) statistical grounds, I will concentrate on the second column.
One interesting feature of these results is the large impact of serving both cities of the pair. The estimates imply that serving both cities, with close to zero output share in each, has a greater impact on profits than serving only one city with a 100% output share in that city. This is consistent with arguments that
912 STEVEN T. BERRY
access to airport bureaucracies is an important determinant of profits. However, the large coefficient may also be proxying for otherwise ignored effects of incumbency.
It is clear that parameterizing profits as a linear function of log N is restrictive and that this may influence the estimate of 6 . To test the importance of this restriction, I also estimated a somewhat more general model with separate intercept terms in the profit function for N = 1, N = 2, N = 3, and N = 4. For N > 4, the profit function continued to decline linearly with In(N). The results were qualitatively similar and the specification of (4') could not be rejected against the more general model.
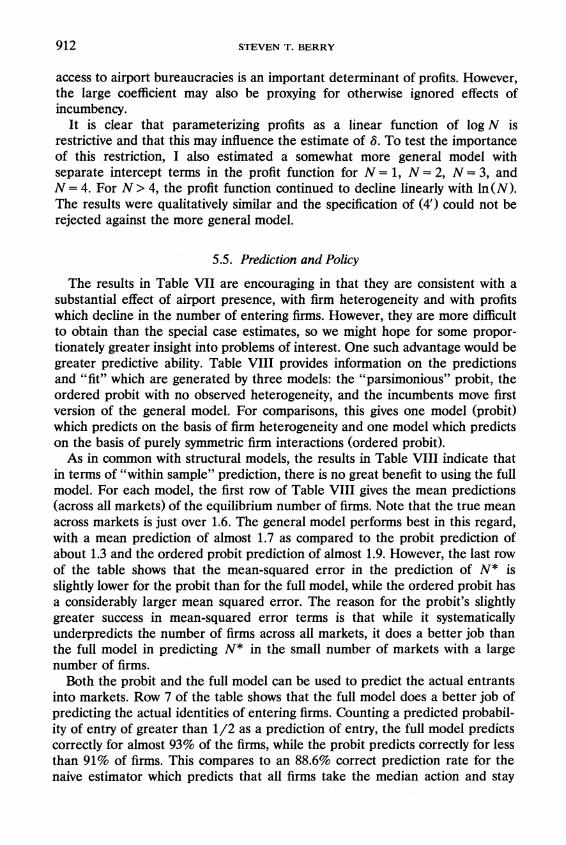
5.5. Prediction and Policy
The results in Table VII are encouraging in that they are consistent with a substantial effect of airport presence, with firm heterogeneity and with profits which decline in the number of entering firms. However, they are more difficult to obtain than the special case estimates, so we might hope for some propor- tionately greater insight into problems of interest. One such advantage would be greater predictive ability. Table VIII provides information on the predictions and "fit" which are generated by three models: the "parsimonious" probit, the ordered probit with no observed heterogeneity, and the incumbents move first version of the general model. For comparisons, this gives one model (probit) which predicts on the basis of firm heterogeneity and one model which predicts on the basis of purely symmetric firm interactions (ordered probit).
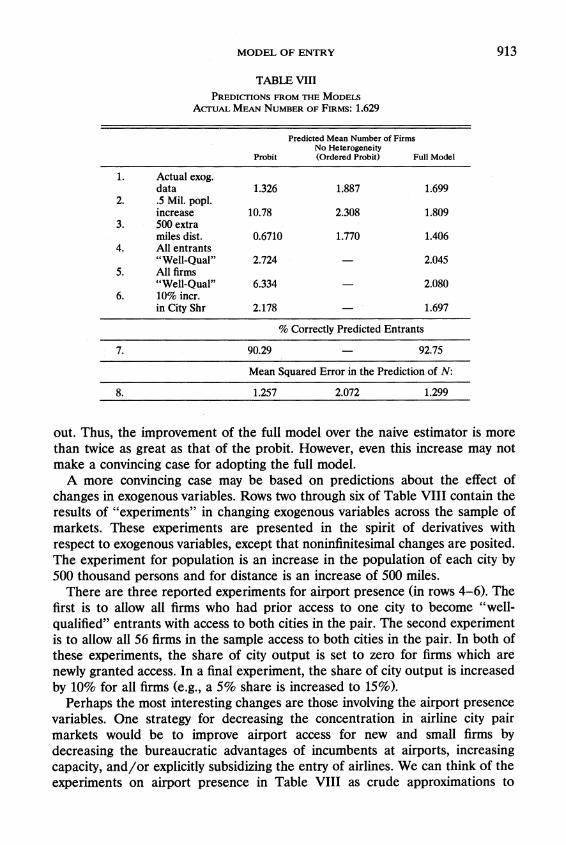
As in common with structural models, the results in Table VIII indicate that in terms of "within sample" prediction, there is no great benefit to using the full model. For each model, the first row of Table VIII gives the mean predictions (across all markets) of the equilibrium number of firms. Note that the true mean across markets is just over 1.6. The general model performs best in this regard, with a mean prediction of almost 1.7 as compared to the probit prediction of about 1.3 and the ordered probit prediction of almost 1.9. However, the last row of the table shows that the mean-squared error in the prediction of N* is slightly lower for the probit than for the full model, while the ordered probit has a considerably larger mean squared error. The reason for the probit's slightly greater success in mean-squared error terms is that while it systematically underpredicts the number of firms across all markets, it does a better job than the full model in predicting N* in the small number of markets with a large number of firms.
Both the probit and the full model can be used to predict the actual entrants into markets. Row 7 of the table shows that the full model does a better job of predicting the actual identities of entering firms. Counting a predicted probabil- ity of entry of greater than 1/2 as a prediction of entry, the full model predicts correctly for almost 93% of the firms, while the probit predicts correctly for less than 91% of firms. This compares to an 88.6% correct prediction rate for the naive estimator which predicts that all firms take the median action and stay
MODEL OF ENTRY
TABLE VIII PRED~CTIONSFROM THE MODELS
ACTUAL MEAN NUMBER OF FIRMS:1.629
Predicted Mean Number of Firms No Heterogeneity
Probit (Ordered Probit) Full Model
1. Actual exog. data 1.326 1.887 1.699
2. .5 Mil. popl. increase 10.78 2.308 1.809
3. 500 extra miles dist. 0.6710 1.770 1.406
4. All entrants "Well-Qual" 2.724 - 2.045
5. All firms "Well-Qual" 6.334 - 2.080
6. 10% incr. in City Shr 2.178 - 1.697
% Correctly Predicted Entrants
Mean Squared Error in the Prediction of N:
out. Thus, the improvement of the full model over the naive estimator is more than twice as great as that of the probit. However, even this increase may not make a convincing case for adopting the full model.
A more convincing case may be based on predictions about the effect of changes in exogenous variables. Rows two through six of Table VIII contain the results of "experiments7' in changing exogenous variables across the sample of markets. These experiments are presented in the spirit of derivatives with respect to exogenous variables, except that noninfinitesimal changes are posited. The experiment for population is an increase in the population of each city by 500 thousand persons and for distance is an increase of 500 miles.
There are three reported experiments for airport presence (in rows 4-6). The first is to allow all firms who had prior access to one city to become "well- qualified7' entrants with access to both cities in the pair. The second experiment is to allow all 56 firms in the sample access to both cities in the pair. In both of these experiments, the share of city output is set to zero for firms which are newly granted access. In a final experiment, the share of city output is increased by 10% for all firms (e.g., a 5% share is increased to 15%).
Perhaps the most interesting changes are those involving the airport presence variables. One strategy for decreasing the concentration in airline city pair markets would be to improve airport access for new and small firms by decreasing the bureaucratic advantages of incumbents at airports, increasing capacity, and/or explicitly subsidizing the entry of airlines. We can think of the experiments on airport presence in Table VIII as crude approximations to
914 STEVEN T. BERRY
policies which increase airport access. More refined experiments will require much more detailed models of airport operation.
As would be expected from the structure of the models, the probit model systematically overpredicts the effects of increased airport access, relative to the full model. The second experiment (row 5 ) is particularly dramatic: the probit model predicts an average increase of about 5 firms per market versus the full model's prediction of about 0.4 extra firms. The estimates from the full model imply that most markets are not able to support more than 2 firms with zero city-shares, even if these firms are granted prior access to both airports. The probit model similarly overstates, relative to the other two models, the effect of a small increase in population. These results follow logically from the lack of strategic interaction in the probit model.
Thus, structural models which incorporate firm heterogeneity and strategic interactions appear to be important not because they provide substantially better within sample prediction, but because they capture policy-relevant effects which simpler models ignore. This is not to argue that the current model should be treated as the last word in performing policy experiments, but rather that any policy-relevant model should account for firm heterogeneity and strategic inter- action. Note especially that since the results use information only on entry, they cannot be used for welfare analysis. For example, while a small increase in N may suggest a small welfare effect, the results are consistent with "fierce" price competition in which a small increase in N generates a large benefit to consumers. Similarly, potential entry may keep prices down even in the absence of actual entry.
6. CONCLUSION
This paper studies the issue of airlines' airport presence by treating the entry decisions of airlines as an indication of underlying profitability. Two issues receive the bulk of the methodological focus of the paper: simple strategic interactions between firms and firm heterogeneity. This last issue, which is obviously crucial to a study of differences in profitability between firms, is found to present difficulties which are not addressed in the growing literature on empirical models of oligopoly entry. Specifically, in straightforward representa- tions of the entry problem for a large number of firms, the region of integration of the integral defining the probability of events is exceedingly complex. The recently introduced simulation estimators are found to present a solution to this problem.
The estimates obtained are consistent with the large literature that indicates an important role for airport presence in determining airline profitability. However, the preferred estimates also imply that profits decline fairly rapidly in the number of entering firms. Thus, the estimates presented imply that efforts to decrease city pair concentration by increasing airport access will be to some degree offset by competition within city pairs: even as the number of potentially profitable firms increases, within-market competition will limit the number of
915 MODEL OF ENTRY
entering firms. Simple models, such as probit, which focus on firm heterogeneity but not on interactions between firms, may greatly exaggerate the effect of policies to increase airport access. However, the models of this paper do not fully describe post-entry competition or the full dynamics of entry; a complete study of the welfare effects of different policies toward airport presence remains to be completed.
Dept. of Economics, Yale University, P.O. Box 1972 Yale Station, New Haven, CT 06520-1972, U.S.A.
and National Bureau of Economic Research, 1050 Massachusetts Ave., Cambridge,
M A 02138-5398, U.S.A.
Manuscript received August, 1989;final revision received December, 1991.
APPENDIX
This appendix extends the discussion of simulation estimators in the text to include a description of the particular moment conditions and estimation algorithm that are used to obtain the estimates. It also discusses how to incorporate an assumption on the order of entry in the estimation technique.
Simulation techniqu?~ as described above provide an unbiased estimate of the expected equilib- rium number of firms, N(W,,6 ,8 ) ,where ri is the vector of simulated draws from the distribution of unobservables. Suppose in addition that firms enter in the order of profitability. Since profits depend on the unobservables, the implied order of entry differs across simulation draws. Let k = 1,. . . , K, be any arbitrary ordering of the firms. Then define a function q(k,W,,6 ,u: ) which defines the profit ranking of firm j given a value of the unobservables together with the data and the parameters. If given the tth simulation draw, ri firms are predicted to enter, then firm k will enter if q(k,v,6,u: ) g A. An unbiased estimate of the probability of entry by the k th firm is therefore
(A.1) Bk(K:., 1 if ri(w,,e,ri;) > q ( k , K , e , l ; : ) , 6 ,if)=
0 else.
If a different order of entry is assumed, the calculation of Bk is more complicated. Let the function q continue to map k into the order of entry, which no longer depends on profitability. Following the discussion in the text, regardless of the entry order Bk must equal one for those L firms with simulated profits, 7 j lk ( r i + 1,l;:),greater than zero at A + 1. Now consider a second set of firms, with 7 j l k ( A + 1,l;:)< 0 but elk(&if)> 0. Of these, the first ( A -L ) firms in the order given by q will also enter (i.e. have Bk = 1). Once again the variance of the estimate is reduced by averaging across T draws:
We can now construct an additional set of Ki estimating equations for each market. Define a "dependent variable", Iik, which is equal to one if firm k enters and zero else. Consider the additional estimating equations:
(A.3) Iik = e k ( ( , 6 , c i )+ Cik ( k = 1,..., K c ) .
Once again, the new prediction errors Clk are constructed so that E[CIk(6*)/w]= 0. Unfortu-nately, since K, varies across markets, the number of such equations also varies across markets. I will use an exogenous selection rule to select four of these equations for each market: these are the equations associated with the four firms having the largest city output share ("City Share") in
916 STEVEN T. BERRY
market i, firms which might be thought of as the "most likely entrants" into market i . While arbitrary, any exogenous rule is appropriate for estimation. (Note that I cannot choose the moment conditions based on profitability, because this depends on parameters.) Relabel these four firms in market i as j = 1,2,3,4. This gives five estimating equations for each market, with prediction errors of
A method of moments estimation technique is based on the derived moment restriction that Bi is uncorrelated with any function, f(W,) of the exogenous data. With M independent markets, the sample analog of this restriction involves the sample correlation
An estimate 6 is chosenjo set this sample analog as close to zero as possible. If it is not possible to zero g(0) exactly, then 0 is chosen to minimize a quadratic distance measure
for some positive definite matrix A. It remains to specify a function f ( . ) and a matrix A . All functions of the market and firm
characteristics are possible choices for f(.). Given that K,can be large in this sample, interacting all of these variables with each of the five prediction errors creates an unmanageably large list of moment conditions. Somewhat arbitrarily, eiich of the "firm specific" errors, vlk.are interacted with X, and with the vector of own-firm characteristics, Zlk.This ignores the characteristics of other firms, so these errors are also interacted with a Herfindahl index of city output shares in market i. Each of the four errors Glk( k = 1,. . . ,4) is thus interacted with six functions of the exogenous data, so that 24 moment conditions are associated with these four errors. The prediction error for the number of firms, (Ole, is interacted with the market characteristics, the number of potential entrants serving both cities, the total city output share of these entrants, the number of potential entrants sewing only one city, and the Herfindahl index just discussed. This creates another seven moment conditions, for a total of 31.
To turn to the weighting matrix A i? (A.5), a traditional method of moments technique is employed. First, a preliminary estimate, 0, is obtained by setting A equal to the identity matrix. Then, a new yeighting matrix is calculated as the sampl? variance of the individual moment conditions, gi(O,), from (A.4). A secqnd and final estimate, 0, is then obtained from the use of this moment condition. The variance of 0 is estimated by the formula given, for example, in Pakes and Pollard (1989).
A final (and well-known) computational problem is caused by the absence of continuous derivatives for the prediction errors. Because of this, the nongradient "Downhill Simplex" optimiza- tion algorithm (discussed in Press, et al. (1989, p. 289-298)) is used to minimize (A.5) with respect to 0. The estimation routine uses a "Gauss" computer language implementation of this algorithm by Kennet (1988). Readers desiring a more complete discussion of moment conditions, distance functions and computation should consult the cited works on simulation and computation.
REFERENCES
BAILEY, E., D. GRAHAM,AND D. KAPLAN (1985): Deregulating the Airlines. Cambridge: MIT. BAILEY,E., AND J. PANZAR(1981): "The Contestability of Airline Markets During the Transition to
Deregulation," Law and Contemporary Problems, 49, 125-1455. BERRY,S. (1990): "Airport Presence as Product Differentiation," American Economic Review Papers
and Proceedings, 79, 394-400. - (1989): "Entry in the Airline Industry," Unpublished Ph.D. Dissertation, Univ. of
Wisconsin-Madison. BJORN,P., AND Q. VUONG (1985): "Simultaneous Equations Models for Dummy Endogenous
Variables: A Game Theoretic Formulation with an Application to Labor Force Participation," California Institute of Technology Working Paper 537.
BORENSTEIN,S. (1989): "Hubs and High Fares: Dominance and Market Power in the U.S. Airline Industry," RAND Journal, 20, 344-368.
917 MODEL OF ENTRY
BRESNAHAN,T., AND P. REISS (1987): "DO Entry Conditions Vary Across Markets," Brookings Papers in Economic Activities, 18, 833-882. -(1990): "Entry in Monopoly Markets," Review of Economic Studies, 57, 531-544. -(1991): "Empirical Models of Discrete Games," Journal of Econometrics, 48, 57-82. CARD, D. (1986): "The Impact of Deregulation on the Employment and Wages of Airline
Mechanics," Industrial and Labor Relations Review, 39, 527-538. HANSEN, L. (1982): "Large Sample Properties of Generalized Method of Moments Estimators,"
Econometrica, 50, 1029-1954. JUDD,K. (1985): "Credible Spatial Preemption," RAND Journal of Economics, 16, 153-166. KENNET,D. M. (1988): "Amoeba: A Gauss Language Procedure for the Downhill Simplex Method,"
Unpublished computer program. LEVINE, M. (1987): "Airline Competition in Deregulated Markets: Theory, Firm Strategy and Public
Policy," Yale Journal on Regulation, 4, 393-494. MCFADDEN,D. (1989): "A Method of Simulated Moments for Estimation of Discrete Response
Models without Numerical Integration," Econometrica, 57, 995-1026. PAKES, A. (1986): "Patents as Options: Some Estimates of the Value of Holding European Patent
Stocks," Econometrica, 54, 755-784. PAKES, A., AND D. POLLARD (1989): "Simulation and the Asymptotics of Optimization Estimators,"
Econometrica, 57, 1027-1058. PRESS, W., B. FLANNERY, S. TEUKOLSKY, (1989): Numerical Recipes: The Art of AND W. VETTERLING
Scientific Computing. Cambridge: Cambridge University Press. REISS, P., AND P. SPILLER (1989): "Competition and Entry in Small Airline Markets," Journal of
Law and Economics, 32, 179-202.

You have printed the following article:
Estimation of a Model of Entry in the Airline IndustrySteven T. BerryEconometrica, Vol. 60, No. 4. (Jul., 1992), pp. 889-917.Stable URL:
http://links.jstor.org/sici?sici=0012-9682%28199207%2960%3A4%3C889%3AEOAMOE%3E2.0.CO%3B2-F
This article references the following linked citations. If you are trying to access articles from anoff-campus location, you may be required to first logon via your library web site to access JSTOR. Pleasevisit your library's website or contact a librarian to learn about options for remote access to JSTOR.
[Footnotes]
8 Credible Spatial PreemptionKenneth L. JuddThe RAND Journal of Economics, Vol. 16, No. 2. (Summer, 1985), pp. 153-166.Stable URL:
http://links.jstor.org/sici?sici=0741-6261%28198522%2916%3A2%3C153%3ACSP%3E2.0.CO%3B2-D
References
The Contestability of Airline Markets during the Transition to DeregulationElizabeth E. Bailey; John C. PanzarLaw and Contemporary Problems, Vol. 44, No. 1, Managing the Transition to Deregulation.(Winter, 1981), pp. 125-145.Stable URL:
http://links.jstor.org/sici?sici=0023-9186%28198124%2944%3A1%3C125%3ATCOAMD%3E2.0.CO%3B2-V
Entry in Monopoly MarketsTimothy F. Bresnahan; Peter C. ReissThe Review of Economic Studies, Vol. 57, No. 4. (Oct., 1990), pp. 531-553.Stable URL:
http://links.jstor.org/sici?sici=0034-6527%28199010%2957%3A4%3C531%3AEIMM%3E2.0.CO%3B2-2
http://www.jstor.org
LINKED CITATIONS- Page 1 of 3 -
NOTE: The reference numbering from the original has been maintained in this citation list.

The Impact of Deregulation on the Employment and Wages of Airline MechanicsDavid CardIndustrial and Labor Relations Review, Vol. 39, No. 4. (Jul., 1986), pp. 527-538.Stable URL:
http://links.jstor.org/sici?sici=0019-7939%28198607%2939%3A4%3C527%3ATIODOT%3E2.0.CO%3B2-P
Large Sample Properties of Generalized Method of Moments EstimatorsLars Peter HansenEconometrica, Vol. 50, No. 4. (Jul., 1982), pp. 1029-1054.Stable URL:
http://links.jstor.org/sici?sici=0012-9682%28198207%2950%3A4%3C1029%3ALSPOGM%3E2.0.CO%3B2-O
Credible Spatial PreemptionKenneth L. JuddThe RAND Journal of Economics, Vol. 16, No. 2. (Summer, 1985), pp. 153-166.Stable URL:
http://links.jstor.org/sici?sici=0741-6261%28198522%2916%3A2%3C153%3ACSP%3E2.0.CO%3B2-D
A Method of Simulated Moments for Estimation of Discrete Response Models WithoutNumerical IntegrationDaniel McFaddenEconometrica, Vol. 57, No. 5. (Sep., 1989), pp. 995-1026.Stable URL:
http://links.jstor.org/sici?sici=0012-9682%28198909%2957%3A5%3C995%3AAMOSMF%3E2.0.CO%3B2-Z
Patents as Options: Some Estimates of the Value of Holding European Patent StocksAriel PakesEconometrica, Vol. 54, No. 4. (Jul., 1986), pp. 755-784.Stable URL:
http://links.jstor.org/sici?sici=0012-9682%28198607%2954%3A4%3C755%3APAOSEO%3E2.0.CO%3B2-X
Simulation and the Asymptotics of Optimization EstimatorsAriel Pakes; David PollardEconometrica, Vol. 57, No. 5. (Sep., 1989), pp. 1027-1057.Stable URL:
http://links.jstor.org/sici?sici=0012-9682%28198909%2957%3A5%3C1027%3ASATAOO%3E2.0.CO%3B2-R
http://www.jstor.org
LINKED CITATIONS- Page 2 of 3 -
NOTE: The reference numbering from the original has been maintained in this citation list.

Competition and Entry in Small Airline MarketsPeter C. Reiss; Pablo T. SpillerJournal of Law and Economics, Vol. 32, No. 2, Part 2, Empirical Approaches to Market Power: AConference Sponsored by the University of Illinois and the Federal Trade Commission. (Oct., 1989),pp. S179-S202.Stable URL:
http://links.jstor.org/sici?sici=0022-2186%28198910%2932%3A2%3CS179%3ACAEISA%3E2.0.CO%3B2-C
http://www.jstor.org
LINKED CITATIONS- Page 3 of 3 -
NOTE: The reference numbering from the original has been maintained in this citation list.