Embed Size (px)
Citation preview
Louisiana State UniversityLSU Digital Commons
LSU Historical Dissertations and Theses Graduate School
1978
Estimation of Growth Parameters in Beef Cowsand Their Relationship to Progeny Growth Traits.Saidi Bin MoinLouisiana State University and Agricultural & Mechanical College
Follow this and additional works at: https://digitalcommons.lsu.edu/gradschool_disstheses
This Dissertation is brought to you for free and open access by the Graduate School at LSU Digital Commons. It has been accepted for inclusion inLSU Historical Dissertations and Theses by an authorized administrator of LSU Digital Commons. For more information, please [email protected].
Recommended CitationMoin, Saidi Bin, "Estimation of Growth Parameters in Beef Cows and Their Relationship to Progeny Growth Traits." (1978). LSUHistorical Dissertations and Theses. 3252.https://digitalcommons.lsu.edu/gradschool_disstheses/3252
INFORMATION TO USERS
This material was produced from a microfilm copy of the original document. While the most advanced technological means to photograph and reproduce this document have been used, the quality is heavily dependent upon the quality of the original submitted.
The following explanation of techniques is provided to help you understand markings or patterns which may appear on this reproduction.
1. The sign or "target" for pages apparently lacking from the document photographed is "Missing Page(s)". If it was possible to obtain the missing page(s) or section, they are spliced into die film along with adjacent pages. This may have necessitated cutting thru an imaga and duplicating adjacent pages to insure you complete continuity.
2. When an image on the film is obliterated with a large round black mark, it is an indication that the photographer suspected that the copy may have moved during exposure and thus cause a blurred image. You will find a good image of the pege in the adjacent frame.
3. When a map, drawing or chart, etc., was part of the material being photographed the photographer followed a definite method in "sectioning" the material. It is customary to begin photoing at the upper left hand corner of a large sheet and to continue photoing from left to right in equal sections with a small overlap. If necessary, sectioning is continued again - beginning below the first row and continuing on until complete.
4. The majority of users indicate that the textual content is of greatest value, however, a somewhat higher quality reproduction could be made from "photographs" if essential to the understanding of the dissertation. Silver prints of "photographs" may be ordered at additional charge by writing the Order Department, giving the catalog number, title, author and specific pages you wish reproduced.
6. PLEASE NOTE: Some pages may have indistinct print. Filmed as received.
University Microfilms International300 Nouh Zeeb RoadAnn Arbor, Michigan 48106 USASt. John's Road, Tyler's QreenHigh Wycombe, Bucks, England HP10 8HR
7903147MQIN* S A I D I B I N
ESTIMATION OF GROWTH PARAMETERS IN BEEF COWS AND THEIR RELATIONSHIP TO PROGENY GROWTH T R A I T S .
THE LOUISIANA STATE U NI VER SI TY AND AGRICULTURAL AND MECHANICAL C O L . f P H . D . , 197B
University^MicrofilmsInternational 300 n . z e e b r o a d , a n n a r b o r , mi 4 8 ic *
ESTIMATION OF GROWTH PARAMETERS IN BEEF COWS AND THEIR RELATIONSHIP TO PROGENY GROWTH TRAITS
A DISSERTATIONSubmitted to the Graduate Faculty of the Louisiana State University and Agricultural and Meohanical College in partial fulfillment of the requirement for the degree of Doctor of Philosophy
inThe Department of Animal Science
bySaidi Bin Moin B.S., Louisiana State University, 1973 M«S.• Louisiana State University, 1975August, 1978
ACKNOWLEDGMENTS
The author is indebted to his major professor,Dr. Paul Edwin Humes, Professor of Animal Science, for his guidance and encouragement during the course of the graduate study and preparation of this dissertation.
Appreciation is also given to Dr. Donald E. Franke, Associate Professor of Animal Science, for his suggestions regarding this dissertation.
A special note of appreciation to Dr. Kenneth L. Koonce, Professor in Experimantal Statistics, for assisting in statistical analysis, advice and suggestions in the preparation of this dissertation.
The author would also like to extend his appreciation to Drs. F. Glen Hembry and Donald M. Thrasher, Professors in Animal Science, for serving on his advisory committee and their suggestions regarding this dissertation.
The help of Mrs. Dorothy C. Wilson, Research Statistician, for assistance with portions of the data sets, is gratefully acknowledged.
ii
iiii:vvi:ix1kk67
13151?17182222112526
3131
4-553
TABLE OP CONTENTS
ACKNOWLEDGMENTS ..................TABLE OP CONTENTS .................LIST OF TABLES ...................LIST OP FIGURES ..................ABSTRACT .........................INTRODUCTION .....................LITERATURE REVIEW.................Mature Weight .................Rate of Maturing ...............
Parameter Estimates ............Correlations between GrowthCurve Parameters (A,lc) ........Correlations of Growth Parameterswith Immature Weights .........Factors Affecting Growth Parameters .......... ............Correlations of Degrees ofMaturity with Weights .........Correlations of Growth Rates with Weights .................
MATERIALS AND METHODS ............Breeding Plans and ExperimentalData ................. .......Breeding Season ................Management of Cows and Calves ..,Data Collected .................Statistical Analysis ...........
RESULTS AND DISCUSSIONS ...........Parameter Estimation ...........Degrees of Maturity and Their Relationship to GrowthParameters ...................Factors Affecting Growth Rates ,.
iii
PagePhenotypic Correlations ofMature Weight with Growth Rate .......... 57Phenotypic Correlations ofMaturing Rate with Growth Rate ......... 64Phenotypic Correlations of Cow Growth Parameters with Calf Growth Parameters and Traits ........ 6?
X. SUMMARY.................................... 72XI. LITERATURE CITED ........................... 78XII. APPENDIX................................... 81XIII. VITA....................................... 8?
iv
LIST OF TABLESNumber1 Estimates of Mature Weight and Maturing Rate for Various Breeds of Cattle ......2 Number of Cows by Cow Breeding and Management System ............. .......3 Analyses of Variance for Growth Parameters (A* k) of Angus* Brahman and Hereford Females .k Means for Mature Weight and Maturing Rate of Angus* Brahman and Hereford
Females .................... ..........5 Phenotypic Correlations between Mature Weight and Maturing Rate in Straightbred and Crossbred Pemales .................6 Least-Squares Analyses of Variance forGrowth Parameters (A* k) of Brahman x Holstein* Brahman x Jersey* Red Sindhi x x Holstein and Red Sindhi x Jersey
Females ...............................7 Least-Squares Means for Mature Weight andMaturing Rate by Crossbred Cow Breed and Management System ..................8 Least-Squares Means for Observed MatureWeight of Brahman x Holstein* Brahman x Jersey* Red Sindhi x Holstein and Red Sindhi x Jersey Cows by Management System.................. *............9 Analyses of Varianoe for Degrees ofMaturity in Angus* Brahman and Hereford Females at Successive Ages ............10 Means for Degrees of Maturity of Angus*Brahman and Hereford Cows at Successive
Ages ..................................
Page
12
23
31
32
32
35
37
39
<*5
k6
v
Phenotypic Correlations of Degrees of Maturity with Mature Weight and Maturing Rate in Angus, Brahir.an and Hereford Females at Successive Ages ................Least-Squares Analyses of Variance for Degrees of Maturity in Brahman x Holstein, Brahman x Jersey, Red Sindhi x Holstein, and Red Sindhi x Jersey Females at Successive Ages ................. .........Least-Squares Means for Degrees of Maturity of Brahman x Holstein, Brahman x Jersey,Red Sindhi x Holstein and Red Sindhi x Jersey Females by Management System at Successive Ages .......... ..............Phenotypic Correlations of Degrees of Maturity with Mature Weight and Maturing Rate in Brahman x Holstein, Brahman x Jersey, Red Sindhi x Holstein, and Red Sindhi x Jersey Females at Successive Ages.......................... .......... .
Analyses of Variance for Growth Rate (AGR, AMR, RGR) in Angus, Brahman and Hereford Females at Successive Age Intervals............... ....... .Means for Growth Rate (AGR, AMR, RGR) in Angus, Brahman and Hereford Females at Successive Age Intervals............... .
Least-Squares Analyses of Variance for Growth Rate (AGR, AMR, RGR) in Brahman x Holstein, Brahman x Jersey, Red Sindhi x Holstein, and Red Sindhi x Jersey Cov/s at Successive Age Intervals ................................ .Least-Squares Means for Growth Rate (AGR, AMR, RGR) in Brahman x Holstein, Brahman x Jersey, Red Sindhi x Holstein and Red Sindhi x Jersey Females at Successive Age Intervals ........
19 Phenotypic Correlations of Mature Weightwith Growth Rate (AGR, AMR, RGR) in Angus,Brahman and Hereford Females at SuccessiveAge Intervals ........................... 60
20 Phenotypic Correlations of Mature Weightwith Growth Rate (AGR, AMR, RGR) in Brahman x Holstein, Brahman x Jersey,Red Sindhi x Holstein and Red Sindhix Jersey Females at Successive AgeIntervals ..........«......... *.... 6221 Phenotypic Correlations of Maturing Rate
with Growth Rate (AGR, AMR, RGR) in Angu3,Brahman and Hereford Females at SuccessiveAge Intervals ................... 6522 Phenotypic Correlations of Maturing Rate with Growth Rate (AGR, AMR, RGR) In Brahman x Holstein, Brahman x Jersey, Red Sindhi x Holstein and Red Sindhi x Jersey Femalesat Successive Age Intervals .............. 6623 Phenotypic Correlations of Cow Mature Weightand Maturing Rate with Calf Traits in Angus, Brahman and Hereford Cattle ........... 69
Zk Phenotypic Correlations of Cow MatureWeight and Maturing Rate with Calf Traits in Crossbred Females 7025 Analyses of Variance for Growth Parameters (A, k) in Angus, Brahman and Hereford Cowswith linear Regression on Cow Age .......... 6226 Least-Squares Analysis of Variance for Average Weight From 5 to 10 years of Agein Crossbred Females .................... 83
27 Phenotypic Correlations between Cow GrowthParameters (A, k) and Calf Traits by Breedand Management System in Crossbred Females . 8^28 Equations Used in Constructing the Growth
Curves ............................. 85
vii
LIST OF FIGURES
Figure Page1 Mean growth curves for Angus (A),Brahman (B) and Hereford (H)oows ....... 3<t2 Mean growth curves for Brahman xHolstein (BH), Brahman x Jersey (BJ)« Red Sindhi x Holstein (SH) and Red Sindhi x Jersey (SJ)females ........................ . 363 Mean growth curves for Brahman xHolstein (BH)» Brahman x Jersey (BJ),Red Sindhi x Holstein (SH) and RedSindhi x Jersey (SJ) females inmanagement system 1 ................... 40
4 Mean growth eurves for Brahman xHolstein (BH)» Brahman x Jersey (BJ)»Red Sindhi x Holstein (SH)» and RedSindhi x Jersey (SJ) females inmanagement system 2 ........... 4i
5 Mean growth eurves for crossbred cowsin management system 1 and managementsystem 2 ....................... 4J
viii
ABSTRACT
Weight-age data from 169 straightbred Angus, Brahmanand Hereford and 122 crossbred Brahman x Holstein (BH)»Brahman x Jersey (BJ), Red Sindhi x Holstein (SH) and RedSindhi x Jersey (SJ) females were collected to estimateoertain growth parameters (mature weight. A and maturing
«-k trate, k) using Brody's model wit - Ai - V 1 ♦ *if Degrees of maturity, absolute growth rate (RGR). absolute maturing rate (AMR) and relative growth rate (RGR) were also calculated. Least-squares procedures were used to determine the effect of oow breed on these estimates in the straightbred data set. In addition to cow breed, management system (native pastures vs ryegrass pastures) and cow breed x management system interaction were included as sources of variation in 1;he model for the crossbred females.
Means for mature weight (A) and maturing rate (k) were 473*7 kg* .054i 537.6 kg, .043 and 508.9 kg, .050,
respectively in Angus, Brahman and Hereford cows. Least- squares means for mature weight (A) and maturing rate (k) were 544.5 kg, ,0 4 li 488.1 kg, .042i 437-9 kg, .039 and 369.7 kg, .043* respectively for BH, BJ, SH and SJ cows.
Comparisons among the straightbreds showed that Angus oows were 4 9 .6 kg (P4 .OI) smaller at maturity and were earlier maturing than Brahman and Hereford cows.
ix
Brahman cross females (BH and BJ) were 112.5 kg (P c.Ol) heavier at maturity than the Red Sindhi cross (SH and SJ) females. Similarly, the Holstein cross females (BH and SH) were 62.3 kg (P <.01) larger at maturity than the Jersey cross females (BJ and SJ).
Angus cows reached their mature weight at about ?6 months of age* while Brahman and Hereford cows reached their mature weight at about 84> months of age. The crossbred females did not appear to reach their mature weight even at 108 months of age. Perhaps the stress of early weaning (6 to 7 days of age) and lowered nutrient intake prior to 12 months of age might have delayed these females in reaching their mature weight.
Management system did not significantly influence mature weight (A) of the crossbred cows > however, BH females in ryegrass pastures were slightly larger (5^9*9 kg) than those in native pastures (539*1 kg). Management system had a highly significant influence on maturing rate (k), showing that cows in ryegrass pastures were earlier (Pc.Ol) maturing (*0^7) than those in native pastures (.036).
Means for degree of maturity at birth, weaning, 12 and 18 months of age were .06, .36, A ? and .62, respectively, in the straightbred females, while the least-
x
squares estimates at birth, 8, 12, 18, 24, 36 and 48 months of age were .0?, .32, .42, .46, .69* *95 and .93, respectively, in the crossbred females. Comparisons among straightbred and crossbred females for degrees of maturity followed similar patterns to those seen in maturing rate (k). Degrees of maturity were negatively (-.19 to -.85) correlated with mature weight (A) and positively (.17 to .93) correlated with maturing rate (k) in both straightbred and crossbred females. Thus, animals more mature at one age tended to be more mature at all other ages.
Cow breed had a highly significant influence on AGR, AMR and RGR for the interval from weaning to 12 months in the straightbred females, and for the interval from 12 to 24 months of age in the crossbred females.
Hereford females gained faster (.35 kg/day) than Brahman females (.18 kg/day) for the interval from weaning to 12 months. Comparisons among the crossbred females for AGR, AMR, or RGR followed patterns similar to those observed for mature weight (A). Management system had a highly significant influence on all measures of growth rate (AGR, AMR and RGR), as cows in management system 2 gained more rapidly (P<.01) and were earlier (P<.01) maturing (AMR) than those in management system 1 at the interval from 12 to 24 months.
xi

Breeds growing more rapidly during tha preweaning interval in absolute terns (AGR) and relative to both current (RGR) and mature weight (AMR), tended to grow more slowly at later ages. Rapid early growth (prior to 12 months of age) was associated with small mature weight, whereas animals heavy at maturity tended to grow longer and tended to be relatively small in body weight at earlier ages.
Phenotypic correlations between oow and calf mature weight and maturing rate in the straightbred females were generally small and nonsignificant, exoept for the correlation between oow and oalf mature weight among Herefords (r ■ .36*). Cow mature weight (A) was not significantly associated with calf weights from birth to 8 months (weaning)in straightbred or crossbred females) however, oow maturing rate was highly significantly associated with calf weaning weight in BH and BJ crossbred cows (r = .34** and .25*** respectively).
xii

INTRODUCTION
Cattlemen are becoming increasingly aware of the importance of growth and size of beef cattle to the profitability of beef production. Most of their attention has been directed toward growth rate of the animal to slaughter weight and age under the assumption that this was the most economically important part of the growth pattern. Consequently, most studies of growth characteristics of cattle have been limited to only a few measurements, for example, birth, weaning and yearling weights. Thus many aspects of development patterns and interperiodic relationships have been neglected as a oonsequence of using a few selected measurements to evaluate growth. Certain characteristics of growth such as rate of maturing and mature weight cannot be measured on immature animals, yet these or related measures are necessary to give perspective to the single measurements made on animals (Brown gt a^., 1972a).Further, description of the total growth pattern is necessary for development of effective breeding and management systems for efficient beef production (Joandet and Cartwright, 19<>9f Long Si Si*» 1971)*
Actual growth patterns tend to be quite irregular* particularly when body weight is the measure of growth or
1
2
size (Brown ft! al. * 1971* 1972a,b). Algebraic growth models provide a method of smoothing and summarizing the observed growth data by a few parameters (A, k). This smoothing of irregular weight-age pattern is thought to make predicted weights more useful than aotual or adjusted weights in dssoribing the pattern of relationships among growth measurements. Also such models tend to average out the effect of temporary environments as well as to adjust for the nonlinear effect of age on weight (Brown gt al.. 1976). The parameters generally include a measure of the slope of the curve prior to maturity (k) and a measure of size at maturity (A). This concept was considered in some detail by Brody (19^5)» Fitzhugh and Taylor (1971)* Taylor and Fitzhugh (1971)* Brown e£ g^. (1971* 1972a,b, 1976), Stewart e£ g&. (1975) and Wong g& gi* (1975). Further, if the selected growth model aoourately describes the data and closely approximates the underlying biological functions, the research scientist may ohoose to investigate the properties of the empirical model in much the same manner that he would investigate the true biological model if it were known. The selection of a growth model depends upon the nature of the study and the intended use or application of the results.
Knowledge relating to the degree of maturity, rate of maturing, length of the linear growth phases and mature
3
weights of various breeds of cattle would enable a producer to select breeds producing the most appropriate growth pattern for his particular type of operation.
Information on the rate of maturing of individual sires and dams (in addition to breeds) may assist in the proper evaluation of growth and efficiency of growth for their progeny through comparisons at similar degrees of maturity (Brown et , 1971).
The data for this study were obtained from Project 605 and Project 1527 at the Louisiana Agricultural Experiment Station conducted at the Ben Hur and St. Gabriel Experiment Station, respectively. The study was undertaken with the following objectives in mindt
1. To estimate the growth parameters of certain straightbred and orossbred beef oows.
2. To determine the factors affecting growth parameters, degrees of maturity and growth rates of several breed groups of cows.
3. To investigate the association of growth parameters with degrees of maturity, absolute growth rate, absolute maturing rate and relative growth rate, andTo determine the association between growth parameters of cows and growth traits of their progeny.

LITERATURE REVIEW
The concept of integrated or cooperative beef cattle production systems emphasizes the need to understand the fundamental relationships of growth and development during the entire life span. The complex relationships between an animal*s genotype and its environment should be understood in order that they can be made complementary. Efficient integration will depend upon accurate evaluation of genetic capabilities at critical periods and knowledge of how performance at one phase of growth relates to performance in other phases (Brown gt gl*, 1971)* Thus it is necessary to define certain terms or parameters clearly.
Mature Weight. The precision with which mature weight or size has to be defined will vary with the hypothesis being investigated. A simple definition of mature weight as the final weight eventually reached may often be adequate for traits which rarely display negative growth, e.g., height at withers in cattle, but is likely to be inadequate for measures such as body weight, which are much more affected by environment (Fitzhugh and Taylor, 1971).
Brinks et (1962) and Fitzhugh et gj,. (1967) reduced the environmental component of variation in weight

5
of mature cows by averaging repeated weights taken annually. This measure effectively defines mature weight as the mean weight over many years after positive growth of skeletal and muscular tissue has become insignificant. In some situations this mean value might be estimated by the asymptote of a fitted growth curve (Brody, 19^5» Joandet and Cartwright, 1969).
Brown et a^. (1976) compared five nonlinear growth models; Brody, Gompertz, Logistic, Von Bertalanffy and Richards, and indicated that each model provided an estimate of the mean mature weight and a measure of earliness of maturing. The asymptotic limit of each model, as age approached infinity, does not approximate the heaviest weight attained by the animal. Rather it is the asymptotic mean weight. Much of the within animal weight variation due to short term fluctuations in body composition is averaged out. The asymptote more nearly represents the mature weight at a constant condition relative to the individual's norm for body composition under a given production environment than would a single weight. The symbol A is used to denote the asymptotic mature weight.
The predominant variable affecting mature weight is food intake. In many situations, sufficiently accurate estimates of mature weight can be obtained provided animals are liberally fed at all tines on a diet of constant
6
composition* For greater accuracy* however* it would be necessary to define the mature weight* whether of the entire animal or of a single organ or tissue* as a function of food intake. For example* mature weight of total body fat would have to be specified for each level of constant food intake between a maximum at or just above ad libitum feeding and the minimum capable of sustaining life (Fitzhugh and Taylor (1971),
Rate of Maturing. Brody (19^5). Fitzhugh and Taylor (1971), Brown et (1976) defined the rate of maturing (k) as growth rate relative to mature weight or size. Further, Brown et al. (1976) indicated that rate of maturing is related to average postnatal rate of maturing.Large k values indicate early maturing individuals and small k values indicate lata maturing individuals.
Brown et al. (1972a) showSd that different mature weights (A) combined with different maturing rate (k) create various patterns of growthi also animals with different A values may have different or similar k values. Only when two animals are growing to similar mature weights, can differences in values of k be interpreted as measures of differences in growth rate. Otherwise, k measures differences in growth rate relative to mature weight as was earlier mentioned. Genetic and environmetal factors
7
which influence the slope of the weight-age curve or the asymptotic weight will influence the estimates of rate of maturing (Brown gt al., 1976).
The weight of an animal* as indicated by some measurement at some stage during its development* can theoretically be partitioned into two componentst one describing the mature weight (A) eventually reached or maintained and the other describing the proportion (u) of mature weight reaohed at the stage in question. Thus* weight (y) can be partitioned intot
y • Au or u * y/AGrowth rate over time* t, for weight* y, is The
corresponding rate of change for degree of maturity* u* is ^ which is rate of maturing* Since ^ = l/A |^* maturing rate is growth rate relative to mature weight (Brody, 19*5, Fitshugh and Taylor* 1971)*Parameter Estimates
Brown et §£. (1971), at the Texas Agricultural Experiment Station used an algebraic growth model* y^ - Ad-Be"*^)®, to fit individual weight-age data for several cow breeds and breed crosses. Their reported estimates of mature weight (A) and maturing rate (k) were 539±70kg* .048 + .02* 526 + 115 kg, .073+.03i *97+ 3*. .121+ .04 and 424+ 72, .058 + .02 for Hereford, Brahman x Hereford,

8
Angus x Brahman-Hereford and Jersey cows, respectively.They noted that among these breed groups, Hereford cows were the heaviest and the Jersey cows were the lightest at maturity. The P- Brahman x Hereford females averaged 13.6 kg less than the Hereford females at maturity.However, there was a considerable difference in the rate of approach (k) to these mature weights (A). The P^Brahman x Hereford females matured nearly 50# faster than the Hereford females, while the Angus cross females matured at nearly twice the rate of the P^ Brahman x Hereford females. They also suggested that crossbreeding had increased the rate of maturing (k). A negative correlation (r s -.6b) between A and k indicated that cows with rapid maturing rates tended to be lighter at maturity.
Brown et a^. (1972a) fitted weight-age curves to18 Hereford and 26 Angus males, 288 Hereford and 296 Angus
—k tcows using Brody's growth model y ^ = A^(l - B^e i ) + e^. Asymptotic mature weights of 792 + 81 and 711 + 152 kg were obtained for Hereford and Angus males, respectively. The estimates for asymptotic mature weights of Hereford and Angus females were **79+ 62 and 44l+ 59 respectively.The estimates for rate of maturing for Hereford males and females were .0568 + .0166 and .0**37 ± .0117, while Angus males and females had estimates of .0605 + .0289 and
9
.0566.+ .0181, respectively. They concluded that the similarities in breed differences for the two sexes indicate that Angus were earlier maturing than Herefords and grew to lighter mature weights. The larger standard error for Angus males resulted from the use of several outside bulls which were distinctly different in type and growth pattern from those bulls raised at the station.
Brown et a . (1972a) reported that the major difference between male and female growth patterns was the increased linear growth phase of bulls. The Hereford females continued to show an increasing trend in body weight until 85 months of age while growth in the Angus females terminated near ?0 months. The Herefords beoame heavier than the Angus near 40 months of age.
Brown et <y.. (1972b) used 288 Hereford and 296 Angus females, at the University of Arkansas, to study the relationships among weights, gains and earliness of maturing and found that large gains at young ages were associated with early maturing females while genotypes required for sustained growth rate into the advanced ages were associated with late maturing females. Early maturing females of both breeds were characterized by lighter body weights prior to 4 months, larger gains to about 2 yeare of age and smaller mature weights than late maturing females. Those heifers with large gains after 16 months were generally
10
late maturing and grew to large mature weights. They concluded that gains and weights were not regulated hy identical groups of genes nor did the mutual genes have an isodirectional effect on the two characters. As a consequence, selection for large gain or heavier weights would not affeot identical changes in growth pattern of all individuals.
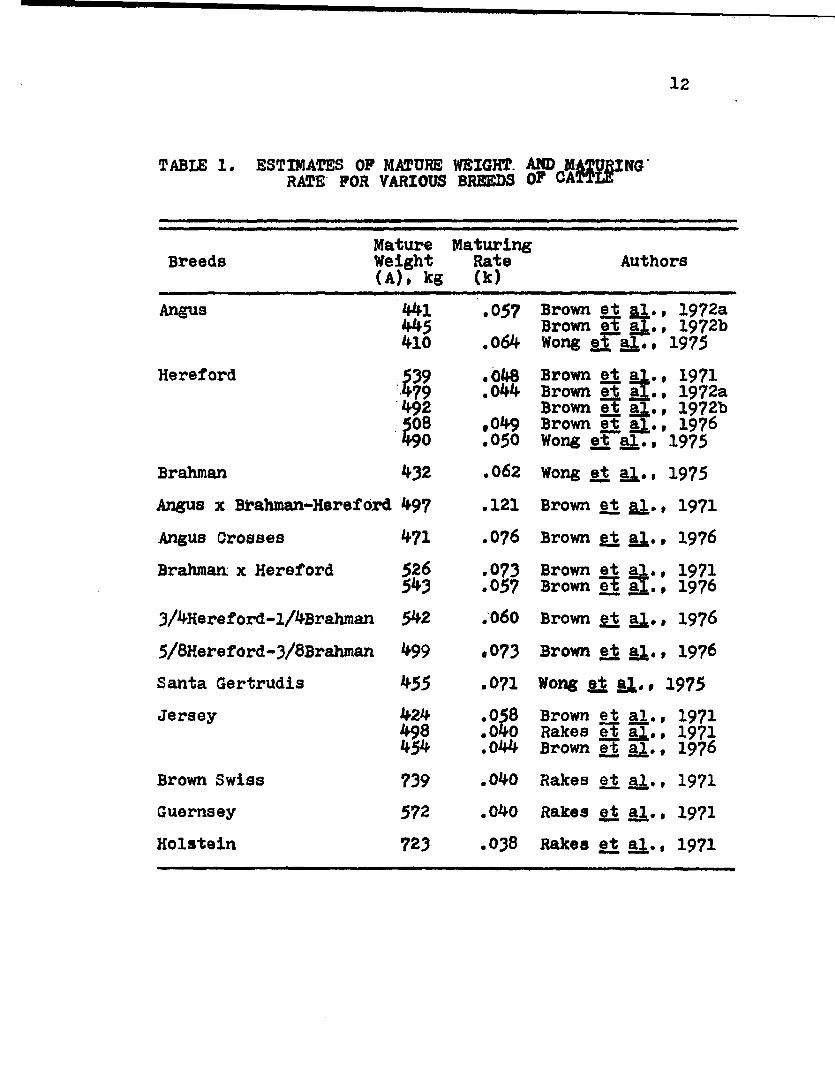
Brown et §1. (1976) obtained estimates of mature weights for the following cow breed groups* Hereford, 508 kgt Brahman x Hereford, 543 kgt 3A Hereford -1/4 Brahman 542 kg* 5/8 Hereford-3/8 Brahman, 499 kgi Angus crosses, 4?1 kg and Jersey, 454 kg. These values are in close agreement with those reported by Brown et a . (1971) and Brown et a , (1972a,b). Rate of maturing reported by Brown et aj,, (1976) were .049, *057* .060, .073, .076 and ,044 for Hereford, Brahman x Hereford, 3/4 Hereford-1/4 Brahman, 5/8 Hereford -3/8 Brahman, Angus crosses and Jersey cattle, respectively. Wong et §i. (1975) reported values of 410.1, 431.8, 490.3 and 454.9 kg for mature weights of Angus, Brahman, Hereford and Santa Gertrudis cows, respectively. Rate of maturing for Angus, Brahman, Hereford and Santa Gertrudis cows were .064, .062, ,050 and .071, respectively.
Rakes e£ gl* (1971) reported values of 739*4 + 49, 572.4 + 49, 722.6 +25 and 498.0+ 26 kg for mature weights
11
of Brown Swiss, Guernsey, Holstein and Jersey cows, respectively. Estimates of rate of maturing were .0398 +.002, .0399 + .002, .0376±.001 and .0403 + .001 for Brown Swiss, Guernsey, Holstein and Jersey females, respectively.
A summary of the estimates of mature weights and rate of maturing or maturing rate are shown in table 1.
12
TABLE 1. ESTIMATES OP MATURE WEIGHT. AND MATURING RATE FOR VARIOUS BREEDS 0? CATTXlT
BreedsMature Maturing Weight Rate (A), kg (k)
Authors
Angus 44l445410.057.064
Brown et gl., 1972a Brown ex aj* * 1972b Wong gT"ai., 1975
Hereford 539479492508490
.048.044
.049.050
Brown et gl., 1971 Brown et gl., 1972a Brown et al., 1972b Brown et al., 1976 Wong et al., 1975
Brahman 432 .062 Wong et al., 1975Angus x Brahman-Hereford 497 .121 Brown et al., 1971
Angus Crosses 471 .076 Brown et gl*, 1976
Brahman, x Hereford 526543 .073.057
Brown et al,, 1971 Brown ex al., 1976
3/4Hereford-l/4Brahman 542 .060 Brown et al*, 19765/8Hereford-3/8Brahman 499 .073 Brown et al«, 1976
Santa Gertrudis 455 .071 Wong gt al., 1975
Jersey 424498454.058.040.044
Brown et al,f 1971 Rakes ej gl., 1971 Brown et al., 1976
Brovin Swiss 739 .040 Rakes et gl., 1971Guernsey 572 .040 Rakes et gl., 1971
Holstein 723 .038 Rakes et gl., 1971

13
Correlations Between Growth Curve Parameters (A.k)
Brown et gl. (1972a) reported that mature weight (A) was negatively correlated to rate of maturing (k) for both Angus (-#62) and Hereford (-.72) while the genetic correlations between these two traits were -.29 for the Angus and -.95 for the Hereford females. This difference in magnitude of the genetic correlations suggested that it is more difficult to interpret large early gains in the Angus than in the Hereford females. They believed this difference in magnitude of the genetic correlations might be another manifestation of maternal effects. Wong e£ a ,. (1975) reported that the genetic correlation between mature weight (A) and maturing rate (k) pooled across breeds was -,3^i«29* This estimate is within the range of estimates reported by Brown et a . (1972a).
Brown et al* (1972a) concluded that genetic changes in growth patterns can be accomplished by selection. The same conclusion was reached by Fltzhugh (1972, 1975). Increases in mature weight are generally associated with a decreases in the maturing rate. The difference in magnitude of the correlations for the two breed groups (Angus, rg»-.29 and Hereford, rg«-.9$) emphasizes the fact that each group of animals is a subpopulation whose genetic relationships are subject to many variables peculiar to that group, not
14
excluding the effects of finite population size. They indicated that the causes of the differences in the genetic relationships might be due to small samples, differences in maternal genotypes and inherent breed differences which could contribute to the differences in the magnitude of the genetic correlations.
Brown et a^. (1976) reported that the residual correlation between mature weight and maturing rate for Jersey females was -.72. They observed that the consistently negative correlations between mature weight and maturing rate indicated that early maturing animals tended to grow to small mature weights. Fitzhugh and Taylor (1971) and Taylor and Fitzhugh (1971) reached a similar conclusion about the relationship between mature weight and maturing rate of Hereford females (r^x-,22).
Brown et ni* (1976) observed that there was sufficient evidence of independence between mature weight and maturing rate for different breed groups to suggest that crossbreeding may be one method of partially overcoming within breed genetic antagonisms between mature weight and rate of maturing. For example, Richards* rate of maturing (k) value for the 5/8 Hereford- 3/8 Brahman group was 87% larger than the k value of the Hereford females, yet the Herefords were only 2% heavier at maturity. These
15
variations between, as well as within, breeds tended to support the suggestion by Brown et y . (1972a) that the rate of maturing may be amenable to genetic change.Corralatlone of Qronrth Parameters with Imaatura Weights
Brown et al. (1972b) reported that the genetic correlations between mature weight and immature weights for the Hereford were large (*63 to 1.06) and positive at all ages, whereas those in the Angus were small (.01 to ,69) for ages from 4- to 36 months. They suggested that selection for yearling weight in replacement heifers would not cause equal responses in the mature weight for these two groups. From their study they concluded that late maturing females became heavier than early maturing individuals between 2*f and 36 months of age and heifers that were heavier at the very early ages were late maturing individuals. Brown et y. (1972b) reported that genetic correlations between rate of maturing and immature weights were negative for the Hereford -.92, -.58, -.3^» -•23» -.21, -.22 and -,32» while the correlations for the Angus were -.88, .95, .95» .91, .86, .77 and .40 for ages of 4, 8, 12, 16, 20, Zk and 36 months, respectively. Similar results were observed by Brown e£ al. (1972a). They concluded that selection for heavier weights at any ages would have reduced the rate of maturing and led to larger mature weights for
16
Hereford females. As for the Angus, they suggested that the genes contributing to heavy weights prior to 8 months were associated with late maturity whereas the genes associated with early maturity produoed heavier animals from 8 to 36 months. Finally, they concluded that selection for large gains at advanced ages would be expected to increase mature weight and decrease rate of maturing only until a mature weight limit is approached by the population under selection.
Brown et a^. (1970), at the Arkansas Agricultural Experiment Station, reported the following phenotypic correlations between mature weight and various weights to maturity* birth weight, -.21*** 1-year weight, -.25*** 2-year weight, .25*** 3-year weight, -.1^*** ^-year weight, -.05 and 5-year weight, -.**8** for Angus females. Correlations between rate of maturing and birth, 1-year,2-year, 3-year, *J~year and 5-year weights were -,15**»-.2^**, .22**, -.1^**, - .0 9 and .52**, respectively for Angus females. They concluded that no single weight would be sufficient to describe the lifetime growth pattern of an individual cow. The correlation between calf 2^0-day weight expressed as a percentage of the dam's 5-year weight and cow mature weight (A) was ,28**. They concluded that smaller cows with a slower rate of approach to maturity
17
tended to wean calves whose weaning weight represents a large percentage of the cow*s mature weight (A).Factors Affecting Growth Parameters
Brown et al. (1972a) reported that sires of the cows had a significant influence on mature weight (A) and maturing rate (k) in Hereford females and accounted for 7.3fa and 7.4# of the total variations in these traits, respectively. Among Angus females, sires did not significantly influence mature weight but had a highly significant influence on maturing rate and accounted for 4-.7# and 16.4# of the total variations in mature weight and maturing rate, respectively. They observed that year of birth of the cow had a highly significant influence on both parameters in both Angus and Hereford females. Age of dam had no influence on either parameter.Correlations of Degrees of Maturity with Weights
Brody (1945)* Fitzhugh and Taylor (1971) and Smith et al. (1976a) expressed weight of an animal at an immature stage as a percentage of its mature weight. Fitzhugh and Taylor (1971) reported mean degrees of maturity of .0?».36, .43 and .66 for birth, 6-, 12-, and 18-month weights, respectively, Smith et al. (1976b) observed values of .07. .39. .53* .73 and .84- for birth, 200-, 396-, 550-day
18
and 3.3-year weights, respectively. Fitzhugh and Taylor (1971) indicated that heavier animals at any given age tended to be more mature because degrees of maturity were negatively correlated with mature weight. However, as the age interval between degree of maturity and body weight increased, the correlation declined and even became negative if the interval was long enough. Every correlation between degree of maturity and mature weight was negative. Thus animals more mature at any age during growth tended to be lighter at maturity. Consequently, selection for increased weight at a fixed age will inorease weight at that age relatively more than the correlated inorease in weight at maturity. As a result, average degrees of maturity at the age of selection and to a lesser extent at adjacent ages, will be increased.
Smith et (1976b) found that the correlation between weight and degree of maturity at the same age declined as age increased. They believed this was a reflection of a corresponding increase in the part/whole association between immature weights and mature weight.Correlations of Growth Rates with Weights
Fitzhugh and Taylor (1971) indicated that the heavy animals at any age tended to have absolute growth rates well above average in most age intervals. They also
19
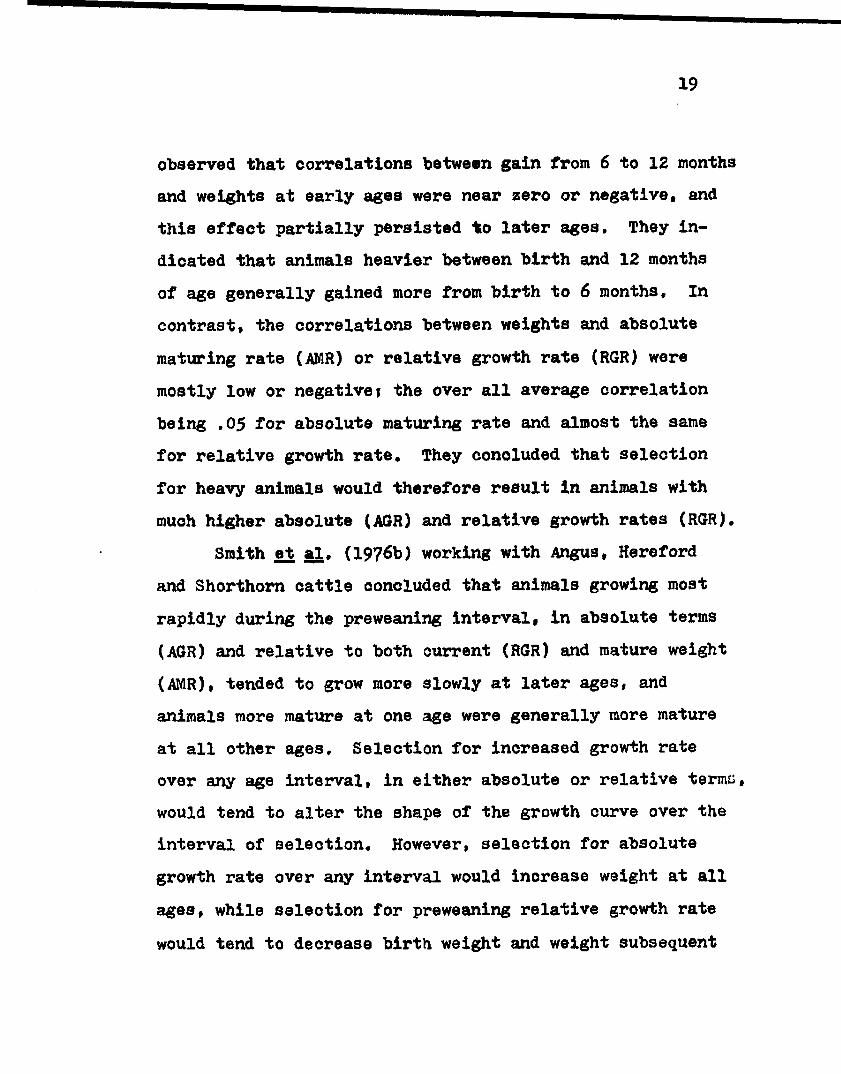
observed that correlations between gain from 6 to 12 months and weights at early ages were near zero or negative, and this effect partially persisted to later ages. They indicated that animals heavier between birth and 12 months of age generally gained more from birth to 6 months. In contrast* the correlations between weights and absolute maturing rate (AMR) or relative growth rate (RGR) were mostly low or negative* the over all average correlation being .05 for absolute maturing rate and almost the same for relative growth rate. They concluded that selection for heavy animals would therefore result in animals with much higher absolute (AGR) and relative growth rates (RGR).
Smith at al. (1976b) working with Angus, Hereford and Shorthorn cattle concluded that animals growing most rapidly during the preweaning interval, in absolute terms (AGR) and relative to both current (RGR) and mature weight (AMR), tended to grow more slowly at later ages, and animals more mature at one age were generally more mature at all other ages. Selection for increased growth rate over any age interval, in either absolute or relative terms, would tend to alter the shape of the growth curve over the interval of selection. However, selection for absolute growth rate over any interval would increase weight at all ages, while selection for preweaning relative growth rate would tend to decrease birth weight and weight subsequent

20
to 550 days but increase 200-, 396-* and 550-day weights.Fitzhugh and Taylor (1971) reported that animals with
above average absolute maturing rates from birth to 6 months of age were markedly more mature at all other ages and especially so from birth to 12 months, as indicated by the genetic correlations of .96 and .89, They concluded that animals more mature than average at any age also tended to be above average in absolute growth rate from birth to 6 months of age and were markedly below average from 18 months to maturity. Smith e£ al* (1976b) reached similar conclusions.
Correlations between degree of maturity and relative growth rate showed a similar pattern to those for absolute growth rate, except that they were all clearly negative for growth between 12 and 18 months of age. These negative correlations indicated that animals more mature at any age had slower relative growth rates beyond 12 months of age (Fitzhugh and Taylor, 1971; Smith et al., 1976b).
Smith et al» (1976b) observed that heifers reaching puberty at younger ages tended to grow more rapidly before weaning and during their seoond summer but tended to grow more slowly during their first winter and subsequent to 550 days. In another set of Hereford heifers also subjected to nutritional stress during their first winter, Fitzhugh and
21
Taylor (1971) concluded that the slow winter growth between 6 to 12 months of age disturbed the general trend of individuals maturing rapidly at early ages to gradually decline in maturing rate at later ages.
MATERIALS AMD METHODS
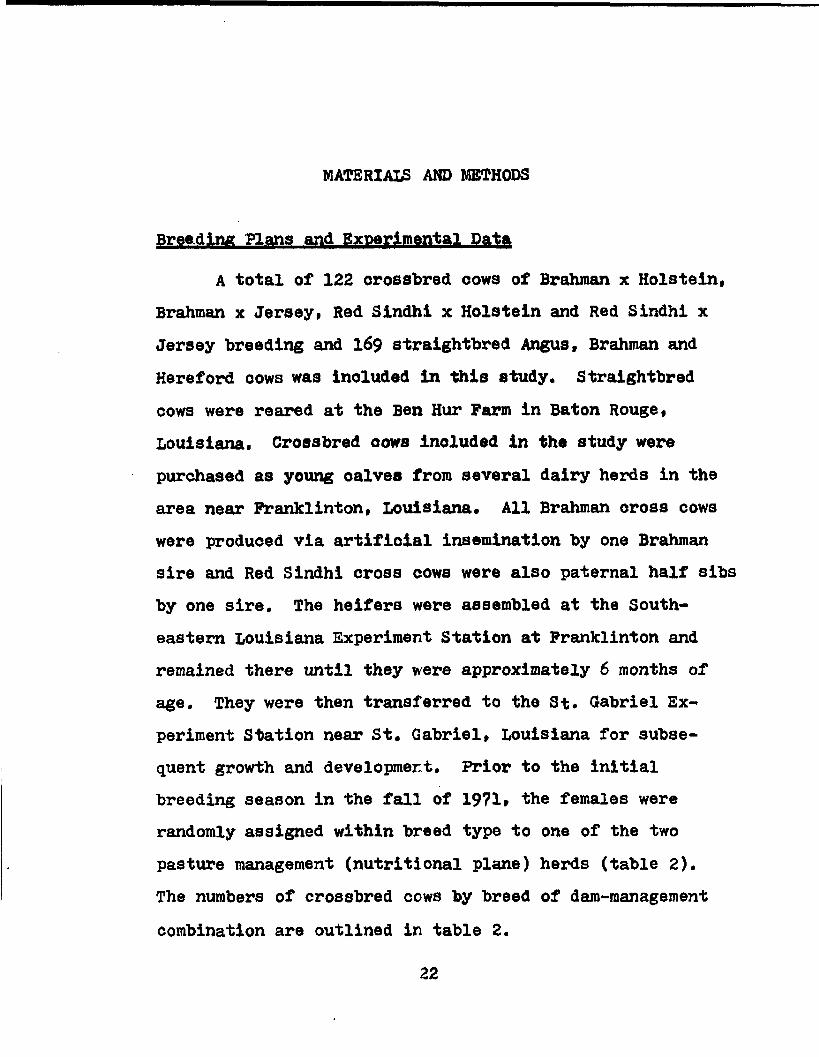
Breeding Plans and Experimental Data
A total of 122 crossbred cows of Brahman x Holstein, Brahman x Jersey, Red Sindhi x Holstein and Red Sindhi x Jersey breeding and 169 straightbred Angus, Brahman and Hereford oows was included in this study. Straightbred cows were reared at the Ben Hur Farm in Baton Rouge, Louisiana, Crossbred oows included in the study were purchased as young calves from several dairy herds in the area near Franklinton, Louisiana. All Brahman cross cows were produced via artificial insemination by one Brahman sire and Red Sindhi cross cows were also paternal half sibs by one sire. The heifers were assembled at the Southeastern Louisiana Experiment Station at Franklinton and remained there until they were approximately 6 months of age. They were then transferred to the St. Gabriel Experiment Station near St. Gabriel, Louisiana for subsequent growth and development. Prior to the initial breeding season in the fall of 1971» the females were randomly assigned within breed type to one of the two pasture management (nutritional plane) herds (table 2).The numbers of crossbred cows by breed of dam-management combination are outlined in table 2.
22
23
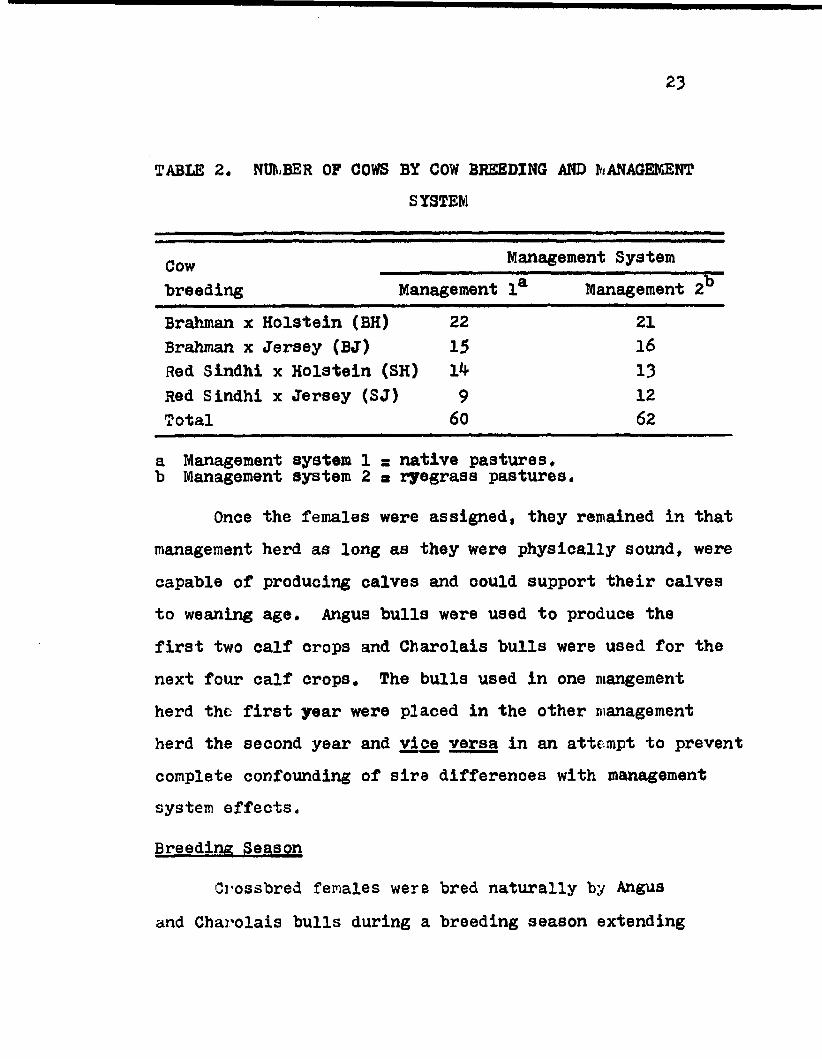
TABLE 2. NUMBER OF COWS BY COW BREEDING AND MANAGEMENTSYSTEM
Cow Management Systembreeding a iiManagement 1 Management 2Brahman x Holstein (BH) 22 21Brahman x Jersey (BJ) 15 16Red Sindhi x Holstein (SH) 14 13Red Sindhi x Jersey (SJ) 9 12Total 60 62
a Management system 1 = native pastures, b Management system 2 = ryegrass pastures.Once the females were assigned, they remained in that
management herd as long as they were physically sound, were capable of producing calves and could support their calves to weaning age. Angus bulls were used to produce the first two calf crops and Charolais bulls were used for the next four calf crops. The bulls used in one mangement herd the first year were placed in the other management herd the second year and vice versa in an attempt to prevent complete confounding of sire differences with management system effects.Breeding Season
Crossbred females were bred naturally by Angus and Charolais bulls during a breeding season extending
Zk
from December 15 through June 15 of each year. This 6- month breeding season allowed each cow up to eight or nine heat periods per year to conceive. By producing fall and winter calves, maximum differences in effect of planes of nutrition and forage quality were generated. The straightbred oows were bred naturally by purebred bulls to produce straightbred calves during a 75 day breeding season from April 15 to July 1 of each year.Management of Cows and Calves
The cow herds were maintained on pastures throughout the year. The crossbred cows in herd management 1 (low plane of nutrition) grazed native pastures of Dallis grass. Common Bermudagrass and Louisiana S-l white clover and received a supplemental winter diet of low quality grass hay fed ad libitum plus approximately 1 to 1.5 kg/head/day of either a cottonseed meal-salt mixture or a commercial liquid protein supplement. Cows in herd management 2 (high plane of nutrition) grazed native spring pastures similar to herd management 1 cows, were moved to millet pastures in the summer and fall and finally were placed on wheat-ryegrass pastures for winter grazing to simulate a high quality nutritional management regime using only forages. The straightbred cows were on similar spring and summer pastures as the crossbred cows and received a

25
winter diet of hay, protein supplementation and winter pasture when available.
Male calves were castrated at birth except the straightbreds which were castrated either at birth or at b months of age. The calves remained with their dams without creep feed until they were weaned at approximately 8 months of age. The crossbred calves were weaned at two different times because of a wide variation in their birth dates as a result of the 6-month breeding season. Those calves b om within the first 90 days of the calving season (September 15 to December 15) were weaned in the first group (season 1), and those born during the last 90 days (December 15 to March 15) were weaned in the second group (season 2).
After weaning, the straightbred heifers were kept for replacements, while the crossbred heifers were either sold or used in other studies. The steers were placed on feed for evaluation of postweaning and carcass traits.Data Collected
Crossbred cows were weighed at birth and subsequent3-month intervals. Straightbred cows were weighed at birth and weaning and yearly weights were subsequently taken at the initiation of each breeding season.All calves ’were Weighed at birth and at weaning

2 6
time. Data on the straightbred Angus, Brahman and Hereford cows were collected from 1953 to 1973 and those on the crossbred cowa and calves were collected from.1969 to 1977.
The weight-age data were analyzed using Brody's model (Brody, 19^5)• Brody's model was employed because Brown et al. (1975) found that the model was adequate in describing the weight-age relationships in cattle and it is relatively easier computationally than other models. Themodel used is as shown belowt
Jc twit ■ Ai " Bie * -it* where thWit m observed body weight of i animal at age t,
(t ■ 1, 2, .......... , N months),Vi■ estimate of asymptotic weight for i animal,
B^ - estimate related to early weight changes in the i*h animal,
e & the base of natural logarithm,- estimate of maturing rate for ith animal, s deviation of the t *1 predicted weight from observed weight for the i^h animal.
The growth parameter estimates were obtained using the nonlinear procedure listed in Statistical Analysis System (SAB 76) by Barr et a^. (19?6 ). Once the growth
27
parameters of each individual oow were determined, they were then analysed for various factors affecting these parameters by using the least-squares procedures of fitting constants with disproportionate subclass numbers as outlined by Harvey (I960).
Several statistical models were used to analyze for the factors affecting mature weight (A) and maturing rate (k), degrees of maturity (u), absolute growth rate (AGR), absolute maturing rate (AMR) and relative growth rate (RGR). For the straightbred cows only the breed of dam was included in the model, because other factors such as year of birth (which is partially confounded with dam age) and dam age were found to be nonsignificant sources of variation in a preliminary analysis. Sire of Cow was not included as a source of variation in the crossbred analyses because sires were confounded with breeds of sire since only one sire per breed of sire was used. In the straight- bred group,most sires produced only one or two daughters.
Model 1* Yjj - u+ Ba+ eAjModel Z% jjj. * u+ + (BC)^ + where
For straightbreds (model ,l)ivariable measured on the cow of the ith breed.
u overall effeot common to all individuals(mean)
28
■ effect due to ith breed, i « 1, 2, 3» e^j ■ random error, assumed normally and indepen
dently distributed with mean zero and variance^.
For crossbreds (model 2)i▲ U 1 UYj ii_ ■ variable measured on the k cow of the ii jk
breed on the management system,u = overall effect common to all individuals
(mean),Bi s effect due to i breed cross, i = 1, 2, 3* 4,Ci a effect due to management system, j • l, 2,
th(BC)ij s interaction effect between i breed of damand management system expressed as deviation from the mean u, and C ,
eijk 9 random orror, assumed normally and independently distributed with mean zero and variance^.
The associations between oow growth parameters with absolute maturing rate (AMR), absolute growth rate (ACR), relative growth rate (RGR) and degrees of maturity (u) were determined using correlations.
The formulae used were given by Brody (19^5). Fitzhugh and Taylor (1971) and Smith e£ al. (1976a) as follows*
AKR a £ (y t2 ~ ytl)(t2 - v
29
RGR
AGR
u(y*2 - y )/2
■ yt/A*where
A
■ degree of maturity at age t,- weight at a particular age t.- weight at age tg (e.g., yearling) s weight at age t^ (e.g., weaning),■ mature weight.
Average cow weights from 5 to 10 years of age were calculated using the crossbred cow data, and phenotypic correlations of these weights with asymptotic mature weight and maturing rate were then calculated. Growth curves were also plotted using the predicted weights for all the cow breeds included in this study.
Linear contrasts were made among the cow breeds for the various dependent variables. Among the straightbreds, Angus females were compared to Brahman and Hereford females. Brahman and Hereford females were compared to each other.In the crossbreds, Brahman cross females (BH, BJ) were compared to Red Sindhi cross females (SH, SJ). Similarly, Holstein cross females (BH, SH) were compared to Jersey
30
cross females (BJ, SJ). Interactions between breeds were compared by the following contrasts (BH+SJ) vs (BJ + SH).
COws and their calves were paired* and correlations between cow growth parameters and calf growth traits were made.
RESULTS AND DISCUSSIONS
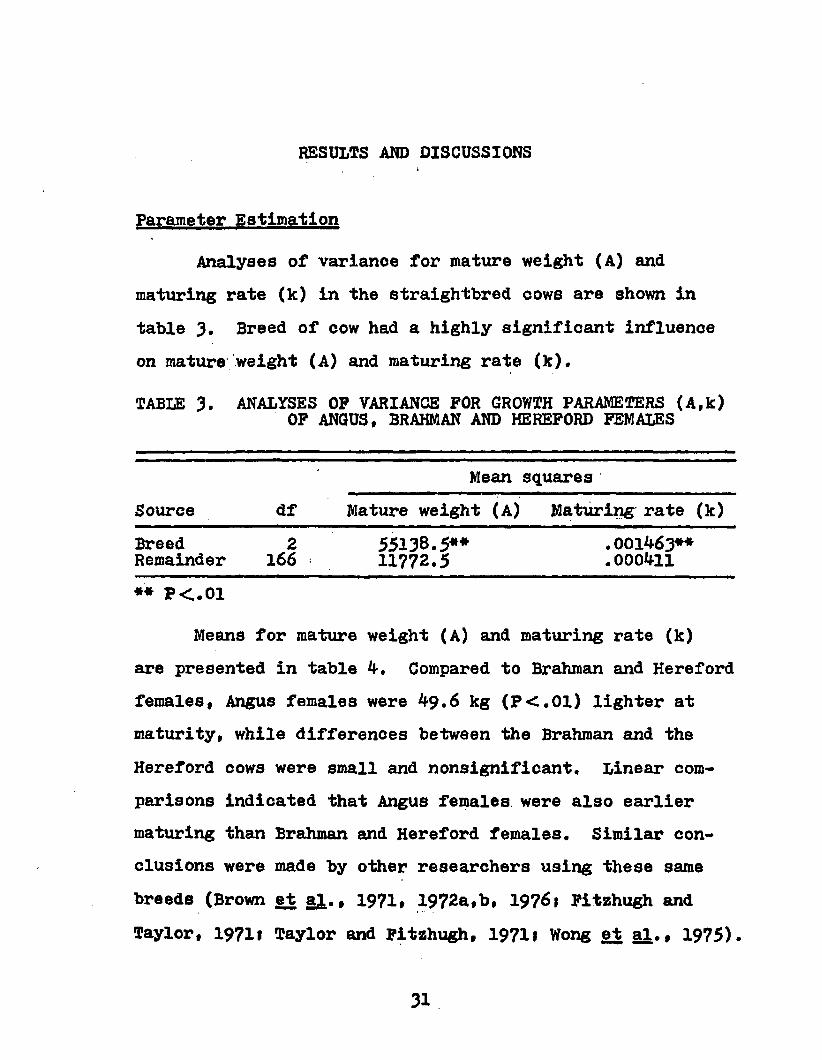
Parameter EstimationAnalyses of variance for mature weight (A) and
maturing rate (k) in the straightbred cows are shown in table 3. Breed of cow had a highly significant influence on mature weight (A) and maturing rate (k).
TABLE 3. ANALYSES OP VARIANCE FOR GROWTH PARAMETERS (A,k)OF ANGUS, BRAHMAN AND HEREFORD FEMALES
Mean squaresSource df Mature weight (A) Maturing rate (k)Breed 2 55138.5** .001463**Remainder 166 11772.5 .000411** P<.01
Means for mature weight (A) and maturing rate (k) are presented in table 4. Compared to Brahman and Hereford females, Angus females were 4-9.6 kg (P<.01) lighter at maturity, while differences between the Brahman and the Hereford cows were small and nonsignificant. Linear comparisons indicated that Angus females were also earlier maturing than Brahman and Hereford females. Similar conclusions were made by other researchers using these same breeds (Brown et al., 1971# 1972a,b, 1976* Fitzhugh and Taylor, 1971I Taylor and Fitzhugh, 1971I Wong et al*, 1975).
31
32
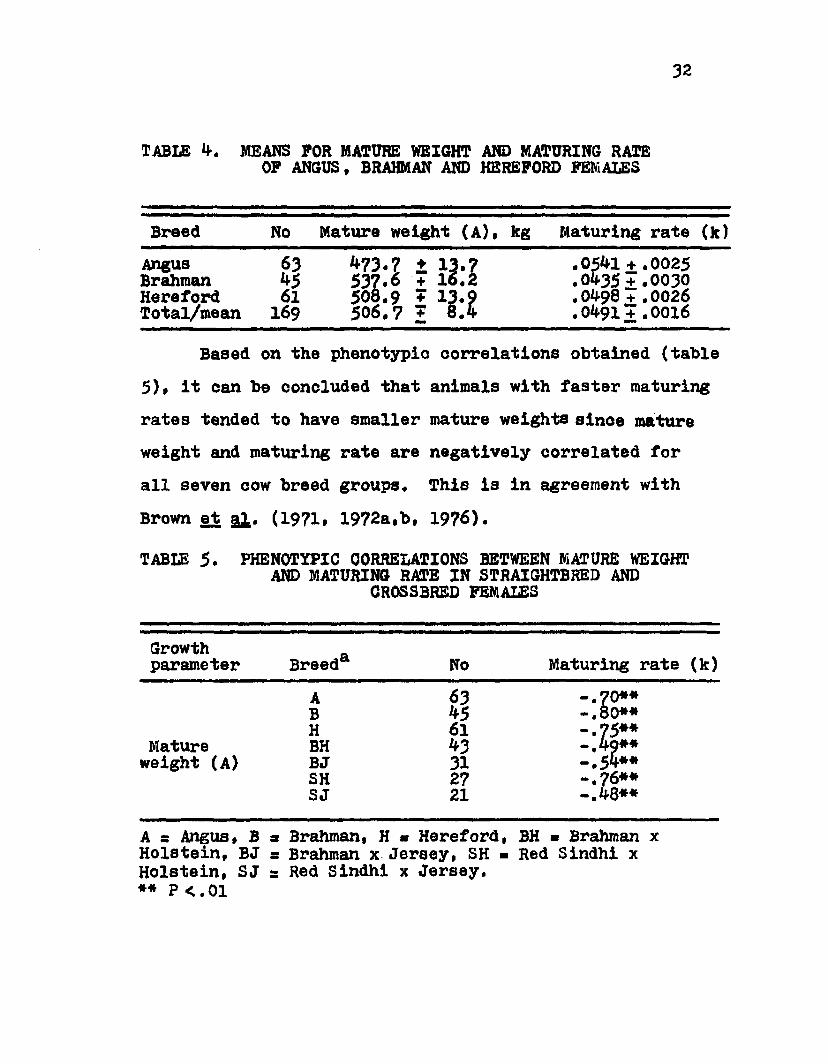
TABLB 4. MEANS FOR MATURE WEIGHT AND MATURING RATE OF ANGUS, BRAHMAN AND HEREFORD FEMALES
Breed No Mature weight (A), kg Maturing rate (k)AngusBrahmanHerefordTotal/mean
?361169
*73.7 + 13.7537.6 + 16.2 508.9 + 13.9506.7 " 8.4
.0541 +.0025 .0&35+.0030 .0498 +.0026 .0491+ .0016
Based on the phenotypic correlations obtained (table5), it can be concluded that animals with faster maturing rates tended to have smaller mature weights since mature weight and maturing rate are negatively correlated for all seven cow breed groups* This is in agreement with Brown et al* (1971» 1972a,b, 1976).TABLE 5. PHENOTYPIC CORRELATIONS BETWEEN MATURE WEIGHT AND MATURING RATE IN STRAIGHTBRED AND CROSSBRED FEMALES
Growthparameter Breeda No Maturing rate (k)
A 63 - . 7 0 * *B 45 - . 80* *H 61 -.75**-.4?**Mature BH ^3
weight (A) BJ 31 -.54**SH 27 -.76**SJ 21 -.48**
A s Angus, B a Brahman, H « Hereford, BH - Brahman x Holstein, BJ s Brahman x Jersey, SH ■ Red Sindhi x Holstein, SJ = Red Sindhi x Jersey.** P <.01
33
Further documentation of this negative association in the straightbreds can be seen when growth curves are plotted as shown in figure 1. The differences between Angus, Brahman and Hereford cows were not very pronounced for weights from birth through about 20 months of age.From this point through maturity Angus cows were smaller at all ages. Differences between Brahman and Hereford cows were less pronounced until about 4-0 months of age, after which Brahman cows were heavier than either Angus or Hereford cows. Brown et al.. (1970, 1971» 1972a,b, 1976) Fitzhugh and Taylor (1971) and Wong et a^., (1975) made similar conclusions when working with Angus, Brahman and Hereford cattle. Once the cows mature, periodic variation in weights would then be caused by changes in body con* dition and pregnancy status.
Least-squares analyses of variance for growth para* meters among crossbred data are presented in table 6. A trend similar to that seen in the straightbred oows can be observed. Cow breeding had a highly significant influence on the mature weight of the four breed groups.

Weight
in Kilograms
3*
600
500
300
200
100
0 20 60 80 100Age in MonthsFigure 1. Mean growth curves for Angus (A), Brahman (B) and Hereford (H) oows.
35
TABLE 6. LEAST-SQUARES ANALYSES OF VARIANCE FOR GROWTH PARAMETERS (A, k) OF BRAHMAN X HOLSTEIN, BRAHMAN X JERSEY, RED SINDHI X HOLSTEIN AND RED SINDHI X JERSEY FEMALES
Mean squaresSource df Mature weight (A) Maturing rate (k)Breed (B) 3 159281.6** .000092Management (M) 1 9120,6 .003759**B x M 3 ^329.2 .000031Remainder 11& 2979.5 .000050** P *.01
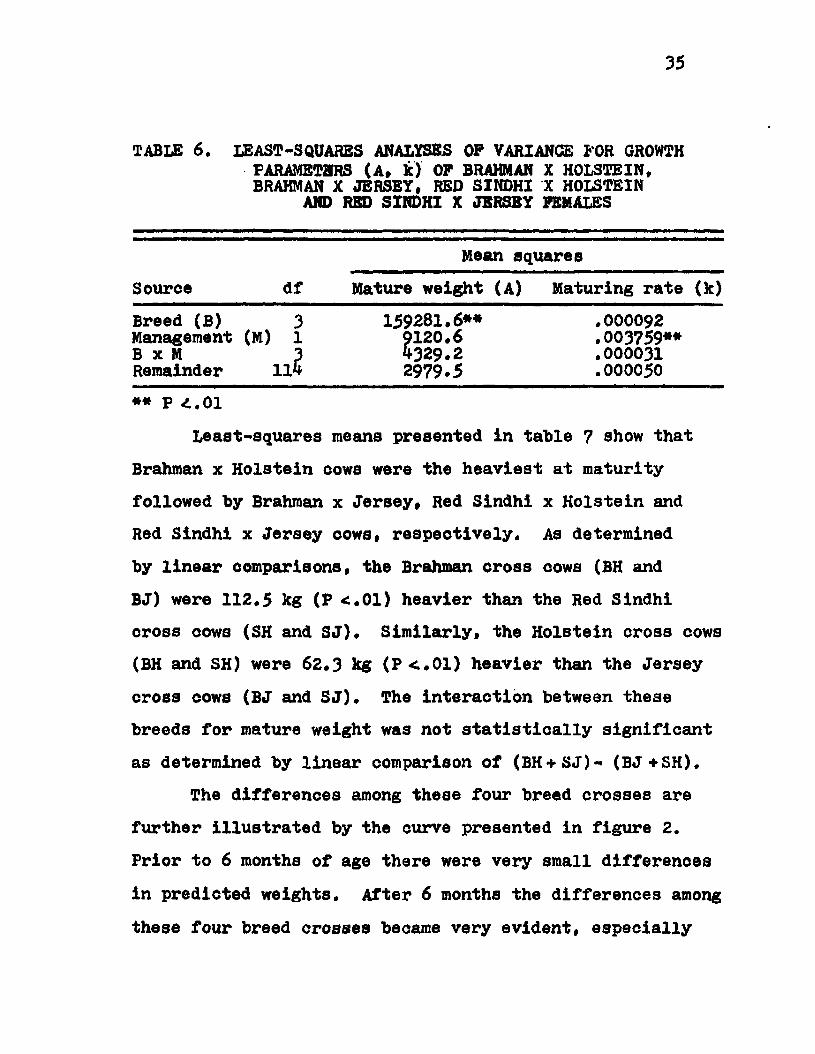
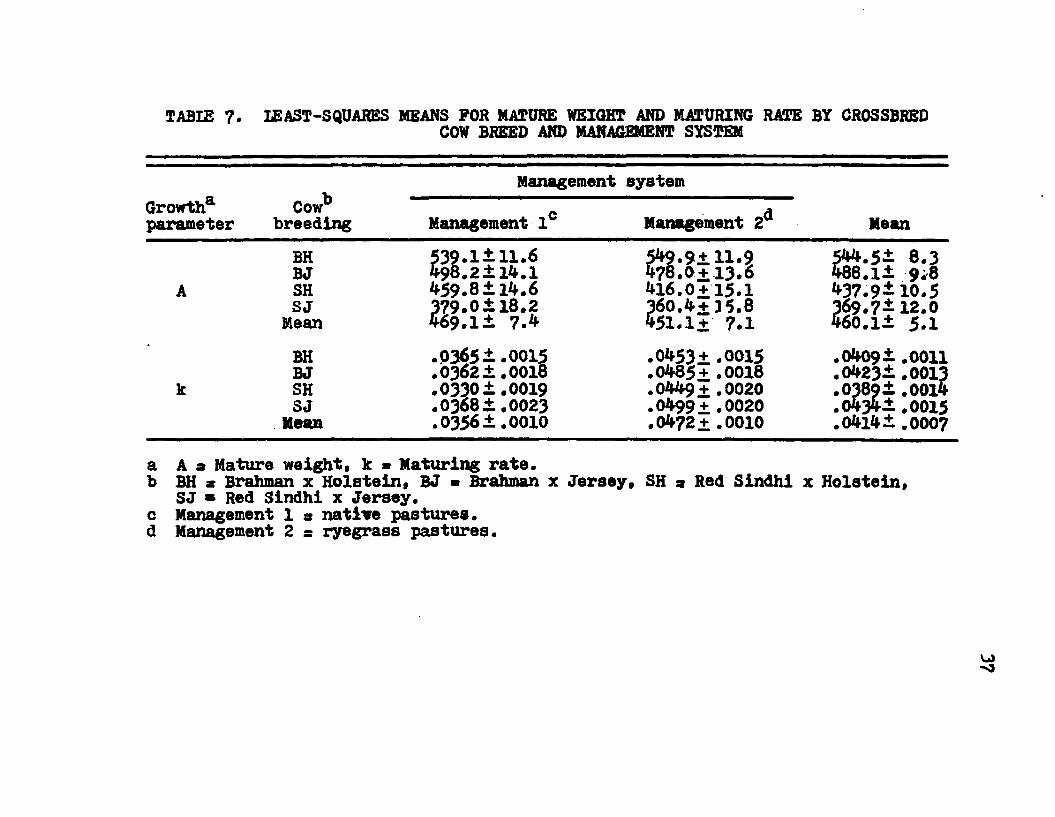
Least-squares means presented in table 7 show that Brahman x Holstein cows were the heaviest at maturity followed by Brahman x Jersey, Red Sindhi x Holstein and Red Sindhi x Jersey oows, respectively. As determined by linear comparisons, the Brahman cross cows (BH and BJ) were 112.5 kg (P *.01) heavier than the Red Sindhi cross cows (SH and SJ). Similarly, the Holstein cross cows (BH and SH) were 62.3 kg (P<,01) heavier than the Jersey cross cows (BJ and SJ). The interaction between these breeds for mature weight was not statistically significant as determined by linear comparison of (BH+SJ)- (BJ+SH).
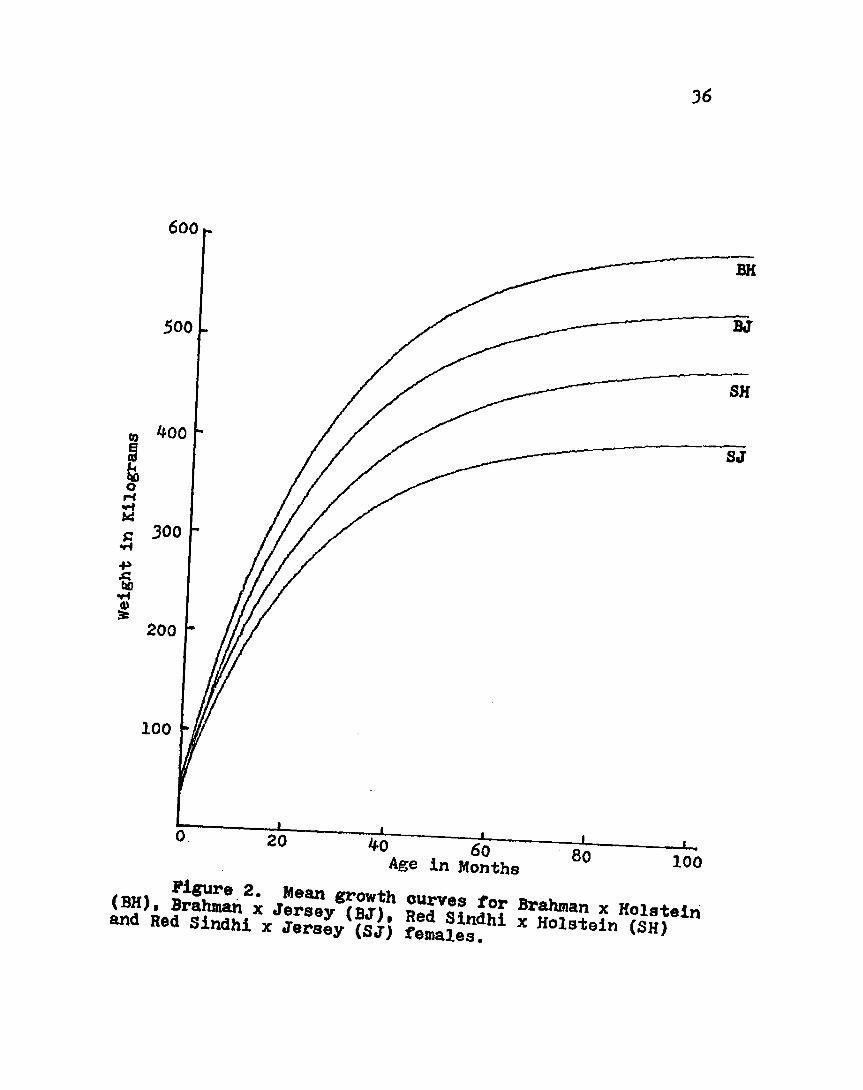
The differences among these four breed crosses are further illustrated by the curve presented in figure 2. Prior to 6 months of age there were very small differences in predicted weights. After 6 months the differences among these four breed crosses became very evident, especially
36
600
BH
500 BJ
SHn 400
SJ
M 300c■P■S.Cao
200
100
20100Age In Months
Figure 2. Mean growth curves for Brahman x Holstein (BH), Brahman x Jersey (BJ), Red Sindhi x Holstein (SH) and Red Sindhi x Jersey (SJ) females.
TABIC 7. LEAST-SQUARES MEANS FOR MATURE WEIGHT AND MATURING RATE BY CROSSBREDCOW BREED AND MANAGEMENT SYSTEM
V Management systemGrowthaparameter
Cowbreeding Management 1° Management 2d Mean
ABHBJSHSJMean
539.1± 11.6 498.2 ±14.1 459.8 ±14.6 379.0± 18.2 469.1i 7.4
549.9±11.9 478.0+13.6 416.0+15.1 360.4+15.8 451.1+ 7 .1
544.5± 8.3488.1± 9 ;8 437.9*10.5 369.7*12.0460.i± 5 .1
kBHBJSHSJMean
.0365 ±.0015
.0362 ± .0 0 1 8
.0330 ±.0019
.0368 ±.0023 .0356 ±.0010
.0453+ .0015 .0485+ .0018 .0449+ .0020
.0499+ .0020
.0472+ .0010
.0409* .0011 .0423±.0013 .0389±.ooi4
.o434± .0015,04l4± .000?a A a Mature weight, k - Maturing rate.b BH * Brahman x Holstein, BJ » Brahman x Jersey, SH s Red Sindhi x Holstein, SJ » Red Sindhi x Jersey, c Management 1 a natiwe pastures, d Management 2 = ryegrass pastures.
VjJ*>3
38
between the largest mature weight group (BH) and the smallest mature weight group (SJ). At maturity the differences were large, and it can be oonoluded that these four crosses had different patterns of growth and mature weights.
Although management system did not have a significant influence on mature weight (A) (table 6), all crosses, except Brahman x Holstein cows, were smaller at maturity in management system 2 than those in management system 1 (table 7). This peculiar response to pasture management system whs not expected, since cows should have reached maturity by the time they reached 108 months and should have had similar mature weights. As shown in table 8, the observed mature weights followed patterns similar to the asymptotic mature weights (A). Cows in management system 1 were heavier than those in management system 2.The exact reason is not known. Cows in management system 1 may have had a higher degree of body condition, because many of these cows were dry. On the other hand, most cows in management system 2 were nursing calves and thus might have experienced greater weight loss than management system 1 cows. Similar observations were made by Humes (1976). He reported that *¥7.9% and 7.6# of the management system 1 and management system 2 cows, respectively, were dry.
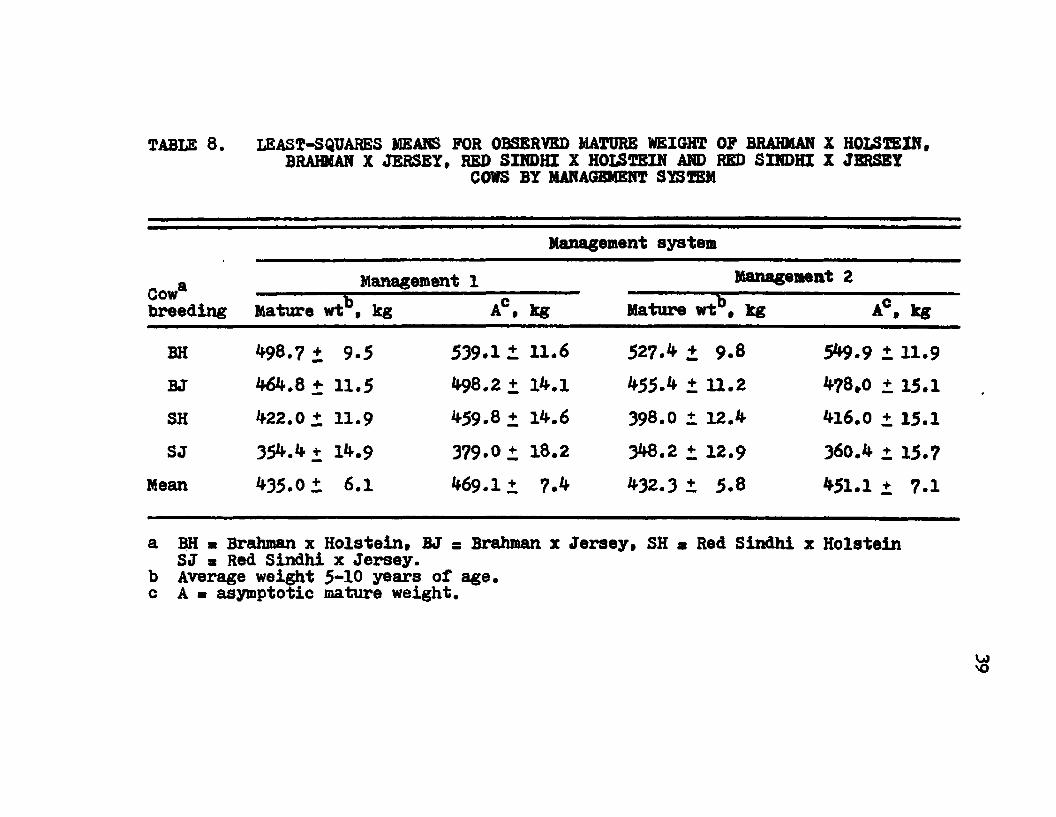
TABLE 8. LEAST-SQUARES MEANS FOR OBSERVED MATURE WEIGHT OF BRAHMAN X HOLSTEIN, BRAHMAN X JERSEY, RED SINDHI X HOLSTEIN AND RED SINDHI X JERSEYCOWS BY MANAGEMENT SYSTEM
Cowabreeding
Management systemManagement 1 Management 2
Mature wt , kg AC, kg Mature wt*, kg AC, kgBH W . 7+ 9.5 539.1 ± 11 .6 527 .4 + 9 .8 549.9 1 11.9BJ 464.8+ 11 .5 498.2 + 14.1 455.4 t 11 .2 478,0 + 15 .1
SH 422.0+ 11.9 459 .8 + 14.6 398.0 + 12.4 416.0 + 15.1SJ 354.4+ 14.9 379.0 + 18.2 348.2 + 12.9 360.4 + 15.7
Mean 435.0 + 6.1 469.1 + 7.4 432.3 + 5.8 451.1 + 7.1
a BH m Brahman x Holstein, BJ = Brahman x Jersey, SH a Red Sindhi x Holstein SJ s Red Sindhi x Jersey, b Average weight 5-10 years of age. c A m asymptotic mature weight.
40
600 BH
BJSH500
nIorH•H« 300C
<U* 200
100
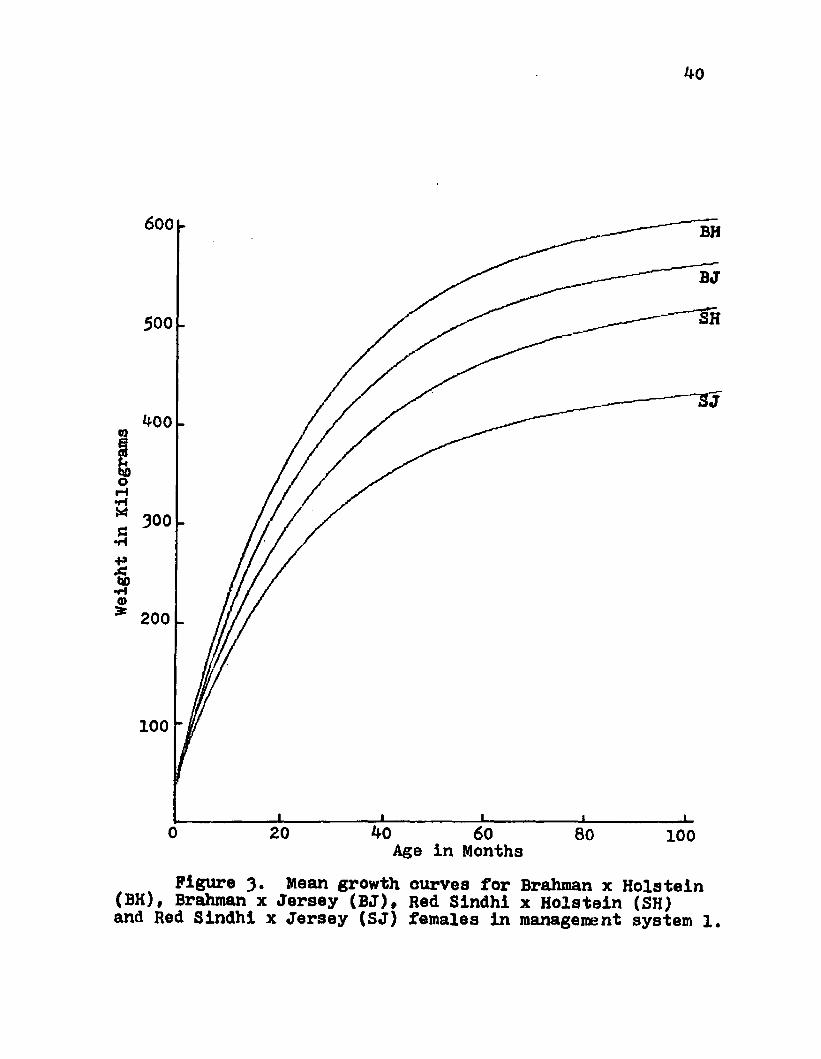
20 100Age in MonthsFigure 3 . Mean growth curves for Brahman x Holstein
(BH), Brahman x Jersey (BJ), Red Sindhi x Holstein (SH) and Red Sindhi x Jersey (SJ) females in management system 1.
Weight in
Kilograms
600
500 BJ
SH
SJ
300
200
100
-10040 8020 100
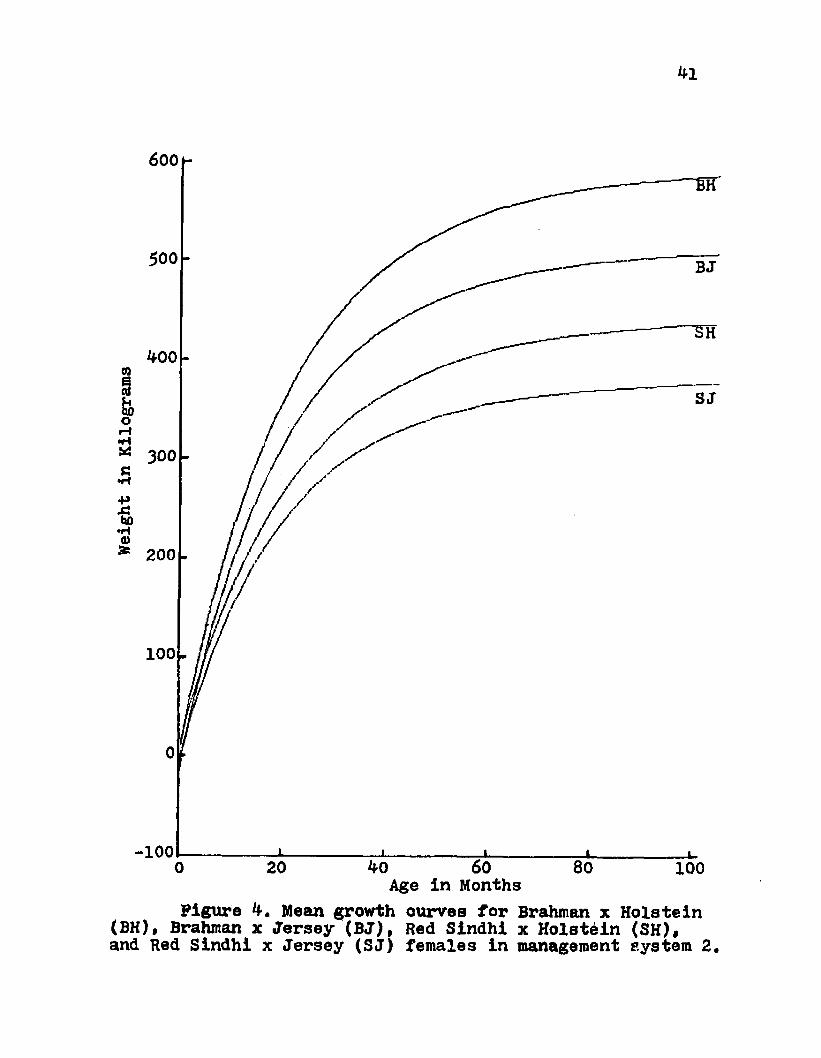
Age in MonthsFigure 4. Mean growth curves for Brahman x Holstein
(BH), Brahman x Jersey (BJ), Red Sindhi x Holstein (SH), and Red Sindhi x Jersey (SJ) females in management system 2.
In figures 3 and 4 the growth curves are plotted by management system for each breed group. Similar patterns in mature weight (A) were observed for both management systems* except that the rates of approach to maturity were faster for all cow breeds in management system 2 than in management system 1. Thus it can be conoluded that management system did not alter the observed mature weight or the asymptotic mature weight (A) in the crossbreds.
Cow breeding x management system interaction did not have a significant influence on mature weight (A).This laok of interaction becomes obvious from inspection of the curves in figures 3 and 4 as similar breed rankings were observed in each management system.
As shown in table 6, cow breeding did not have a significant influence on maturing rate (k)t however, management system did have a highly significant influence on maturing rate (k). Within each management system, all breeds had similar rates of maturing (k), although cows in management system 2 had larger (P<,01) values than those in management system 1, indicating that cows in management system 2 were earlier maturing (table 7). To substantiate this finding, growth curves are plotted as shown in figure 5. The growth curve for cows in management system 2 had a steeper slope from birth through 20 months than management system 1 cows.
Weight in
Kilograms
43
600
500
300
200
100
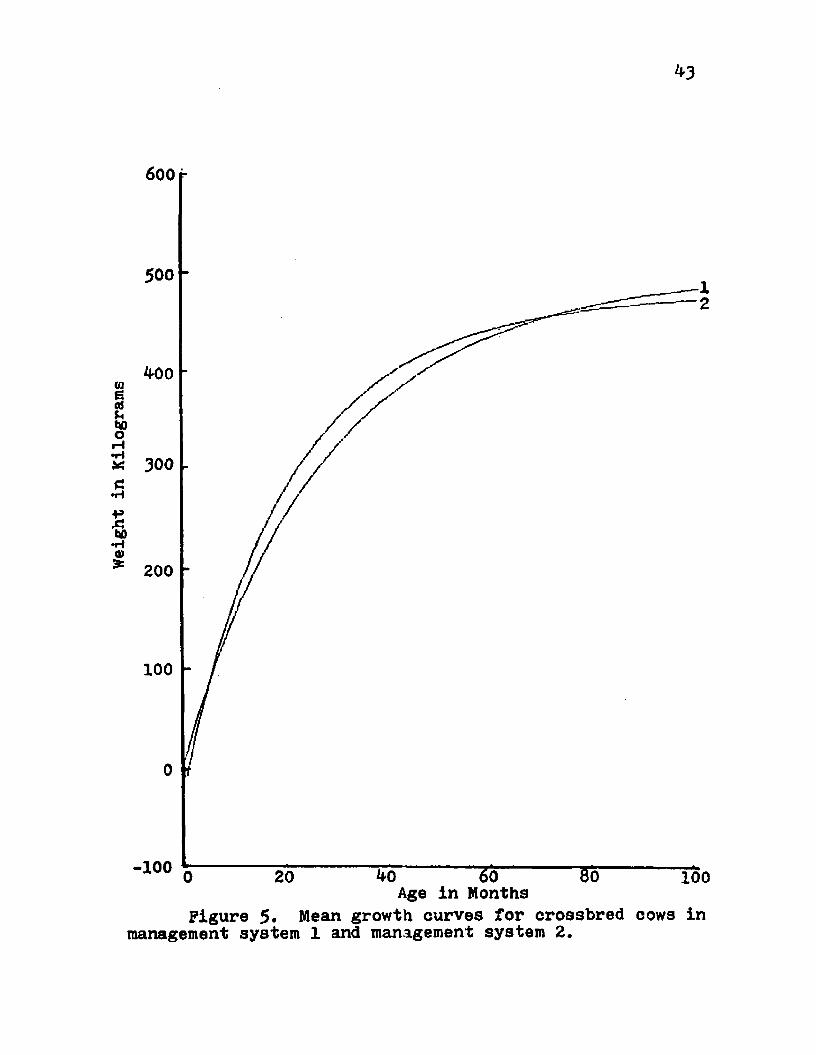
-100 20 100Age in MonthsFigure 5. Mean growth curves for crossbred cows in
management system 1 and management system 2.
In figure 5# the overall pattern of growth of all cows in management system 1 (native pasture) can be compared to cows in management system 2 (ryegrass pasture). Note that the estimated birth weight of the females in management system 2 was slightly negative. This lack of fit for early weights prior to 6 months of age was also reported by Brown et a],. (1976). However, the equation estimated the observed pattern of growth reasonably well after 6 months of age as shown by the correlations of .94-, *94’, *98 and .95 between asymptotic mature weight (A) and average weight (5 to 10 years) for Brahman x Holstein, Brahman x Jersey, Red Sindhi x Holstein and Red Sindhi x Jersey, respectively. This is in agreement with the observations of Brown &£ a^. (1976). From about 8 months of age through 72 months of age, females on management system 2 were heavier than those on management system 1 after which cows on management system 1 tended to have a heavier estimated weight. This is in agreement with the observed weights shown in table 8 (4-35*0 vs 4-32.3 kg). Perhaps, animals heavy at maturity tended to grow longer and be relatively smaller in body weight at earlier ages. A similar suggestion was made by Fitzhugh and Taylor (1971) and Smith e$ §^. (1976b).
The mean rate of maturing (k) parameters was much
45
lower for the crossbred oows than for straightbreds (.04 vs .05). This could be due to the poor early environment provided for the crossbred oows. They were weaned prior to ? days of age and were not fed any supplemental grain after they were 7 months of age. Based on differences in the rates of maturing among the two pasture management herds of crossbred cows, it can be concluded that growth patterns of cattle can be altered by modifying the environment to which the animals are subjected.Degrees of Maturity and Their Relationship to Growth Parameters
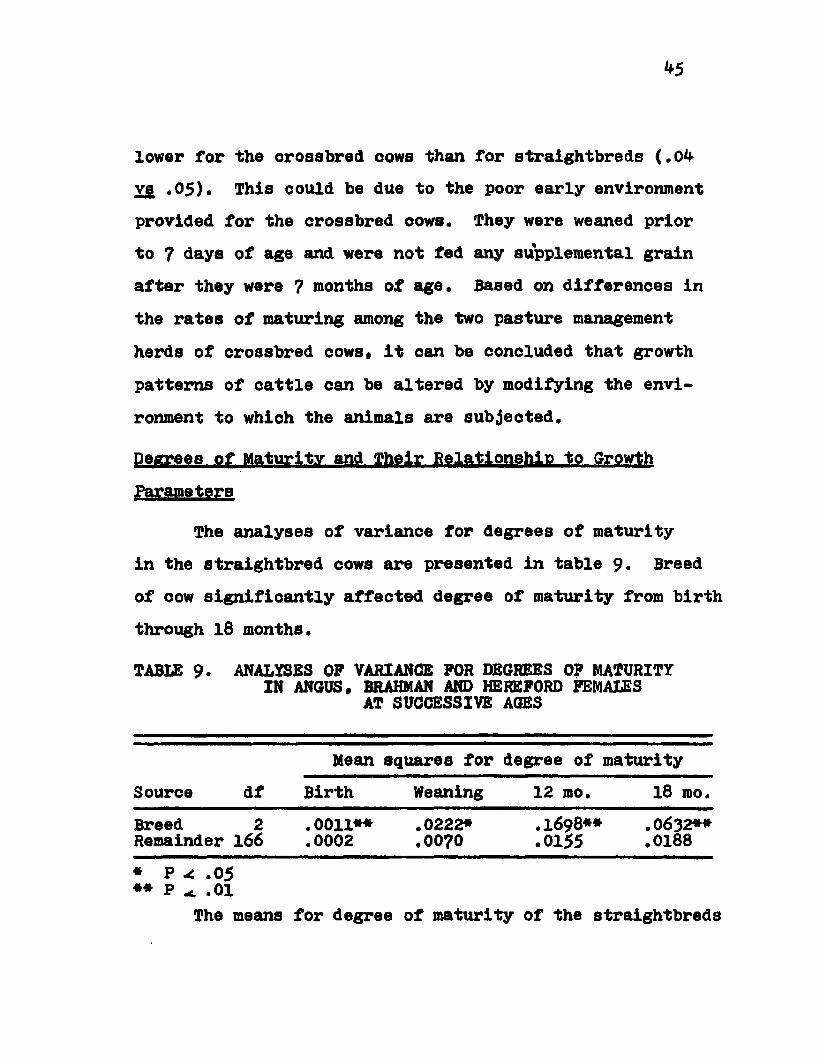
The analyses of variance for degrees of maturity in the straightbred cows are presented in table 9 . Breed of cow significantly affected degree of maturity from birth through 18 months.TABLE 9 . ANALYSES OF VARIANCE FOR DEGREES OF MATURITY IN ANGUS( BRAHMAN AND HEREFORD FEMALESAT SUCCESSIVE AGES
Mean squares for degree of maturitySource df Birth Weaning 12 mo. 18 mo.Breed 2 Remainder 166 .0011** .0222*
.0002 .0070.1698** .0632** .0155 .0188
* P .05** P .01The means for degree of maturity of the straightbreds
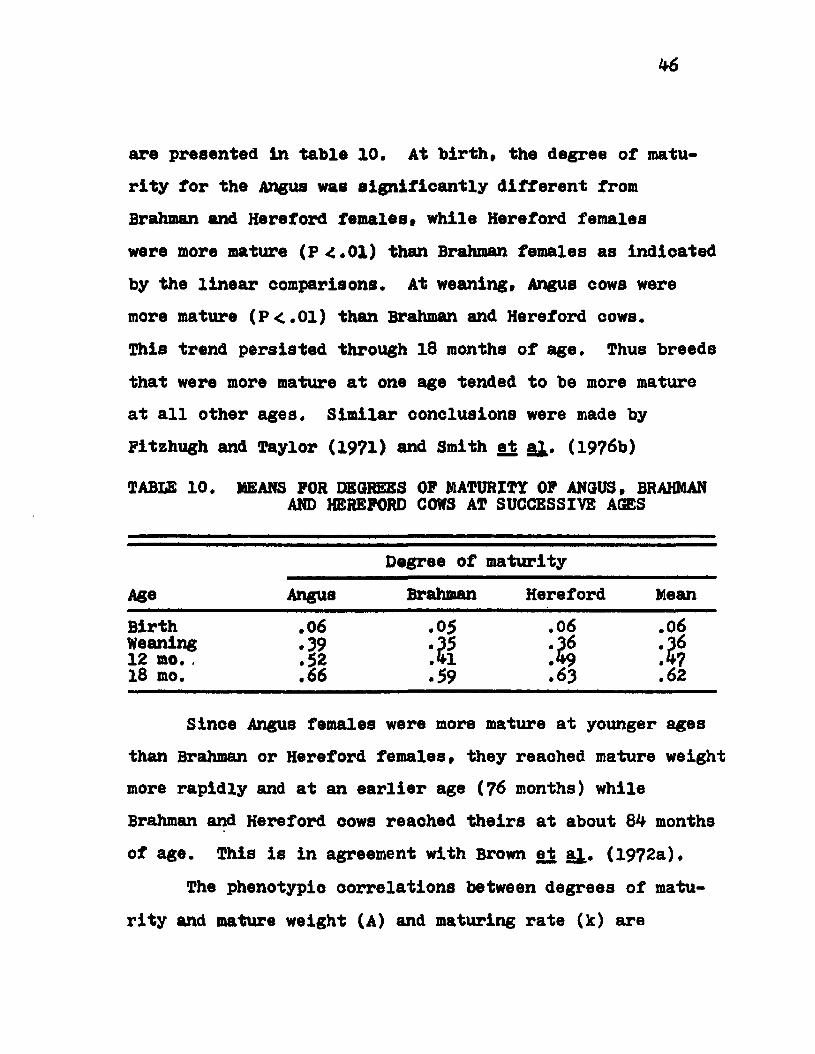
4-6
are presented In table 10. At birth, the degree of maturity for the Angus was significantly different from Brahman and Hereford females, while Hereford females were more mature (P4.01) than Brahman females as indicated by the linear comparisons. At weaning, Angus cows were more mature (P<.01) than Brahman and Hereford cows.This trend persisted through 18 months of age. Thus breeds that were more mature at one age tended to be more mature at all other ages. Similar conclusions were made by Fitzhugh and Taylor (19?1) and Smith et §1. (1978b)TABLE 10. MEANS FOR DEGREES OF MATURITY OF ANGUS, BRAHMANAND HEREFORD CONS AT SUCCESSIVE AGES
AgeDegree of maturity
Angus Brahman Hereford MeanBirth .06 .05 .06 .06Weaning .39 .36 .3612 mo., .52 M M18 mo. .66 .59 .63 .62
Since Angus females were more mature at younger ages than Brahman or Hereford females, they reached mature weight more rapidly and at an earlier age (78 months) while Brahman and Hereford cows reached theirs at about 8k months of age. This is in agreement with Brown at a^. (1972a).
The phenotypic correlations between degrees of maturity and mature weight (A) and maturing rate (k) are
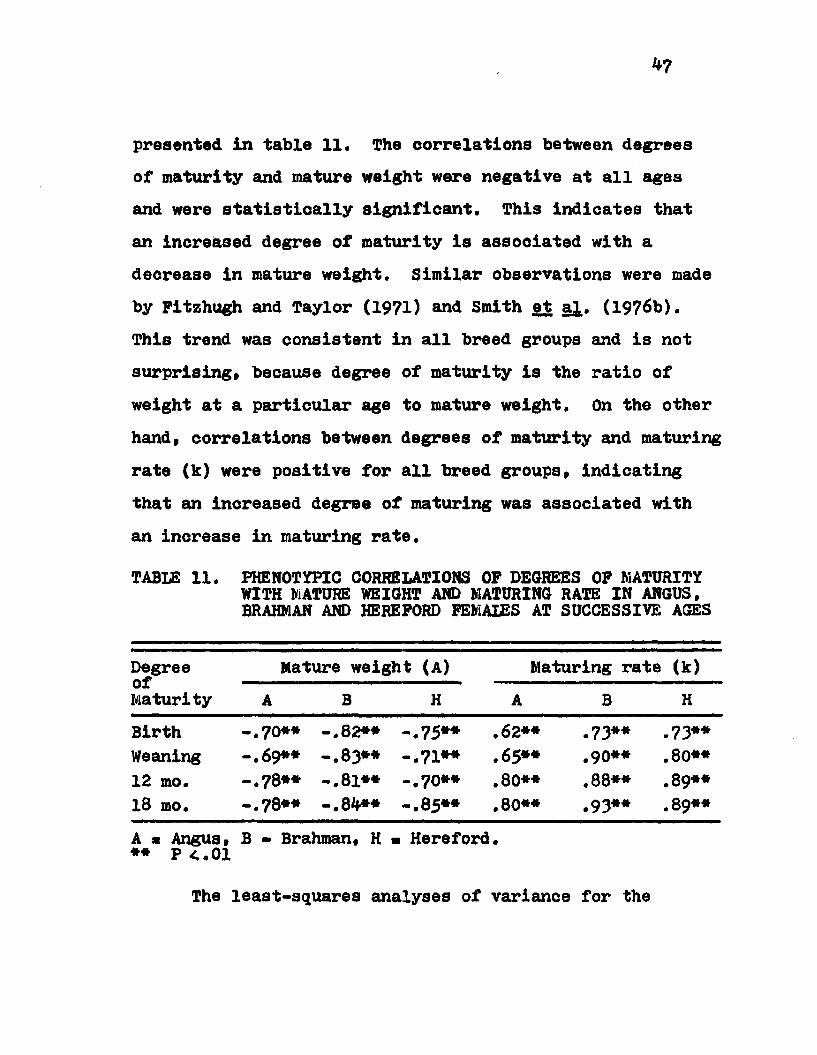
presented in table 11. The correlations between degrees of maturity and mature weight were negative at all ages and were statistically significant. This indicates that an increased degree of maturity is associated with a decrease in mature weight. Similar observations were made by Fitzhugh and Taylor (1971) and Smith et aj,. (1976b).This trend was consistent in all breed groups and is not surprising, because degree of maturity is the ratio of weight at a particular age to mature weight. On the other hand, correlations between degrees of maturity and maturing rate (k) were positive for all breed groups, indicating that an increased degree of maturing was associated with an increase in maturing rate.TABLE 11. PHENOTYPIC CORRELATIONS OF DECREES OF MATURITY WITH MATURE WEIGHT AND MATURING RATE IN ANGUS, BRAHMAN AND HEREFORD FEMAIES AT SUCCESSIVE AGES
DegreeofMaturityMature weight (A) Maturing rate (k)
A B H A B HBirth -.70** -.82** -.75** .62** .73** .73**Weaning -.69** -.83** -.71** .65** .90** .80**12 mo. -.78** -.81** -.70** .80** .88** .89**18 mo. -.78** -.81*** -.85** .80** .93** .89**A * Angus, B - Brahman, H ■ Hereford. ** P<.01
The least-squares analyses of variance for the
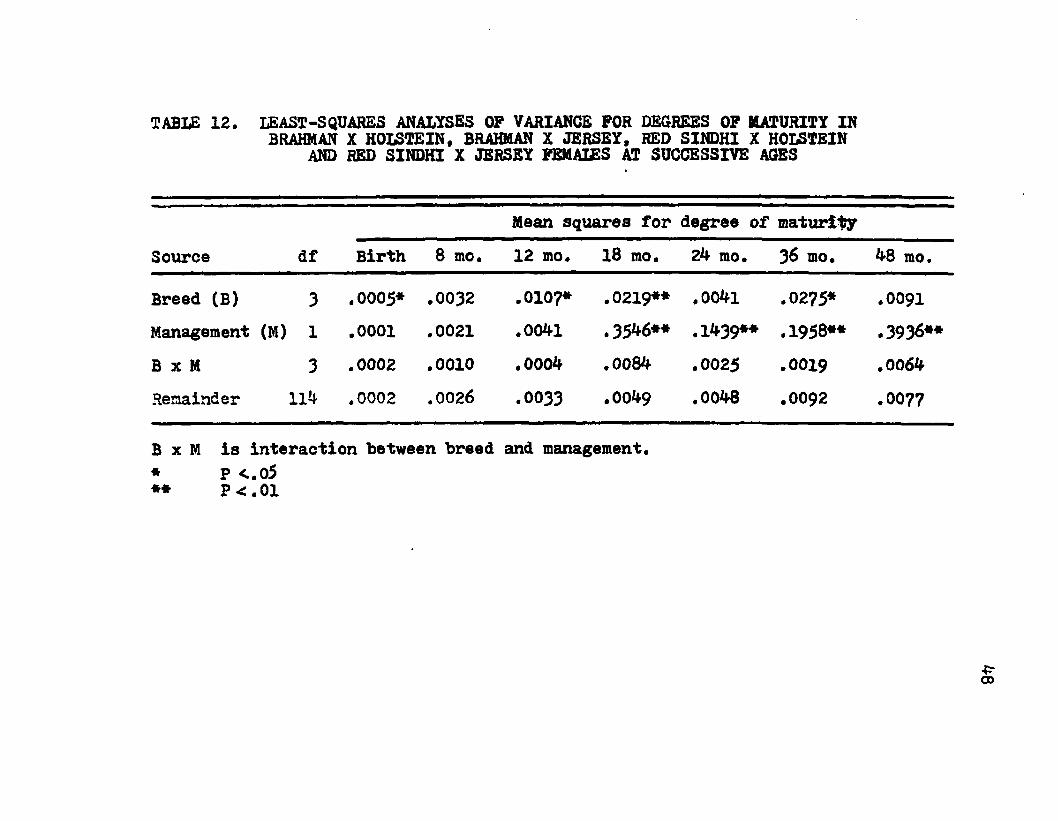
TABLE 12. LEAST-S QUAKES ANALYSES OF VARIANCE FOR DEGREES OF MATURITY IN BRAHMAN X HOLSTEIN, BRAHMAN X JERSEY, RED SINDHI X HOLSTEIN
AND RED SINDHI X JERSEY FEMAIES AT SUCCESSIVE AGES
Source dfMean squares for degree of maturity
Birth 8 mo. 12 mo. 18 mo. 24 mo. 36 mo. 48 mo.
Breed (B) 3 .0005* .0032 .0107* .0219** .0041 .0275* .0091Management (M) 1 .0001 .0021 .0041 .3546** .1439** .1958** .3936**B x M 3 .0002 .0010 .0004 .0084 .0025 .0019 .0064Remainder 114 .0002 .0026 .0033 .0049 .0048 .0092 .0077
B x M Is interaction between breed and management.* p <.o5** P ^ . O i
CD
crossbred are presented in table 12. Breed of cow had a significant influence on degree of maturity at birth, 12, 18, and 36 months, while management system significantly affected degree of maturity after 18 months of age.
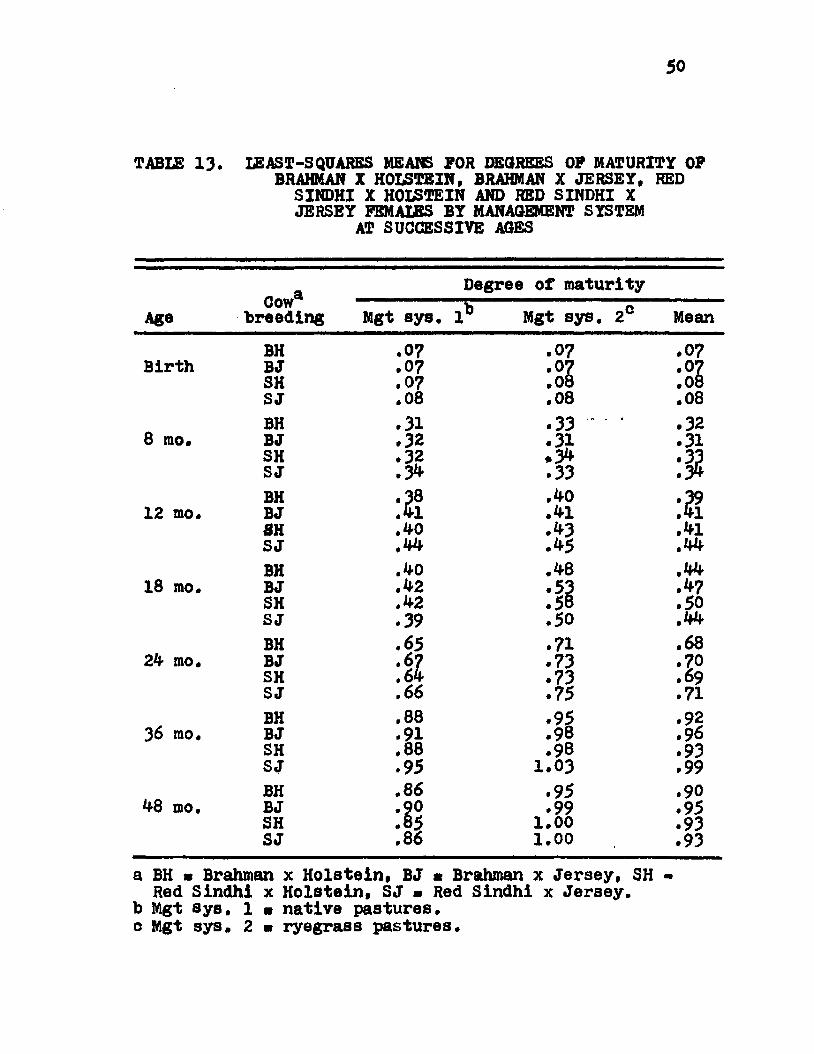
Least-squares means for degrees of maturity of Brahman x Holstein, Brahman x Jersey, Red Sindhi x Holstein and Red Sindhi x Jersey females are presented in table 13. Red Sindhi cross females (SH and SJ) were more mature than Brahman cross females (BH and BJ) at birth (P<,01), 8
(P< .05) and 18 months (P<,01) of age as determined by linear comparisons. Similarly, Jersey cross females (BJ and SJ) were more mature than Holstein cross females (BH and SH) at 12 (P<C.05) and 36 months (P< .01) of age. A similar conclusion can be made for crossbred as for straightbred females, i.e., breeds more mature at one age tended to be more mature at other ages. No other studies have used cows of similar breeding to the crossbred cows used in this study. However, based on values obtained on the straightbreds in this study and those in the literature (Fitzhugh and Taylor, 1971* Smith et a^., 1976b), these estimates are within the reported range of values.
Management system significantly influenced degree of maturity from 18 through 4-8 months of age (table 12). Cows In management system 2 were more mature (P<.01) than those in management system 1. Degree of maturity from birth
50
TABLE 13. IEAST-S QUAKES MEANS FOR DEGREES OF MATURITY OF BRAHMAN X HOLSTEIN, BRAHMAN X JERSEY, RED SINDHI X HOLSTEIN AND RED SINDHI X JERSEY FEMALES BY MANAGEMENT SYSTEM AT SUCCESSIVE AGES
Degree of maturityAge Cowbreeding VMgt sys. 1° Mgt sys. 2c Mean
BH .07 .07 .07Birth BJ .07 •°zSH .07 .08 .08SJ .08 .08 .08
8 mo. BH .31 .33 ~ ‘ .32BJ .32 • 31 .31SH .32 *34 .33SJ .3^ • 33 .34BH .38 .40 .3912 mo. BJ .41 .41 .41SH A O • 43 .41SJ .44 M .44BH .40 .48 .44
18 mo. BJ .42 *53 .47SH .42 • 58 .5°SJ .39 .50 Ulia t f
BH .65 .71 .6824 mo. BJ •§7 .73 .7°SH .64 .73 .69SJ 166 .75 .71
BH .88 .95 .9236 mo. BJ .91 .98 .9 6SH .88 .98 .93SJ .95 1.03 .99**8 mo. BH .86 .95 .90BJ •9° .99 .95SH .85 1.00 .93SJ .86 1.00 .93a BH ■ Brahman x Holstein, BJ * Brahman x Jersey, SH -Red Sindhi x Holstein, SJ ■ Red Sindhi x Jersey,b Mgt sys. l ■ native pastures,c Mgt sys, 2 m ryegrass pastures.

51
through 12 months was not Influenced by management system probably because the heifers were placed in the management systems after they were 12 months of age.
Cow breeding x management system Interaction was not statistically significant (table 12), indicating that similar rankings existed within each management system.
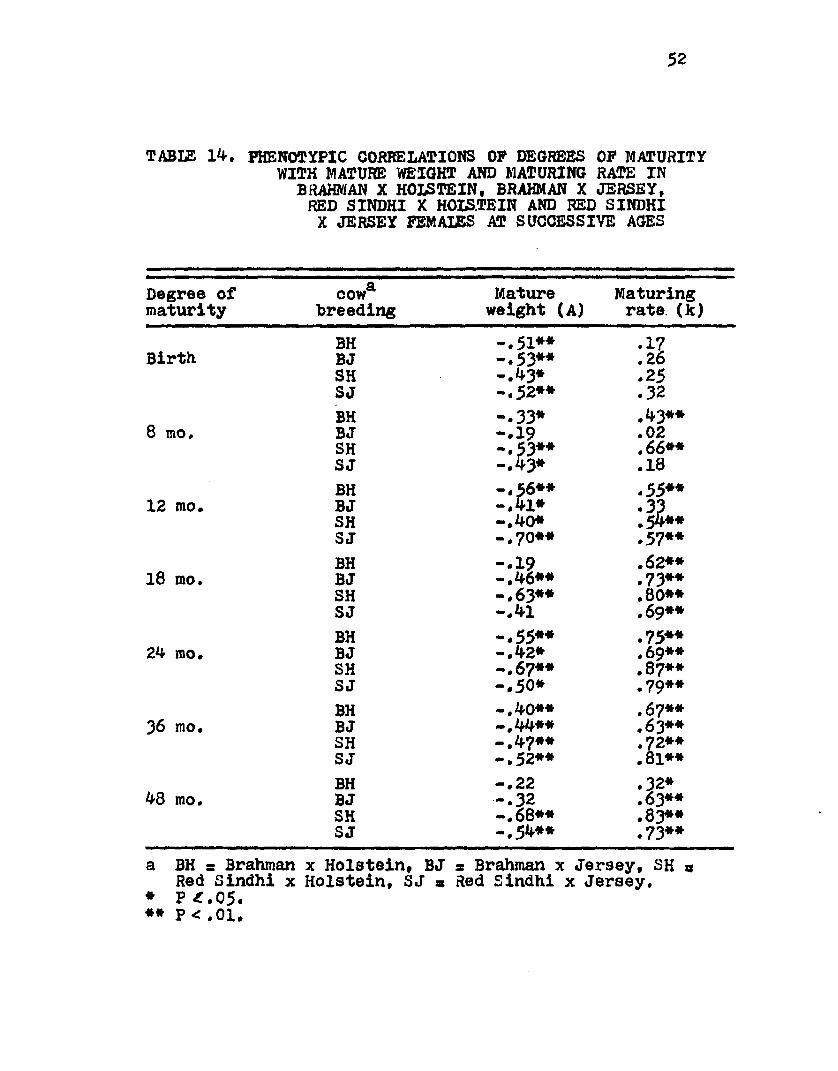
Phenotypic correlations between degree of maturity and mature weight (A) are presented in table l2*. All correlations were negativefwhich indicated that a lower degree of maturity was associated with an increase in mature weight. Although all the association were negative, they were smaller for crossbred females than for straightbred females.
Phenotypic correlations between degrees of maturity and maturing rate (k) were positive in all crossbred cow groups (table 14). However, the correlations at birth and 8 months of age were frequently small and nonsignificant. These correlations are in marked contrast with the results obtained for the straightbred cows and may be reflective of the particular environment to which the crossbred heifers were subjected in the early stages of their growth and development.
52
TABIE 14. PHENOTYPIC CORRELATIONS OP DEGREES OP MATURITY WITH MATURE WEIGHT AND MATURING RATE IN BRAHMAN X HOLSTEIN, BRAHMAN X JERSEY,RED SINDHI X HOLSTEIN AND RED SINDHIX JERSEY FEMAIES AT SUCCESSIVE AGES
Degree of cowa Mature Maturingmaturity breeding weight (A) rate (k)BH -.51** .17Birth BJ -.53** .26SH -.43* .25SJ -.52** .32
8 mo. BH -.33* .43**BJ -.19 .02SH -.53**-.43*.66**SJ .18
BH -.56** .55**12 mo. BJ -.41* .33SH -.40* .54**SJ -.70** .57**BH -.19 .62**18 mo. BJ -.46** .73**SH -.63** .80**SJ -.41 .69**BH -.55** .75**24 mo. BJ -.42* .69**SH -.67** .87**SJ -.50* ,79**BH -.40** .67**36 mo. BJ -.44** .63**SH -.4?** .72**SJ -.52** .81**BH -.22 .32*48 mo* BJ -.32 .63**SH -.68** .83**SJ -.5^** .73**
a BH s Brahman x Holstein, BJ a Brahman x Jersey, SH s Red Sindhi x Holstein, SJ « Red Sindhi x Jersey.* P -f .05.** P <.01.
53
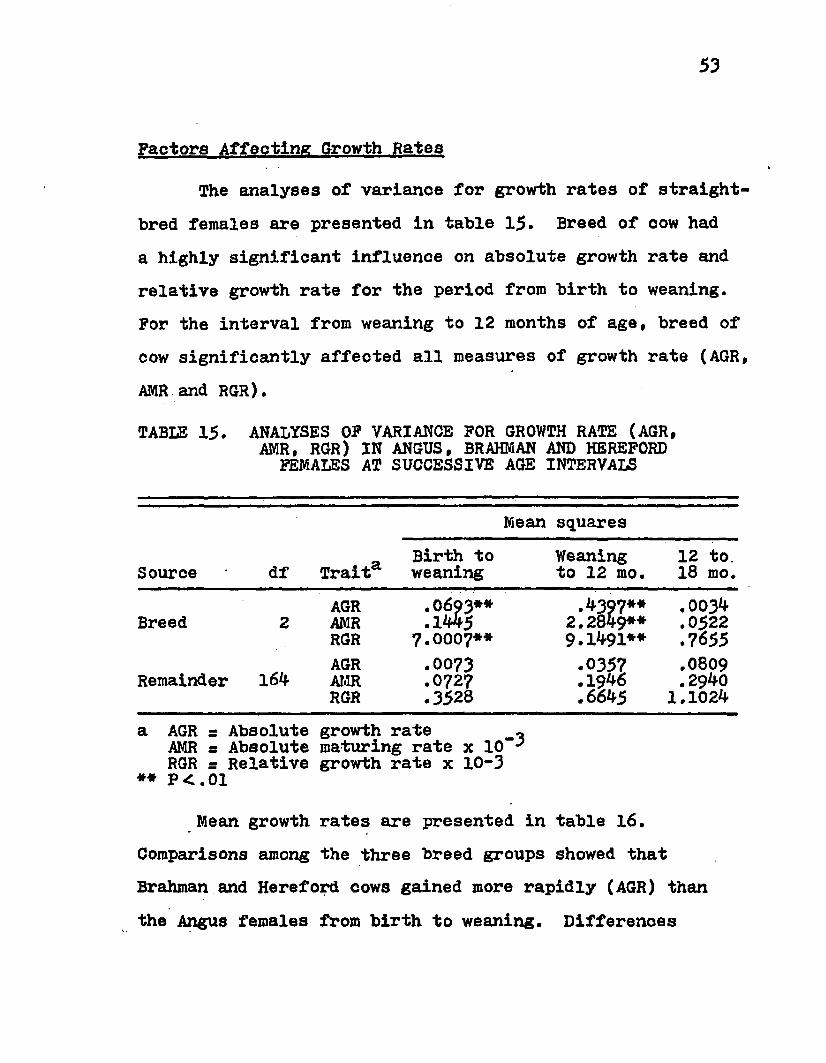
Factors Affecting Growth Hates
The analyses of variance for growth rates of straight- bred females are presented in table 15. Breed of oow had a highly significant influence on absolute growth rate and relative growth rate for the period from birth to weaning. For the interval from weaning to 12 months of age, breed of cow significantly affected all measures of growth rate (AGR, AMR and RGR).TABLE 15. ANALYSES OF VARIANCE FOR GROWTH RATE (AGR,AMR, RGR) IN ANGUS, BRAHMAN AND HEREFORD
FEMALES AT SUCCESSIVE AGE INTERVALS
Mean squares
Source df Traita Birth to weaning Weaning to 12 mo. 12 to. 18 mo.
Breed 2AGRAMRRGR
.0693**
. W 57 .0007**
.4307**2.2849**9.1491**
.0034
.0522
.7655Remainder 164
AGRAMRRGR
.0073
.0727.3528.0357.1946.661*5
.0809.29401.1024a AGR s Absolute growth rate «AMR s Absolute maturing rate x 10“-*RGR = Relative growth rate x 10-3** P<.01
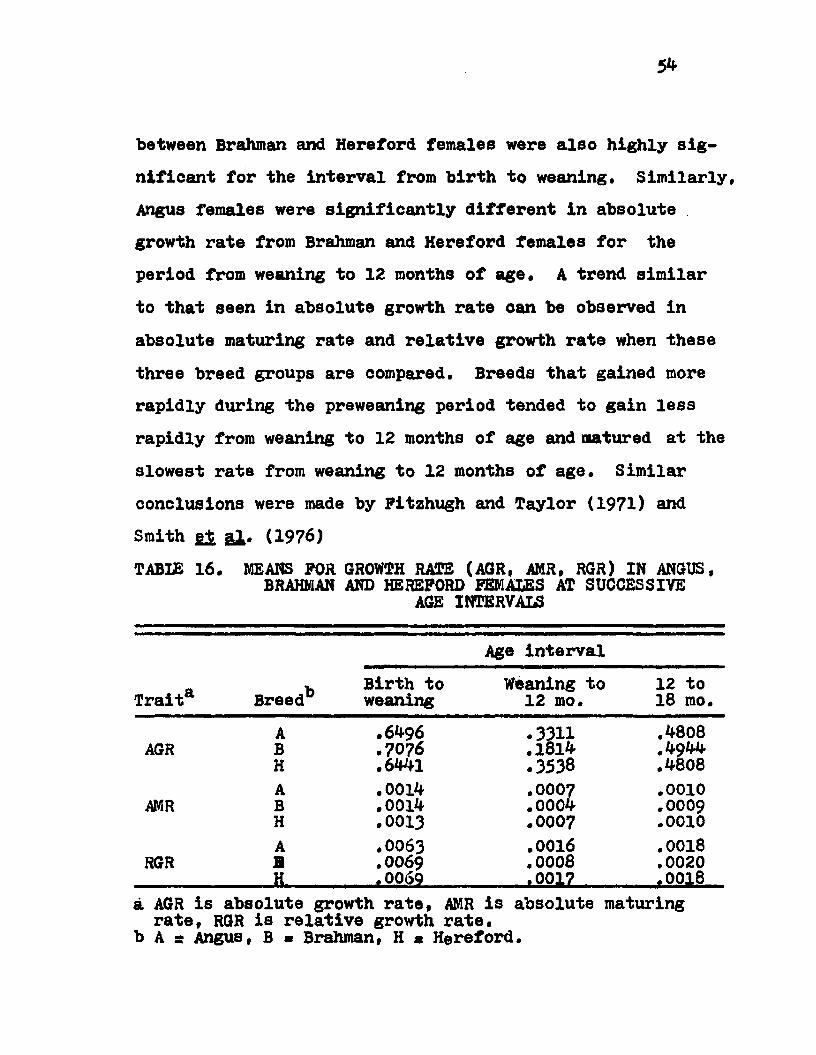
Mean growth rates are presented in table 16. Comparisons among the three breed groups showed that Brahman and Hereford cows gained more rapidly (AGR) than the Angus females from birth to weaning. Differences
54
between Brahman and Hereford females were also highly significant for the interval from birth to weaning. Similarly. Angus females were significantly different in absolute growth rate from Brahman and Hereford females for the period from weaning to 12 months of age. A trend similar to that seen in absolute growth rate can be observed in absolute maturing rate and relative growth rate when these three breed groups are compared. Breeds that gained more rapidly during the preweaning period tended to gain less rapidly from weaning to 12 months of age and matured at the slowest rate from weaning to 12 months of age. Similar conclusions were made by Fitzhugh and Taylor (1971) and Smith et a].. (1976)TABUS 16. MEANS FOR GROWTH RATE (AGR. AMR. RGR) IN ANGUS.BRAHMAN AND HEREFORD FEMALES AT SUCCESSIVE
AGE INTERVALS
Age interval
Traita Breed** Birth to weaning Weaning to 12 mo.
12 to 18 mo.A .6496 .3311 .4808
AGR B .7076 .1814 .4944H .6441 .3538 .4808A .0014 .0007 .0010
AMR B .0014 .0004 .0009H .0013 .0007 .0010A .0063 .0016 .0018RGR B .0069 .0008 .0020H .0060 -tPP17____ .0018
a AGR is absolute growth rate. AMR is absolute maturing rate, RGR is relative growth rate, b A a Angus, B - Brahman, H « Hereford.
55
Least-squares analyses of variance for growth rates (AGR, AMR, RGR) of Brahman x Holstein, Brahman x Jersey,Red Sindhi x Holstein and Red Sindhi x Jersey females are presented in table 17* Breed of cow significantly affected absolute growth rate for the interval from birth to 36
months of age. Breed of cow also significantly influenced absolute maturing rate from 8 to 24 months and relative growth rate from 8 to 24 and 36 to 48 months of age. Management system had a highly significant influence on all measures of growth rate (AGR, AMR, and RGR) for the interval from 12 to 24 months of age. Brahman cross females (BH and BJ) gained faster (P<,01) in absolute terms than Red Sindhi cross females (SH and SJ) for the interval from birth to 35 months of age as determined by linear comparisons (table 18). Similarly, Holstein cross females (BH and SH) gained more rapidly (P-c.01) than the Jersey cross females (BJ and SJ) for the period from birth to 8
months and 12 to 24 months. For the interval from 12 to 24 months Brahman cross females (BH and BJ) gained significantly faster (P<,05) than Red Sindhi cross females (SH abd SJ) in terms of relative growth rate (RGR) and absolute maturing rate (AMR). Linear comparisons among the Holstein cross females (BH and SH) showed that these crosses gained (F<.05) faster than the Jersey cross
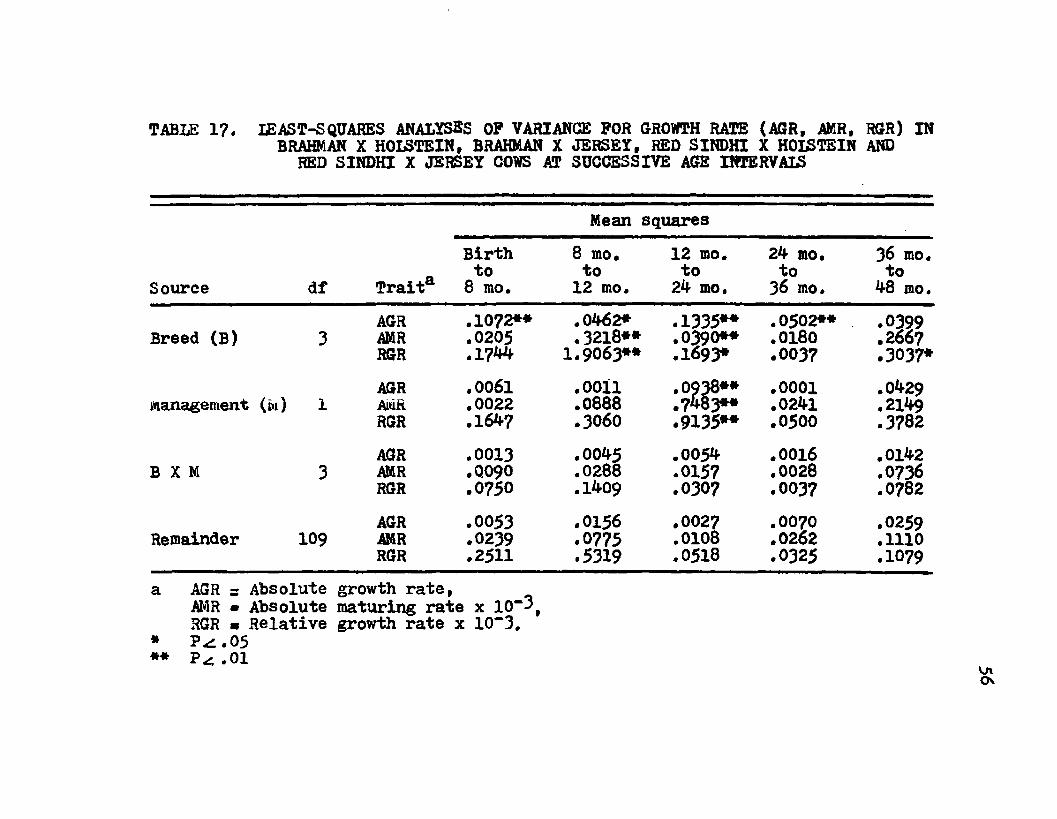
TABLE 17. IE AS T-SQUARES ANALYSES OP VARIANCE FOR GROWTH RATE (AGR, AMR, RGR) IN BRAHMAN X HOLSTEIN, BRAHMAN X JERSEY, RED SINDHI X HOISTEIN AND RED SINDHI X JERSEY COWS AT SUCCESSIVE AGE INTERVALS
Mean squares
Source df Trait3
Birthto
8 mo.8 mo. to
12 mo.12 mo. to24 mo.
24 mo. to36 mo.
36 mo, to 48 mo.
AGR .1072** .0462* .1335** .0502** .0399Breed (B) 3 AMR .0205 .3218** .0390** .0180 .2667RGR .1?44 1.9063** .1693* .0037 .3037*AGR .0061 .0011 .0938** .0001 .0429management (m) 1 AMR .0022 .0888 .7483** .0241 .2149RGR .1647 .3060 .9135** .0500 .3782AGR .0013 .0045 .0054 .0016 .0142
B X M 3 AMR .0090 .0288 .0157 .0028 .0736RGR .0750 .1409 .0307 .0037 .0782AGR .0053 .0156 .0027 .0070 .0259Remainder 109 AMR .0239 .0775 .0108 .0262 .1110RGR .2511 .5319 .0518 .0325 .1079
a AGR s Absolute growth rate,AMR ■ Absolute maturing rate x 10“3f RGR ■ Relative growth rate x 10*3.
* .05** P^.Olo\
57
females (BJ and SJ) In absolute maturing rate for the period from 8 to 24 months and in relative growth rate for the interval from 8 to 12 months and 36 to 48 months of age.
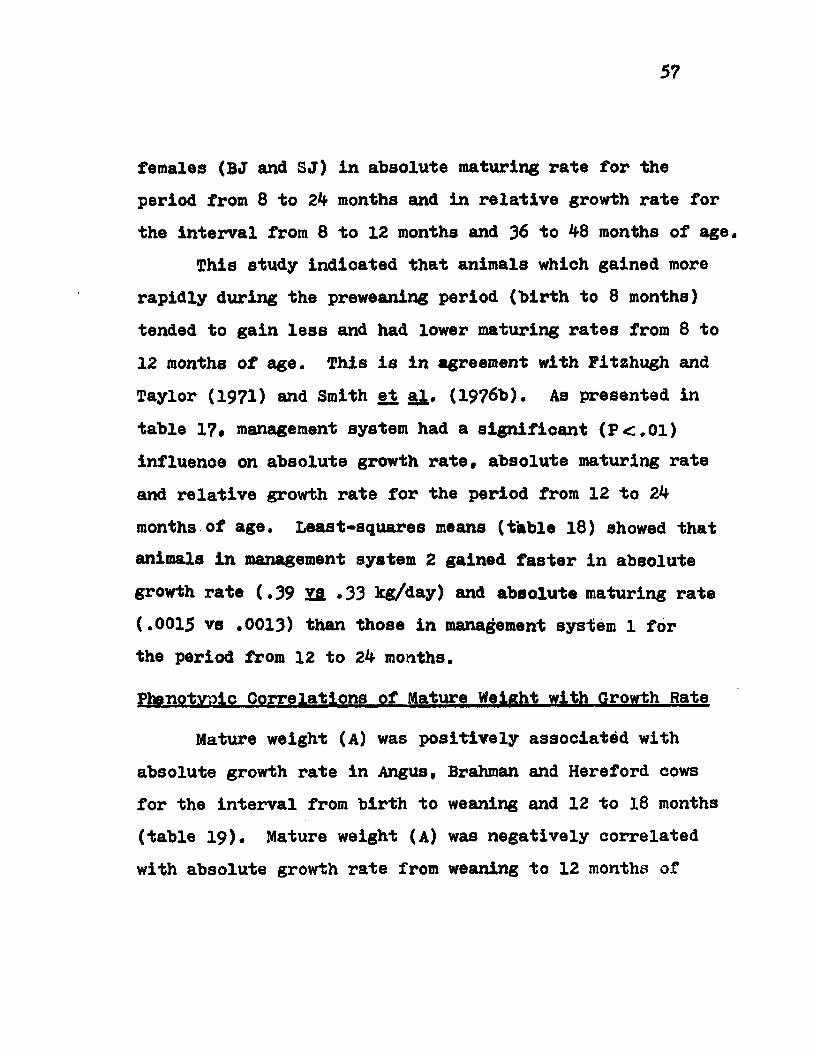
This study indicated that animals which gained more rapidly during the preweaning period (birth to 8 months) tended to gain less and had lower maturing rates from 8 to 12 months of age. This is in agreement with Fitzhugh and Taylor (1971) and Smith et al. (1976b). As presented in table 17* management system had a significant (P<.01) influence on absolute growth rate, absolute maturing rate and relative growth rate for the period from 12 to 24 months of age. Least-squares means (table 18) showed that animals in management system 2 gained faster in absolute growth rate (.39 XS. *33 kg/day) and absolute maturing rate (.0015 vs .0013) than those in management system 1 for the period from 12 to 24 months.Phenotypic Correlations of Mature Weight with Growth Rate
Mature weight (A) was positively associated with absolute growth rate in Angus, Brahman and Hereford cows for the interval from birth to weaning and 12 to 18 months (table 19). Mature weight (A) was negatively correlated with absolute growth rate from weaning to 12 months of
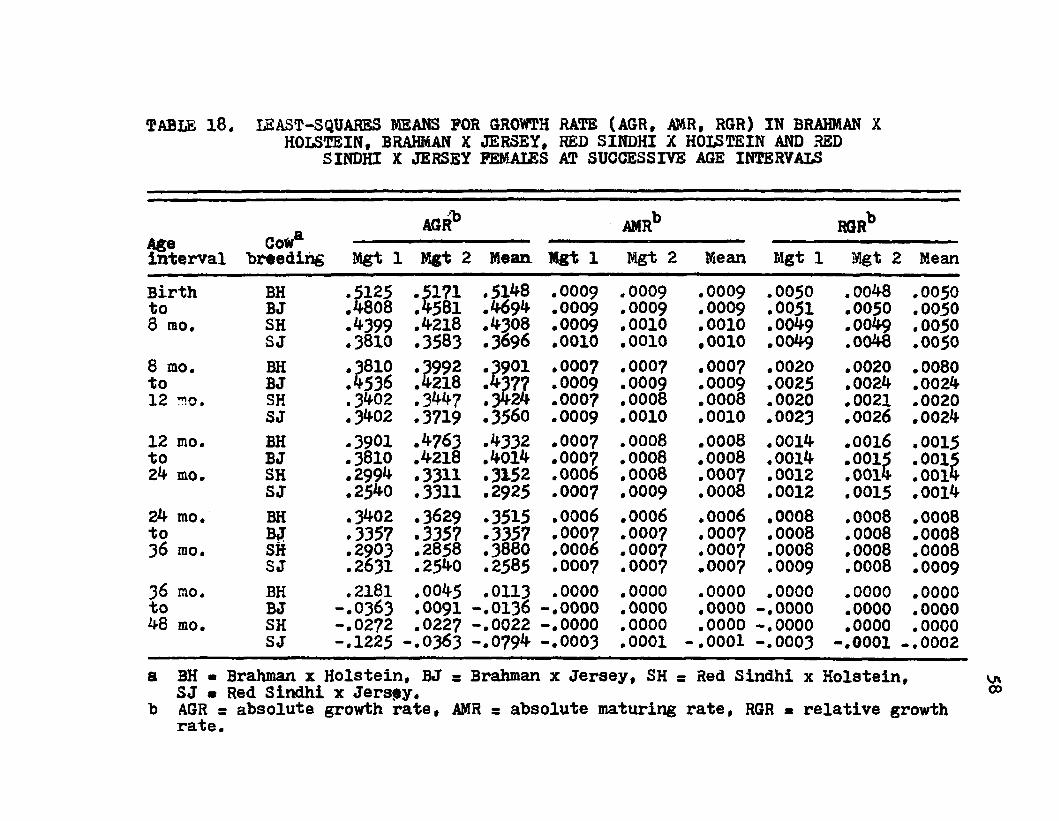
TABLE 18. LEAST-SQUARBS MEANS FOR GROWTH RATE (AGR, AMR, RGR) IN BRAHMAN X HOLSTEIN, BRAHMAN X JERSEY, RED SINDHI X HOLSTEIN AND RED
SINDHI X JERSEY FEMAIES AT SUCCESSIVE AGE INTERVALS
AgeintervalCoWabreeding
AGRb AMRb RGRbMgt 1 Mgt 2 Mean Mgt 1 Mgt 2 Mean Mgt 1 Mgt 2 Mean
Birth BH .5125 .5171 .5148 .0009 .0009 .0009 .0050 .0048 .0050to BJ .4808 .4581 .4694 .0009 .0009 .0009 .0051 .0050 .00508 mo. SH .^399 .4218 .4308 .0009 .0010 .0010 .0049 .0049 .0050SJ .3810 .3583 .3696 .0010 .0010 ,0010 .0049 .0048 .00508 mo. BH .3810 .3992 .3901 .0007 .0007 .0007 .0020 .0020 .0080to BJ .4536 .4218 .4377 .0009 .0009 .0009 .0025 .0024 .002412 "!0, SH .3402 .3447 .3424 .000? .0008 .0008 .0020 .0021 .0020
SJ .3402 .3719 .3560 .0009 .0010 .0010 .0023 .0026 .002412 mo. BH .3901 .4763 .4332 .0007 .0008 .0008 .0014 .0016 .0015to BJ .3810 .4218 .4014 .0007 .0008 .0008 .0014 .0015 .001524 mo. SH .2994 .33U .3152 .0006 .0008 .0007 .0012 .0014 .00l4SJ .2540 .3311 .2925 .0007 .0009 .0008 .0012 .0015 .001424 mo. BH .3402 .3629 .3515 .0006 .0006 .0006 .0008 .0008 .0008to BJT .3357 .3357 .3357 .0007 .0007 .0007 .0008 .0008 .000836 mo. SH .2903 .2858 .3880 .0006 .0007 .0007 .0008 .0008 .0008SJ .2631 .2540 .2585 .0007 .000? .0007 .0009 .0008 .000936 mo. BH .2181 .0045 .0113 .0000 .0000 .0000 .0000 .0000 .0000to BJ -.0363 .0091 -.0136 -.0000 .0000 .0000 -.0000 .0000 .000048 mo. SH -.0272 .0227 -.0022 -.0000 .0000 .0000 -.0000 .0000 .0000SJ -.1225 --.0363 -.0794 -.0003 .0001 - .0 0 0 1 -.0003 -.0001 -.0002a BH ■ Brahman x Holstein, BJ = Brahman x Jersey, SH = Red Sindhi x Holstein,SJ * Red Sindhi x Jersey, b AGR s absolute growth rate, AMR s absolute maturing rate, RGR * relative growth
rate.
59
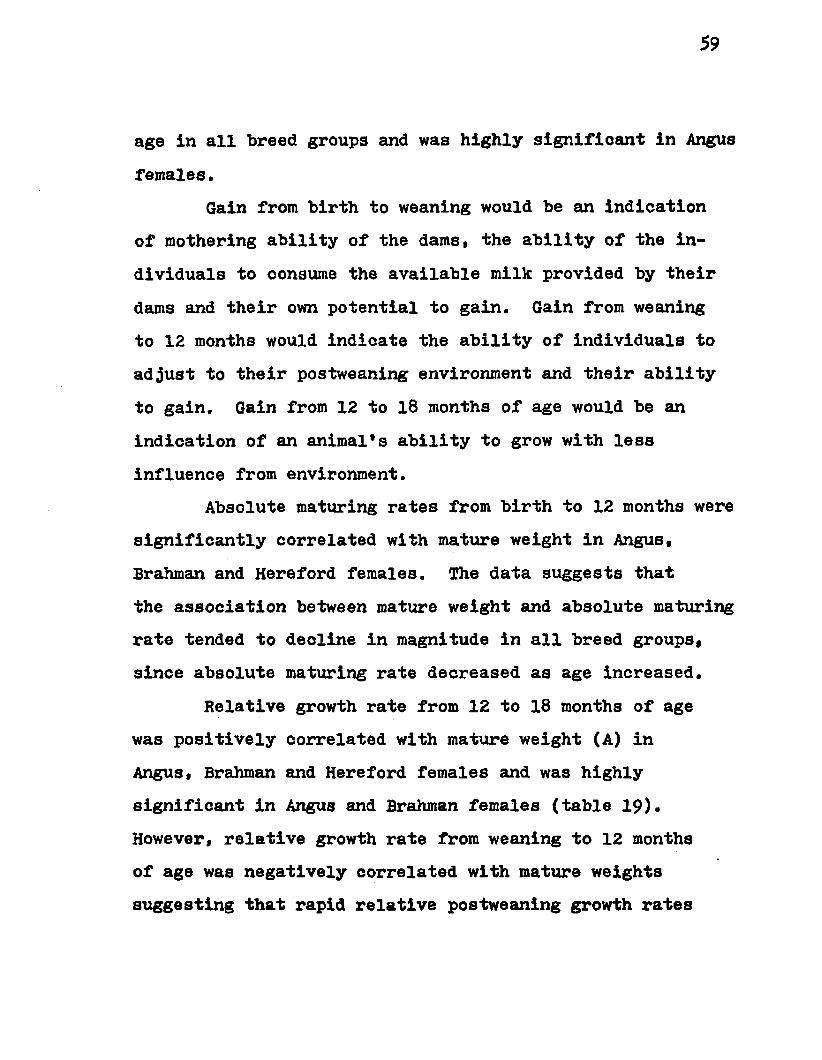
age in all breed groups and was highly significant in Angus females.
Gain from birth to weaning would be an indication of mothering ability of the dams, the ability of the individuals to consume the available milk provided by their dams and their own potential to gain. Gain from weaning to 12 months would indicate the ability of individuals to adjust to their postweaning environment and their ability to gain. Gain from 12 to 18 months of age would be an indication of an animal's ability to grow with less influence from environment.
Absolute maturing rates from birth to 12 months were significantly correlated with mature weight in Angus, Brahman and Hereford females. The data suggests that the association between mature weight and absolute maturing rate tended to decline in magnitude in all breed groups, since absolute maturing rate decreased as age increased.
Relative growth rate from 12 to 18 months of age was positively correlated with mature weight (A) in Angus, Brahman and Hereford females and was highly significant in Angus and Brahman females (table 19). However, relative growth rate from weaning to 12 months of age was negatively correlated with mature weights suggesting that rapid relative postweaning growth rates
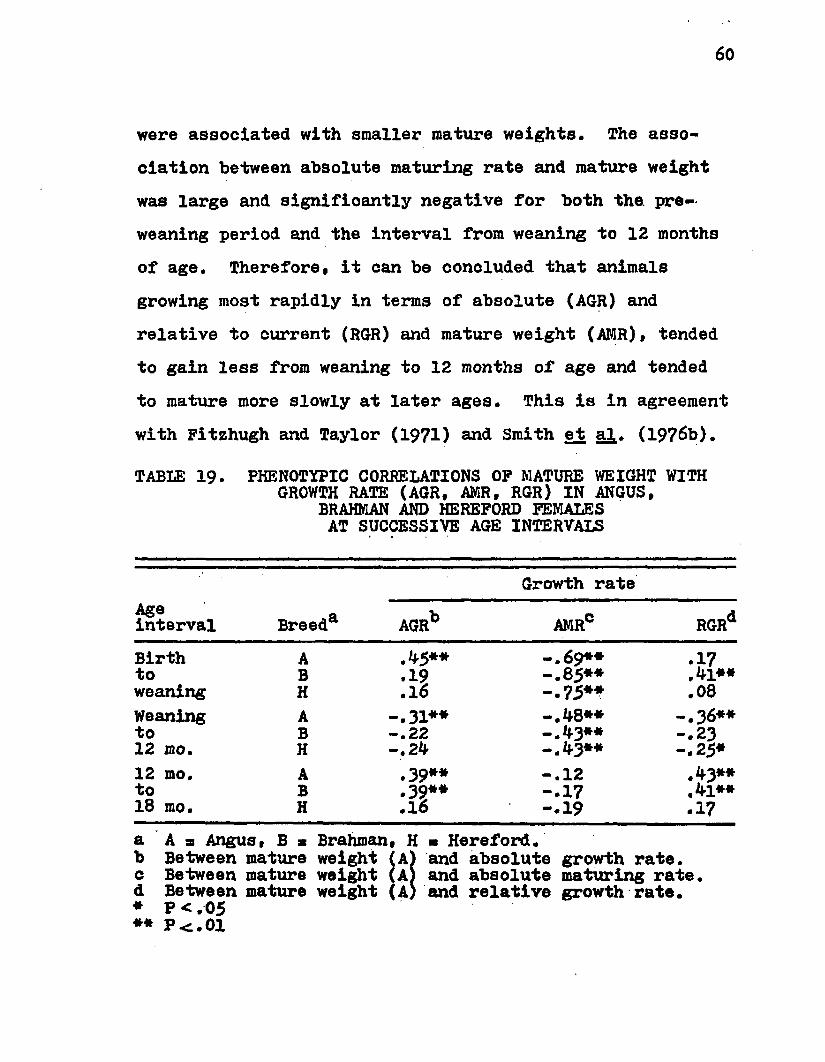
60
were associated with smaller mature weights. The association between absolute maturing rate and mature weight was large and signifioantly negative for both the preweaning period and the interval from weaning to 12 months of age. Therefore, it can be conoluded that animals growing most rapidly in terms of absolute (AGR) and relative to current (RGR) and mature weight (AMR), tended to gain less from weaning to 12 months of age and tended to mature more slowly at later ages. This is in agreement with Fitzhugh and Taylor (1971) and Smith et a^. (19?6b).TABLE 19. PHENOTYPIC CORRELATIONS OF MATURE WEIGHT WITH GROWTH RATE (AGR, AMR, RGR) IN ANGUS,
BRAHMAN AND HEREFORD FEMALES AT SUCCESSIVE AGE INTERVALS
Growth rateAgeinterval Breed8, AGRb AMRC RGRdBirth A M ** -.69** .17to B .19 -.85** .41**weaning H .16 -.75** .08Weaning A .31** -.48** -.36**to B .22 -.43** -.2312 mo. H .24 -.43** -.25*12 mo. A .39** - . 1 2 .43**to B .39** -.17 .41**18 mo. H .1 6 -.19 .17a A s Angus, B * Brahman, H • Hereford.b Between mature weight (a ) and absolute growth rate,c Between mature weight (A) and absolute maturing rate,d Between mature weight (A) and relative growth rate.* P < .05** P<.01
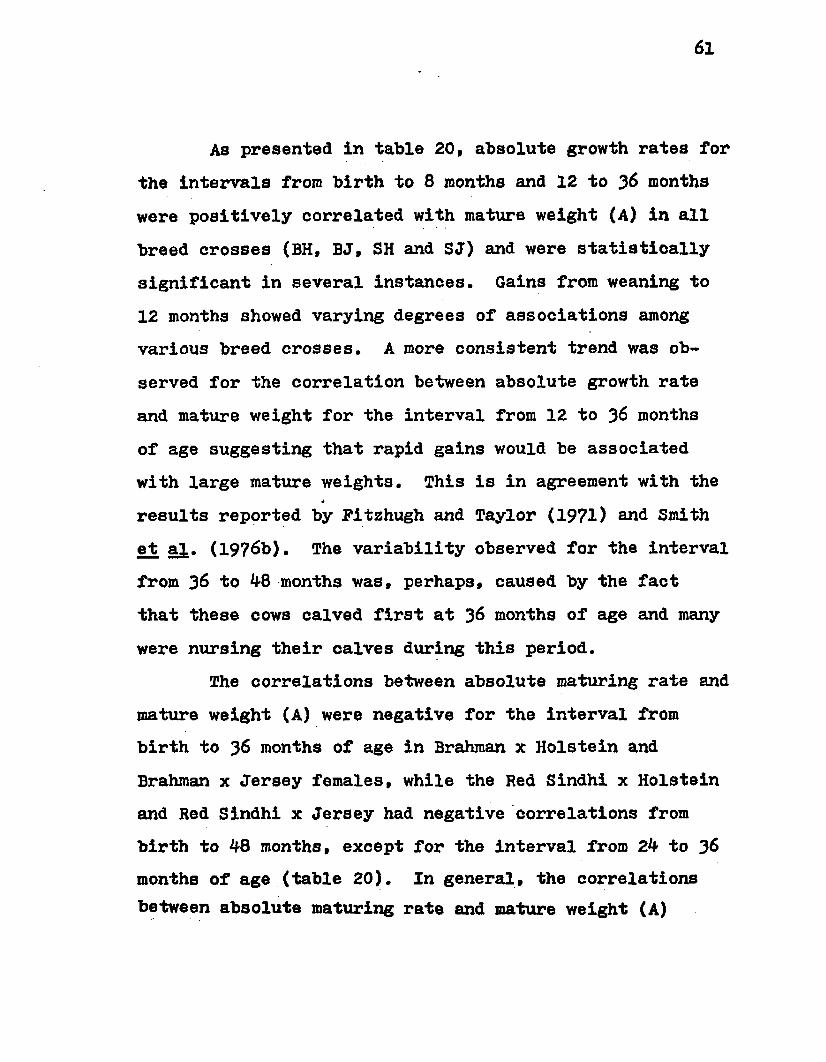
61
As presented in table 20, absolute growth rates for the intervals from birth to 8 months and 12 to J6 months were positively correlated with mature weight (A) in all breed crosses (BH, BJ, SH and SJ) and were statistically significant in several instances. Gains from weaning to 12 months showed varying degrees of associations among various breed crosses. A more consistent trend was observed for the correlation between absolute growth rate and mature weight for the interval from 12 to 36 months of age suggesting that rapid gains would be associated with large mature weights. This is in agreement with the results reported by Fitzhugh and Taylor (1971) and Smith et al. (1976b). The variability observed for the interval from 36 to ^8 months was, perhaps, caused by the fact that these cows calved first at 36 months of age and many were nursing their calves during this period.
The correlations between absolute maturing rate and mature weight (A) were negative for the interval from birth to 36 months of age in Brahman x Holstein and Brahman x Jersey females, while the Red Sindhi x Holstein and Red Sindhi x Jersey had negative correlations from birth to 48 months, except for the interval from 24 to 36 months of age (table 20). In general, the correlations between absolute maturing rate and mature weight (A)
62
TABIE 20. PHENOTYPIC CORRELATIONS OF MATURE WEIGHT WITH GROWTH RATE (AGR, AMR, RGR) IN BRAHMAN X HOLSTEIN, BRAHMAN X JERSEY. RED SINDHI X HOSLTEIN AND RED SINOHX X JERSEY ' FEMALES AT SUCCESSIVE AGE INTERVALS
Growth rateAgeinterval Cowbreeding AGRb AMR0 RGRdBirth BH .08 -.43** -.19to BJ .51** -.56** .198 mo. SH .49** -.54** -.01SJ .27 -.39 .198 mo. BH -.21 -.50** -.30*to BJ .23 -.30 -.1412 mo. SH .20 -.15 .03SJ -.11 -.46** -1912 mo. BH .41** -.33* .21to BJ .57** -.11 .2124 mo. SH .14 -.61** -.19SJ .30 -.11 .1924 mo. BH .30* -.03 .19to BJ .34 -.24 -.0236 mo. SH .61** .11 .51**SJ .37 .09 .1836 mo. BH .08 .05 .10to BJ .13 .08 .1048 mo. SH -.27 -.24 -.24
SJ -.21 -.13 -.19a BH s Brahman x Holstein, BJ = Brahman x Jersey, SH * Red Sindhi x Holstein, SJ * Red Sindhi x Jersey,b Between mature weight (A) and absolute growth rate*c Between mature weight (A) and absolute maturing rate,d Between mature weight (A) and relative growth rate.* P <-. 05** P< .01
63
tended to decrease in magnitude in Brahman x Holstein and Brahman x Jersey crosses with increasing age and appeared to have no association for the interval from 36 to 4-8 months of age. The associations for Red Sindhix Holstein and Red Sindhi x Jersey cows tended to remain negative, though the magnitude appeared’to decrease with age, A similar association of absolute maturing rate with mature weight (A) as found in the straightbreds was also observed in the crossbred females. This agrees closely with similar comparisons reported in the literature (Fitzhugh and Taylor, 19711
Smith et al., 1976b).The phenotypic correlations between relative growth
rate and mature weight did not have any significant association in Brahman x Holstein, Brahman x Jersey, Red Sindhi x Holstein or Red Sindhi x Jersey females (table 20), except for the period from 8 to 12 and 2*f to 36 months of age in Brahman x Holstein and Red Sindhi x Holstein females, respectively. No particular pattern of relationship was established indicating that there was considerable variability among the crossbred cows such that the relationship between relative growth rate and mature weight was less predictable than that observed in the straightbred females. This lack of association was, perhaps, due to the interruption of early growth by the stress of weaning (6 to
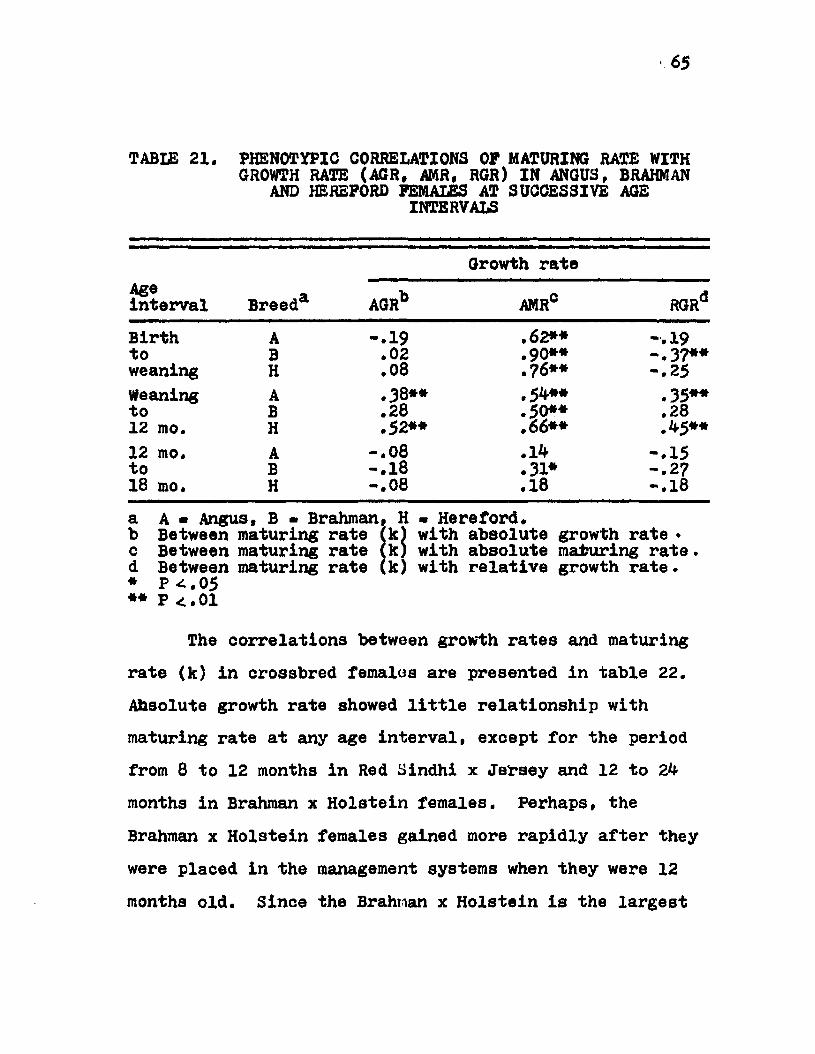
65
TABIE 21. PHENOTYPIC CORRELATIONS OP MATURING RATE WITH GROWTH RATE (AGR, AMR, RGR) IN ANGUS, BRAHMAN
AND HEREFORD FEMAIES AT SUCCESSIVE AGE INTERVALS
Growth rateAgeinterval Breeda AGRb AMR® RGRdBirth A -.19 .62** -.19to B .02 .90** -.37**weaning H .08 .76** -.25Weaning A .38** .54** .35**to B .28 .50** .2812 mo. H .52** .66** .45**12 mo. A -.08 .14 -.15to B -.18 .31* -.2718 mo. H -.08 .18 -.18a A ■ Angus, B • Brahman, H • Hereford,b Between maturing rate (k) with absolute growth rate •c Between maturing rate (k) with absolute maturing rate.d Between maturing rate (k) with relative growth rate.* P*.05** P <1.01
The correlations between growth rates and maturing rate (k) in crossbred females are presented in table 22. Absolute growth rate showed little relationship with maturing rate at any age interval, except for the period from 8 to 12 months in Red Sindhi x Jersey and 12 to 24- months in Brahman x Holstein females. Perhaps, the Brahman x Holstein females gained more rapidly after they were placed in the management systems when they were 12 months old. Since the Brahman x Holstein is the largest
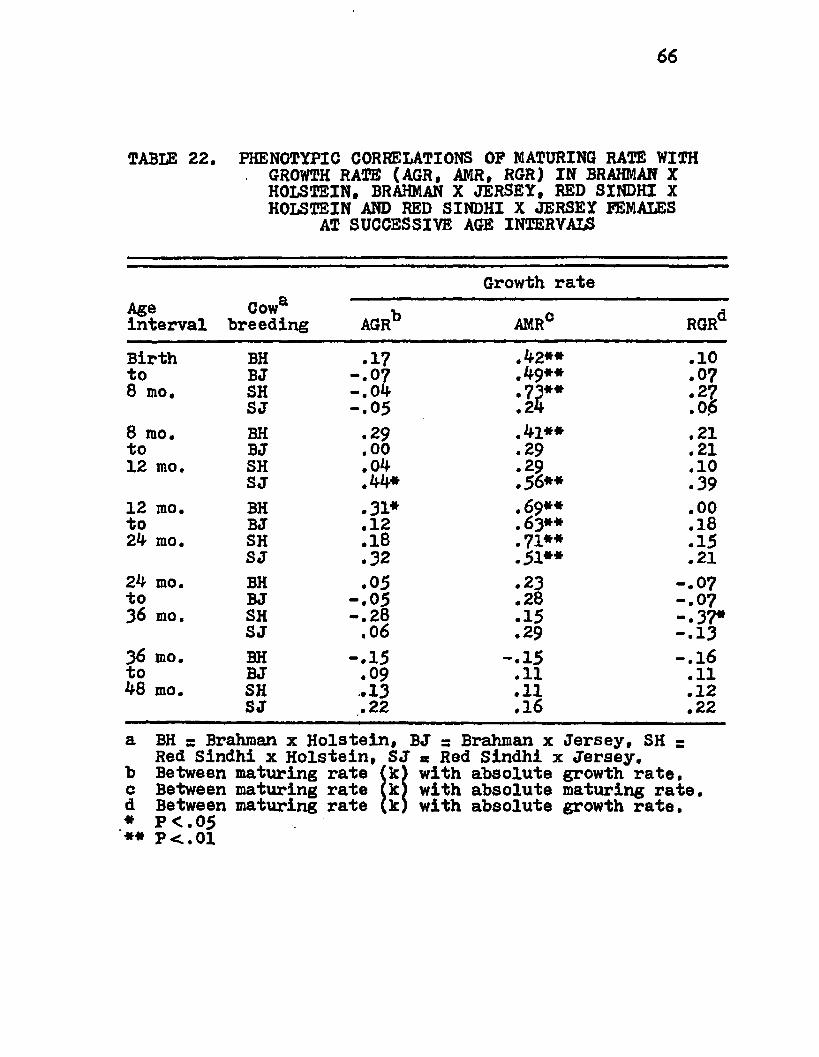
66
TABLE 22. PHENOTYPIC CORRELATIONS OP MATURING RATE WITH . GROWTH RATE (AGR, AMR, RGR) IN BRAHMAN X HOLSTEIN, BRAHMAN X JERSEY, RED SINDHI X
HOLSTEIN AND RED SINDHI X JERSEY FEMALES AT SUCCESSIVE AGE INTERVALS
Cowabreeding
Growth rateAgeinterval AGRb AMRC RGRdBirth BH .17 .42** .10to BJ -.07 .49** .0 78 mo. SHSJ -.04
-.05 : i r.27.06
8 mo. BH .29 .41** .21to BJ .00 .29 .2112 mo. SH .04 .29 .10SJ .44* .56** .3912 mo. BH .31* .69** .00to BJ .12 .63** .1824 mo. SH .1 8 .71** .15SJ .32 .51** .2124 mo. BH .05 .23 -.0?to BJ -.05 .28 -.0736 mo. SH -.28 .15 -.37*SJ .06 .29 -.1336 mo. BH -.15 -.15 - .1 6to BJ .09 .11 .1148 mo. SH .13 .11 .12SJ .22 .16 .22a BH = Brahman x Holstein, BJ = Brahman x Jersey, SH = Red Sindhi x Holstein, SJ s Red Sindhi x Jersey,b Between maturing rate (k) with absolute growth rate,c Between maturing rate (kj with absolute maturing rate,d Between maturing rate (k) with absolute growth rate.* F<.05** F<.01
67
of the four breed groups, the improved management system, enabled these females to express their true growth potential. Females in management system 2 were found to mature more rapidly than those in management system 1. This is more pronounced when absolute maturing rates are studied (table 22). The largest correlations were observed for the period from 12 to 24* months of age in all breed crosses. Relative growth rate had little or no correlation with maturing rate (k) in all breed crosses, except in Red Sindhi x Holstein females at the 24- to 36 months interval.
The lack of a significant association between maturing rate (k) with absolute and relative growth rate cannot be easily explained. Perhaps, the stress of early weaning (6 to 7 days of age) and lowered nutritional intake prior to 12 months of age might have some bearing on this lack of relationship. Fitzhugh and Taylor (1971) and Smith et ai. (19?6b) reported similar findings.Phenotypic Correlations of Cow Growth Parameters with Calf Growth Parameters and Traits
Correlations between cow mature weight (A) and calf mature weight (Al) were positive in all breed groups and was statistically significant in Hereford cattle (table 23). Correlations between cow mature weight (A) and calf maturing rate (hi) and weights from birth to IB months of
68
age were not statistically significant except in Angus for weight at weaning. This is in agreement with the results reported by Brown et a^. (19?0) in which the correlation between cow mature weight (A) and calf 240-day weight was small and negative (-.07).
Correlations between cow maturing rate (k) and calf growth parameters [[mature weight (Al) and maturing rate (kl) ] were not significant. Similarly, cow maturing rate (k) had no significant association with calf weight from birth to 18 months. Similar observations were made by Brown et aj,. (19?0) in that calf 2^0-day weight was negatively correlated with cow maturing rate (k) (r = -.07) and only when calf 2^0-day weight was expressed as a percentage of the dam's 5-year weight did a significant (r * .28**) correlation exist. Thus it can be concluded that cow mature weight (A) and maturing rate (k) have little or no relationship to calf performance. However, because of the small sample sizes that were used in this phase of the study (Angus s 32 pairs, Brahman « 13 pairs and Hereford = 37 pairs) these results would have limited application. Also some of these pairs were duplicated in the sense that an individual could be a calf in certain year and this same individual could be a cow in other years.
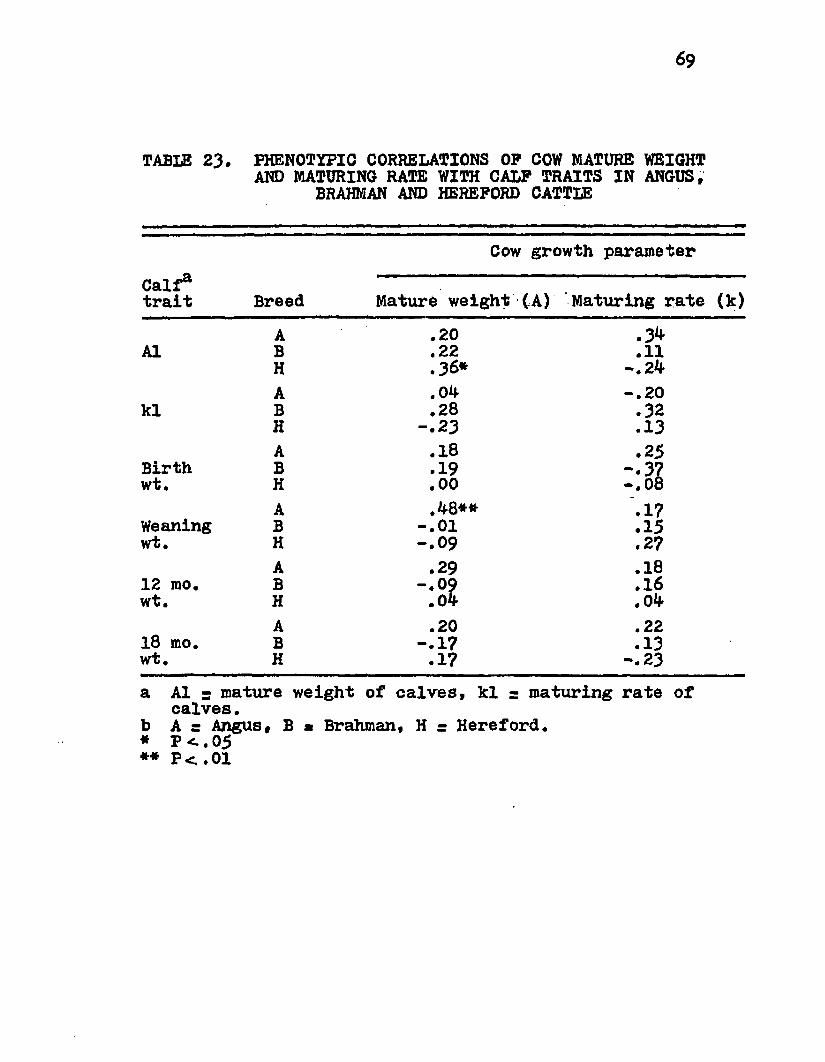
69
TABLE 23. PHENOTYPIC CORRELATIONS OP COW MATURE WEIGHT AND MATURING RATE WITH CALF TRAITS IN ANGUS, BRAHMAN AND HEREFORD CATTLE
Cow growth parameterCalfatrait Breed Mature weight (A) Maturing rate (k)
A .20 .3**A1 B .22 .11H .36* -.24A .04 -.20
kl B .28 .32H -.23 .13A .1 8 .25Birth B .19 -•37wt. H .00 -.08A .48** ".17Weaning B -.01 .15wt. H -.09 .2?A .29 .1812 mo. B -.09 .16
wt. H .04 .04A .20 .2218 mo. B -.1? .13wt. H .17 -.23
a A1 s mature weight of calves, kl s maturing rate of calves.b A s Angus, B a Brahman, H = Hereford.* P <. 05** P<.01
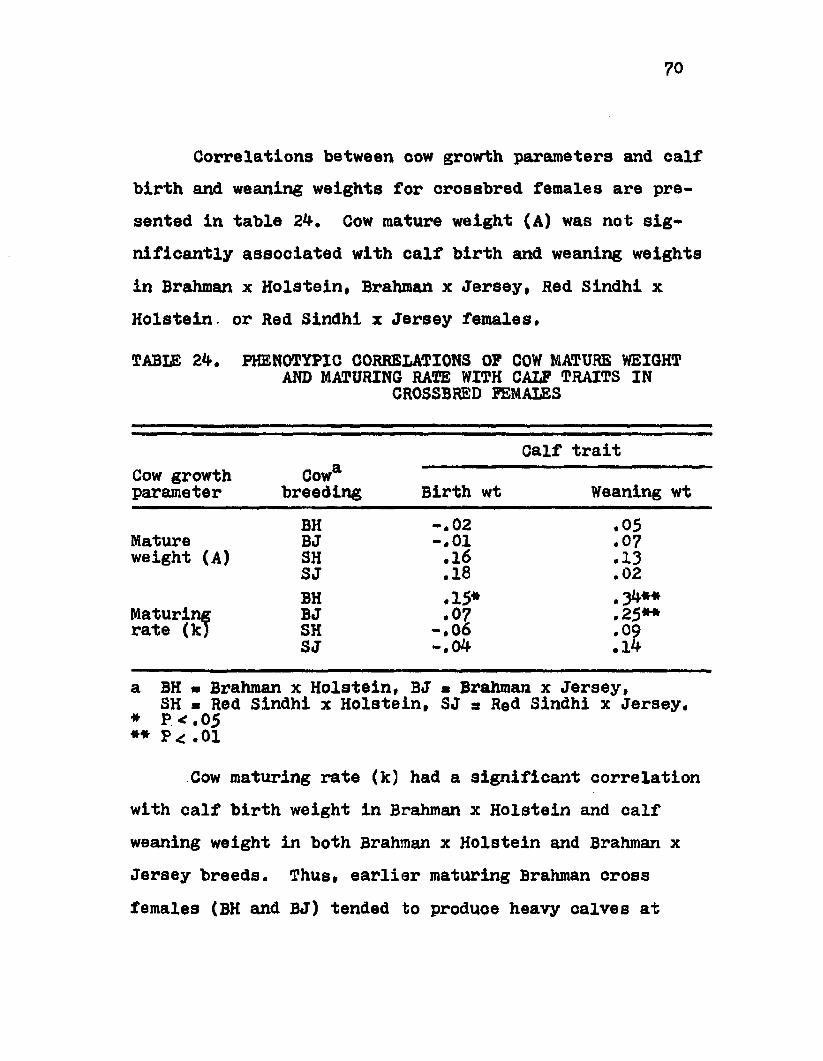
70
Correlations between cow growth parameters and calf birth and weaning weights for crossbred females are presented in table 2k, Cow mature weight (A) was not significantly associated with calf birth and weaning weights in Brahman x Holstein, Brahman x Jersey, Red Sindhi x Holstein or Red Sindhi x Jersey females.TABLE 2k, PHENOTYPIC CORRELATIONS OP COW MATURE WEIGHTAND MATURING RATE WITH CALF TRAITS IN CROSSBRED FEMALES
Calf traitCow growth Cowaparameter breeding Birth wt Weaning wt
BH -.02 .05Mature BJ -.01 .07weight (A) SH .16 .13SJ .18 .02BH .15* ,3k**Maturing rate (k) BJ .07 .25#*SH - .0 6 .09SJ ~,0k ,1k
a BH • Brahman x Holstein, BJ » Brahman x Jersey,SH ■ Red Sindhi x Holstein, SJ s Red Sindhi x Jersey. * P * . 05 ** Pc .01
Cow maturing rate (k) had a significant correlation with calf birth weight in Brahman x Holstein and calf weaning weight in both Brahman x Holstein and Brahman x Jersey breeds. Thus, earlier maturing Brahman cross females (BH and BJ) tended to produce heavy calves at
71
weaning. The exact cause is not knowni however, it was observed that cows in management system 2 were earlier maturing than those in management system 1. Perhaps, the highly significant correlations between cow maturing rate and calf weaning weight were partially a function of management system differences, since cow maturing rate was partially confounded with management system.
SUMMARY
A total of 169 atraightbred Angus, Brahman and Hereford cows was raised at Ben Hur farm near Baton Rouge, while 122 crossbred Brahman x Holstein, Brahman x Jersey,Red Sindhi x Holstein and Red Sindhi x Jersey cows were purchased as young calves from farmers near Franklinton, Louisiana. Prior to the initial breeding season in the fall of 1971, the crossbred females were randomly assigned within breed type to one of two pasture management herds (native pastures = management system 1 and ryegrass pastures s management system 2). Once the females were assigned, they remained in the management system as long as they were physically sound, were capable of producing calves and could support their calves to weaning age. The sire breeds of straightbreds were the same as the cow breeds. In the crossbreds, Angus bulls were used for the first two calf crops and Charolais bulls were used for the following four calf crops, A 6-month breeding season (December to June 15) was used for the crossbred cows while a 75 day breeding season (April 15 to July 1) was employed for the straightbred cows.
The objectives were* (1) to estimate growth parameters (mature weight, A, and maturing rate, k) for the
72
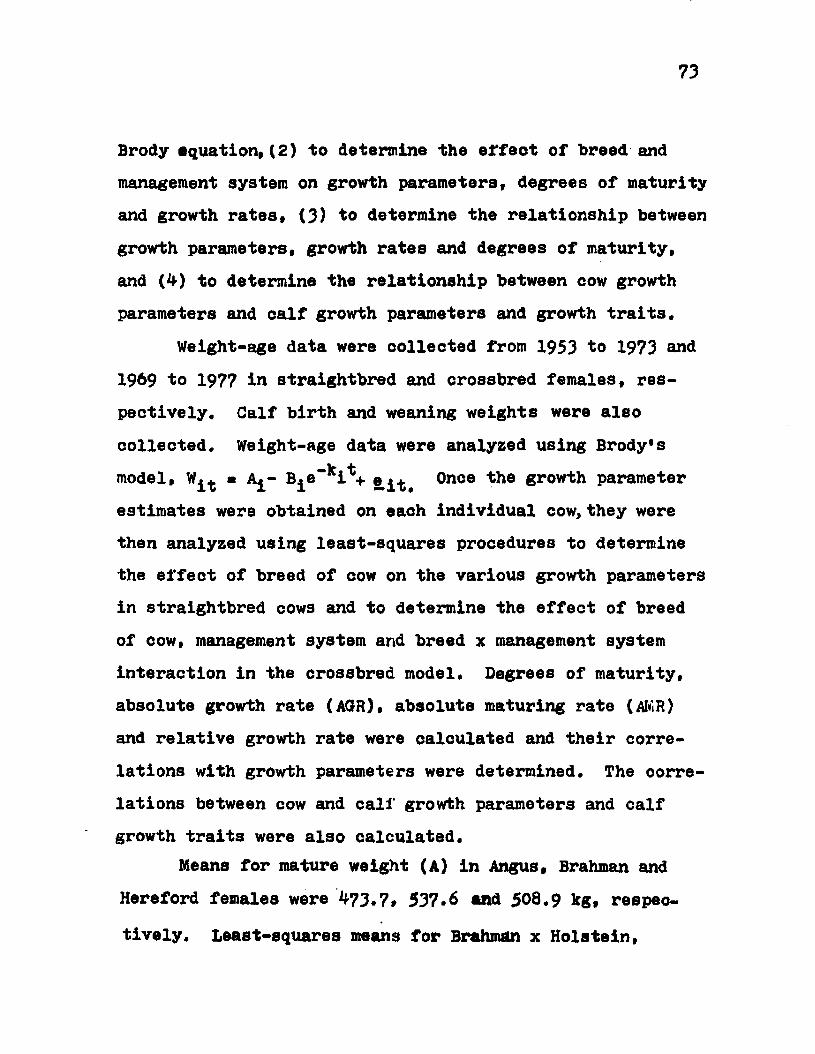
73
Brody aquation, (2) to determine the effect of breed and management system on growth parameters, degrees of maturity and growth rates, (3) to determine the relationship between growth parameters, growth rates and degrees of maturity, and (4) to determine the relationship between cow growth parameters and calf growth parameters and growth traits.
Weight-age data were collected from 1953 to 1973 and 1969 to 1977 in straightbred and crossbred females, respectively. Calf birth and weaning weights were alsocollected. Weight-age data were analyzed using Brody's
—1c tmodel, W ^ * A^- B^e i + Once the growth parameterestimates were obtained on each individual cow, they were then analyzed using least-squares procedures to determine the effect of breed of cow on the various growth parameters in straightbred cows and to determine the effect of breed of cow, management system and breed x management system interaction in the crossbred model. Degrees of maturity, absolute growth rate (AGR), absolute maturing rate (AMR) and relative growth rate were calculated and their correlations with growth parameters were determined. The correlations between cow and call' growth parameters and calf growth traits were also calculated.
Means for mature weight (A) in Angus, Brahman andHereford females were 1*73.7* 537.6 and 508.9 kg, respectively. Least-squares means for Brahman x Holstein,
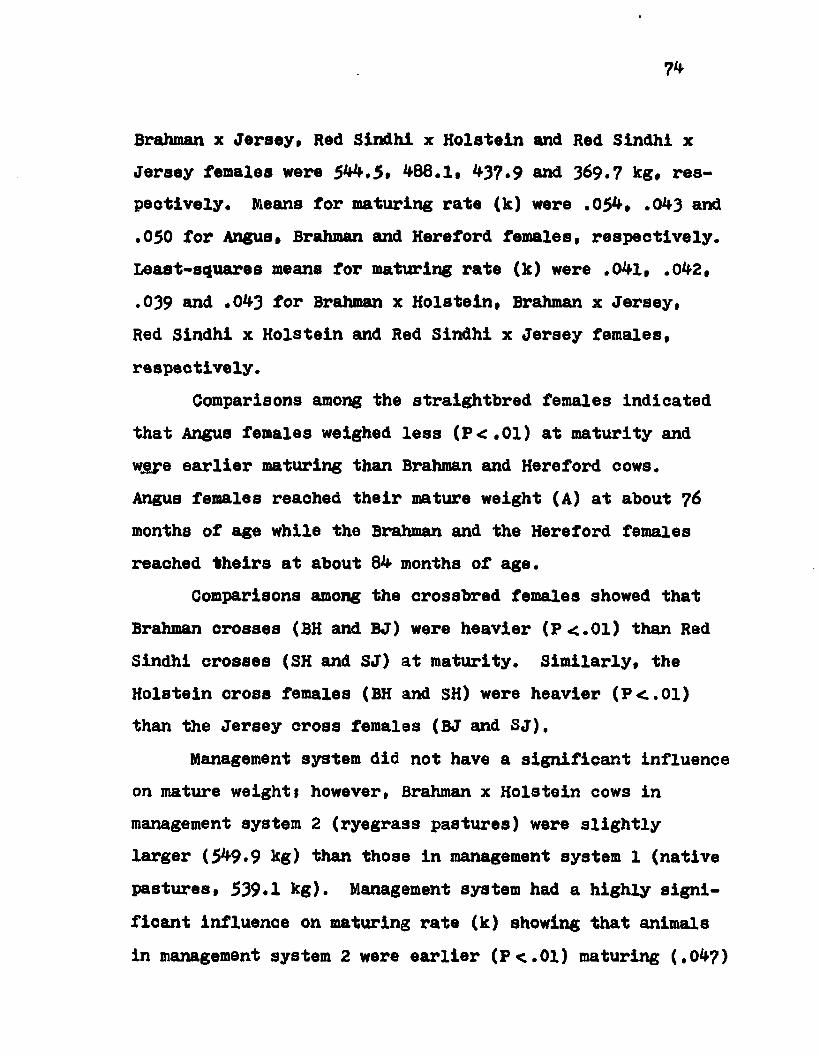
7 *
Brahman x Jersey* Red Sindhi x Holstein and Red Sindhi x Jersey females were 5^*5* 4*88.1* 4-37.9 and 389.7 kg* respectively. Means for maturing rate (k) were .054-, .04-3 and .050 for Angus* Brahman and Hereford females* respectively. Least-squares means for maturing rate (k) were .04-1, .04-2, .039 and .04-3 for Brahman x Holstein* Brahman x Jersey*Red Sindhi x Holstein and Red Sindhi x Jersey females* respectively.
Comparisons among the straightbred females indicated that Angus females weighed less (P<.01) at maturity and were earlier maturing than Brahman and Hereford cows.Angus females reaohed their mature weight (A) at about 76
months of age while the Brahman and the Hereford females reached theirs at about 84- months of age.
Comparisons among the crossbred females showed that Brahman crosses (BH and BJ) were heavier (P<.01) than Red Sindhi crosses (SH and SJ) at maturity. Similarly* the Holstein cross females (BH and SH) were heavier (P<.01) than the Jersey cross females (BJ and SJ).
Management system did not have a significant influence on mature weightt however* Brahman x Holstein cows in management system 2 (ryegrass pastures) were slightly larger (54*9*9 kg) than those in management system 1 (native pastures, 539*1 kg). Management system had a highly significant influence on maturing rate (k) showing that animals in management system 2 were earlier (P<.01) maturing (.0^7)
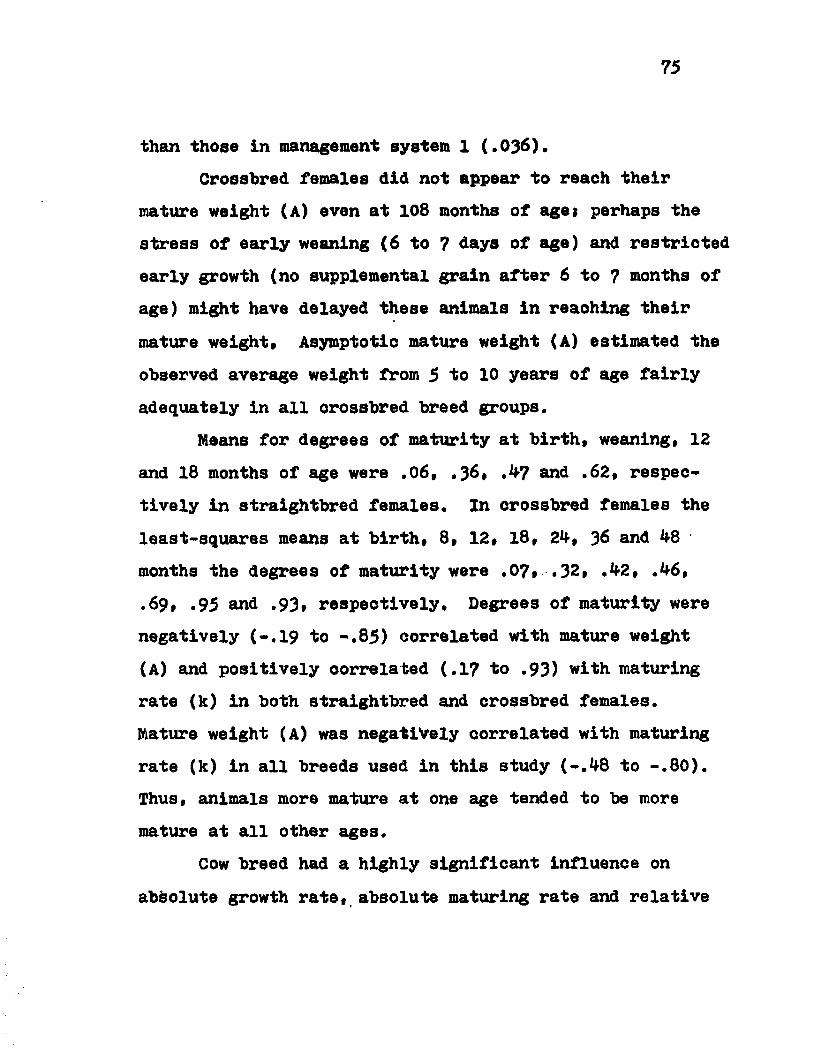
75
than those in management system 1 (.036).Crossbred females did not appear to reach their
mature weight (A) even at 108 months of aget perhaps the stress of early weaning (6 to 7 days of age) and restricted early growth (no supplemental grain after 6 to 7 months of age) might have delayed these animals in reaching their mature weight, Asymptotic mature weight (A) estimated the observed average weight from 5 to 10 years of age fairly adequately in all crossbred breed groups.
Means for degrees of maturity at birth, weaning* 12 and 18 months of age were .06, .36, .47 and .62, respectively in straightbred females. In crossbred females the least-squares means at birth, 8, 12, 1 8, 24, 36 and 48 months the degrees of maturity were .07* .32, .42, .46,.69, .95 and .9 3, respectively. Degrees of maturity were negatively ( - . 1 9 to -.85) correlated with mature weight (A) and positively correlated (.17 to ,9 3) with maturing rate (k) in both straightbred and crossbred females.Mature weight (A) was negatively correlated with maturing rate (k) in all breeds used in this study (-.48 to -.80). Thus, animals more mature at one age tended to be more mature at all other ages.
Cow breed had a highly significant influence on absolute growth rate, absolute maturing rate and relative
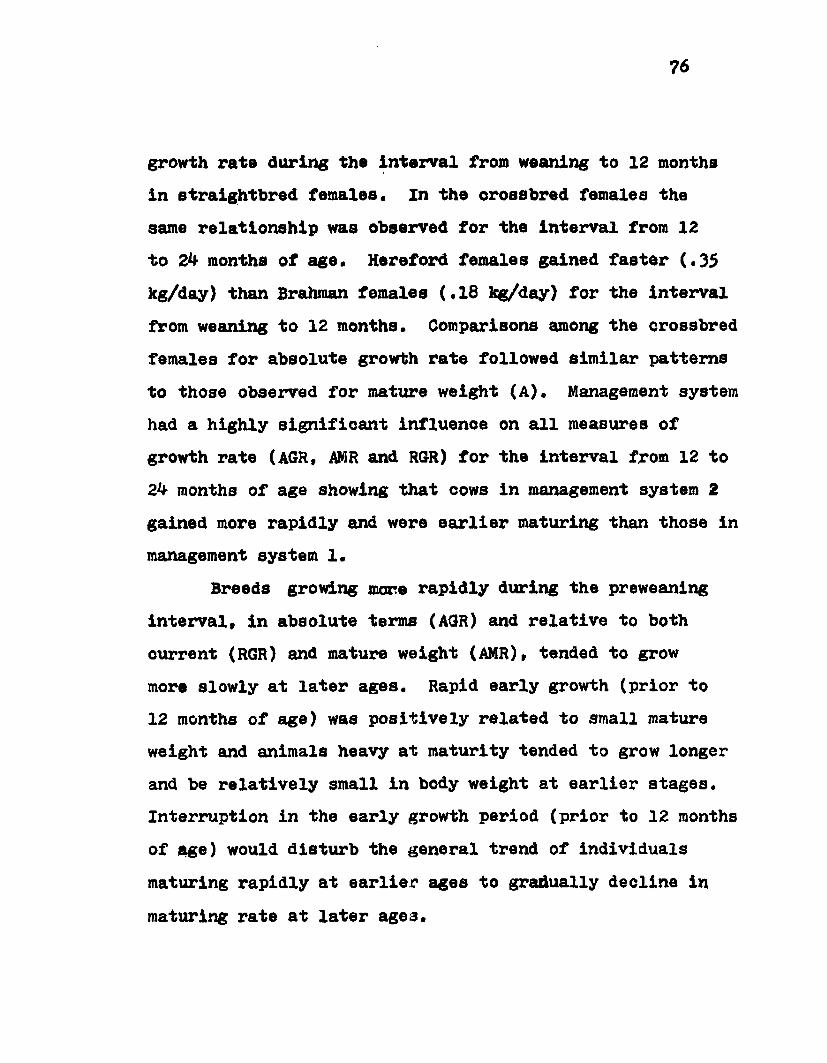
76
growth rate during the interval from weaning to 12 months in straightbred females. In the crossbred females the same relationship was observed for the interval from 12 to 2k months of age. Hereford females gained faster (.35 kg/day) than Brahman females (.18 kg/day) for the interval from weaning to 12 months. Comparisons among the crossbred females for absolute growth rate followed similar patterns to those observed for mature weight (A). Management system had a highly significant influence on all measures of growth rate (AGR, AMR and RGR) for the interval from 12 to 2k months of age showing that cows in management system 2 gained more rapidly and were earlier maturing than those in management system 1.
Breeds growing mare rapidly during the preweaning interval, in absolute terms (AGR) and relative to both current (RGR) and mature weight (AMR), tended to grow more slowly at later ages. Rapid early growth (prior to 12 months of age) was positively related to small mature weight and animals heavy at maturity tended to grow longer and be relatively small in body weight at earlier stages. Interruption in the early growth period (prior to 12 months of Age) would disturb the general trend of individuals maturing rapidly at earlier ages to gradually decline in maturing rate at later age3.
77
Correlations between oow and oalf mature weights and maturing rates in the straightbred females were generally small and nonsignificant» exoept for the correlation between oow and oalf mature weight in the Herefords (r * .36*). Cow mature weight (A) was not signifioantly correlated with oalf weights from birth to 8 months (weaning) in straightbred or orossbred females, exoept in Angus for weight at weaning (r ■ .4-8**). However* cow maturing rate (k) was signifioantly associated with calf birth and weaning weight in Brahman x Holstein (r * .15*»• 34*** respectively) and oalf weaning weight in Brahman x Jersey females (r * .25**).
LITERATURE CITED
Barr, J. Anthony, James H. Goodnight, John P, Sail and Jane T. Helwig. 1976, A User's Guide to SAS ?6, North Carolina State Univ. Raleigh, North Carolina,Brinks, J. S., R. T. Clark, N. M. Kieffer and J. R. Quesenberry. 1962. Mature weight in Hereford range cow heritability, repeatability and relationship to calf performance, J. Anim. Sci.21*501.Brody, S. 1945. Bioenergetics and Growth. Rheinhold
Pub. Corp., New York.Brown, J. E .• C. J. Brown and W. T. Butts. 1972a.A discussion of the genetic aspects of weights, mature weight and rate of maturing in Hereford and Angus cattle. J. Anim. Sci. 34*525.Brown, J. E., C. J. Brown and W. T. Butts. 1972b.Relationships among weights, gains and earliness of maturing in Hereford and Angus females,
J. Anim. Sci. 35*507.Brown, J. E., H. A. Fitzhugh, Jr. and T. C. Cartwright. 1976. A comparison of nonlinear models for describing weight-age relationships in cattle.J. Anim. Sci. 42*810.Brown, J. E., H. A. Fitzhugh, Jr., T. C. Cartwright,S. E. Carpenter and E. K* Crouch. 1971* Algebraic models for describing growth of cows. Tex. Agr,
Exp. Sta. PR-2979.Brown, C. J.,. Stanley Wingert and Zelpha Johnson. 1970. Development patterns of Angus cows. Ark. Farm Res.
19*11.Fitzhugh, H. A. Jr. 1972. Selection to change the shape of growth curves of beef cattle. Tex. Agr. Exp.
Sta. PR-3121.Fitzhugh, H. A. Jr. 1976. Analysis of growth curves and strategies for altering their shape. J. Anim. Sci.
42*1036.78
79
Fitzhugh* H. A. Jr., T. C..Cartwright and R. S. Temple. 1967* Genetic and environmental factors affecting weight of beef cows. J. Anim. Sci. 26:991*Fitzhugh, H. A. Jr. and St. C. S. Taylor. 1971. Genetic analysis of degree of maturity. J. Anim. Sci.
33*717.Harvey, Walter R. i960, Least-squares analysis of data
with unequal subclass numbers. U.S.D.A.* A.R.S. Bull. 20-8.Humes, Paul E. 1976. Effect of nutritional management systems on reproductive performance of dairy cross cows. Louisiana State Univ. Livestock Producers* Day Rep. 16til.Joandet, G, E. and T, C. Cartwright. 1969. Estimation of efficiency of beef production, J. Anim. Sci.
281862.Long, C. R., H. A. Fitzhugh, Jr., and T. C. Cartwright. 1971. Factors affecting efficiency of beef production. J. Anim. Sci. 32*381*• (Abstr.).Rakes, J. M ., J. E. Brown and S. G. Bryan. 1971.Relationship between development and production of dairy cattle. Ark. Farm Res. 20:1*.Smith,/Gerald M., H. A. Fitzhugh, Jr., Larry V. Cundiff, T. C. Cartwright and Keith E. Gregory. 1976a. Heterosis for maturing patterns in Hereford, Angus and Shorthorn cattle. J. Anim. Sci. 1*3:380.Smith, Gerald M., H. A. Fitzhugh, Jr., Larry V. Cundiff, and Keith E. Gregory. 197ob. A genetic analysis of maturing patterns in straightbred and crossbred Hereford, Angus and Shorthorn cattle. J. Anim.
Sci. 43:389.Stewart, T. S., D. E. Franks, w. C. Bums and K. Koger,
1975. Phenotypic and genetic trends for growth in Angus cattle. J. Anim. Sci. 1*0:173. (Abstr,).Taylor, St. C. S. and H. A. Fitzhugh, Jr. 1971. Genetic relationship between mature weight and time taken
to mature within a breed, J. Anim. Sci, 33*726.
80
Wong, Y. K., D. E. Franke, W. G. Burns and M. Koger. 1975. Genetic aspects of growth curves of beef females. J. Anim. Sci. 40*1?4. (Abstr.).

APPENDIX
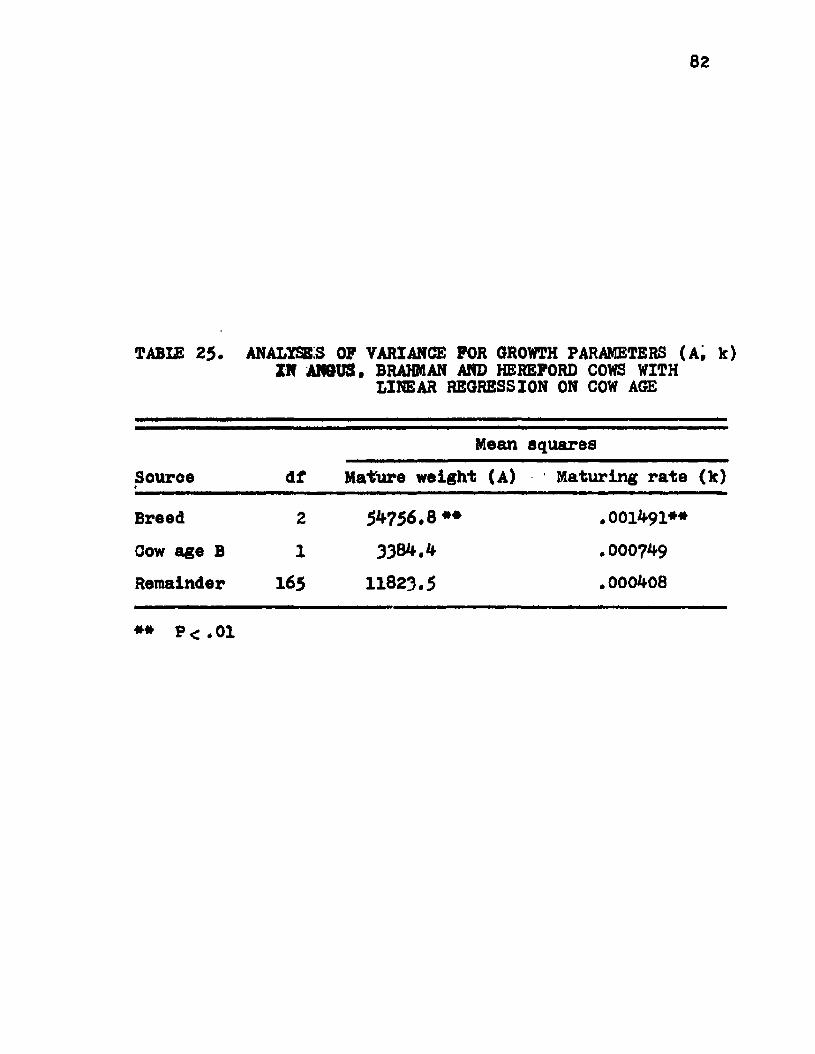
82
TABIE 25. ANALYSIS OF VARIANCE FOR GROWTH PARAMETERS (A, k) ZN ANGUS, BRAHMAN AND HEREFORD COWS WITH LINEAR REGRESSION ON COW AGE
Mean squaresSource«
df Mature weight (a ) Maturing rate (k)Breed 2 54756.8** .001491**Cow age B I 3384,4 .000749Remainder 165 11823.5 .000408
** P<.01
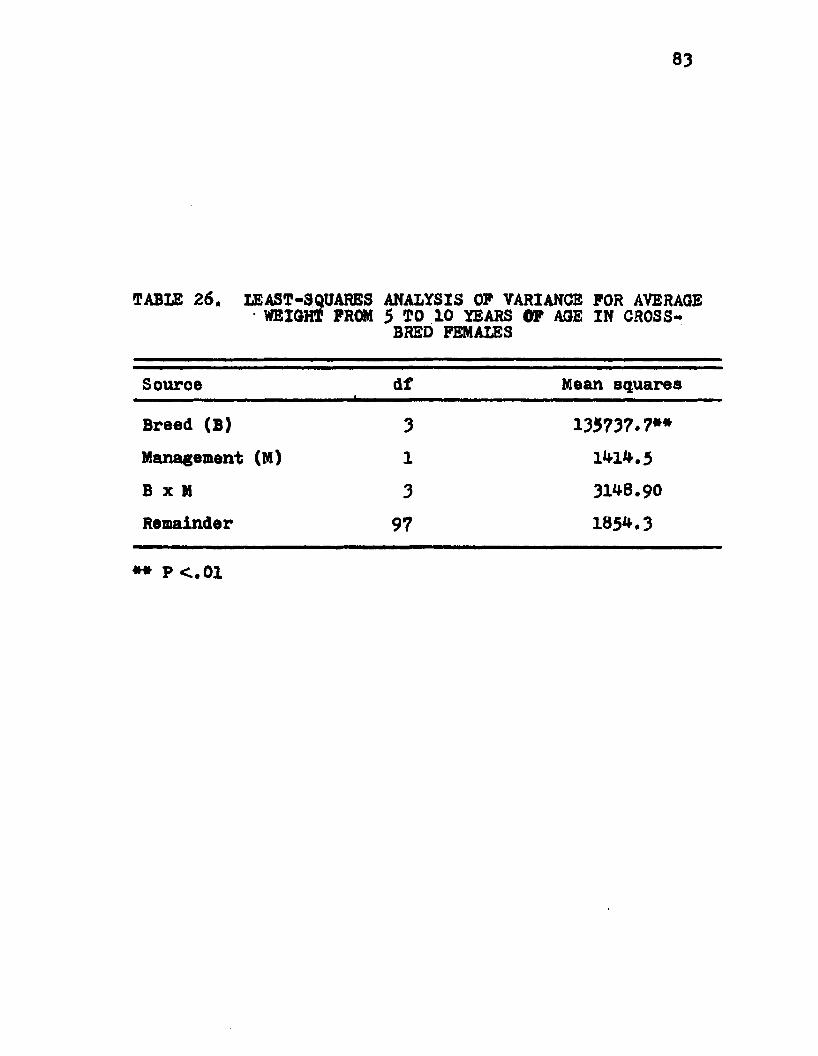
83
TABLE 26. LEAST-SQUARES ANALYSIS OP VARIANCE POR AVERAGE WEIGHT PROM 5 TO 10 YEARS OP AGE IN CROSSBRED FEMALES
Source df4
Mean squares
Breed (B) 3 135737.7**Management (M) 1 1414.5B x M 3 31^8.90Remainder 97 1854.3
** P <.01
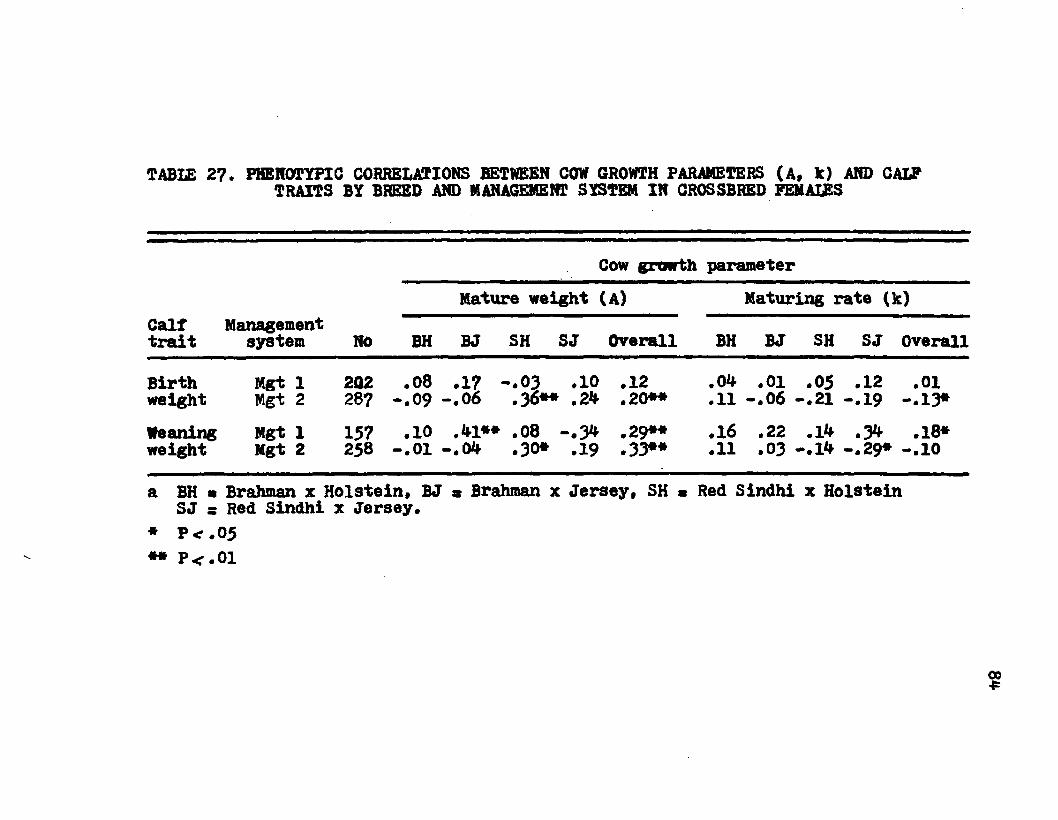
TABLE 27. PHENOTYPIC CORRELATIONS BETWEEN COW GROWTH PARAMETERS (A, k) AND CALF TRAITS BY BREED AND MANAGEMENT SYSTEM IN CROSSBRED FEMAIES
Cow growth parameterMature weight (A) Maturing rate (k)
CalftraitManagement
system NO BH BJ SH SJ Overall BH BJ SH SJ Overall
BirthweightMgt 1Mgt 2
202287
.08 .17 - .0 3 .10 .12 - .0 9 - .0 6 .36** ,24 .20** .04 .01 .05 .12 .01
.11 - .0 6 - .2 1 - .1 9 -.13*Weaningweight
Mgt 1 Mgt 2 157
258.1 0 .41** .08 -.34 .29**
- .0 1 - .0 4 .30* .19 .33**.16 .22 .14 .34 .18* .11 .03 -.14 -.29* -.10
a BH « Brahman x Holstein, BJ « Brahman x Jersey, SH « Red Sindhi x Holstein SJ s Red Sindhi x Jersey.* P<r.05** P<.01
g o
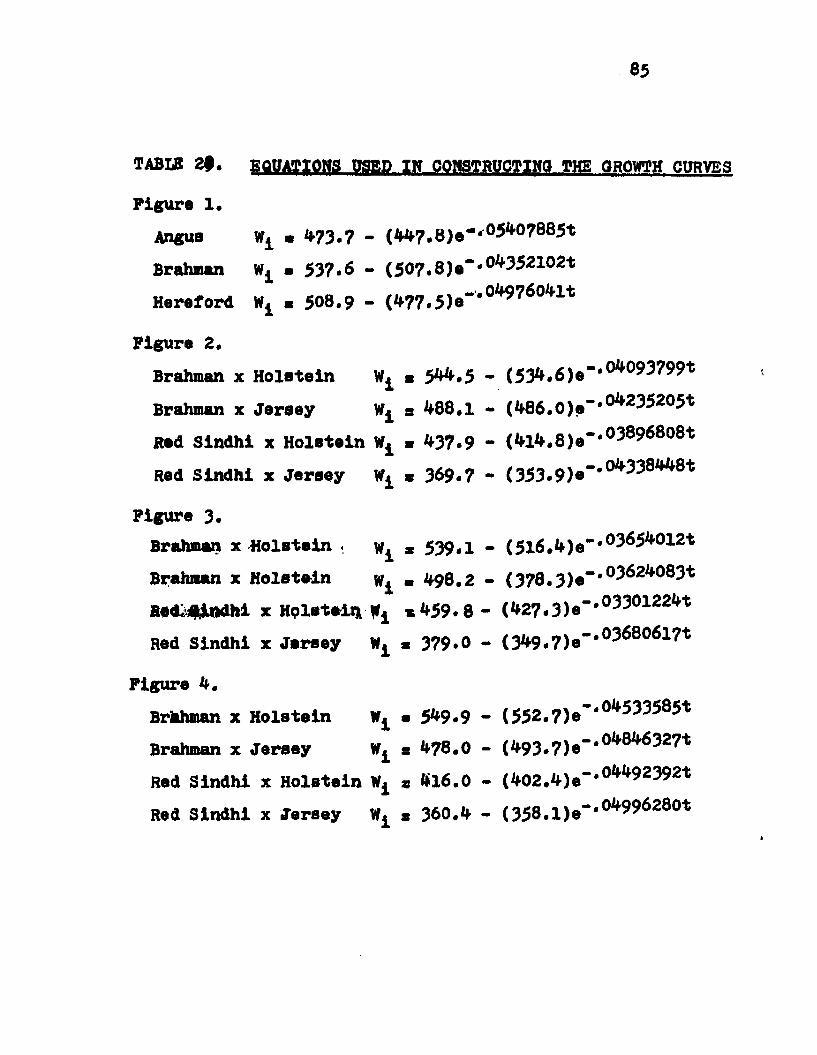
TABUS 2#. EQUATIONS USED IW CONSTRUCTING THE GROWTH CURVESFigure 1.
Angus ■ **73.7 - (447.8)e*,05iW)7885tBrahman Wt . 537.6 - (507 .8 )e“ *°^ 5 2 1 0 2 t
Hereford Wt > 508.9 - (W.S)®"*0^9760^Figure 2.Brahman x Holstein Brahman x Jersey Red Sindhi x Holstein Red Sindhi x Jersey
Figure 3.Brahman x Holstein . Brahman x Holstein Redgindhi x Hplsteiiv W* Red Sindhi x Jersey
Figure 4.Brhhman x Holstein Brahman x Jersey Red Sindhi x Holstein Red Sindhi x Jersey
« 544.5 - (534.6)e"*°i|'093799t s 488.1 - (486.0)e"'0if235205t « 437.9 - (4l4.8)e**03896808t* 369.7 - (353.9)e“,0if338if/f8t
* 539.1 - (5l6.4)e’#0365/f012t . 498.2 - (378.3)e"'°362/<'083t *459.8 - (427.3)e",0330122ift* 379.0 - (349.7)e”,036806l7t
• 549.9 - (552.7)e~*°4533585t s 478.0 - (493.7)e“#0*f8i,'6327t s 416.0 - (402.4)e“,0 92392'fc s 360.4 - (358.1)e“*0/f" 6280t
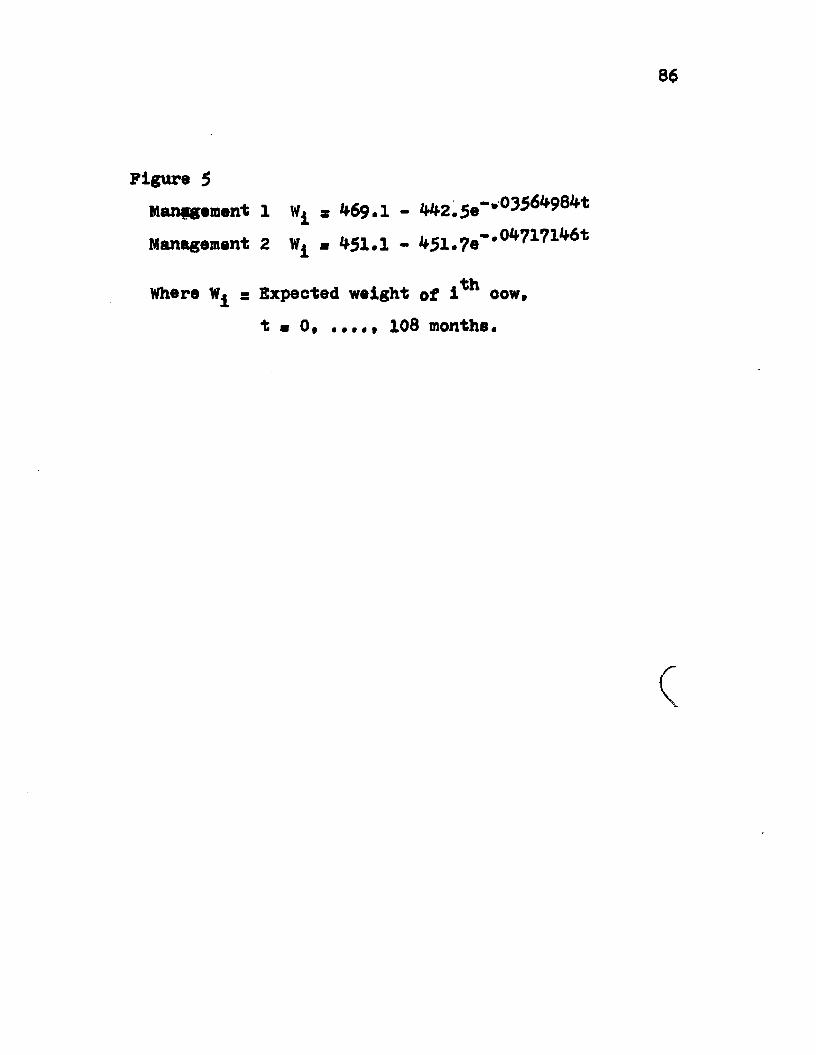
Figure 5Management 1 * *169.1 - ^ . S e " * 0356^98^Management 2 ■ 4-51.1 - ^51.
Where s Expected weight of i*h oow, t ■ 0, 108 months.

Vita
Saidi Bln Moin was b o m in Lumut, Perak, Malaysia, on April 5, 1946, the son of Moin Hj. Abdul Kadir and Banun Hj, Abd. Rashid. He is married and has two sons.He received the Diploma of Agriculture from the College of Agriculture, Serdang, Malaysia, in February, 1971* with a major in General Agriculture. He served the Federal Land Development Authority as Assistant Manager before enrolling in Louisiana State Uhiversity, Baton Rouge, in August, 1971* In May, 1973* he reoelved a Bachelor of Science degree in Agriculture,
He reoelved the Master of Science in December 1975 with a major in Animal Soienoe followed by a Master in Applied Statistics in May, 1977* from Louisiana State University.
87
EXAMINATION AND THESIS REPORT
Candidate:
Major Field:
Title of Thesis:
Saidi Bin Main
Animal Science
Estimation of Growth Parameters in Beef Cows and Their Relationship to Progeny Growth Traits.
Approved:
M ajor Professor and Chairman
ax,v Dean of the G rn u ate School
EXAMINING COMMITTEE:
3.
KLjliT*fWtvte_V_
Date of Examination:
April 27, 1978