Embed Size (px)
Citation preview
University Bulletin – ISSUE No.21- Vol. (5) – August- 2019. 75
Estimation of Natural Gas Compressibility Factors Using Mathematical Correlations For Sirte Oil Fields
Ibrahim M. Abou El Lei11*,Khaled M.Mezughi2, Mawaheb M. Zarok Derdar3
1. Dept. of Petroleum Engineering, Faculty of Engineering, Tobruk University 2. Dept. of Chemical Engineering, Faculty of Petroleum and Gas, ZawiaUniversity
3. Dept. of Chemical Engineering, Faculty of Engineering, Tripoli University
Abstract:
Knowledge of the pressure-volume-temperature (PVT) behavior of
natural gases is necessary to solve many petroleum engineering
problems. Gas reserves, gas metering, gas pressure gradients, pipeline
flow and compression of gases are some of the problems requiring the
gas compressibility factor, or Z factor. Typically, the Z factor is
determined by laboratory measurement. However, laboratory data is only
applicable for the conditions and condition investigated. When conditions
Estimation of Natural Gas Compressibility Factors ـــــــــــــــــــــــــــــــــــــــــــــــــــــــــــــ
University Bulletin – ISSUE No.21- Vol. (5) – August- 2019. 76
of interest are different from those of the laboratory studies or data is not
available, correlations must be used.
This study has been conducted on four gas fields of Sirte Oil
Company, namely Zeltinfield, Al Ragouba field, Al Hotayba field and Al
Braiga field. The Z factor has been calculated for the different fields
using mathematical correlations and charts through the calculations of
pseudocritical and pseudoreducedtemperature��� and pressure���. The
values obtained are corrected because the natural gases contain
impurities(H2S, CO2, N2) that caused factor deviation. The results exhibit
some variation due the different constituents of gas mixture.
Key words: Natural gas, compressibilityfactor, pseudocritical
temperature, pseudocriticalpressure,pseudoreduced temperature,
pseudoreduced pressure, correlations, equation of state.
1. Introduction
Basically the magnitude of deviation of real gases from the
conditions of the ideal gas law increases with increasing pressure and
temperature and varied widely with the composition of the gas. Real
gases behave differently than ideal gases. The reason for this is the
perfect gas law was derived under the assumption that the volume of
molecules is insignificant and no molecular attraction or repulsion exist
between them. This is not the case of real gases [1].
Numerous equationsofstate have been developed in the attempt to
correlate the pressure-volume-temperature variables for real gases with
ـــــــــــــــــــــــــــــــــــــــــــــــــــــــــــــــــــــــــــــــــــــــــــــ Ibrahim M. Abou El Lei11, & et.al.,
University Bulletin – ISSUE No.21- Vol. (5) – August- 2019. 77
experimental data. More recent equations-of-state are suggested. In order
to express a more exact relationship between the variables P, V and T, a
correction factor called the gas compressibility factor, gas deviation
factor, or simply the Z-factor, must be introduced into the general
equation of gases to account for departure gases from ideality. The
compressibility factor Z is a dimensionless quantity and is defined as the
ratio of actual volume of n-moles of gas at T and P to the ideal volume of
the same number of moles at the same T and P.
For a perfect gas, the compressibility factor Z is equal to one. For a
real gas, the Z-factor is greater or less than one depending on the
pressure, temperature and the composition of the gas.
The value of Z at any given pressure and temperature can be
determined experimentally by measuring the actual volume of some
quantity of gas at the specified P and T.
It is commonly known that natural gas owns compressibility. When
subjected to the reservoir pressure and temperature, the natural gas is in
compression. However, various parameters of it undergo gradual changes
at any stage of its flowing course which involves the underground
percolation in formation and the wellbore flowing, resulting from the
pressure drop and volume expansion. State equations are commonly used
for gas to indicate its change in state (pressure P, volume V, and
temperature T), and some high-pressure physical parameters which
arequite practical in engineering are also introduced, for example, volume
factor, isothermal compressibility, and viscosity ratio[1].
Estimation of Natural Gas Compressibility Factors ـــــــــــــــــــــــــــــــــــــــــــــــــــــــــــــ
University Bulletin – ISSUE No.21- Vol. (5) – August- 2019. 78
The basic methods for estimating the gas compressibility factor are
well known. The principle of corresponding states, kay'spseudocritical
point, and the standing and kay's chart are commonly used. If the
composition of the gas is known, the pseudocritical temperature T�� and
pressure P�� may be calculated using Kay's rules-molar averages of the
critical properties of the mixture's components. Otherwise, the
pseudocritical temperature and pressure may be calculated using
correlation based on gas specific gravity. The pseudo reduced
temperature T� and pressure P� may be calculated and the equation of
state may be used to determine the Z factor.
2. Composition of Natural Gas
Generally, natural gas is flammable or inflammable gaseous
mixtures of hydrocarbons and non-hydrocarbons, extracted from the
underground, at normal temperature and pressure.
3. Classification of Natural Gas
Narrowly speaking, natural gas can be classified into different types:
(1) According to the essential features of the deposits: The natural
gas can be ranged into two types: oil reservoir associated gas and gas
from gas reservoir. The former one is dissolved in crude oil at the
reservoir condition and released from oil as pressure drops. The later one,
gas from gas reservoir, is in a gaseous state in the underground
formations and includes two types named pure gas and condense gas,
respectively. The principal constituent of the gas in pure gas reservoirs is
ـــــــــــــــــــــــــــــــــــــــــــــــــــــــــــــــــــــــــــــــــــــــــــــ Ibrahim M. Abou El Lei11, & et.al.,
University Bulletin – ISSUE No.21- Vol. (5) – August- 2019. 79
methane, with some others such as ethane, propane, and butane. The gas
from gas-condensate reservoir, on analysis of the effluent at the oil
wellhead, contains not only methane, ethane, propane and butane, but
also some liquid C5+ hydrocarbons between C7 and C11.
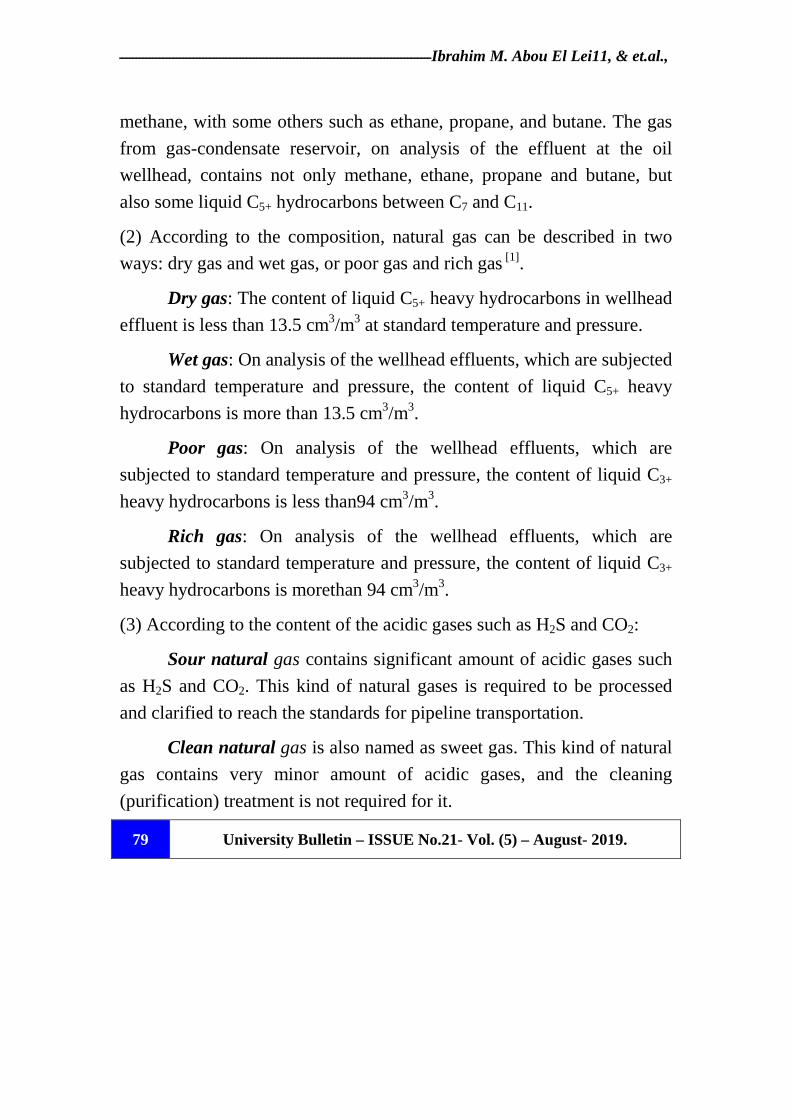
(2) According to the composition, natural gas can be described in two
ways: dry gas and wet gas, or poor gas and rich gas [1].
Dry gas: The content of liquid C5+ heavy hydrocarbons in wellhead
effluent is less than 13.5 cm3/m3 at standard temperature and pressure.
Wet gas: On analysis of the wellhead effluents, which are subjected
to standard temperature and pressure, the content of liquid C5+ heavy
hydrocarbons is more than 13.5 cm3/m3.
Poor gas: On analysis of the wellhead effluents, which are
subjected to standard temperature and pressure, the content of liquid C3+
heavy hydrocarbons is less than94 cm3/m3.
Rich gas: On analysis of the wellhead effluents, which are
subjected to standard temperature and pressure, the content of liquid C3+
heavy hydrocarbons is morethan 94 cm3/m3.
(3) According to the content of the acidic gases such as H2S and CO2:
Sour natural gas contains significant amount of acidic gases such
as H2S and CO2. This kind of natural gases is required to be processed
and clarified to reach the standards for pipeline transportation.
Clean natural gas is also named as sweet gas. This kind of natural
gas contains very minor amount of acidic gases, and the cleaning
(purification) treatment is not required for it.
Estimation of Natural Gas Compressibility Factors ـــــــــــــــــــــــــــــــــــــــــــــــــــــــــــــ
University Bulletin – ISSUE No.21- Vol. (5) – August- 2019. 80
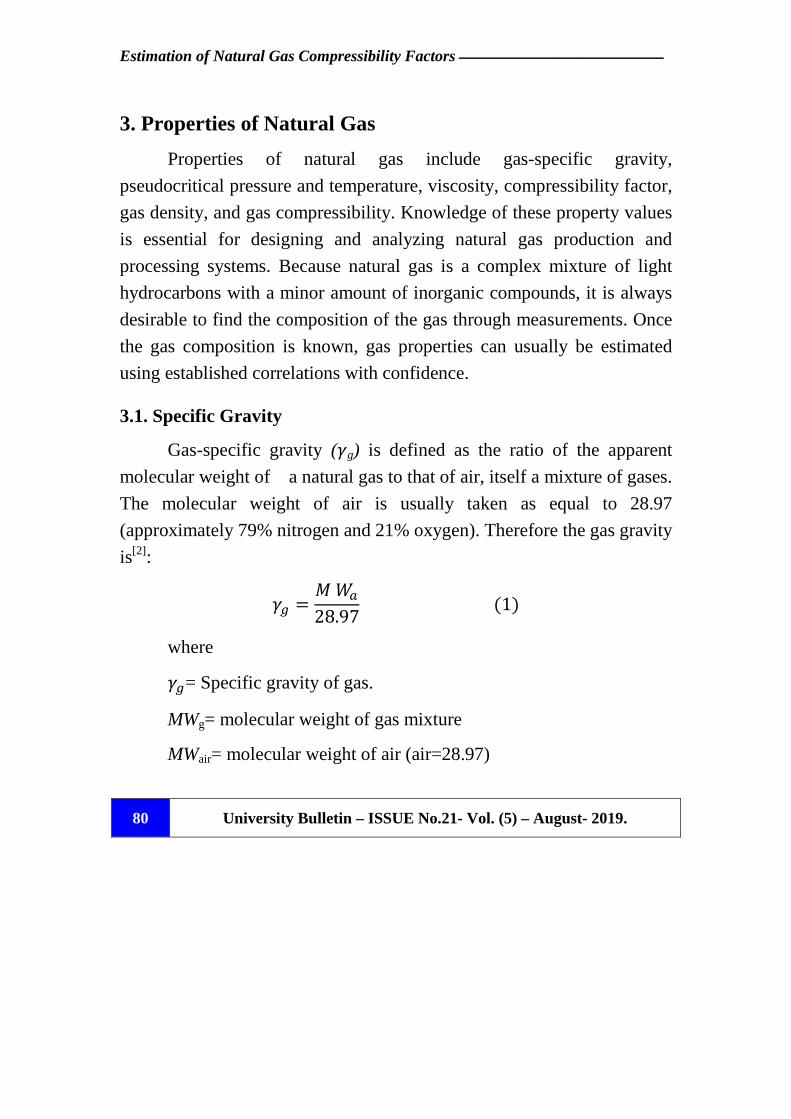
3. Properties of Natural Gas
Properties of natural gas include gas-specific gravity,
pseudocritical pressure and temperature, viscosity, compressibility factor,
gas density, and gas compressibility. Knowledge of these property values
is essential for designing and analyzing natural gas production and
processing systems. Because natural gas is a complex mixture of light
hydrocarbons with a minor amount of inorganic compounds, it is always
desirable to find the composition of the gas through measurements. Once
the gas composition is known, gas properties can usually be estimated
using established correlations with confidence.
3.1. Specific Gravity
Gas-specific gravity (g) is defined as the ratio of the apparent
molecular weight of a natural gas to that of air, itself a mixture of gases.
The molecular weight of air is usually taken as equal to 28.97
(approximately 79% nitrogen and 21% oxygen). Therefore the gas gravity
is[2]:
� = ��28.97(1) where
�= Specific gravity of gas.
MWg= molecular weight of gas mixture
MWair= molecular weight of air (air=28.97)
ـــــــــــــــــــــــــــــــــــــــــــــــــــــــــــــــــــــــــــــــــــــــــــــ Ibrahim M. Abou El Lei11, & et.al.,
University Bulletin – ISSUE No.21- Vol. (5) – August- 2019. 81
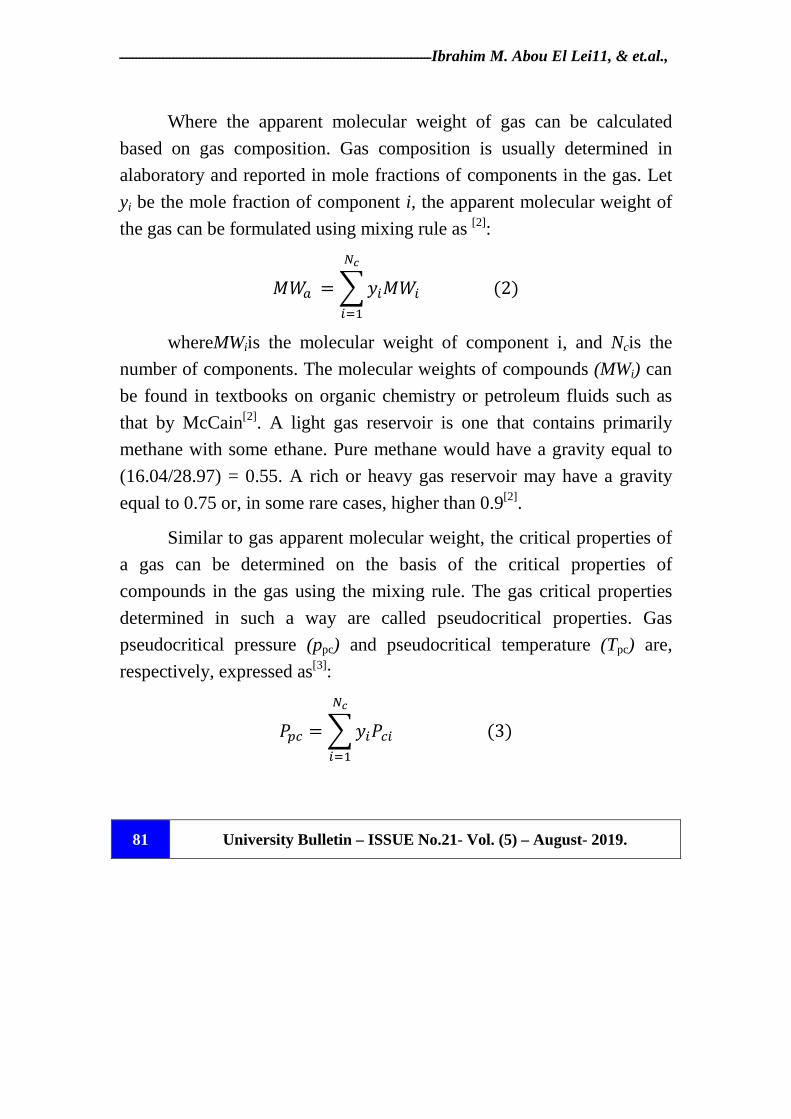
Where the apparent molecular weight of gas can be calculated
based on gas composition. Gas composition is usually determined in
alaboratory and reported in mole fractions of components in the gas. Let
yi be the mole fraction of component i, the apparent molecular weight of
the gas can be formulated using mixing rule as [2]:
�� = ��� ����
���(2)
whereMWiis the molecular weight of component i, and Ncis the
number of components. The molecular weights of compounds (MWi) can
be found in textbooks on organic chemistry or petroleum fluids such as
that by McCain[2]. A light gas reservoir is one that contains primarily
methane with some ethane. Pure methane would have a gravity equal to
(16.04/28.97) = 0.55. A rich or heavy gas reservoir may have a gravity
equal to 0.75 or, in some rare cases, higher than 0.9[2].
Similar to gas apparent molecular weight, the critical properties of
a gas can be determined on the basis of the critical properties of
compounds in the gas using the mixing rule. The gas critical properties
determined in such a way are called pseudocritical properties. Gas
pseudocritical pressure (ppc) and pseudocritical temperature (Tpc) are,
respectively, expressed as[3]:
�� = ���� ���
���(3)
Estimation of Natural Gas Compressibility Factors ـــــــــــــــــــــــــــــــــــــــــــــــــــــــــــــ
University Bulletin – ISSUE No.21- Vol. (5) – August- 2019. 82
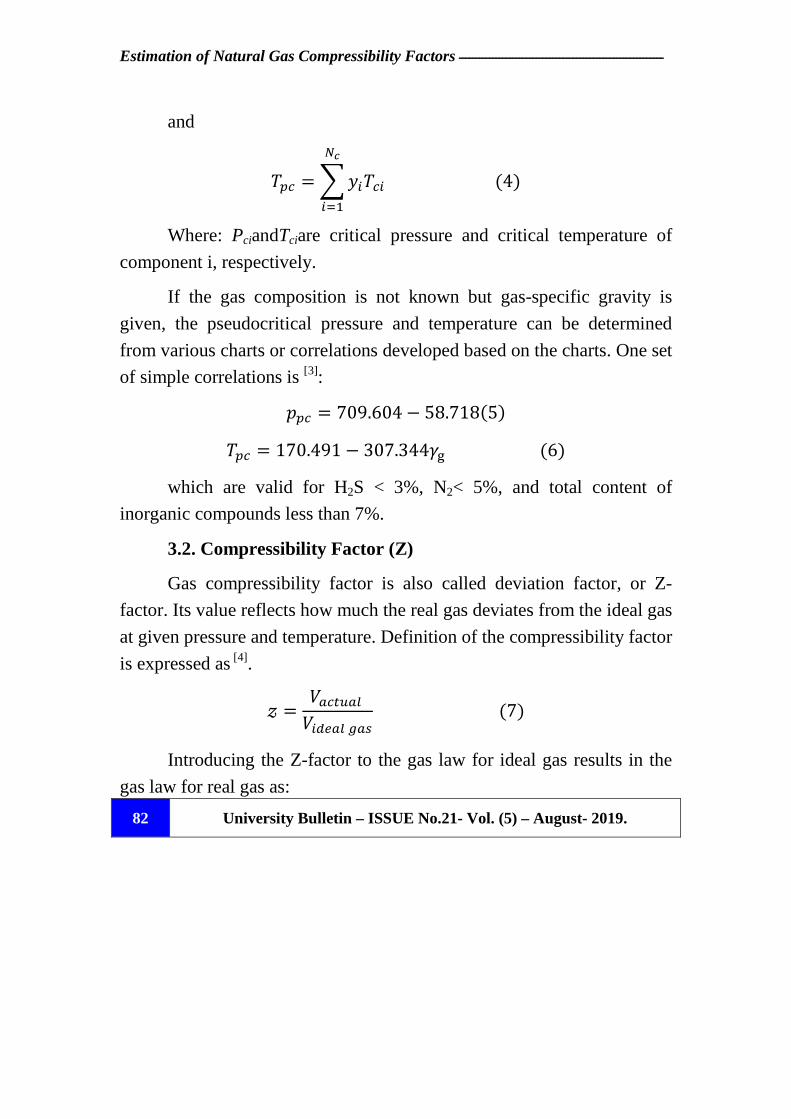
and
�� = ���� ���
���(4)
Where: PciandTciare critical pressure and critical temperature of
component i, respectively.
If the gas composition is not known but gas-specific gravity is
given, the pseudocritical pressure and temperature can be determined
from various charts or correlations developed based on the charts. One set
of simple correlations is [3]:
#� = 709.604 − 58.718(5) �� = 170.491 − 307.344((6)
which are valid for H2S < 3%, N2< 5%, and total content of
inorganic compounds less than 7%.
3.2. Compressibility Factor (Z)
Gas compressibility factor is also called deviation factor, or Z-
factor. Its value reflects how much the real gas deviates from the ideal gas
at given pressure and temperature. Definition of the compressibility factor
is expressed as [4].
) = *� +,�-*�./�-��0 (7) Introducing the Z-factor to the gas law for ideal gas results in the
gas law for real gas as:
ـــــــــــــــــــــــــــــــــــــــــــــــــــــــــــــــــــــــــــــــــــــــــــــ Ibrahim M. Abou El Lei11, & et.al.,
University Bulletin – ISSUE No.21- Vol. (5) – August- 2019. 83
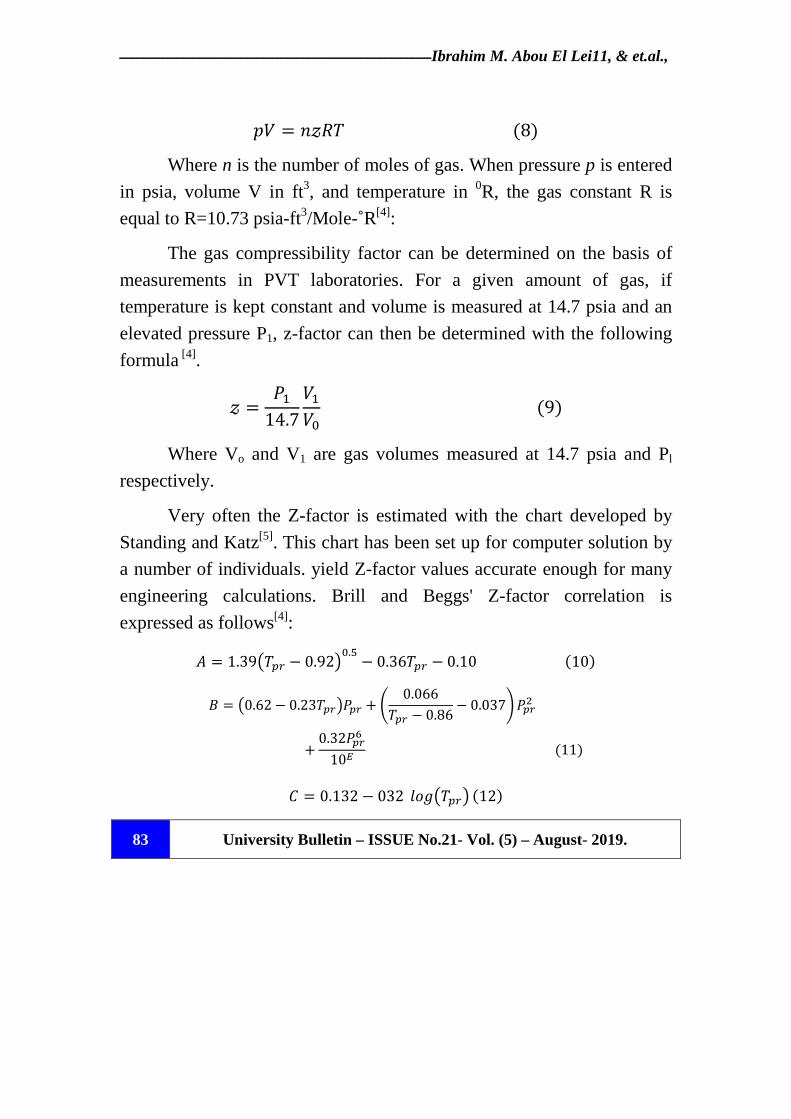
#* = 1)2�(8) Where n is the number of moles of gas. When pressure p is entered
in psia, volume V in ft3, and temperature in 0R, the gas constant R is
equal to R=10.73 psia-ft3/Mole-˚R[4]:
The gas compressibility factor can be determined on the basis of
measurements in PVT laboratories. For a given amount of gas, if
temperature is kept constant and volume is measured at 14.7 psia and an
elevated pressure P1, z-factor can then be determined with the following
formula [4].
) = ��14.7*�*3 (9)
Where Vo and V1 are gas volumes measured at 14.7 psia and Pl
respectively.
Very often the Z-factor is estimated with the chart developed by
Standing and Katz[5]. This chart has been set up for computer solution by
a number of individuals. yield Z-factor values accurate enough for many
engineering calculations. Brill and Beggs' Z-factor correlation is
expressed as follows[4]:
4 = 1.395��� − 0.9263.7 − 0.36��� − 0.10(10) 8 = 50.62 − 0.23���6��� + : 0.066
��� − 0.86 − 0.037;���<
+ 0.32���=10> (11) ? = 0.132 − 032 @AB5���6 (12)
Estimation of Natural Gas Compressibility Factors ـــــــــــــــــــــــــــــــــــــــــــــــــــــــــــــ
University Bulletin – ISSUE No.21- Vol. (5) – August- 2019. 84
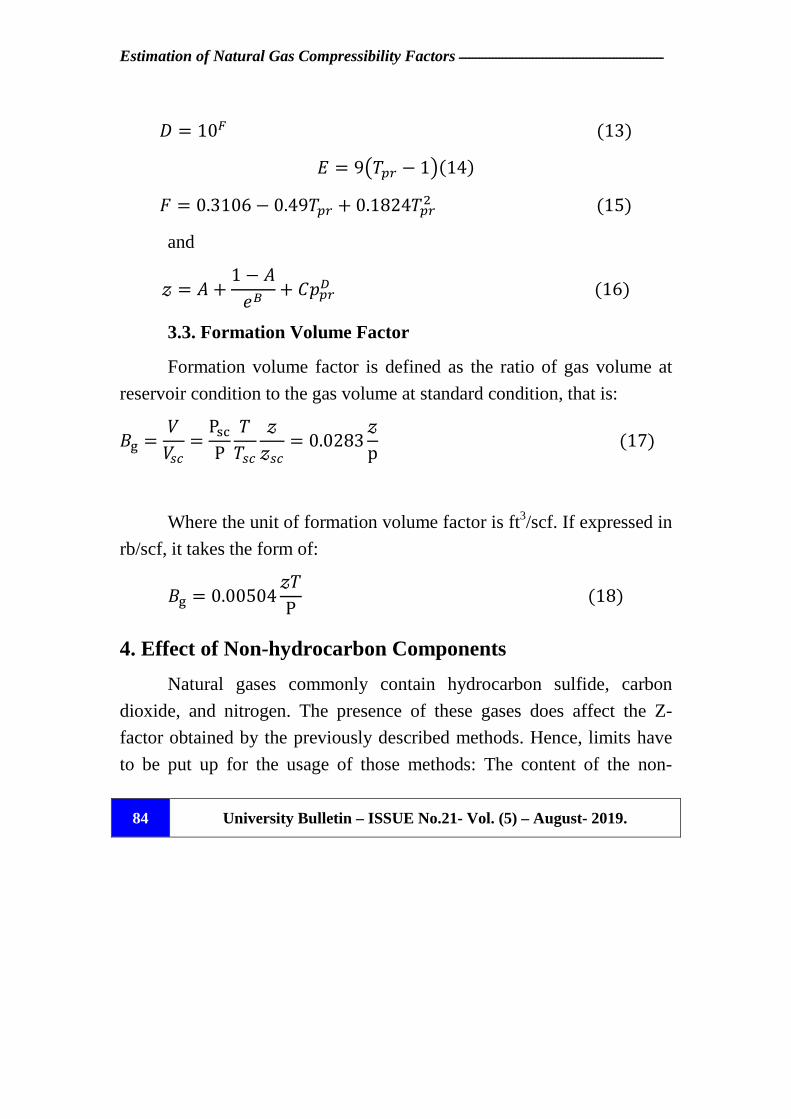
C = 10D (13) E = 95��� − 16(14)
F = 0.3106 − 0.49��� + 0.1824���< (15) and
) = 4 + 1 − 4GH + ?#��I (16)
3.3. Formation Volume Factor
Formation volume factor is defined as the ratio of gas volume at
reservoir condition to the gas volume at standard condition, that is:
8( = **0 =
PJ�P��0
))0 = 0.0283)p(17)
Where the unit of formation volume factor is ft3/scf. If expressed in
rb/scf, it takes the form of:
8( = 0.00504)�P (18) 4. Effect of Non-hydrocarbon Components
Natural gases commonly contain hydrocarbon sulfide, carbon
dioxide, and nitrogen. The presence of these gases does affect the Z-
factor obtained by the previously described methods. Hence, limits have
to be put up for the usage of those methods: The content of the non-
ـــــــــــــــــــــــــــــــــــــــــــــــــــــــــــــــــــــــــــــــــــــــــــــ Ibrahim M. Abou El Lei11, & et.al.,
University Bulletin – ISSUE No.21- Vol. (5) – August- 2019. 85
hydrocarbons in the studied natural gas must be less than5 % by volume
(the volume content of N2 is less than 2 % and the volume content of CO2
is less than 1 %), and what’s more, the volume content of methane should
not be less than 50 %. Exceeding these limits means great error (more
than 3 %). For this reason, when the non-hydrocarbon or C5+ components
of a natural gas(e.g., condensate gas) make a comparatively high
contribution, the methods should undergo a correction by referring to
some other chartsand equations. To remedy this problem, methods have
been developed to eliminate the error caused by non-hydrocarbons, and
two of them will be introduced below.
4.1. Wichert-Aziz Correction Method
In order to get a corrected Z-factor, this method adjusts the pseudo-
critical parameters and the pseudo-reduced parameters, through an
adjustment of the curve on the reference chart, to account for the unusual
behavior of these gases containing impurities: Firstly, bring in an
adjustment factor ε, a function of the concentrations of H2S and CO2, to
the pseudo-critical temperature Tpr; Secondly, correct the pseudo-critical
pressure ppc; thirdly, with the corrected Tpr and Ppc, calculate the T'pc and
P'pc; and finally get the value of Z-factor on basis of Tpr and Ppr, referring
to their original Z-chart. Then, we can get the compressibility factor
fortheacid natural gases that contain H2S and CO2.
Corrections for impurities in sour gases are always necessary. The
corrections can be made using either charts or correlations such as the
Wichert and Aziz correction by calculation acentric factor Lexpressed as
follows[3]:
Estimation of Natural Gas Compressibility Factors ـــــــــــــــــــــــــــــــــــــــــــــــــــــــــــــ
University Bulletin – ISSUE No.21- Vol. (5) – August- 2019. 86
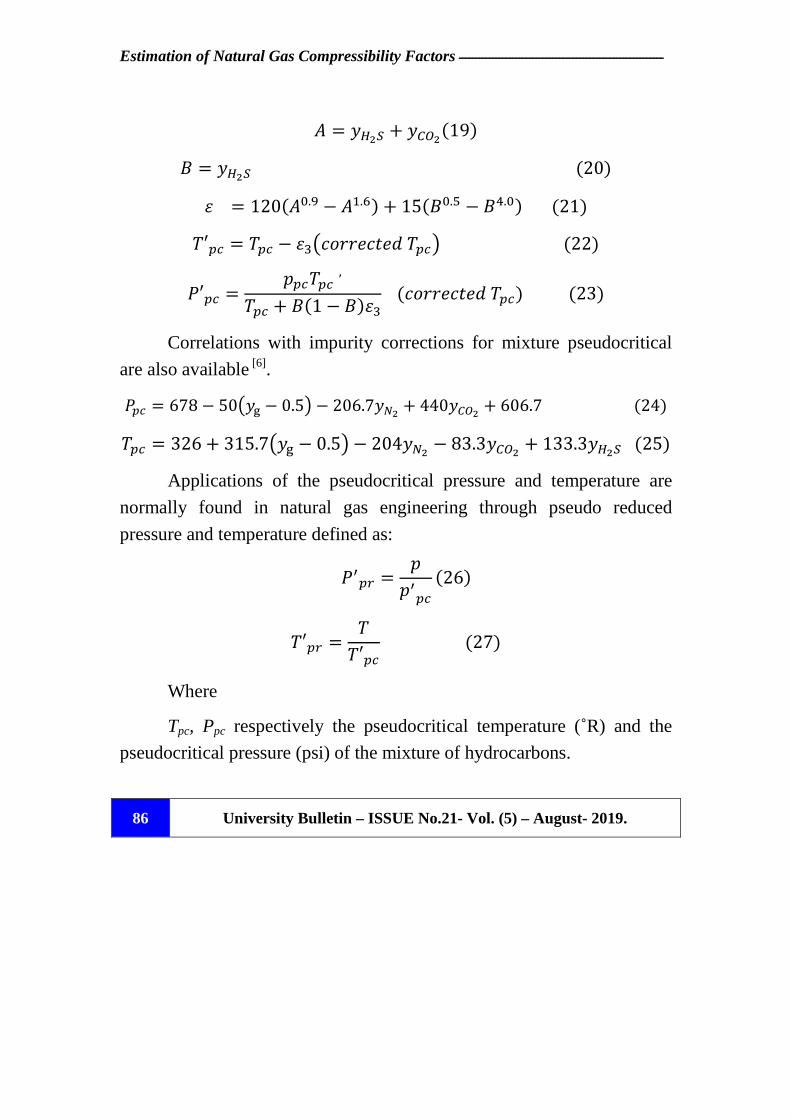
4 = �MNO + �PQN(19) 8 = �MNO(20)
L = 120(43.R − 4�.=) + 15(83.7 − 8S.3)(21) �′� = �� − LU5VAWWGVXGY�� 6(22) �′� = #� �� ,�� + 8(1 − 8)LU (VAWWGVXGY�� )(23)
Correlations with impurity corrections for mixture pseudocritical
are also available [6].
�� = 678 − 505�( − 0.56 − 206.7��N + 440�PQN + 606.7(24) �� = 326 + 315.75�( − 0.56 − 204��N − 83.3�PQN + 133.3�MNO(25)
Applications of the pseudocritical pressure and temperature are
normally found in natural gas engineering through pseudo reduced
pressure and temperature defined as:
�[�� = ##[� (26)
�′�� = ��′� (27)
Where
Tpc, Ppc respectively the pseudocritical temperature (˚R) and the
pseudocritical pressure (psi) of the mixture of hydrocarbons.
ـــــــــــــــــــــــــــــــــــــــــــــــــــــــــــــــــــــــــــــــــــــــــــــ Ibrahim M. Abou El Lei11, & et.al.,
University Bulletin – ISSUE No.21- Vol. (5) – August- 2019. 87
T'pc,P'pc the pseudocritical temperature (˚R) and the pseudo-critical
pressure(psia) after correction; n the mole fraction of the H2S in natural
gas;εthe adjustment factor for the pseudocritical temperature (˚R) as a
function of the concentrations of H2S and CO2.
�′��and�′�� are pseudo-reduced temperature and pressure
respectively.
4.2. Carr-Kobayashi-Burrows Correction Method
Carr, Kobayashi, and Burrows[7] proposed a simplified procedure
to adjust the pseudocritical properties of natural gases when
nonhydrocarbon components are present. The method can be used when
the composition of the natural gas is not available.
�[� = #� − 440�\]N + 600�MNO − 170��N(28)
�′� = �� − 80�\]N + 130�MNO − 250��N (29) Where
�′� = the adjusted pseudocritical temperature, ˚R
�� = the unadjusted pseudocritical temperature, ˚R
�′� = the adjusted pseudocritical pressure, psia
�� = the unadjusted pseudocritical pressure, psia
�\]N = mole fraction of CO2
Estimation of Natural Gas Compressibility Factors ـــــــــــــــــــــــــــــــــــــــــــــــــــــــــــــ
University Bulletin – ISSUE No.21- Vol. (5) – August- 2019. 88
��N = mole fraction of nitrogen
�MNO = mole fraction of H2S in gas mixture
5. Material and Methods
5.1. Location of Study
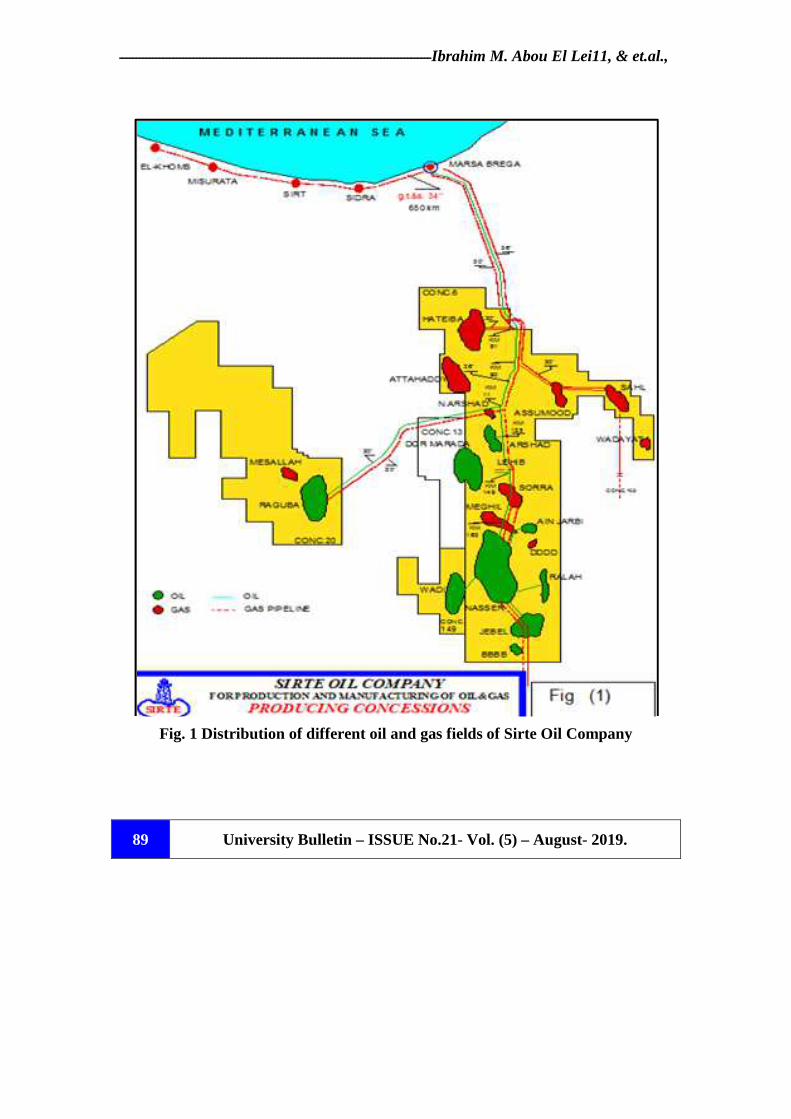
This study has been carried out on four gas fieldsareZeltin field, Al
Ragouba field, Al Hotayba field and Al BraigaterminalofSirte Oil
Company. The data of chemical analysis of the investigated gas fields are
obtained from central laboratory of Oil Company.
The distribution of different oil and gas fields of Sirte Oil
Company are illustrated in Figure 1.
ـــــــــــــــــــــــــــــــــــــــــــــــــــــــــــــــــــــــــــــــــــــــــــــ Ibrahim M. Abou El Lei11, & et.al.,
University Bulletin – ISSUE No.21- Vol. (5) – August- 2019. 89
Fig. 1 Distribution of different oil and gas fields of Sirte Oil Company
Estimation of Natural Gas Compressibility Factors ـــــــــــــــــــــــــــــــــــــــــــــــــــــــــــــ
University Bulletin – ISSUE No.21- Vol. (5) – August- 2019. 90
6. Results and Discussion
Tables 1 through 4 show the chemical composition of natural gas
for the different gas fields. The pseudocritical properties, molecular
weight, specific gravity, acentric factor Land Z factor are calculated by
applying the above Equations and presented in these tables.
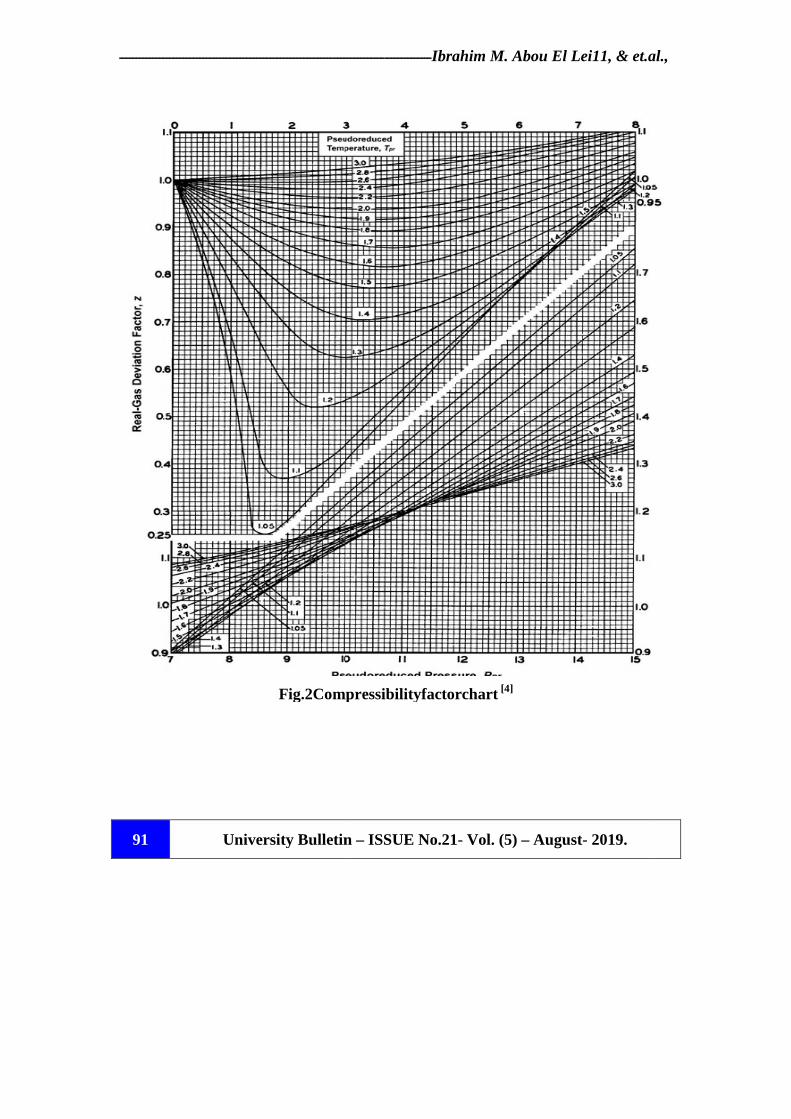
On the other hand, from Standing-Katz chart, Fig. 2 the
relationship between Tr&pr can be used to determine the compressibility
factor Z of a gases[5,8-10].
Theadjusted(corrected)pseudocriticaltemperature, �′� and
the adjusted pseudocritical pressure �′� are calculated from Equations
26 and 27 using Wichert-Aziz correction method, as well as Equations 28
and 29 of Carr-Kobayashi-Burrows correction method.
ـــــــــــــــــــــــــــــــــــــــــــــــــــــــــــــــــــــــــــــــ
University Bulletin 91
Fig.2Compressibilityfactorchart
ـــــــــــــــــــــــــــــ Ibrahim M. Abou El Lei11, & et.al.,
University Bulletin – ISSUE No.21- Vol. (5) – August- 2019.
Fig.2Compressibilityfactorchart [4]
& et.al.,
Estimation of Natural Gas Compressibility Factors ـــــــــــــــــــــــــــــــــــــــــــــــــــــــــــــ
University Bulletin – ISSUE No.21- Vol. (5) – August- 2019. 92
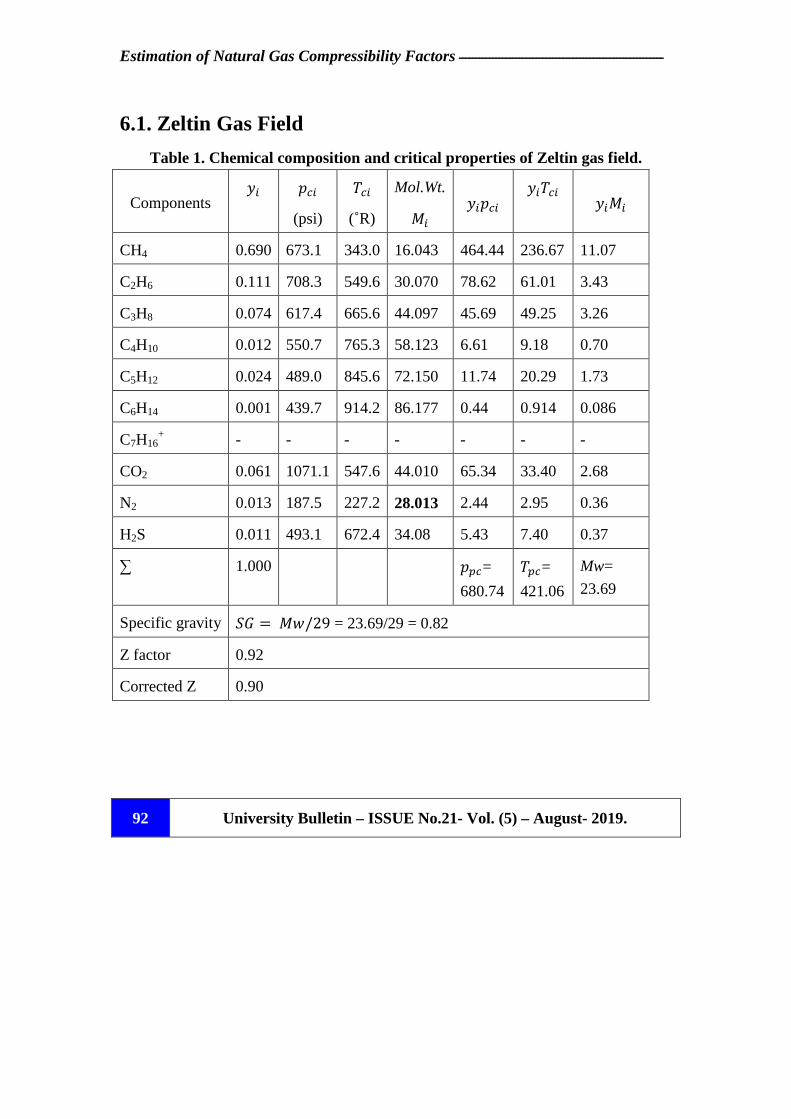
6.1. Zeltin Gas Field
Table 1. Chemical composition and critical properties of Zeltin gas field.
Components ��
# � (psi)
� � (˚R)
Mol.Wt.
� ��# � ��� �
�� �
CH4 0.690 673.1 343.0 16.043 464.44 236.67 11.07
C2H6 0.111 708.3 549.6 30.070 78.62 61.01 3.43
C3H8 0.074 617.4 665.6 44.097 45.69 49.25 3.26
C4H10 0.012 550.7 765.3 58.123 6.61 9.18 0.70
C5H12 0.024 489.0 845.6 72.150 11.74 20.29 1.73
C6H14 0.001 439.7 914.2 86.177 0.44 0.914 0.086
C7H16+ - - - - - - -
CO2 0.061 1071.1 547.6 44.010 65.34 33.40 2.68
N2 0.013 187.5 227.2 28.013 2.44 2.95 0.36
H2S 0.011 493.1 672.4 34.08 5.43 7.40 0.37
∑ 1.000 #� =
680.74
�� =
421.06
Mw=
23.69
Specific gravity kl = m/29 = 23.69/29 = 0.82
Z factor 0.92
Corrected Z 0.90
ـــــــــــــــــــــــــــــــــــــــــــــــــــــــــــــــــــــــــــــــــــــــــــــ Ibrahim M. Abou El Lei11, & et.al.,
University Bulletin – ISSUE No.21- Vol. (5) – August- 2019. 93
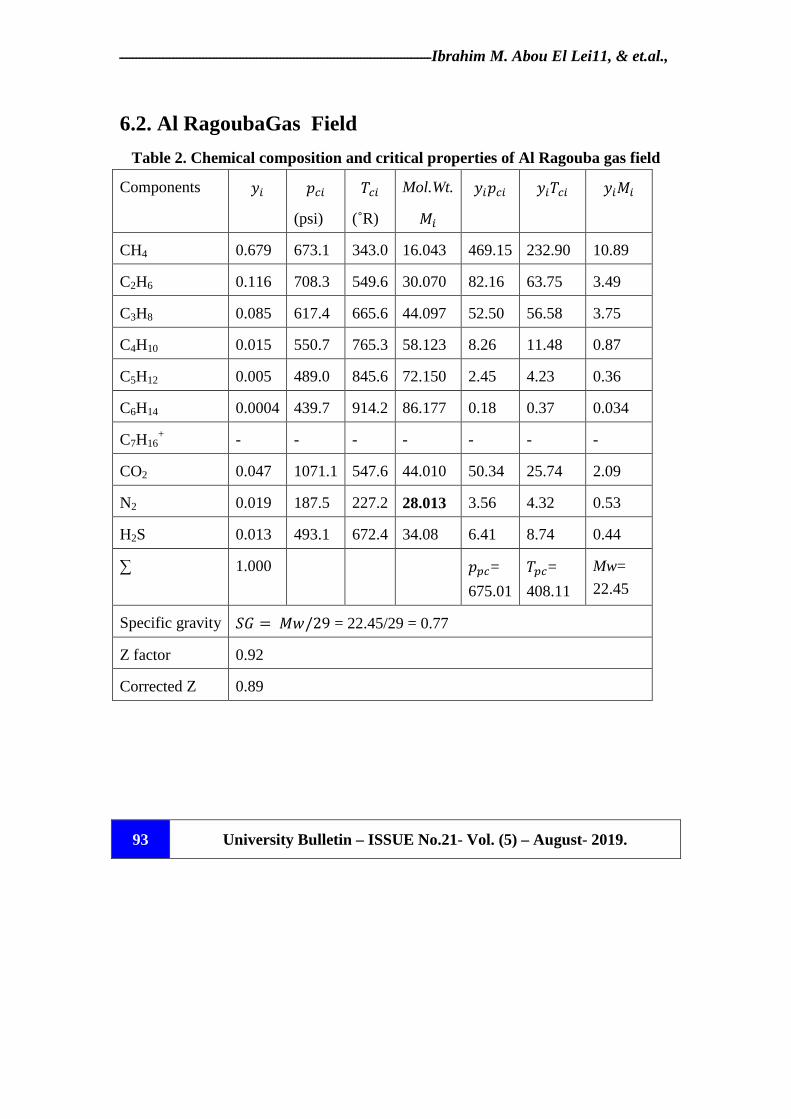
6.2. Al RagoubaGas Field
Table 2. Chemical composition and critical properties of Al Ragouba gas field
Components ��
# � (psi)
� � (˚R)
Mol.Wt.
� ��# � ��� �
�� �
CH4 0.679 673.1 343.0 16.043 469.15 232.90 10.89
C2H6 0.116 708.3 549.6 30.070 82.16 63.75 3.49
C3H8 0.085 617.4 665.6 44.097 52.50 56.58 3.75
C4H10 0.015 550.7 765.3 58.123 8.26 11.48 0.87
C5H12 0.005 489.0 845.6 72.150 2.45 4.23 0.36
C6H14 0.0004 439.7 914.2 86.177 0.18 0.37 0.034
C7H16+ - - - - - - -
CO2 0.047 1071.1 547.6 44.010 50.34 25.74 2.09
N2 0.019 187.5 227.2 28.013 3.56 4.32 0.53
H2S 0.013 493.1 672.4 34.08 6.41 8.74 0.44
∑ 1.000 #� =
675.01
�� =
408.11
Mw=
22.45
Specific gravity kl = m/29 = 22.45/29 = 0.77
Z factor 0.92
Corrected Z 0.89
Estimation of Natural Gas Compressibility Factors ـــــــــــــــــــــــــــــــــــــــــــــــــــــــــــــ
University Bulletin – ISSUE No.21- Vol. (5) – August- 2019. 94
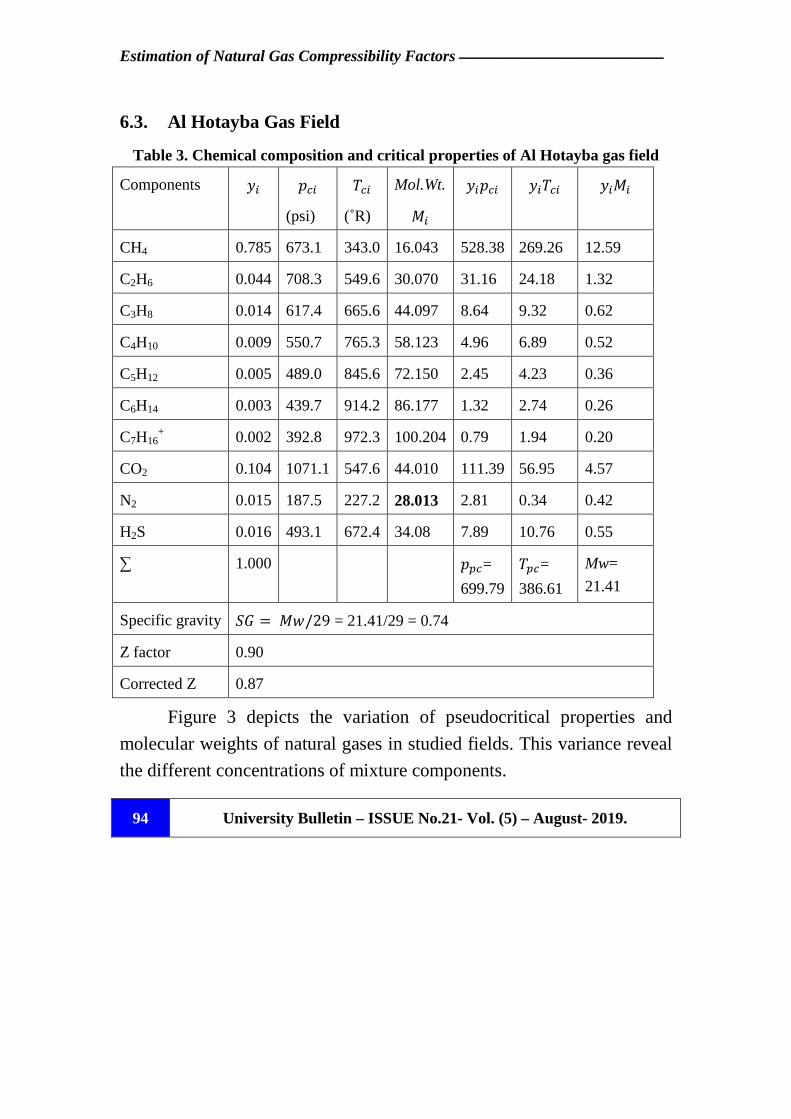
6.3. Al Hotayba Gas Field
Table 3. Chemical composition and critical properties of Al Hotayba gas field
Components ��
# � (psi)
� � (˚R)
Mol.Wt.
� ��# � ��� �
�� �
CH4 0.785 673.1 343.0 16.043 528.38 269.26 12.59
C2H6 0.044 708.3 549.6 30.070 31.16 24.18 1.32
C3H8 0.014 617.4 665.6 44.097 8.64 9.32 0.62
C4H10 0.009 550.7 765.3 58.123 4.96 6.89 0.52
C5H12 0.005 489.0 845.6 72.150 2.45 4.23 0.36
C6H14 0.003 439.7 914.2 86.177 1.32 2.74 0.26
C7H16+ 0.002 392.8 972.3 100.204 0.79 1.94 0.20
CO2 0.104 1071.1 547.6 44.010 111.39 56.95 4.57
N2 0.015 187.5 227.2 28.013 2.81 0.34 0.42
H2S 0.016 493.1 672.4 34.08 7.89 10.76 0.55
∑ 1.000 #� =
699.79
�� =
386.61
Mw=
21.41
Specific gravity kl = m/29 = 21.41/29 = 0.74
Z factor 0.90
Corrected Z 0.87
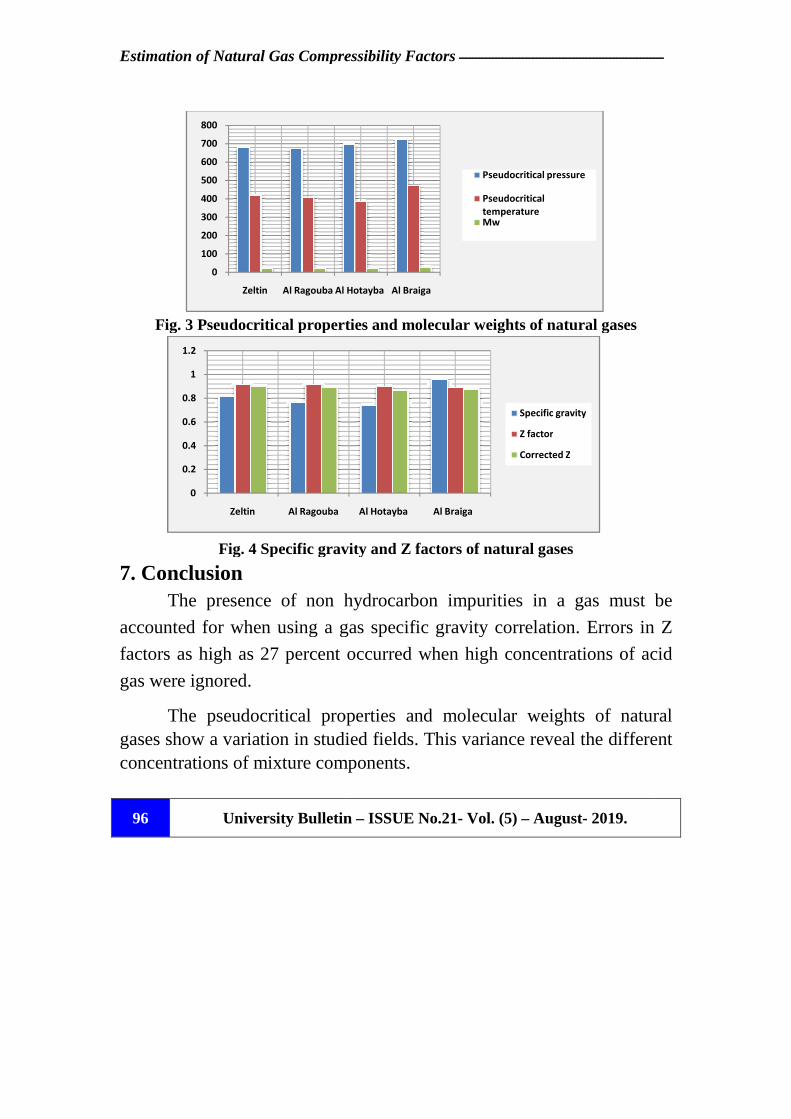
Figure 3 depicts the variation of pseudocritical properties and
molecular weights of natural gases in studied fields. This variance reveal
the different concentrations of mixture components.
ـــــــــــــــــــــــــــــــــــــــــــــــــــــــــــــــــــــــــــــــــــــــــــــ Ibrahim M. Abou El Lei11, & et.al.,
University Bulletin – ISSUE No.21- Vol. (5) – August- 2019. 95
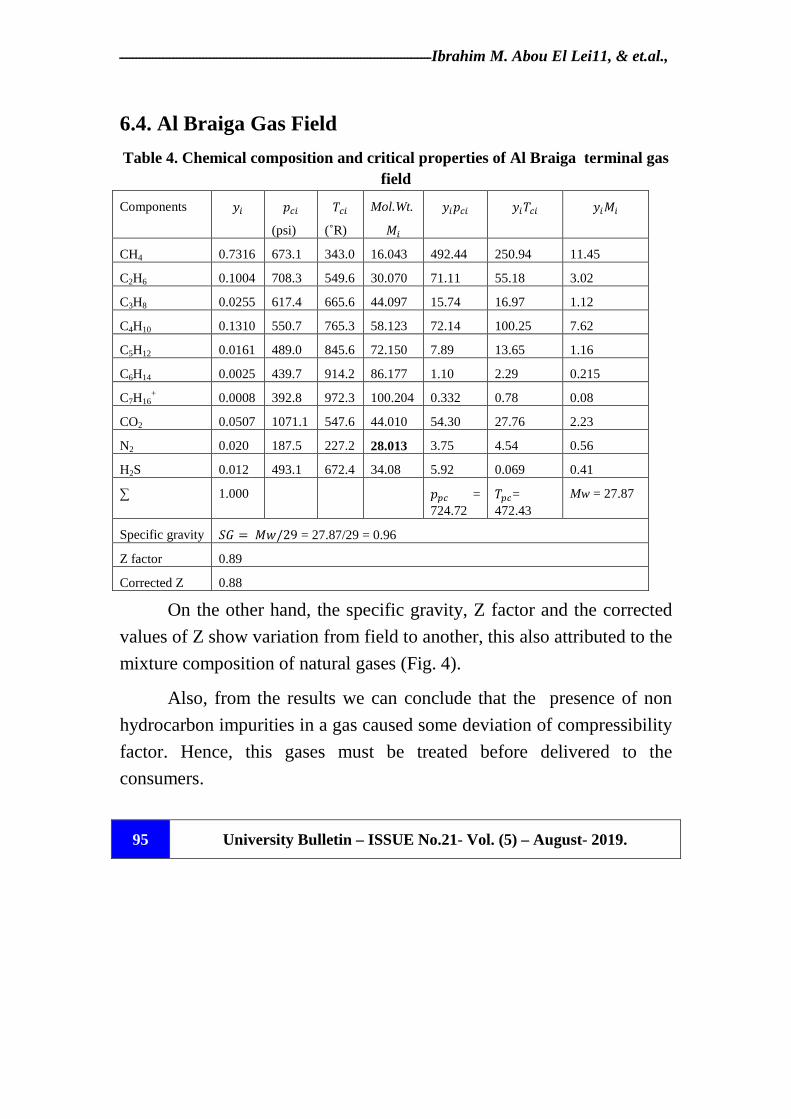
6.4. Al Braiga Gas Field
Table 4. Chemical composition and critical properties of Al Braiga terminal gas field
Components ��
# � (psi)
� � (˚R)
Mol.Wt.
� ��# � ��� �
�� �
CH4 0.7316 673.1 343.0 16.043 492.44 250.94 11.45
C2H6 0.1004 708.3 549.6 30.070 71.11 55.18 3.02
C3H8 0.0255 617.4 665.6 44.097 15.74 16.97 1.12
C4H10 0.1310 550.7 765.3 58.123 72.14 100.25 7.62
C5H12 0.0161 489.0 845.6 72.150 7.89 13.65 1.16
C6H14 0.0025 439.7 914.2 86.177 1.10 2.29 0.215
C7H16+ 0.0008 392.8 972.3 100.204 0.332 0.78 0.08
CO2 0.0507 1071.1 547.6 44.010 54.30 27.76 2.23
N2 0.020 187.5 227.2 28.013 3.75 4.54 0.56
H2S 0.012 493.1 672.4 34.08 5.92 0.069 0.41
∑ 1.000 #� = 724.72
�� = 472.43
Mw = 27.87
Specific gravity kl = m/29 = 27.87/29 = 0.96
Z factor 0.89
Corrected Z 0.88
On the other hand, the specific gravity, Z factor and the corrected
values of Z show variation from field to another, this also attributed to the
mixture composition of natural gases (Fig. 4).
Also, from the results we can conclude that the presence of non
hydrocarbon impurities in a gas caused some deviation of compressibility
factor. Hence, this gases must be treated before delivered to the
consumers.
Estimation of Natural Gas Compressibility Factors
University Bulletin 96
Fig. 3 Pseudocritical properties and molecular weights of natural gases
Fig. 4 Specific gravity and
7. Conclusion The presence of non hydrocarbon impurities in a gas must be
accounted for when using a gas specific gravity correlation. Errors in Z
factors as high as 27 percent occurred when high concentrations of acid
gas were ignored.
The pseudocritical properties and molecular weights of natural gases show a variation in studied fields. This variance reveal the different concentrations of mixture components.
0
100
200
300
400
500
600
700
800
Zeltin Al Ragouba Al Hotayba
0
0.2
0.4
0.6
0.8
1
1.2
Zeltin Al Ragouba
Estimation of Natural Gas Compressibility Factors ـــــــــــــــــــــــــــــــــــــــــــــــــــــــــــ
University Bulletin – ISSUE No.21- Vol. (5) – August- 2019.
Fig. 3 Pseudocritical properties and molecular weights of natural gases
Fig. 4 Specific gravity and Z factors of natural gases
The presence of non hydrocarbon impurities in a gas must be
accounted for when using a gas specific gravity correlation. Errors in Z
factors as high as 27 percent occurred when high concentrations of acid
The pseudocritical properties and molecular weights of natural gases show a variation in studied fields. This variance reveal the different concentrations of mixture components.
Al Hotayba Al Braiga
Pseudocritical pressure
Pseudocritical
temperatureMw
Al Hotayba Al Braiga
Specific gravity
Z factor
Corrected Z
ـــ
The presence of non hydrocarbon impurities in a gas must be
accounted for when using a gas specific gravity correlation. Errors in Z
factors as high as 27 percent occurred when high concentrations of acid
The pseudocritical properties and molecular weights of natural gases show a variation in studied fields. This variance reveal the different
ـــــــــــــــــــــــــــــــــــــــــــــــــــــــــــــــــــــــــــــــــــــــــــــ Ibrahim M. Abou El Lei11, & et.al.,
University Bulletin – ISSUE No.21- Vol. (5) – August- 2019. 97
The Z factors exhibit a variation from field to another, this also attributed to the mixture composition and the impurities content of natural gases. Consequently, these gases must treated to eliminate from nonhydrocarbons components.
Nomenclature
8( = gas formation volume factor
MWg= molecular weight of gas mixture
MWair= molecular weight of air
PVT = pressure-volume-temperature
p = pressure, paia
# = critical pressure, psia
#� = pseudocritical pressure
#�� = pseudoreducedpressure
2 = universal gas constant
T = temperature, ˚R
� = critical temperature ,˚R
�� = pseudocritical temperature
��� = pseudoreduced temperature
�� = mole fraction of the i-th component
Z =gas compressibility factor
�= Specific gravity of gas mixture.
L= Wichert and Aziz pseudocritical temperature adjustment parameter, ˚R
Estimation of Natural Gas Compressibility Factors ـــــــــــــــــــــــــــــــــــــــــــــــــــــــــــــ
University Bulletin – ISSUE No.21- Vol. (5) – August- 2019. 98
References
[1] Sutton, R. P., “Compressibility Factors for High-Molecular-Weight Reservoir Gases,” SPE Paper 14265, presented at the 60th Annual Technical Conference and Exhibition of the Society of Petroleum Engineers, Las Vegas, Sept. 22–25, 1985.
[2] McCain, W. D., “Heavy Components Control Reservoir Fluid Behavior,” JPT, September 1994, pp. 746–750.
[3] Wichert, E., and Aziz, K., “Calculation of Z’s for Sour Gases,” Hydrocarbon Processing, 1972, Vol. 51, No. 5, pp. 119–122.
[4] Brill, J. and Beggs, H., Two-Phase Flow in Pipes. Tulsa, OK: The University of Tulsa, 1978.
[5] Standing, M. B, Katz, D . L., (1942) Density of Crude Oil Saturated with Natural Gas of California Oil. Trans., AIME, 146, 159-165.
[6] Ahmed, T., “Compositional Modeling of Tyler and Mission Canyon Formation Oils with CO2 and Lean Gases,” final report submitted to Montana’s on a New Track for Science (MONTS) (Montana National Science Foundation Grant Program), 1985–1988.
[7] Carr, N., Kobayashi, R., and Burrows, D., “Viscosity of Hydrocarbon Gases Under Pressure,” Trans. AIME, 1954, Vol. 201, pp. 270–275.
[8] Kay, W. B., “Density of Hydrocarbon Gases and Vapor,” Industrial and Engineering Chemistry, 1936, Vol. 28, pp. 1014–1019.
[9] Standing, M. B., Volumetric and Phase Behavior of Oil Field Hydrocarbon Systems, pp. 125–126. Dallas: Society of Petroleum Engineers, 1977.
[10] Standing, M. B. and Katz, D. L., “Density of Natural Gases,” Trans. AIME, 1942, Vol. 146, pp. 140–149.