Embed Size (px)
Citation preview
ONGC, Vadodara
Email: [email protected]
10th Biennial International Conference & Exposition
P 094
Estimation of receiver shear statics from multicomponent uphole survey
Puneet Saxena, M.K. Jain, ONGC
Summary
Converted wave (PS) total field statics comprises of P wave shot statics and receiver shear statics.In multicomponent seismic
data acquisition and processing computation of receiver statics for converted waves has been a challenge to the field crews
and is often left for the processing center wherein the shear statics is estimated from indirect methods based on the data.
Generally shear statics is estimated from shifts in shallow horizon or alternatively, in absence of trackable horizon by scaling
PP receiver statics.Converted shear waves travel with very low velocity in near surface resulting in large static effects. Uphole
surveys are used frequently for computation of near surface P wave velocity model and computation of PP statics. Uphole
survey with 3C sensors offers a direct method of computing near surface shear wave velocity model. The main issue in this
approach is identification of the shear events in the near surface and distinguishing it from surface waves. The paper
demonstrates the methodology for acquisition of 3C uphole data and distinguishing the shear events from rayleigh waves.
Uphole data of different areas of Gandhar and Kalol in Cambay Basin and Changmaigaon in Assam & Assam Arakan Basin
were studied for the purpose. The velocities thus obtained in the Kalol area was used to derive shear statics. The stack after
application of shear statics derived from uphole shows improvement when compared with stack with conventionally derived
shear statics.
Keywords: Receiver shear statics, Multicomponent uphole
Introduction
Uphole surveys are integral part of seismic data acquisition
wherein the first break derived from uphole data is used to
determine near surface P wave velocity model. This model
serves the dual purpose of placement of charge in high
velocity medium and computation of PP statics for shots
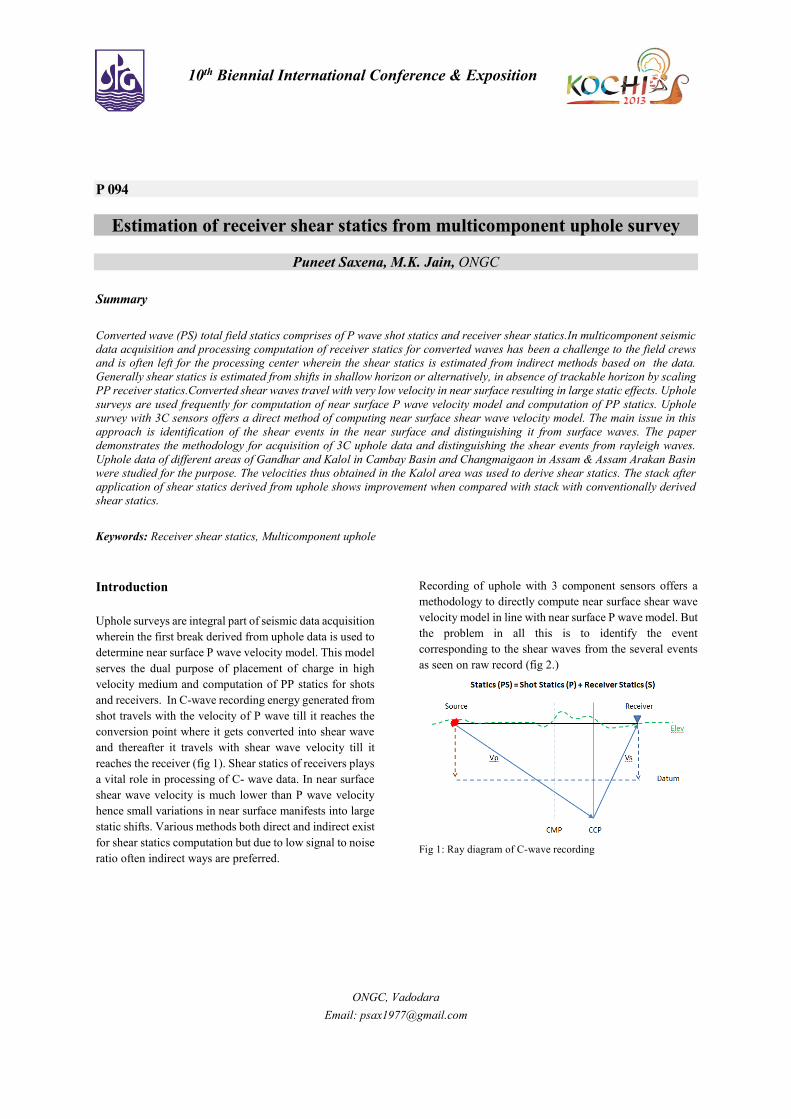
and receivers. In C-wave recording energy generated from
shot travels with the velocity of P wave till it reaches the
conversion point where it gets converted into shear wave
and thereafter it travels with shear wave velocity till it
reaches the receiver (fig 1). Shear statics of receivers plays
a vital role in processing of C- wave data. In near surface
shear wave velocity is much lower than P wave velocity
hence small variations in near surface manifests into large
static shifts. Various methods both direct and indirect exist
for shear statics computation but due to low signal to noise
ratio often indirect ways are preferred.
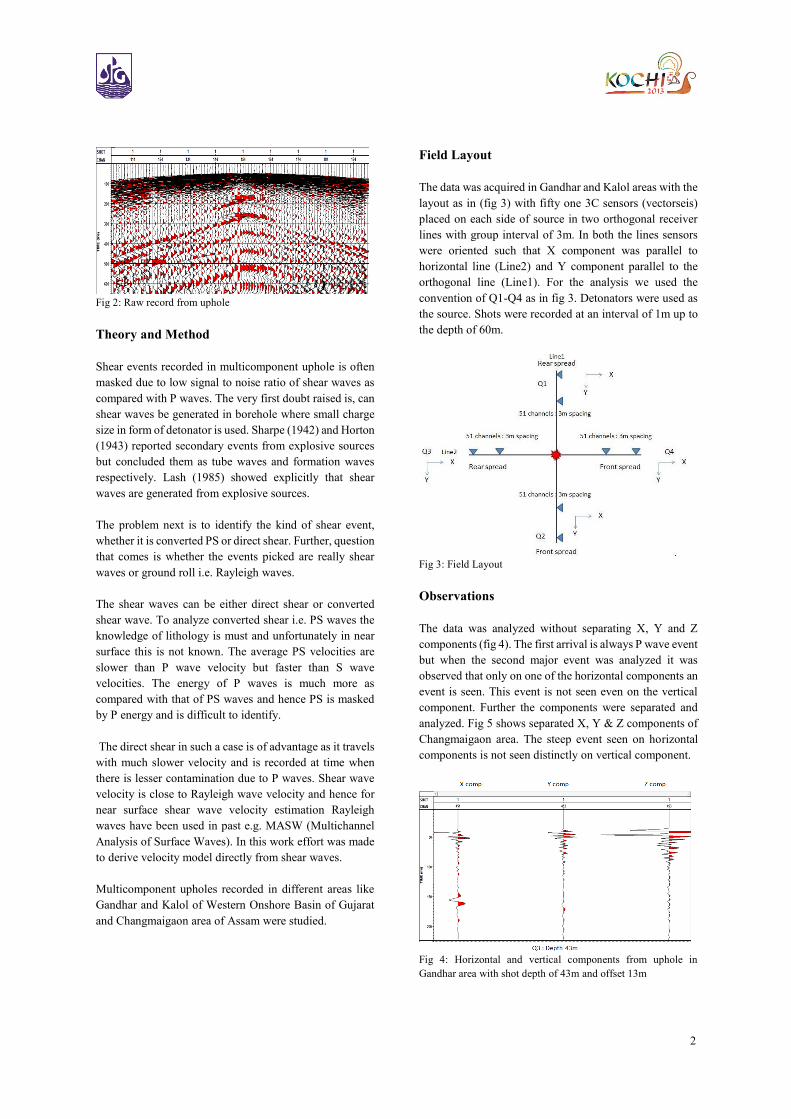
Recording of uphole with 3 component sensors offers a
methodology to directly compute near surface shear wave
velocity model in line with near surface P wave model. But
the problem in all this is to identify the event
corresponding to the shear waves from the several events
as seen on raw record (fig 2.)
Fig 1: Ray diagram of C-wave recording
2
Fig 2: Raw record from uphole
Theory and Method
Shear events recorded in multicomponent uphole is often
masked due to low signal to noise ratio of shear waves as
compared with P waves. The very first doubt raised is, can
shear waves be generated in borehole where small charge
size in form of detonator is used. Sharpe (1942) and Horton
(1943) reported secondary events from explosive sources
but concluded them as tube waves and formation waves
respectively. Lash (1985) showed explicitly that shear
waves are generated from explosive sources.
The problem next is to identify the kind of shear event,
whether it is converted PS or direct shear. Further, question
that comes is whether the events picked are really shear
waves or ground roll i.e. Rayleigh waves.
The shear waves can be either direct shear or converted
shear wave. To analyze converted shear i.e. PS waves the
knowledge of lithology is must and unfortunately in near
surface this is not known. The average PS velocities are
slower than P wave velocity but faster than S wave
velocities. The energy of P waves is much more as
compared with that of PS waves and hence PS is masked
by P energy and is difficult to identify.
The direct shear in such a case is of advantage as it travels
with much slower velocity and is recorded at time when
there is lesser contamination due to P waves. Shear wave
velocity is close to Rayleigh wave velocity and hence for
near surface shear wave velocity estimation Rayleigh
waves have been used in past e.g. MASW (Multichannel
Analysis of Surface Waves). In this work effort was made
to derive velocity model directly from shear waves.
Multicomponent upholes recorded in different areas like
Gandhar and Kalol of Western Onshore Basin of Gujarat
and Changmaigaon area of Assam were studied.
Field Layout
The data was acquired in Gandhar and Kalol areas with the
layout as in (fig 3) with fifty one 3C sensors (vectorseis)
placed on each side of source in two orthogonal receiver
lines with group interval of 3m. In both the lines sensors
were oriented such that X component was parallel to
horizontal line (Line2) and Y component parallel to the
orthogonal line (Line1). For the analysis we used the
convention of Q1-Q4 as in fig 3. Detonators were used as
the source. Shots were recorded at an interval of 1m up to
the depth of 60m.
Fig 3: Field Layout
Observations
The data was analyzed without separating X, Y and Z
components (fig 4). The first arrival is always P wave event
but when the second major event was analyzed it was
observed that only on one of the horizontal components an
event is seen. This event is not seen even on the vertical
component. Further the components were separated and
analyzed. Fig 5 shows separated X, Y & Z components of
Changmaigaon area. The steep event seen on horizontal
components is not seen distinctly on vertical component.
Fig 4: Horizontal and vertical components from uphole in
Gandhar area with shot depth of 43m and offset 13m
3
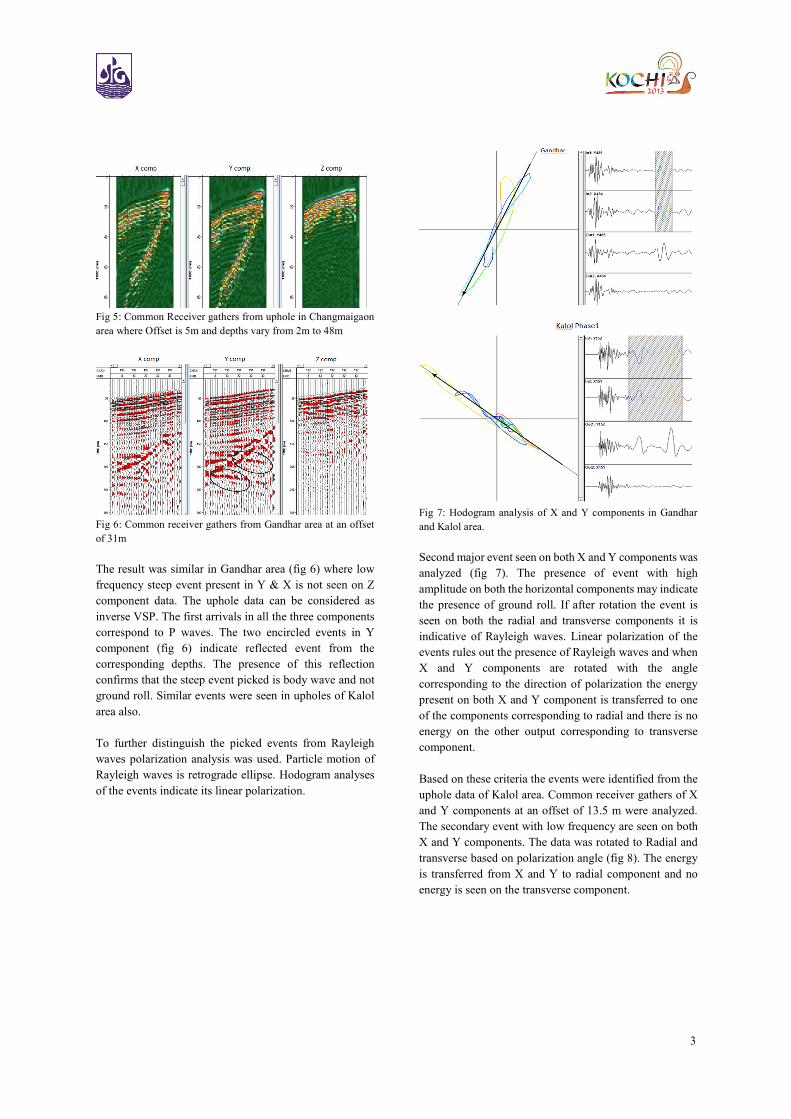
Fig 5: Common Receiver gathers from uphole in Changmaigaon
area where Offset is 5m and depths vary from 2m to 48m
Fig 6: Common receiver gathers from Gandhar area at an offset
of 31m
The result was similar in Gandhar area (fig 6) where low
frequency steep event present in Y & X is not seen on Z
component data. The uphole data can be considered as
inverse VSP. The first arrivals in all the three components
correspond to P waves. The two encircled events in Y
component (fig 6) indicate reflected event from the
corresponding depths. The presence of this reflection
confirms that the steep event picked is body wave and not
ground roll. Similar events were seen in upholes of Kalol
area also.
To further distinguish the picked events from Rayleigh
waves polarization analysis was used. Particle motion of
Rayleigh waves is retrograde ellipse. Hodogram analyses
of the events indicate its linear polarization.
Fig 7: Hodogram analysis of X and Y components in Gandhar
and Kalol area.
Second major event seen on both X and Y components was
analyzed (fig 7). The presence of event with high
amplitude on both the horizontal components may indicate
the presence of ground roll. If after rotation the event is
seen on both the radial and transverse components it is
indicative of Rayleigh waves. Linear polarization of the
events rules out the presence of Rayleigh waves and when
X and Y components are rotated with the angle
corresponding to the direction of polarization the energy
present on both X and Y component is transferred to one
of the components corresponding to radial and there is no
energy on the other output corresponding to transverse
component.
Based on these criteria the events were identified from the
uphole data of Kalol area. Common receiver gathers of X
and Y components at an offset of 13.5 m were analyzed.
The secondary event with low frequency are seen on both
X and Y components. The data was rotated to Radial and
transverse based on polarization angle (fig 8). The energy
is transferred from X and Y to radial component and no
energy is seen on the transverse component.
4
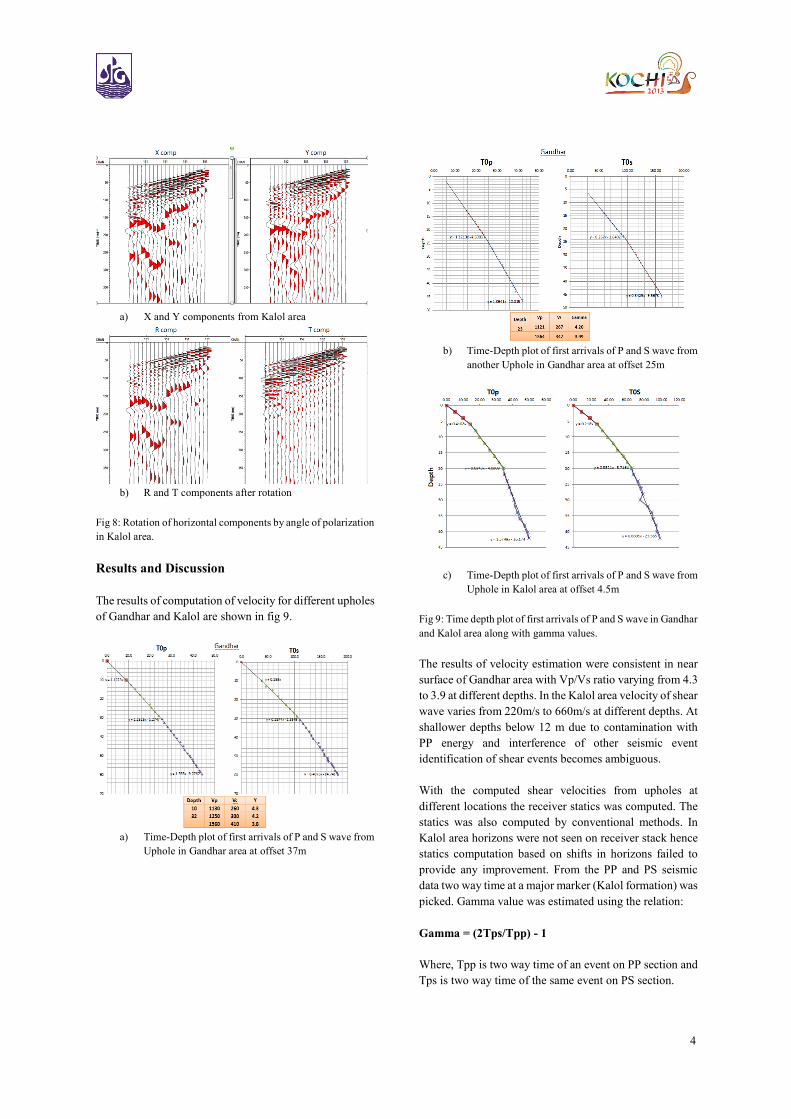
a) X and Y components from Kalol area
b) R and T components after rotation
Fig 8: Rotation of horizontal components by angle of polarization
in Kalol area.
Results and Discussion
The results of computation of velocity for different upholes
of Gandhar and Kalol are shown in fig 9.
a) Time-Depth plot of first arrivals of P and S wave from
Uphole in Gandhar area at offset 37m
b) Time-Depth plot of first arrivals of P and S wave from
another Uphole in Gandhar area at offset 25m
c) Time-Depth plot of first arrivals of P and S wave from
Uphole in Kalol area at offset 4.5m
Fig 9: Time depth plot of first arrivals of P and S wave in Gandhar
and Kalol area along with gamma values.
The results of velocity estimation were consistent in near
surface of Gandhar area with Vp/Vs ratio varying from 4.3
to 3.9 at different depths. In the Kalol area velocity of shear
wave varies from 220m/s to 660m/s at different depths. At
shallower depths below 12 m due to contamination with
PP energy and interference of other seismic event
identification of shear events becomes ambiguous.
With the computed shear velocities from upholes at
different locations the receiver statics was computed. The
statics was also computed by conventional methods. In
Kalol area horizons were not seen on receiver stack hence
statics computation based on shifts in horizons failed to
provide any improvement. From the PP and PS seismic
data two way time at a major marker (Kalol formation) was
picked. Gamma value was estimated using the relation:
Gamma = (2Tps/Tpp) - 1
Where, Tpp is two way time of an event on PP section and
Tps is two way time of the same event on PS section.
5
Receiver statics for PS data was computed by scaling the
PP receiver statics by this average gamma value and
applied to the data.
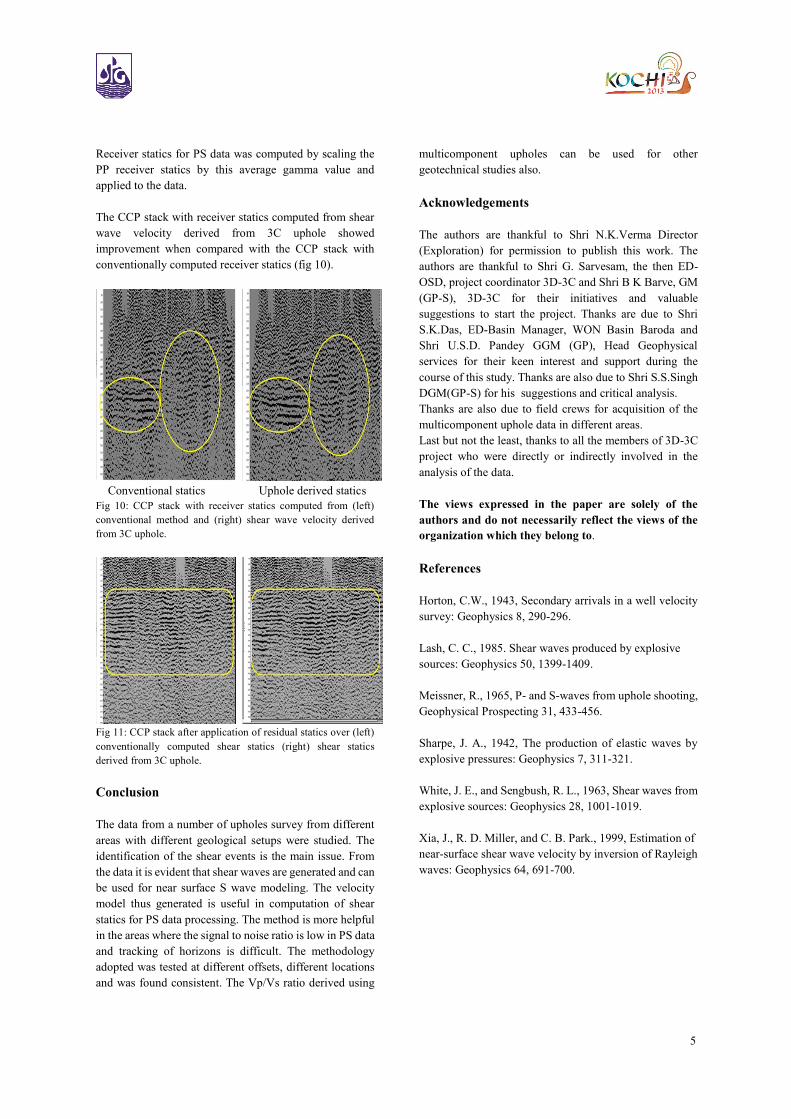
The CCP stack with receiver statics computed from shear
wave velocity derived from 3C uphole showed
improvement when compared with the CCP stack with
conventionally computed receiver statics (fig 10).
Conventional statics Uphole derived statics
Fig 10: CCP stack with receiver statics computed from (left)
conventional method and (right) shear wave velocity derived
from 3C uphole.
Fig 11: CCP stack after application of residual statics over (left)
conventionally computed shear statics (right) shear statics
derived from 3C uphole.
Conclusion
The data from a number of upholes survey from different
areas with different geological setups were studied. The
identification of the shear events is the main issue. From
the data it is evident that shear waves are generated and can
be used for near surface S wave modeling. The velocity
model thus generated is useful in computation of shear
statics for PS data processing. The method is more helpful
in the areas where the signal to noise ratio is low in PS data
and tracking of horizons is difficult. The methodology
adopted was tested at different offsets, different locations
and was found consistent. The Vp/Vs ratio derived using
multicomponent upholes can be used for other
geotechnical studies also.
Acknowledgements
The authors are thankful to Shri N.K.Verma Director
(Exploration) for permission to publish this work. The
authors are thankful to Shri G. Sarvesam, the then ED-
OSD, project coordinator 3D-3C and Shri B K Barve, GM
(GP-S), 3D-3C for their initiatives and valuable
suggestions to start the project. Thanks are due to Shri
S.K.Das, ED-Basin Manager, WON Basin Baroda and
Shri U.S.D. Pandey GGM (GP), Head Geophysical
services for their keen interest and support during the
course of this study. Thanks are also due to Shri S.S.Singh
DGM(GP-S) for his suggestions and critical analysis.
Thanks are also due to field crews for acquisition of the
multicomponent uphole data in different areas.
Last but not the least, thanks to all the members of 3D-3C
project who were directly or indirectly involved in the
analysis of the data.
The views expressed in the paper are solely of the
authors and do not necessarily reflect the views of the
organization which they belong to.
References
Horton, C.W., 1943, Secondary arrivals in a well velocity
survey: Geophysics 8, 290-296.
Lash, C. C., 1985. Shear waves produced by explosive
sources: Geophysics 50, 1399-1409.
Meissner, R., 1965, P- and S-waves from uphole shooting,
Geophysical Prospecting 31, 433-456.
Sharpe, J. A., 1942, The production of elastic waves by
explosive pressures: Geophysics 7, 311-321.
White, J. E., and Sengbush, R. L., 1963, Shear waves from
explosive sources: Geophysics 28, 1001-1019.
Xia, J., R. D. Miller, and C. B. Park., 1999, Estimation of
near-surface shear wave velocity by inversion of Rayleigh
waves: Geophysics 64, 691-700.