Embed Size (px)
Citation preview
E s t r a v E l I a n n u a l r E p o r t 2 0 1 3

Es
tr
av
El
I
an
nu
al
rE
po
rt
20
13
2
addrEss by thE managIng dIrEctor 3
managEmEnt rEportFInancIal hIghlIghts oF EstravEl as 5
summarIsEd salEs oF EstravEl group 6
salEs brEaKdoWn by product 7
pacKagE tour salEs by opErator 7
FErry tIcKEt salEs by carrIEr 7
salEs by gEographIcal arEas 8
salEs brEaKdoWn by customEr group 8
FInancIal statEmEntbalancE shEEt 9
IncomE statEmEnt 11
statEmEnt oF comprEhEnsIvE IncomE 11
statEmEnt oF cash FloWs 12
rEcEIvablEs and prEpaymEnts 14
tradE rEcEIvablEs 14
alloWancE For doubtFul rEcEIvablEs 15
prEpaId taxEs and taxEs payablE 16
othEr rEcEIvablEs 17
InvEstmEnts In subsIdIarIEs 18
payablEs and advancEs rEcEIvEd 19
audItors’ rEport 20
Es
tr
av
El
I
an
nu
al
rE
po
rt
20
13
3
2013 can be considered a successful year in every way for Estravel. despite competition growing ever more fierce we managed to achieve all of our main goals. the year was a busy one, but also celebratory, as we ran several events and campaigns to mark our 25th anniversary.
Estravel received three awards in 2013 of which we are very proud. the Estonian chamber of commerce and Industry and the Estonian Employers confederation compiled the Estonian companies com-petitiveness ranking, based on which Estravel was awarded the title of most competitive travel agency in 2013. In a study conducted by cv-Keskus, Estravel was named one of the most valued employers in the country, and we were also the only travel company in the top ten. Finally, the supervisory board of the Estonian business school awarded anne samlik, the managing director of Estravel, with the title of business manager of the year.
2013 was a success for us in financial terms, too. We boosted our posi-tion as the largest travel agency in Estonia and increased our turnover and sales revenue. our technical sales turnover increased by nearly 12% compared to last year, reaching 64.7 million euros. our sales rev-enue increased at the same time to more than 6.7 million euros, which represents nearly 3% growth. our net profit was, however, 0.9 million euros, which is slightly less than last year.
among all client groups on Estonian market sales to private customers grew most in 2013, increasing by 7.4% compared to the previous year.
dear reader,
Venice
Es
tr
av
El
I
an
nu
al
rE
po
rt
20
13
4
previous favourite destinations turkey, greece and the canary Islands gained even more popularity. the numbers of people travelling to thailand and the united arab Emirates has also grown, as visiting these places is now easier thanks to simplified visa conditions. In terms of products sold, plane ticket and accommodation sales pro-vided the greatest turnover. as a trend we can highlight sales via elec-tronic channels, since the largest increase occurred in online sales of travel services. this is not particularly surprising, as similar trends can be seen in nearly all areas. Implementing a variety of convenient new e-solutions cemented Estravel’s success.
as a successful company, we continued supporting many undertak-ings and organisations in Estonia in 2013. probably the most notable of these was our sponsorship partnership with the Estonian olympic committee. Estravel was also the official Estonian vendor for tickets to the sochi Winter olympics, which meant that we were responsible for taking care of Estonian tourists’ wellbeing in sochi, which struggled with minor issues here and there.
We also supported several charity projects, such as the sinilill support centre for children with special needs, the Estonian national sympho-ny orchestra and the get-together of the Friends of Estonia club, and helped out a number of student organisations in arranging trips abroad.
at the end of 2013 Estravel employed 139 people in Estonia, making it the largest employer in the field of tourism services in the country. In addi-tion, we have 17 employees in latvia and 25 employees in the subsidiary uab Estravel vilnius in lithuania. the company has 11 offices in seven Estonian towns and cities and three offices in the other baltic states.
all of our achievements in 2013 were the result of years of hard work by the Estravel team. We are fully committed to providing our clients in Estonia and our neighbouring countries with the best possible trav-el service.
thank you, dear clients, for recognising our efforts and entrusting us with your purchases and orders!
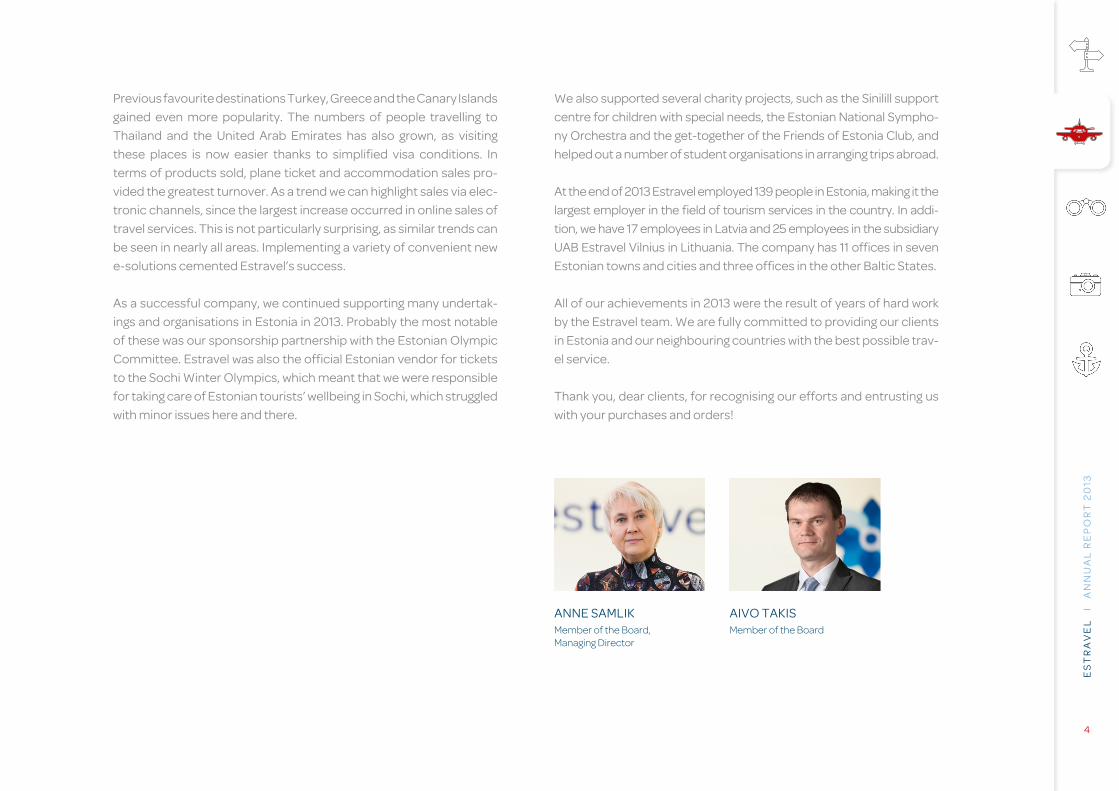
aIvo taKIsMember of the Board
annE samlIKMember of the Board, Managing Director
Es
tr
av
El
I
an
nu
al
rE
po
rt
20
13
5
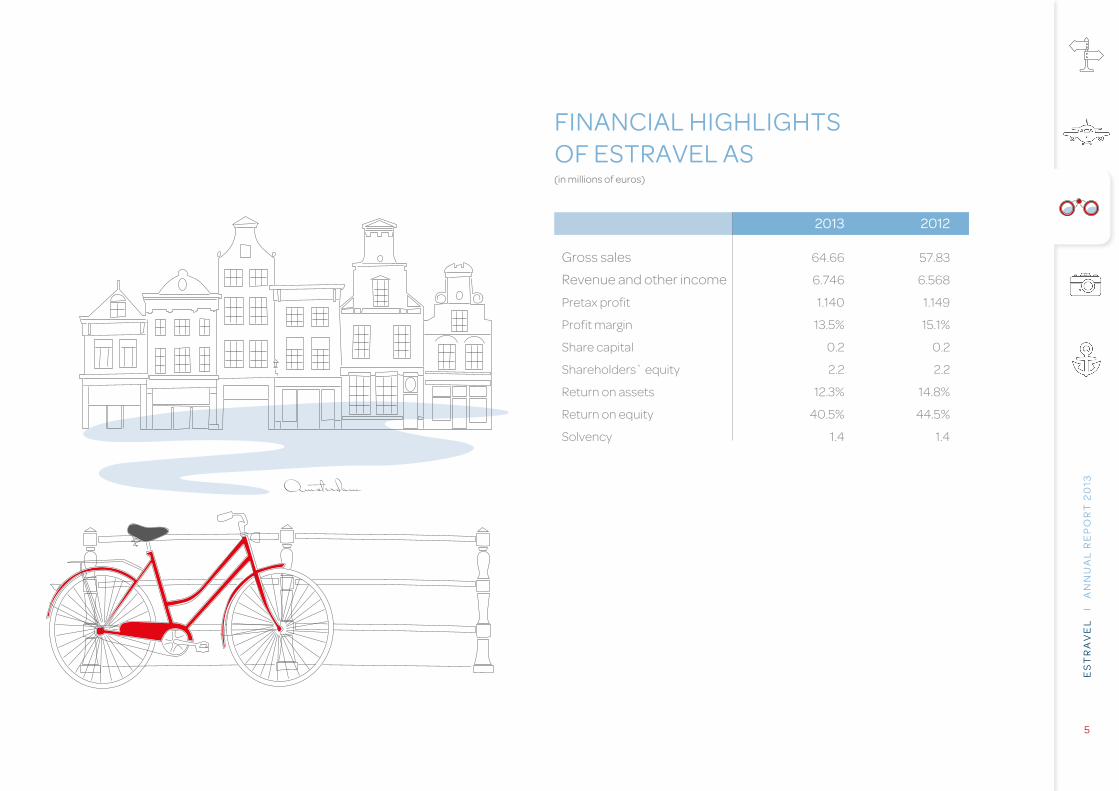
FInancIal hIghlIghtsoF EstravEl as(in millions of euros)
2013 2012
Gross sales 64.66 57.83
Revenue and other income 6.746 6.568
Pretax profit 1.140 1.149
Profit margin 13.5% 15.1%
Share capital 0.2 0.2
Shareholders` equity 2.2 2.2
Return on assets 12.3% 14.8%
Return on equity 40.5% 44.5%
Solvency 1.4 1.4
Amsterdam
Es
tr
av
El
I
an
nu
al
rE
po
rt
20
13
6
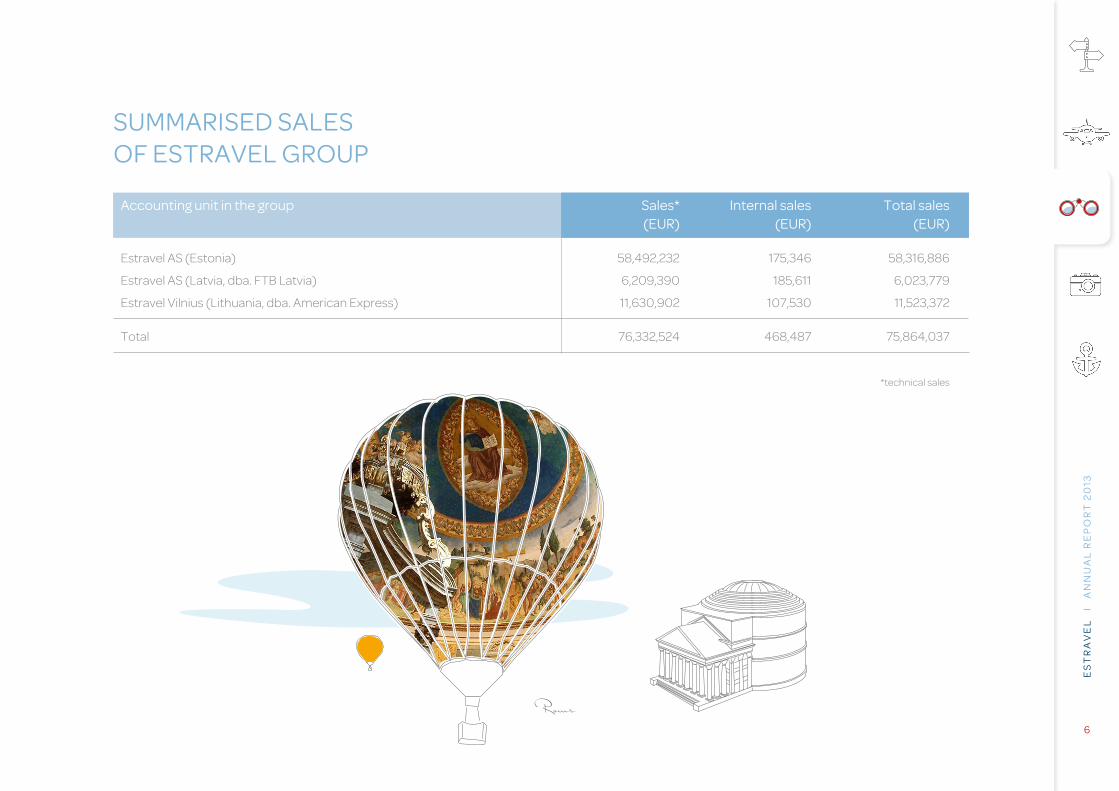
summarIsEd salEsoF EstravEl group
accounting unit in the group sales* Internal sales total sales (Eur) (Eur) (Eur)
Estravel AS (Estonia) 58,492,232 175,346 58,316,886
Estravel AS (Latvia, dba. FTB Latvia) 6,209,390 185,611 6,023,779
Estravel Vilnius (Lithuania, dba. American Express) 11,630,902 107,530 11,523,372
Total 76,332,524 468,487 75,864,037
*technical sales
Rome
Es
tr
av
El
I
an
nu
al
rE
po
rt
20
13
7
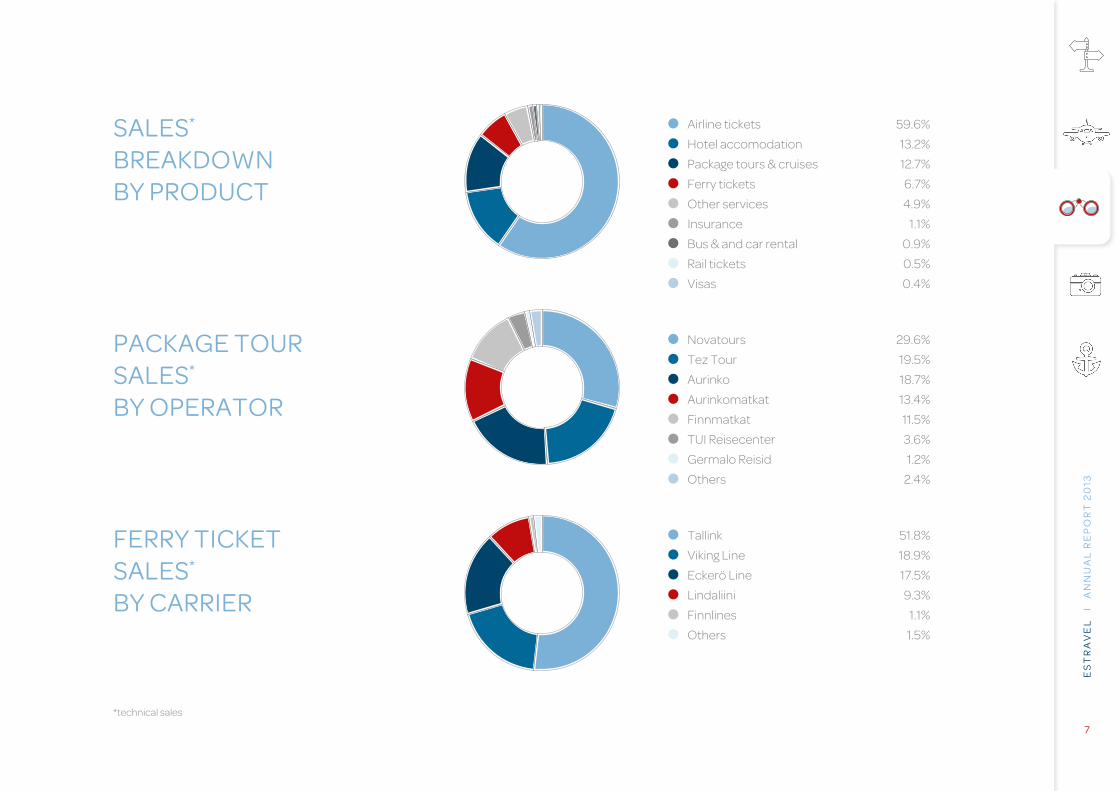
salEs*
brEaKdoWnby product
pacKagE toursalEs*
by opErator
FErry tIcKEtsalEs*
by carrIEr
Airline tickets 59.6%
Hotel accomodation 13.2%
Package tours & cruises 12.7%
Ferry tickets 6.7%
Other services 4.9%
Insurance 1.1%
Bus & and car rental 0.9%
Rail tickets 0.5%
Visas 0.4%
Novatours 29.6%
Tez Tour 19.5%
Aurinko 18.7%
Aurinkomatkat 13.4%
Finnmatkat 11.5%
TUI Reisecenter 3.6%
Germalo Reisid 1.2%
Others 2.4%
Tallink 51.8%
Viking Line 18.9%
Eckerö Line 17.5%
Lindaliini 9.3%
Finnlines 1.1%
Others 1.5%
*technical sales
Es
tr
av
El
I
an
nu
al
rE
po
rt
20
13
8
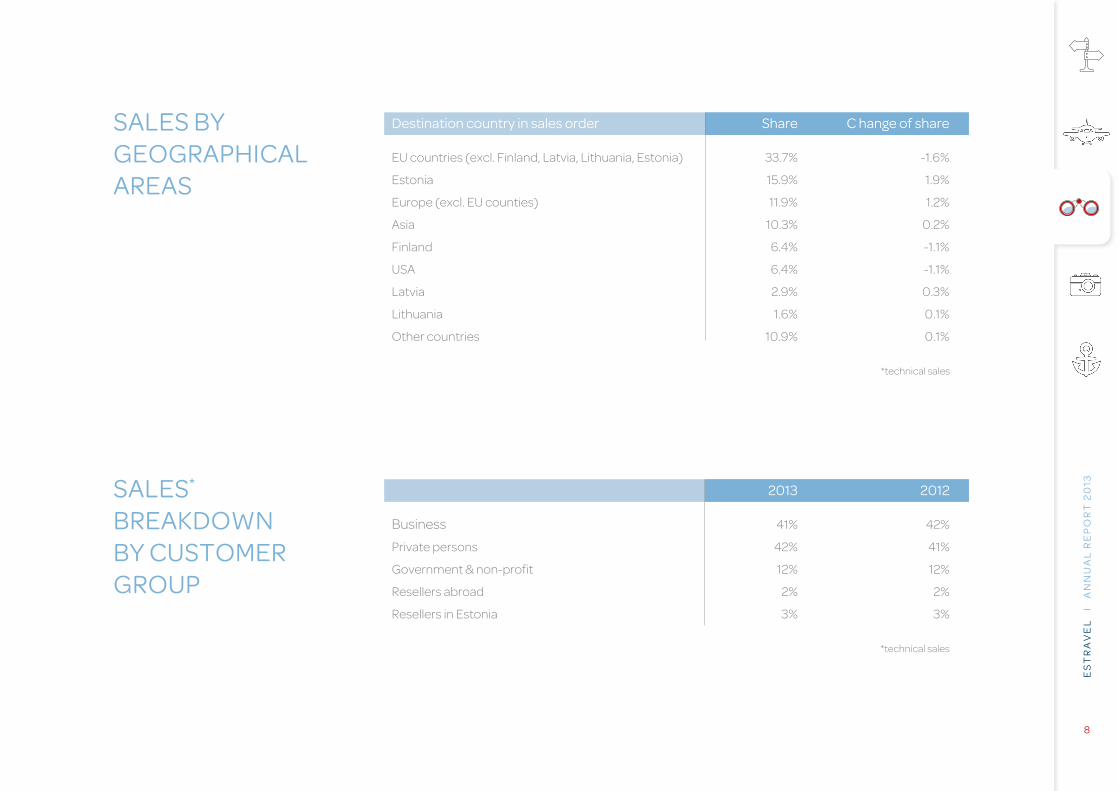
salEs bygEographIcalarEas
destination country in sales order share c hange of share
EU countries (excl. Finland, Latvia, Lithuania, Estonia) 33.7% -1.6%
Estonia 15.9% 1.9%
Europe (excl. EU counties) 11.9% 1.2%
Asia 10.3% 0.2%
Finland 6.4% -1.1%
USA 6.4% -1.1%
Latvia 2.9% 0.3%
Lithuania 1.6% 0.1%
Other countries 10.9% 0.1%
*technical sales
salEs*
brEaKdoWnby customEr group
2013 2012
Business 41% 42%
Private persons 42% 41%
Government & non-profit 12% 12%
Resellers abroad 2% 2%
Resellers in Estonia 3% 3%
*technical sales
Es
tr
av
El
I
an
nu
al
rE
po
rt
20
13
9
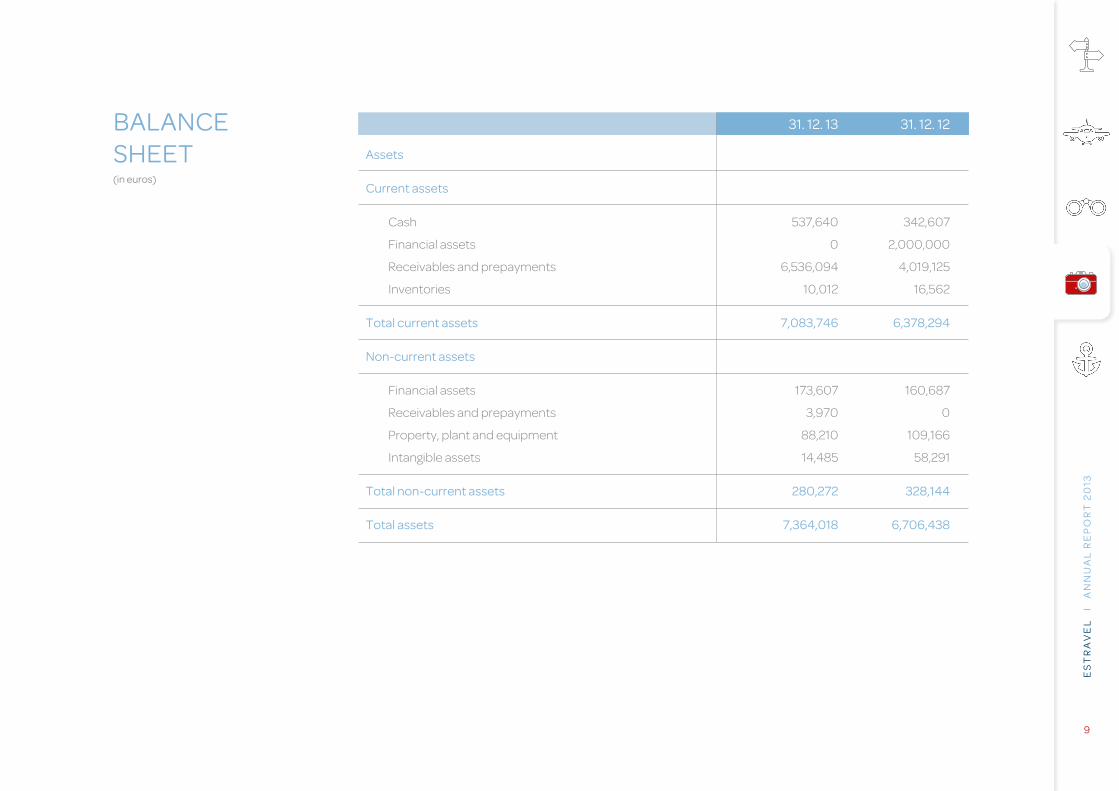
balancEshEEt(in euros)
31. 12. 13 31. 12. 12
assets
current assets
Cash 537,640 342,607
Financial assets 0 2,000,000
Receivables and prepayments 6,536,094 4,019,125
Inventories 10,012 16,562
total current assets 7,083,746 6,378,294
non-current assets
Financial assets 173,607 160,687
Receivables and prepayments 3,970 0
Property, plant and equipment 88,210 109,166
Intangible assets 14,485 58,291
total non-current assets 280,272 328,144
total assets 7,364,018 6,706,438
Es
tr
av
El
I
an
nu
al
rE
po
rt
20
13
1 0
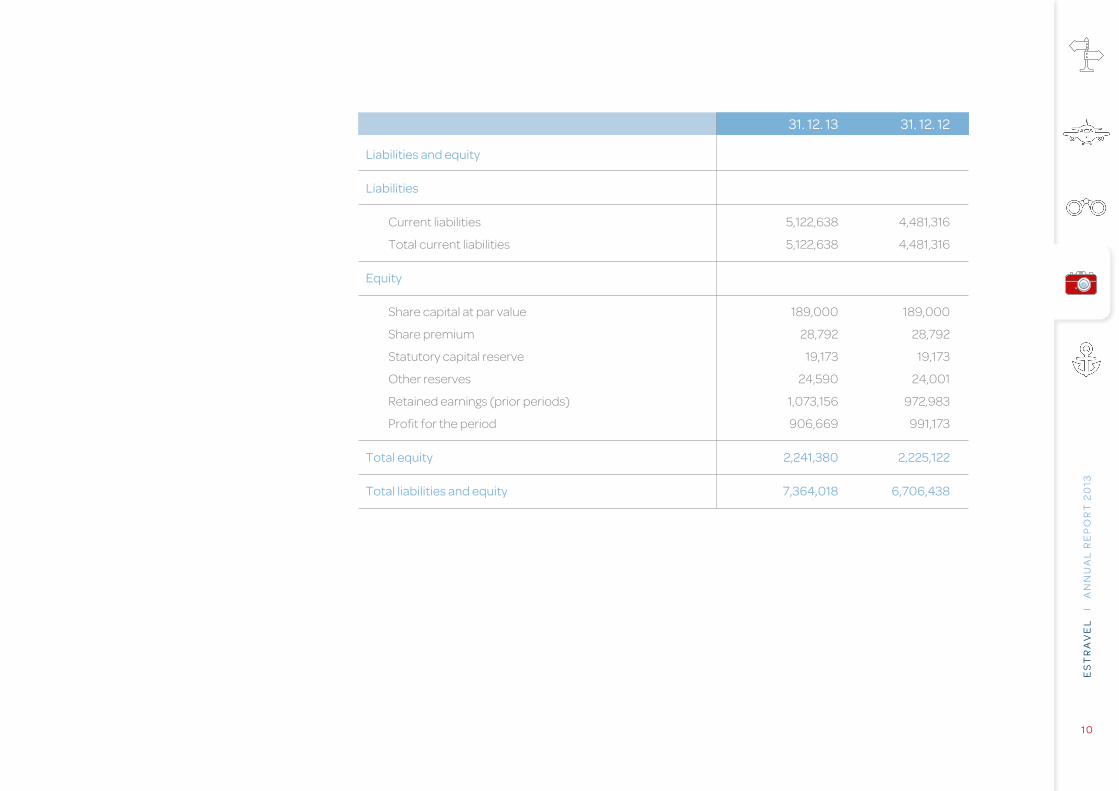
31. 12. 13 31. 12. 12
liabilities and equity
liabilities
Current liabilities 5,122,638 4,481,316
Total current liabilities 5,122,638 4,481,316
Equity
Share capital at par value 189,000 189,000
Share premium 28,792 28,792
Statutory capital reserve 19,173 19,173
Other reserves 24,590 24,001
Retained earnings (prior periods) 1,073,156 972,983
Profit for the period 906,669 991,173
total equity 2,241,380 2,225,122
total liabilities and equity 7,364,018 6,706,438
Es
tr
av
El
I
an
nu
al
rE
po
rt
20
13
1 1
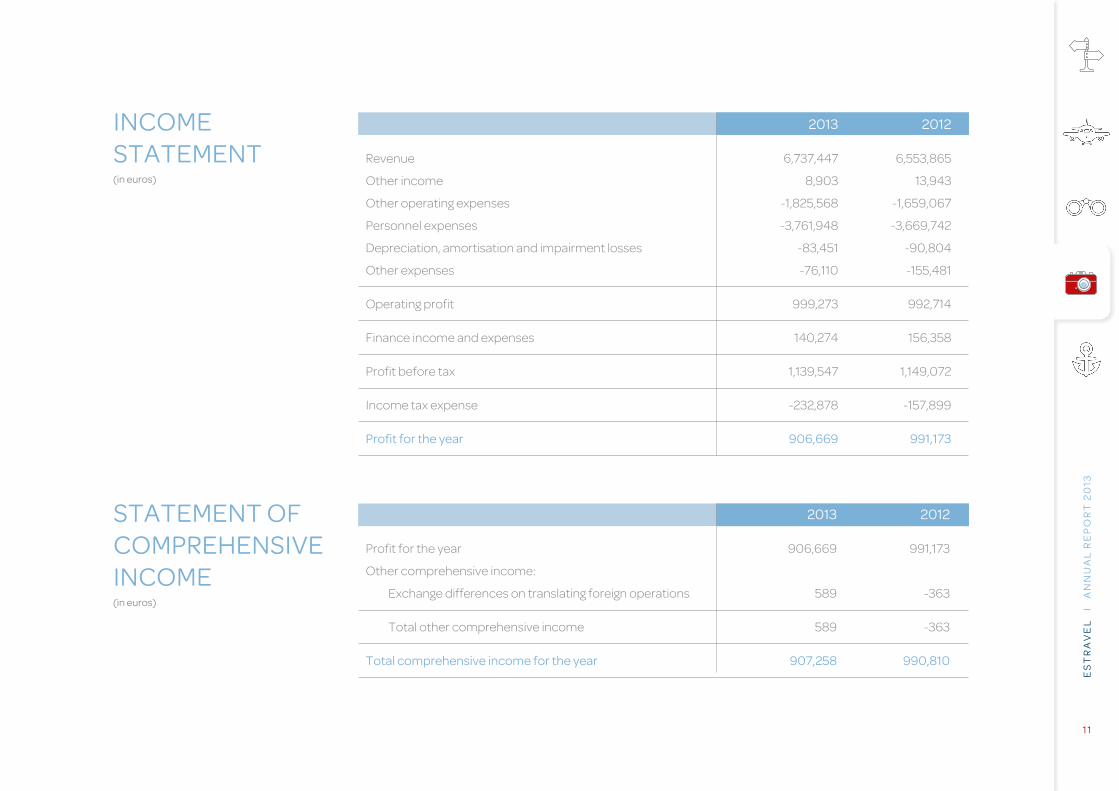
IncomEstatEmEnt(in euros)
2013 2012
Revenue 6,737,447 6,553,865
Other income 8,903 13,943
Other operating expenses -1,825,568 -1,659,067
Personnel expenses -3,761,948 -3,669,742
Depreciation, amortisation and impairment losses -83,451 -90,804
Other expenses -76,110 -155,481
Operating profit 999,273 992,714
Finance income and expenses 140,274 156,358
Profit before tax 1,139,547 1,149,072
Income tax expense -232,878 -157,899
profit for the year 906,669 991,173
statEmEnt oFcomprEhEnsIvEIncomE(in euros)
2013 2012
Profit for the year 906,669 991,173
Other comprehensive income:
Exchange differences on translating foreign operations 589 -363
Total other comprehensive income 589 -363
total comprehensive income for the year 907,258 990,810
Es
tr
av
El
I
an
nu
al
rE
po
rt
20
13
1 2
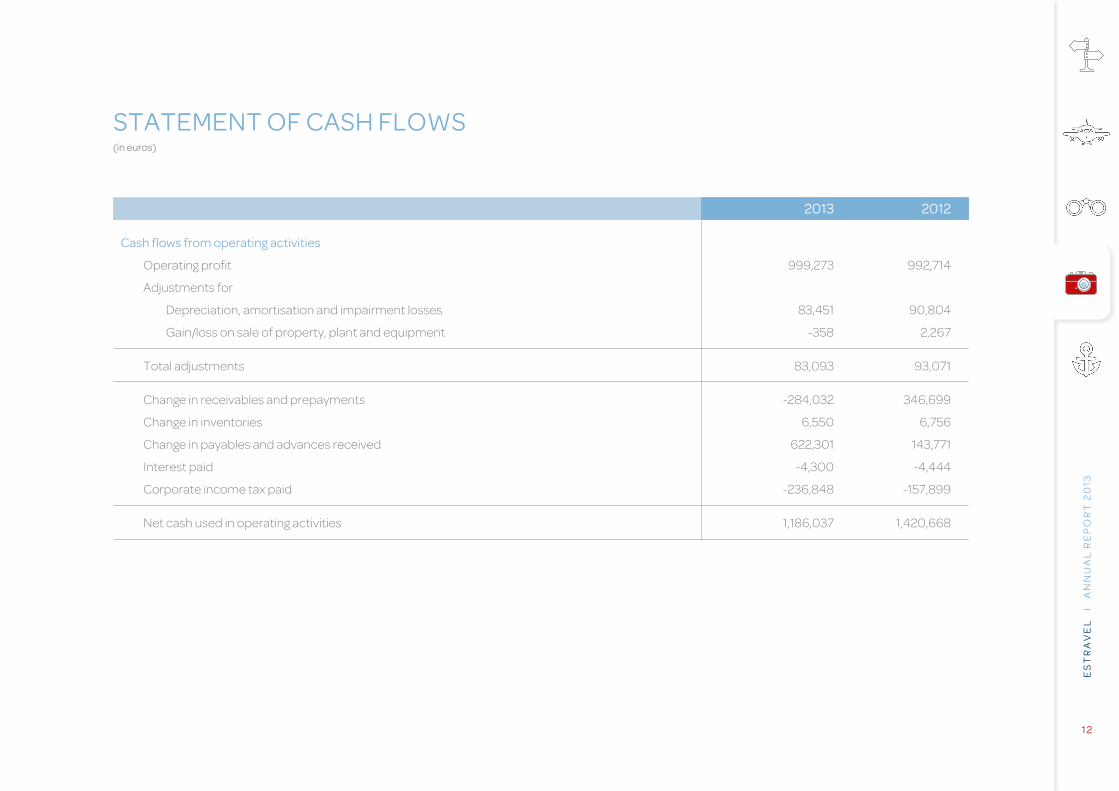
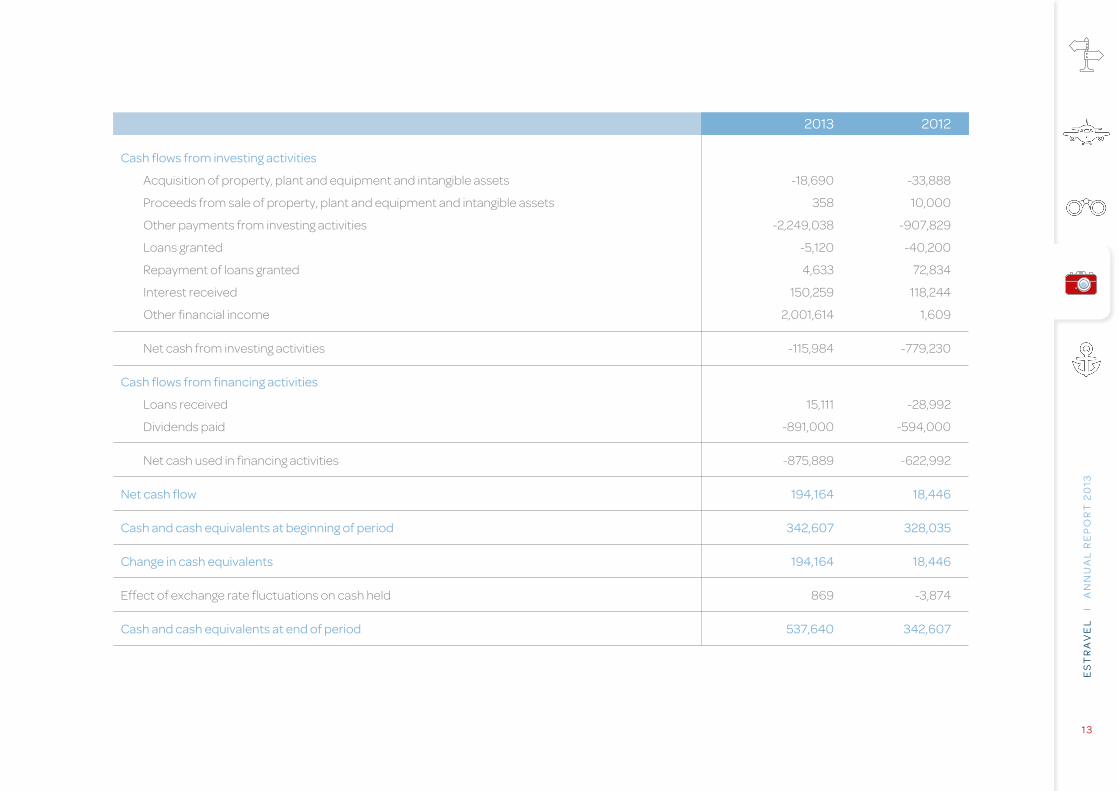
statEmEnt oF cash FloWs(in euros)
2013 2012
cash flows from operating activities
Operating profit 999,273 992,714
Adjustments for
Depreciation, amortisation and impairment losses 83,451 90,804
Gain/loss on sale of property, plant and equipment -358 2,267
Total adjustments 83,093 93,071
Change in receivables and prepayments -284,032 346,699
Change in inventories 6,550 6,756
Change in payables and advances received 622,301 143,771
Interest paid -4,300 -4,444
Corporate income tax paid -236,848 -157,899
Net cash used in operating activities 1,186,037 1,420,668
Es
tr
av
El
I
an
nu
al
rE
po
rt
20
13
1 3
2013 2012
cash flows from investing activities
Acquisition of property, plant and equipment and intangible assets -18,690 -33,888
Proceeds from sale of property, plant and equipment and intangible assets 358 10,000
Other payments from investing activities -2,249,038 -907,829
Loans granted -5,120 -40,200
Repayment of loans granted 4,633 72,834
Interest received 150,259 118,244
Other financial income 2,001,614 1,609
Net cash from investing activities -115,984 -779,230
cash flows from financing activities
Loans received 15,111 -28,992
Dividends paid -891,000 -594,000
Net cash used in financing activities -875,889 -622,992
net cash flow 194,164 18,446
cash and cash equivalents at beginning of period 342,607 328,035
change in cash equivalents 194,164 18,446
Effect of exchange rate fluctuations on cash held 869 -3,874
cash and cash equivalents at end of period 537,640 342,607
Es
tr
av
El
I
an
nu
al
rE
po
rt
20
13
1 4
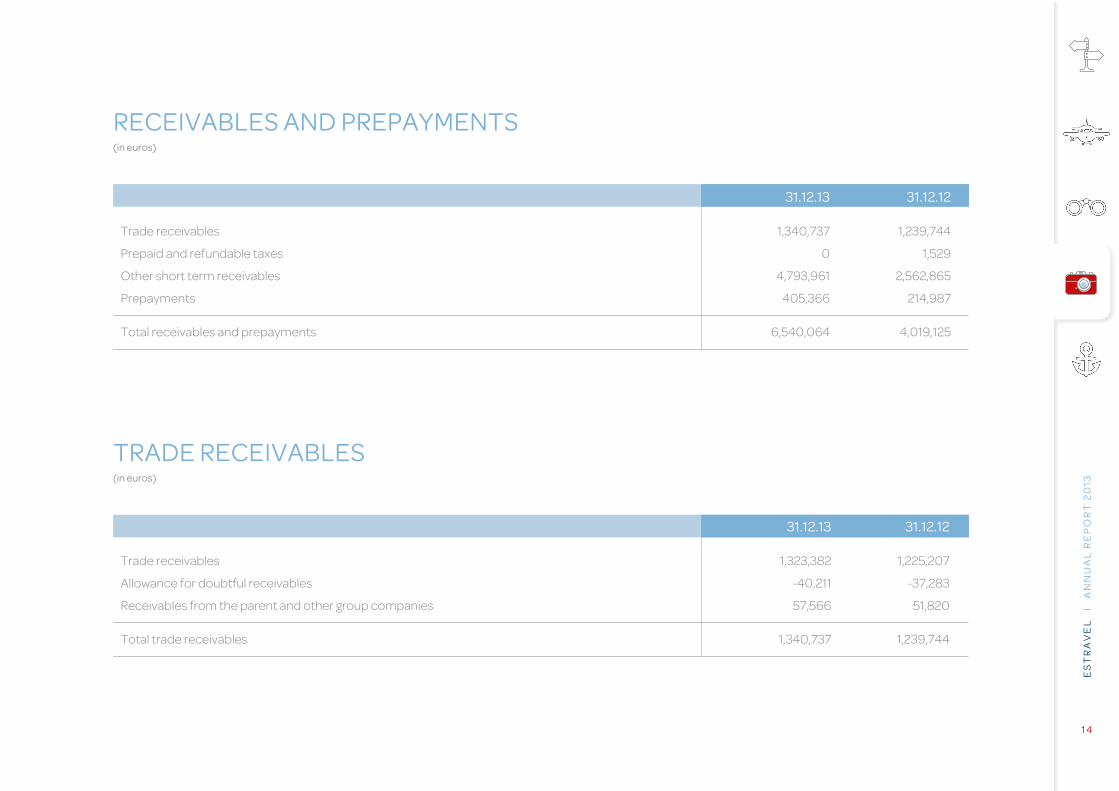
rEcEIvablEs and prEpaymEnts(in euros)
31.12.13 31.12.12
Trade receivables 1,340,737 1,239,744
Prepaid and refundable taxes 0 1,529
Other short term receivables 4,793,961 2,562,865
Prepayments 405,366 214,987
Total receivables and prepayments 6,540,064 4,019,125
tradE rEcEIvablEs(in euros)
31.12.13 31.12.12
Trade receivables 1,323,382 1,225,207
Allowance for doubtful receivables -40,211 -37,283
Receivables from the parent and other group companies 57,566 51,820
Total trade receivables 1,340,737 1,239,744
Es
tr
av
El
I
an
nu
al
rE
po
rt
20
13
1 5
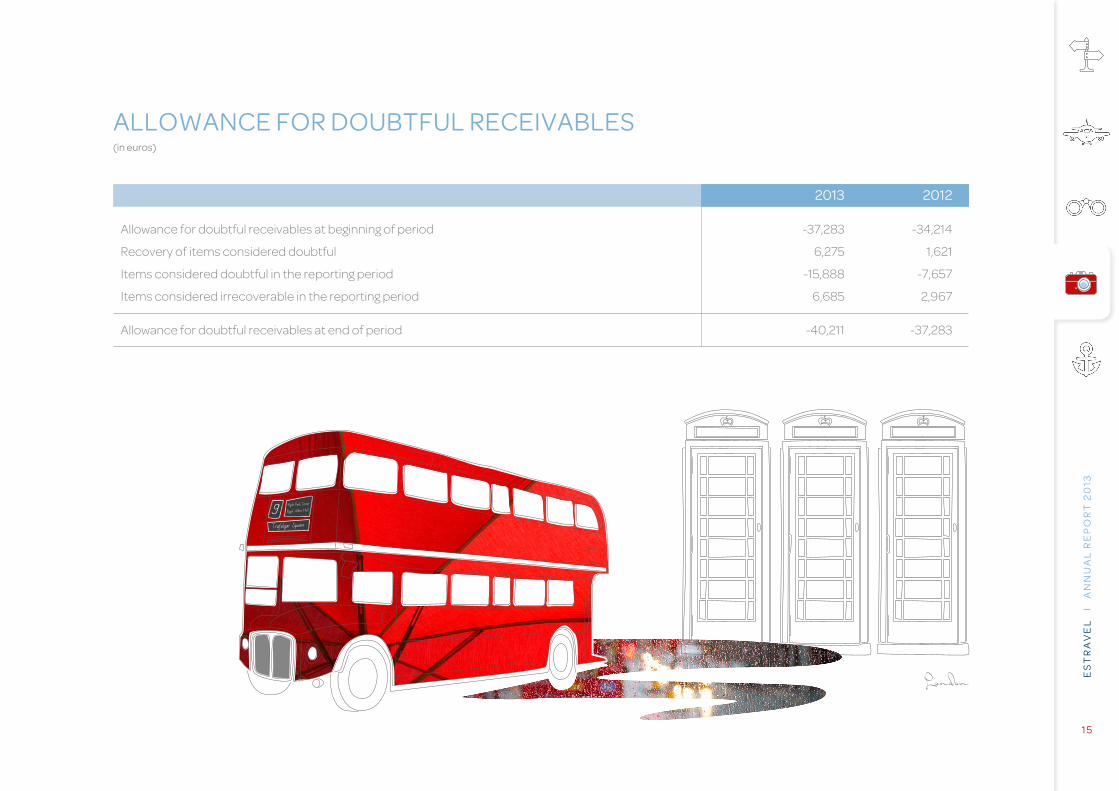
alloWancE For doubtFul rEcEIvablEs(in euros)
2013 2012
Allowance for doubtful receivables at beginning of period -37,283 -34,214
Recovery of items considered doubtful 6,275 1,621
Items considered doubtful in the reporting period -15,888 -7,657
Items considered irrecoverable in the reporting period 6,685 2,967
Allowance for doubtful receivables at end of period -40,211 -37,283
London
9 Hyde Park Corner
Royal Albert Hall
Trafalgar Square
Es
tr
av
El
I
an
nu
al
rE
po
rt
20
13
1 6
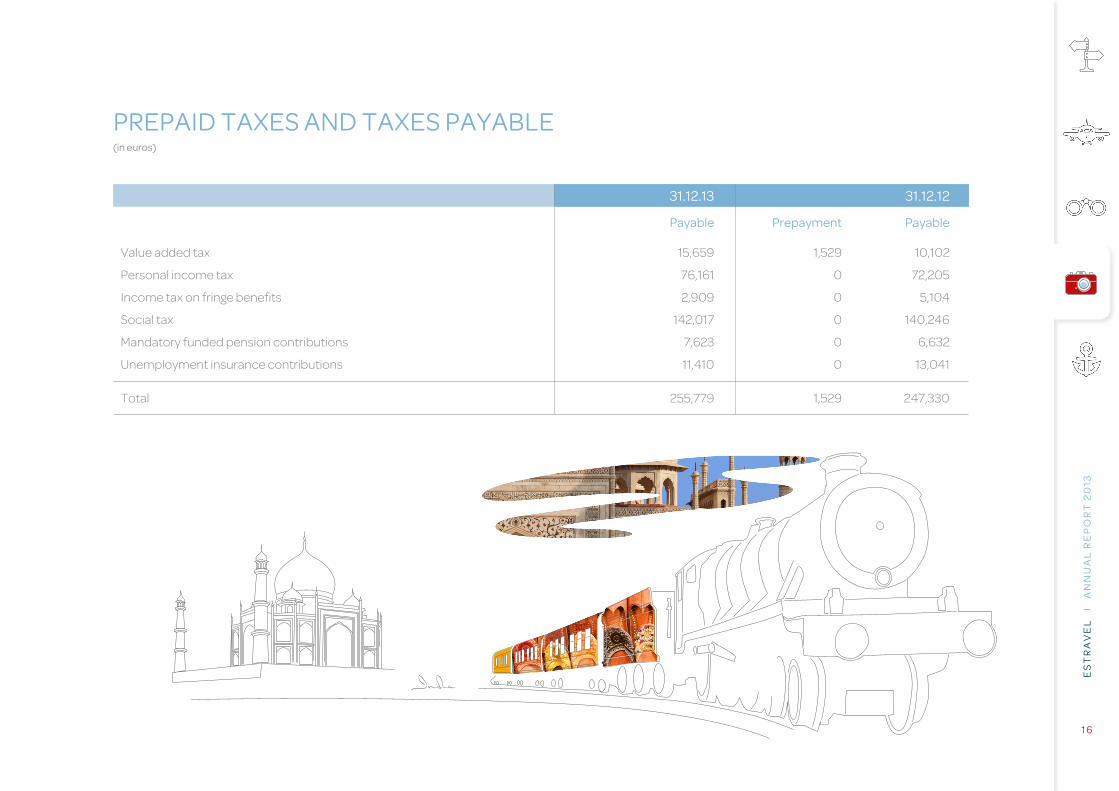
prEpaId taxEs and taxEs payablE(in euros)
31.12.13 31.12.12
payable prepayment payable
Value added tax 15,659 1,529 10,102
Personal income tax 76,161 0 72,205
Income tax on fringe benefits 2,909 0 5,104
Social tax 142,017 0 140,246
Mandatory funded pension contributions 7,623 0 6,632
Unemployment insurance contributions 11,410 0 13,041
Total 255,779 1,529 247,330
India
Es
tr
av
El
I
an
nu
al
rE
po
rt
20
13
1 7
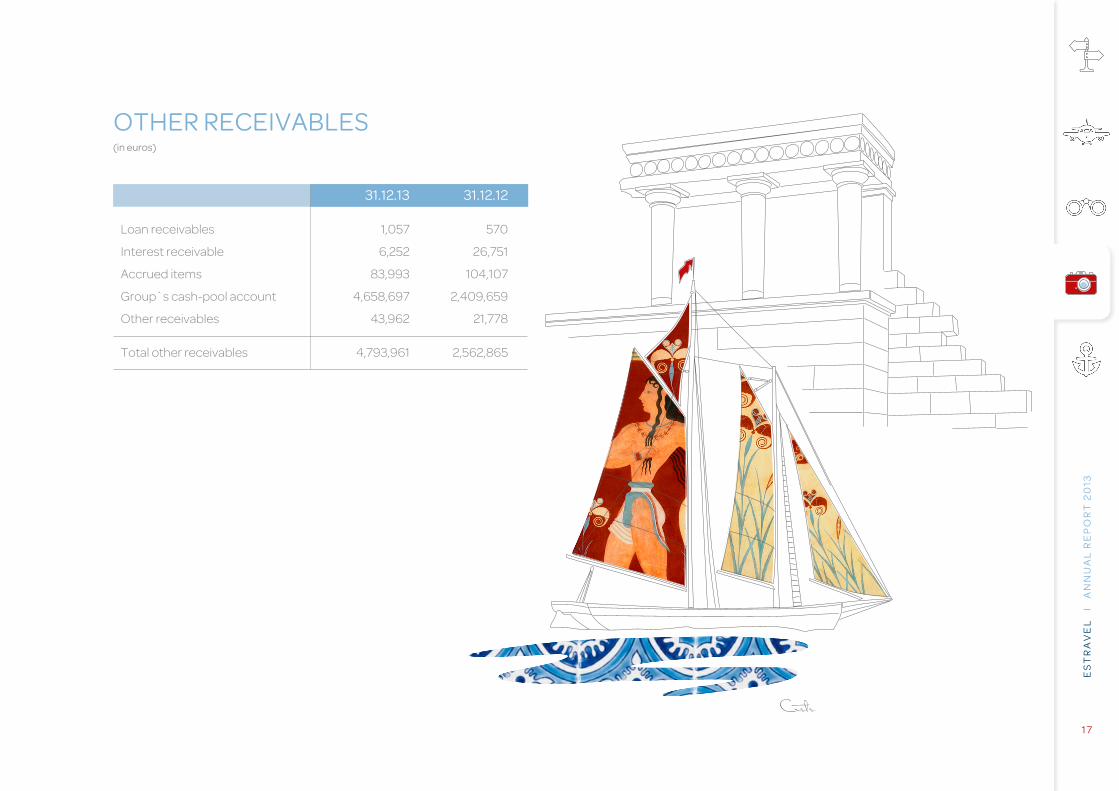
othEr rEcEIvablEs(in euros)
31.12.13 31.12.12
Loan receivables 1,057 570
Interest receivable 6,252 26,751
Accrued items 83,993 104,107
Group`s cash-pool account 4,658,697 2,409,659
Other receivables 43,962 21,778
Total other receivables 4,793,961 2,562,865
Crete
Es
tr
av
El
I
an
nu
al
rE
po
rt
20
13
1 8
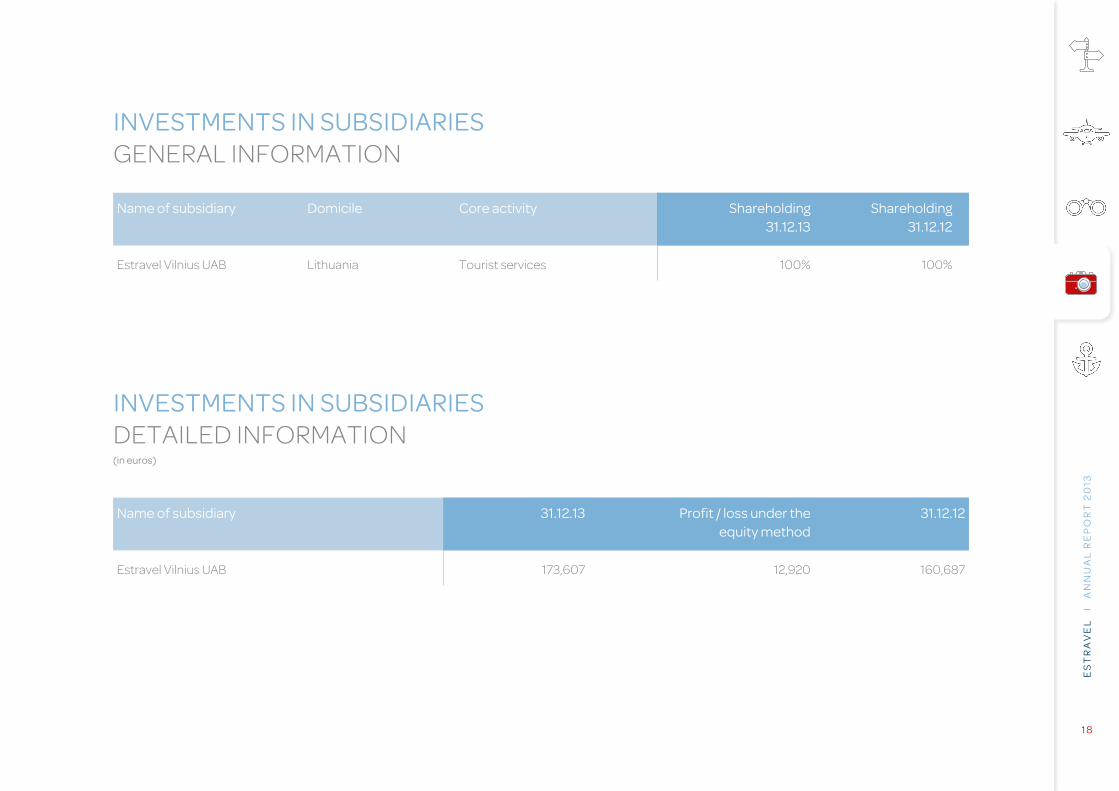
InvEstmEnts In subsIdIarIEsGENERAL INFORMATION
name of subsidiary domicile core activity shareholding shareholding 31.12.13 31.12.12
Estravel Vilnius UAB Lithuania Tourist services 100% 100%
InvEstmEnts In subsIdIarIEsDETAILED INFORMATION(in euros)
name of subsidiary 31.12.13 profit / loss under the 31.12.12 equity method
Estravel Vilnius UAB 173,607 12,920 160,687
Es
tr
av
El
I
an
nu
al
rE
po
rt
20
13
1 9
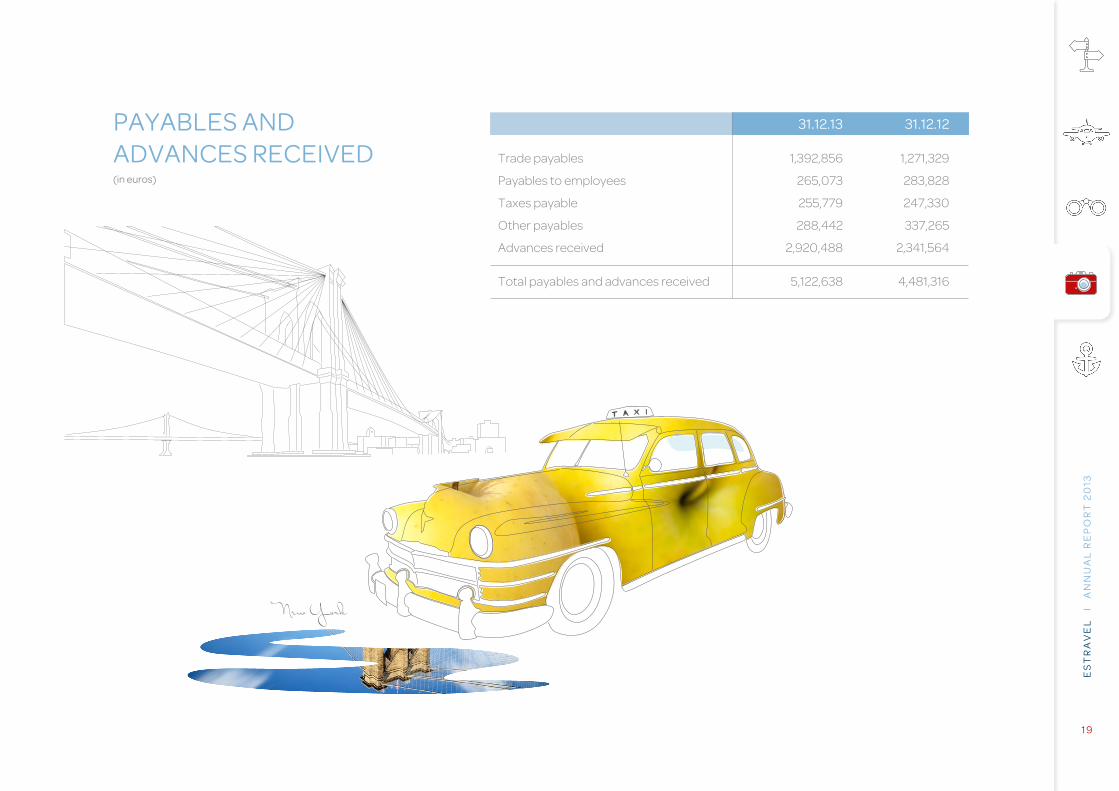
payablEs andadvancEs rEcEIvEd(in euros)
31.12.13 31.12.12
Trade payables 1,392,856 1,271,329
Payables to employees 265,073 283,828
Taxes payable 255,779 247,330
Other payables 288,442 337,265
Advances received 2,920,488 2,341,564
Total payables and advances received 5,122,638 4,481,316
New York

Es
tr
av
El
I
an
nu
al
rE
po
rt
20
13
2 0