Embed Size (px)
Citation preview

7/28/2019 Estudio California CEC 700 2007 008 CMF
http://slidepdf.com/reader/full/estudio-california-cec-700-2007-008-cmf 1/165
CALIFORNIA
ENERGY
COMMISSION
CALIFORNIA GUIDELINES FOR REDUCING
IMPACTS TO BIRDS AND BATS FROM
WIND ENERGY DEVELOPMENT
C O M M I S S I O N
F I N A
L R E P O R T
October 2007
CEC-700-2007-008-CMF

7/28/2019 Estudio California CEC 700 2007 008 CMF
http://slidepdf.com/reader/full/estudio-california-cec-700-2007-008-cmf 2/165

7/28/2019 Estudio California CEC 700 2007 008 CMF
http://slidepdf.com/reader/full/estudio-california-cec-700-2007-008-cmf 3/165
CALIFORNIA
ENERGY COMMISSION
CALIFORNIA
DEPARTMENT OF
FISH AND GAME
RENEWABLES
COMMITTEE
John L. Geesman
Commissioner and Presiding Member
Richard L. Anderson
Susan D. Sanders
Principal Authors Scott A. Flint
David Sterner
Principal Authors
Jackalyne Pfannenstiel
Chairman and Associate Member
N. Misa Ward
Rick York
Project Managers Joseph A. Vincenty Project Manager
John Mathias
Project Coordinator Carolyn Walker
Editor
Paul Richins
Manager ENVIRONMENTAL OFFICE
Kevin Hunting
Branch Chief HABITAT CONSERVATION BRANCH
Terrence O’Brien
Deputy Director ENERGY FACILITIES SITING DIVISION
Sonke Mastrup
Deputy Director RESOURCES MANAGEMENT AND POLICY DIVISION
B. B. Blevins
Executive Director
John McCamman
Acting Director
7/28/2019 Estudio California CEC 700 2007 008 CMF
http://slidepdf.com/reader/full/estudio-california-cec-700-2007-008-cmf 4/165
DISCLAIMER The Energy Commission, Department of Fish and Game, the State of California, its employees,
contractors, and subcontractors make no warrant, express or implied, and assume no legal liability for
the information in this report; nor does any party represent that the uses of this information will not
infringe upon privately owned rights. This report has been approved by the California Energy
Commission and endorsed by the California Department of Fish and Game as voluntary guidance. The
recommendations and protocols discussed in this report are intended to be suggestions for local
permitting agencies to use at their discretion. These guidelines are strictly voluntary and are not
intended to implement, replace, duplicate, interpret, amend, or supplement any current statute or
regulation. Adherence to these guidelines does not ensure compliance with any local, state, or federal
statute
or
regulation
nor
does
failure
to
follow
these
guidelines
necessarily
imply
a
violation
of
CEQA.

7/28/2019 Estudio California CEC 700 2007 008 CMF
http://slidepdf.com/reader/full/estudio-california-cec-700-2007-008-cmf 5/165
ABSTRACTThese voluntary guidelines provide information to help reduce impacts to birds and bats
from new development or repowering of wind energy projects in California. They
include recommendations on preliminary screening of proposed wind energy project
sites; pre‐permitting study design and methods; assessing direct, indirect, and
cumulative impacts to birds and bats in accordance with state and federal laws;
developing avoidance and minimization measures; establishing appropriate
compensatory
mitigation;
and
post‐
construction
operations
monitoring,
analysis,
and
reporting methods.
Key Words: Avian fatality, avian injury, avian mortality, bat fatality, bat injury, bat
mortality, bird fatality, bird injury, carcass count, Migratory Bird Treaty Act, rotor‐swept
area, wind energy, wind siting guidelines, wind turbines.

7/28/2019 Estudio California CEC 700 2007 008 CMF
http://slidepdf.com/reader/full/estudio-california-cec-700-2007-008-cmf 6/165

7/28/2019 Estudio California CEC 700 2007 008 CMF
http://slidepdf.com/reader/full/estudio-california-cec-700-2007-008-cmf 7/165
ACKNOWLEDGEMENTS
Science Advisory Committee Peter Bloom, Bloom
Biological, Inc.
Michael Green, U.S. Fish
and Wildlife Service
Bronwyn
Hogan,
California Department
of Fish and Game
Kenneth Pollock, North
Carolina State
University
Bill Rainey, University of
California, Berkeley
James Sedinger, University of Nevada,
Reno
Robert Thresher, National Renewable
Energy Laboratory
Brian James Walton, Santa Cruz Predatory
Bird Research Group
California Energy Commission Staff Kelly Birkinshaw
Melinda Dorin
Melissa Jones
Suzanne Korosec
Nita McGlothin
Sangi Rajbhandari
Linda Spiegel
Mike Smith
Timothy Tutt
Allan Ward
Kerry Willis
Marcus Yee
California Department of Fish and Game Staff Steve Adams
Lacy Bauer
Betsy Bolster
Ryan Broddrick
Joe Carboni
William Condon
Banky Curtis
Janice Gan
Gordon Gould
Eric Haney
Jennifer Hogan
Tom Lupo
Jenny Marr
Jim Sheridan
Annette Tenneboe
Julie Vance
Bruce Webb
Craig Weightman
The following organizations and individuals provided written and/or verbal comments
in the Order Instituting Investigation Proceeding (Docket # 06‐OII‐1) and/or participated
in workshops or hearings:
Ed Arnett, Bat
Conservation
International
Ken Arnold, M.H. Wolfe
and Associates
Mike Best, Pacific Gas
and Electric
Marjorie Blackwell, Golden Gate Audubon
Society
Robert Boyd, GE Energy
Cabazon Wind Energy,
LLC
Richard Cimino, Livermore Valley
7/28/2019 Estudio California CEC 700 2007 008 CMF
http://slidepdf.com/reader/full/estudio-california-cec-700-2007-008-cmf 8/165
John Day, Santa Barbara
County
Mark Dedon, Pacific Gas and Electric
Kim Delfino, Defenders
of Wildlife
Scott Denny, Kern
County Planning
Department
Chris Duggan
J. Edward Duggan, Oak
Creek Energy Systems,
Inc.
Brison Ellinghaus, AES
SeaWest, Inc.
Wally Erickson, Western
EcoSystems Technology,
Inc.
Diane Fellman, FPL
Energy
Alan Fernandes, Nielsen,
Merksamer, Parrinello,
Mueller, and Naylor
Garry George, Los
Angeles Audubon
Society
Alec Hoffmann, Marin
County Community
Development Agency
Chuck Holloway, Los
Angeles Department of
Water and Power
Nicole S. Hughes, RES
America Developments,
Inc.
Ted James, Kern County
Planning Department
Heather Johnson
M li K ll S t
Brenda LeMay, Horizon
Wind Energy
Julia Levin, Audubon
California
Jim Lindsay, FPL Energy
Andy Linehan, PPM
Energy
Vanessa Loverti, TRC
Essex
Don Maben, Kern
County Board of
Supervisors
Joyce Manley, Residents
of San Gorgonio Pass
Area
Albert Manville, U.S.
Fish and Wildlife Service
Bev McIntosh,
Riverside
County
Anne Mudge, Morrison
and Foerster, LLP
Elizabeth Murdock, Golden Gate Audubon
Society
Cliff Murley, Sacramento
Municipal Utility
District
Samantha Murray, Golden Gate Audubon
Society
Karla Nelson, Oak Creek
Energy Systems, Inc.
Jim Newman, Pandion
Systems, Inc.
Frederick W. Noble ,
Wintec Energy, Ltd.
Jay Olivas, Riverside
County Planning
D t t
Bob Power, Santa Clara
Valley Audubon Society
Larry Rabin
Nancy Rader, California
Wind Energy
Association
San Gorgonio Farms,
Inc.
Saverio Scalzi, High Tech
Corp.
Karen Shull, M.H. Wolfe
and Associates
Mark Sinclair, Clean
Energy States Alliance
Karin Sinclair, National
Renewable Energy
Laboratory
Stuart Smith,
Oak
Creek
Energy Systems, Inc.
Kenneth Stein, FPL
Energy
Christine Stora, URS
Joseph Szewczak, Humboldt State
University
Scott Thomas, Audubon
California
Arthur Unger, Sierra
Club, Kern‐Kaweah
Chapter
Paul Vercruyssen, Center for Energy
Efficiency and
Renewable Technologies
James Walker, EnXco,
Inc.
Kate Wattson, Horizon
Wind Energy

7/28/2019 Estudio California CEC 700 2007 008 CMF
http://slidepdf.com/reader/full/estudio-california-cec-700-2007-008-cmf 9/165
Ted Weller
V. John White, Center for
Energy Efficiency and
Renewable Technologies
Tom White, EnXco, Inc.
Linda White, Kern Wind
Energy Association
Chris White, Oak Creek
Energy Systems, Inc.
Whitewater Energy
Corporation
Marcia Wolfe, M.H.
Wolfe and Associates
Carl Zichella, Sierra Club
The authors would also like to thank the following California Energy Commission staff
members for their assistance: Bob Aldrich, Joe Bubbico, Geoff Carter, Mary Dyas, Dale
Edwards,
Bert
Fegg,
Cathy
Graber,
Donna
Green,
Sherri
Guzman,
Nancy
Hassman,
Harriet Kallemeyn, Kevin Kidd, Jerome Lee, Joseph Merrill, Mike Monasmith, Linda
Nesbit, Justin Oakley, Gabriela Peña, Cheryl Raedel, Roy Sanders, and Donna Swanigan.
Elise Camacho and Tom Murphy of Aspen Environmental Group prepared contract
documents for the project. Abby Arnold, Jennifer Bies, and Paul De Morgan of
RESOLVE, and Peters Shorthand Reporting Corporation provided services for public
workshops and hearings.

7/28/2019 Estudio California CEC 700 2007 008 CMF
http://slidepdf.com/reader/full/estudio-california-cec-700-2007-008-cmf 10/165

7/28/2019 Estudio California CEC 700 2007 008 CMF
http://slidepdf.com/reader/full/estudio-california-cec-700-2007-008-cmf 11/165
TABLE OF CONTENTS
EXECUTIVE SUMMARY.............................................................................................................. E‐1
INTRODUCTION .............................................................................................................................. 1
Securing Wind Energy Development Permits ................................................................................2
Status of Wind Energy Research ....................................................................................................... 2
Purpose of This Document.................................................................................................................3
The Future of This Document............................................................................................................4
A STEP‐BY‐STEP APPROACH TO IMPLEMENTING THE GUIDELINES..........................5
Step 1: Gather Preliminary Information and Conduct Site Screening .........................................5
Step 2: Determine CEQA and Wildlife Protection Law Requirements........................................6
Step 3: Conduct Pre‐Permitting Assessment ................................................................................... 8
Step 4: Assess Potential Impacts and Identify Mitigation Measures .........................................12
Step 5:
Collect
Operations
Monitoring
Data
Using
the
Standardized
Monitoring
Protocol ..15
CHAPTER 1: PRELIMINARY SITE SCREENING.....................................................................21
Reconnaissance Site Visit..................................................................................................................21
Databases for Gathering Site Information .....................................................................................21
Federal and State Agencies as Resources.......................................................................................22
Local Experts and Other Resources ................................................................................................23
Evaluating Data from Nearby Wind Energy Facilities ................................................................23
CHAPTER 2: CEQA, WILDLIFE PROTECTION LAWS, AND THE PERMITTING
PROCESS ........................................................................................................................................... 27
Initiating the Permitting Process .....................................................................................................27
Involving and Communicating with Regulatory Agencies and Stakeholders.........................28
Establishing Permit Conditions and Compliance.........................................................................29
Navigating CEQA Requirements and Local, State, and Federal Laws......................................29
CHAPTER 3:
PRE
‐PERMITTING
ASSESSMENT.....................................................................37
Framework for Determining Bird and Bat Study Effort ..............................................................37
Securing Appropriate Expertise to Develop the Studies .............................................................39
Study Objectives and Design...........................................................................................................40
Diurnal Avian Surveys .....................................................................................................................42

7/28/2019 Estudio California CEC 700 2007 008 CMF
http://slidepdf.com/reader/full/estudio-california-cec-700-2007-008-cmf 12/165
Impact Assessment Approaches .....................................................................................................62
Impact Avoidance and Minimization............................................................................................. 62
Compensation .................................................................................................................................... 66 Operations Impact Mitigation and Adaptive Management........................................................69
CHAPTER 5: OPERATIONS MONITORING AND REPORTING ....................................... 71
Duration of Operations Monitoring................................................................................................72
When Long‐Term Monitoring May Be Appropriate....................................................................72
Operations Monitoring for Repowered Sites.................................................................................73
Determining Bird and Bat Abundance and Behavior During Operations................................73
Carcass Searches ................................................................................................................................ 74
Reporting Monitoring Data..............................................................................................................79
REFERENCES....................................................................................................................................83
LIST OF ACRONYMS.....................................................................................................................95
APPENDIX A: CONTACT INFORMATION FOR THE CALIFORNIA DEPARTMENT
OF FISH
AND
GAME
HEADQUARTERS
AND
REGIONS...................................................97
APPENDIX B: CONTACT INFORMATION FOR UNITED STATES FISH AND
WILDLIFE SERVICE ECOLOGICAL SERVICES OFFICES WITH JURISDICTION IN
CALIFORNIA..................................................................................................................................101
APPENDIX C: GLOSSARY OF TERMS ....................................................................................103
APPENDIX D: SCIENTIFIC NAMES OF BIRDS AND MAMMALS MENTIONED IN
TEXT..................................................................................................................................................113
APPENDIX E: SAMPLE DATA SHEETS...................................................................................115
APPENDIX F: RECOMMENDED FORMULAS FOR ADJUSTING FATALITY RATES ......
............................................................................................................................................................117
APPENDIX G: ESTIMATING IMPACTS TO RAPTORS USING BIRD USE COUNT
AND FATALITY DATA FROM EXISTING PROJECTS........................................................119

7/28/2019 Estudio California CEC 700 2007 008 CMF
http://slidepdf.com/reader/full/estudio-california-cec-700-2007-008-cmf 13/165
EXECUTIVE SUMMARYWind energy is expected to play a vital role in meeting California’s renewable energy
standards, which require that 20 percent of the electricity sold in California come from
renewable energy resources by 2010. The California Energy Commissionʹs 2004 Integrated
Energy Policy Report Update recommends a longer‐term goal of 33 percent renewable energy
by 2020. At the same time California moves to achieve its renewable energy commitments, it
must also maintain and protect the state’s wildlife resources. Specifically, wind energy
development projects in California must avoid, minimize, and mitigate potential impacts to
bird and bat populations. California Guidelines for Reducing Impacts to Birds and Bats from Wind
Energy Development (Guidelines) was developed to address these coexisting and sometimes
conflicting objectives: to encourage the development of wind energy in the state while
minimizing and mitigating harm to birds and bats.
The recommendations and protocols discussed in these voluntary Guidelines are suggestions
for local permitting agencies to use at their discretion, and as a resource for other parties
involved in the permitting process. Local governments are encouraged to integrate the
recommended study methods described in the Guidelines with biological resource
information and research unique to their region.
This document is a collaboration of the California Energy Commission (Energy
Commission) and the California Department of Fish and Game (CDFG). In its 2005
Integrated Energy Policy Report , the Energy Commission recommended the development of
statewide protocols to address avian impacts from wind energy development. In 2006, many stakeholder participants at a workshop, “Understanding and Resolving Bird and Bat
Impacts,” collectively requested such guidance. The resulting document provides a science‐
based approach for assessing the potential impacts that a wind energy project may have on
bird and bat species and includes suggested measures to avoid, minimize, and mitigate
identified impacts. CDFG and the Energy Commission encourage the use of the Guidelines
for the biological assessment, mitigation, and monitoring of wind energy development
projects and
wind
turbine
repowering
projects
in
California.
The objectives of the Guidelines are to provide information and protocols for assessing,
evaluating, and determining the level of project effects on bird and bat species, and to
develop and recommend impact avoidance, minimization, and mitigation measures. The
document is organized around five basic project development steps:

7/28/2019 Estudio California CEC 700 2007 008 CMF
http://slidepdf.com/reader/full/estudio-california-cec-700-2007-008-cmf 14/165
Information in the Guidelines was specifically designed to be flexible to accommodate local
and regional concerns, and the recommended protocols may need to be adjusted to accommodate unique, site‐specific conditions. The protocols in the document are adaptable
to address the specifics of each site such as frequency and type of bird and bat use, terrain,
and availability of scientifically accepted data from nearby sources. For most projects, one
year of pre‐permitting surveys and two years of carcass searches during operations are
recommended. However, a reduced level of survey effort may be warranted for certain
categories of projects, such as infill development, some repowering projects, or projects
contiguous to
existing
low
‐impact
wind
facilities.
On
the
other
hand,
survey
duration
and
intensity may need to be expanded for other kinds of projects, such as those with potential
for impacts to special‐status species, or for sites near wind energy projects known to have
high impacts to birds or bats. Decisions on the level of survey effort need to be made in
consultation with the CEQA lead agency, CDFG, U.S. Fish and Wildlife Service, and local
conservation groups. The Energy Commission and CDFG propose to establish a statewide
standing science advisory committee that could also provide information to lead agencies
seeking additional scientific expertise. The advisory committee will be established through
an open process that encourages input from all interested parties.
California Guidelines for Reducing Impacts to Birds and Bats from Wind Energy Development does
not duplicate or supersede CEQA, the California Endangered Species Act statutes or other
legal requirements. This document does not alter a lead agency’s obligations under CEQA,
nor does it mandate or limit the types of studies, mitigation, or alternatives that an agency
may decide to require. Because this document complements existing CEQA guidance,
following these Guidelines will support efforts to comply with CEQA and other local, state, and federal wildlife laws and will facilitate the issuance of required permits for a project,
providing a measure of regulatory certainty for wind energy developers. Wind energy
developers who use the methods described in the Guidelines will secure information on
impact assessment and mitigation that would apply to CEQA and to the other wildlife
protection laws and will demonstrate a good faith effort to develop and operate their
projects in a fashion consistent with the intent of local, state, and federal laws. Such good
faith efforts would be considered by CDFG before taking enforcement actions for violation
of a California wildlife protection law.
This document reflects close coordination of the Energy Commission and California
Department of Fish and Game and advice from scientists and legal experts, as well as public
i t f i d d l t i ti ti d th

7/28/2019 Estudio California CEC 700 2007 008 CMF
http://slidepdf.com/reader/full/estudio-california-cec-700-2007-008-cmf 15/165
INTRODUCTIONCalifornians have high expectations for their stateʹs renewable energy programs. On
September 26, 2006, Governor Schwarzenegger signed Senate Bill 107 (Simitian and
Perata) Chapter 464, Statutes of 2006, requiring that 20 percent of the electricity sold in
California come from renewable energy resources by 2010.1 Additionally, the California
Energy Commissionʹs 2004 Integrated Energy Policy Report Update recommends a longer‐
term goal of 33 percent renewable energy by 2020. Wind energy is expected to play a
vital role in meeting both goals.
Californians have equally high expectations for protection of the state’s diverse bird and
bat populations. Optimal development of the state’s wind energy resources requires
adequate measures to avoid, minimize, and mitigate potential impacts to these
populations. The voluntary California Guidelines for Reducing Impacts to Birds and Bats from
Wind Energy Development (Guidelines) has been developed to help meet both of these
expectations and to encourage the development of wind energy in the state while
minimizing impacts to birds and bats.
In its 2005 Integrated Energy Policy Report , the California Energy Commission (Energy
Commission) recommended the development of statewide protocols to address avian
impacts from wind development. The Guidelines effort originated in January of 2006 at
the “Understanding and Resolving Bird and Bat Impacts” conference in Los Angeles. Many
participants at the conference encouraged the Energy Commission and the California
Department of Fish and Game (CDFG) to collaborate, with input from all interested parties, to establish voluntary statewide guidelines to promote the development of wind
energy in the state, while minimizing impacts to birds and bats.
On May 24, 2006, the Energy Commission adopted an Order Instituting Informational
proceeding that assigned the task to the Energy Commission’s Renewables Committee.2
To assist Energy Commission and CDFG staff in this endeavor, the Renewables
Committee established
a science
advisory
committee
and
solicited
suggestions
from
stakeholders on how to incorporate public input into the guidelines development

7/28/2019 Estudio California CEC 700 2007 008 CMF
http://slidepdf.com/reader/full/estudio-california-cec-700-2007-008-cmf 16/165
process. As a result, the Energy Commission has hosted numerous public workshops
throughout the state and solicited written comments on draft Guidelines to make sure all
interested parties
have
input
on
development
of
this
document.
Securing Wind Energy Development Permits
In California, development of wind energy projects requires land use permits from local
agencies such as counties and cities, many of which have ordinances that regulate the
permitting and operation of these projects. State and federal laws regulate certain
aspects of wind energy projects, including their impacts to special status species and
other biological resources. The California Environmental Quality Act (CEQA), the
Planning and Zoning Law, the California Endangered Species Act, Federal Endangered
Species Act, and state and federal wildlife protection laws are the primary laws and
regulations that govern the process. This document is a tool to facilitate compliance with
relevant laws and regulations by recommending methods for conducting site‐specific,
scientifically sound biological evaluations. Much of the information required to satisfy
CEQA is also needed to comply with other state and federal wildlife laws; using the
Guidelines for
standardized
guidance
on
how
to
collect
information
on
potential
bird
and
bat impacts will facilitate compliance with all of these laws.
Status of Wind Energy Research
Bird and bat interactions with wind turbines is an area of active research and
collaboration in this country and internationally. The National Wind Coordinating
Committee (NWCC) <www.nationalwind.org>, a diverse collaborative that includes
representatives from developers, utilities, environmental and consumer groups, and
state and federal government, provides a forum for this research with its Wildlife
Workgroup. Elsewhere in the United States, numerous other public‐private research
partnerships are underway that will also provide new findings on how to reduce the
impacts of wind development on wildlife, including the National Renewable Energy
Laboratory, <www.nrel.gov/wind>, and the Bat and Wind Energy Collaborative (refer to
<www.nationalwind.org> for more information).
In California, the Energy Commissionʹs Public Interest Energy Research (PIER) Program
supports energy research, development, and demonstration projects to advance science
and technology that provide environmentally sound, efficient, and reliable energy
sources <www.energy.ca.gov/pier/environmental/index.html>. The Energy Commission
has undertaken research efforts that will help inform the siting of new wind energy

7/28/2019 Estudio California CEC 700 2007 008 CMF
http://slidepdf.com/reader/full/estudio-california-cec-700-2007-008-cmf 17/165
Energy Commission. The research plan also identifies opportunities to leverage research
funds and support collaborative efforts with stakeholders, including government
agencies, conservation
groups,
and
industry.
PIER
is
currently
developing
an
update
to
its research plan that will focus on research needed to help strengthen future versions of
the Guidelines.
In addition to PIER’s research efforts, the Energy Commission and CDFG are interested
in supporting further studies that might increase the certainty in methods and metrics to
assess and mitigate potential impacts to birds and bats from wind energy development.
These agencies
intend
to
work
with
wind
energy
developers
and
non
‐governmental
organizations interested in wind‐wildlife interactions to explore a public‐private
partnership and funding mechanism to support collaborative, regional research efforts.
The objective of this research would be to improve the reliability and accuracy of pre‐
permitting studies and develop effective impact avoidance and minimization strategies.
Purpose of This Document
The purpose
of
this
document
is
to
provide
voluntary
guidelines
that
describe
methods
to assess bird and bat activity at proposed wind energy sites, design pre‐permitting and
operations monitoring plans, and develop and recommend impact avoidance,
minimization, and mitigation measures. Both wind energy proponents and bird and bat
populations will benefit if agencies that permit wind energy development projects apply
the methods recommended in the Guidelines. Using these protocols will promote
scientifically sound, cost‐effective study designs; produce comparable data among
studies
within
California;
allow
for
analyses
of
trends
and
patterns
of
impacts
at
multiple sites; and ultimately improve the ability to estimate and resolve impacts locally
and regionally.
Using the methods described in the Guidelines will provide information on impact
assessment and mitigation for the application of CEQA and other wildlife protection
laws and will demonstrate a good faith effort to develop and operate wind projects
consistent with the intent of local, state, and federal laws. Prior to taking enforcement
actions for violation of a California wildlife protection law, CDFG will take such good
faith efforts into account.
Organization of the Document
The Guidelines opens with a step‐ by‐step implementation guide that highlights the

7/28/2019 Estudio California CEC 700 2007 008 CMF
http://slidepdf.com/reader/full/estudio-california-cec-700-2007-008-cmf 18/165
• Chapter 1, “Preliminary Site Screening,” discusses the initial actions a developer
should take to assess the relative sensitivity of a potential wind energy project site
and to
determine
the
kinds
of
studies
that
will
be
required
to
adequately
evaluate
the impacts such a project could have on birds and bats.
• Chapter 2, “CEQA, Wildlife Protection Laws, and Permitting Requirements,” offers
information on impacts and mitigation that can apply both to CEQA and to other
wildlife protection laws and makes recommendations to facilitate completion of
important milestones throughout the permit application process and the life of the
project.
• Chapter 3, “Pre‐Permitting Assessment,” offers standardized survey methods,
protocols, and recommendations for conducting the studies identified by
preliminary site screening, both for new projects and for repowering.
• Chapter 4, “Assessing Impacts and Selecting Measures for Mitigation,” discusses
how to assess impact findings discovered during the pre‐permitting studies and
suggests avoidance and minimization measures to incorporate into the planning
and
construction
of
the
wind
energy
development.
It
also
discusses
adaptive
management and compensatory mitigation.
• Chapter 5, “Operations Monitoring and Reporting,” recommends standardized
techniques for collecting, interpreting, and reporting bird and bat fatalities and use
data once a project has begun operation.
The Future of This Document
This document reflects the current state of knowledge about the interactions of wind
turbines with birds and bats. Ongoing and future research and actual experience in
preliminary site screening, pre‐permitting assessment, and operations monitoring of
wind energy projects will refine, expand, and alter that knowledge. The Energy
Commission and the CDFG will update and revise portions of the document as new
research findings and feedback from users of the Guidelines indicate that current
recommendations, such as those for bat and nocturnal bird survey methods, may need
revision. The entire document will be reviewed and revised, if necessary, approximately
every five years. Interested parties will have the opportunity to participate in the update
and revision process. Consult the Energy Commission Web page for information about
proposed updates or revisions <www.energy.ca.gov/renewables/06‐OII‐1/>. For
questions about this document or to contribute information to the current body of
k l d l h Bi l U i S i h E C i i (916)

7/28/2019 Estudio California CEC 700 2007 008 CMF
http://slidepdf.com/reader/full/estudio-california-cec-700-2007-008-cmf 19/165
A STEP-BY-STEP APPROACH TO
IMPLEMENTING THE GUIDELINESThis step‐ by‐step guide summarizes the actions project developers should take to assess
the impacts a typical wind energy project may have on birds and bats and to avoid,
minimize, and mitigate those impacts. The section focuses on:
• Preliminary site screening
• Permitting requirements
and
compliance
with
laws
• Pre‐permitting assessment methods
• Impact analysis and mitigation
• Operations monitoring
While the other chapters of the Guidelines present scientific research and rationale for
recommended actions,
this
section
takes
a “how
to”
approach,
with
the
steps
arranged
in the order they are likely to occur. Each step corresponds to a chapter that provides
additional details and background information.
Step 1: Gather Preliminary Information and Conduct SiteScreening
Site screening is the first step to assess biological resource issues and potential impacts
associated with wind development at a proposed site and to develop a “pre‐permitting”
study plan. Site screening consists of a reconnaissance field survey and a desktop effort
to collect data about the site from databases, reports from nearby projects, agencies, and
local experts. Based on the site reconnaissance and review of existing data, a preliminary
list of impact questions can be developed, including which species are likely to occur at
the site and which are likely to be affected by the project. The site’s sensitivity will
determine what kind of species‐specific data should be collected and determine the
kinds of
studies
the
developer
should
conduct
during
the
pre
‐permitting
assessment
to
adequately evaluate a wind energy project’s potential impacts to birds and bats.
Consultation with the U.S. Fish and Wildlife Service (USFWS), California Department of
Fish and Game (CDFG), CEQA lead agency, and other appropriate stakeholders is an
important step during this process, yielding valuable information and establishing
t t ith k i di id l d i ti

7/28/2019 Estudio California CEC 700 2007 008 CMF
http://slidepdf.com/reader/full/estudio-california-cec-700-2007-008-cmf 20/165
1. Are any of the following species known or likely to occur on or near the
proposed project site (“near” refers to a distance that is within the area used by
an animal
in
the
course
of
its
normal
movements
and
activities.):
a. Species listed as federal or state “Threatened” or “Endangered” (or candidates
for such listing)?
b. Special‐status birds or bats?
c. Fully protected birds?
2. Is the site near a raptor nest, or are large numbers of raptors known or likely to
occur at or near the site during portions of the year?
3.
Is
the
site
near
important
staging
or
wintering
areas
for
waterfowl,
shorebirds,
or
raptors?
4. Are colonially breeding species (for example, herons, shorebirds, seabirds)
known or likely to nest near the site?
5. Is the site likely to be used by birds whose behaviors include flight displays (for
example, common nighthawks, horned larks) or by species whose foraging
tactics put them at risk of collision (for example, contour hunting by golden
eagles)?
6. Does the site or do adjacent areas include habitat features (for example, riparian
habitat, water bodies) that might attract birds or bats for foraging, roosting,
breeding, or cover?
7. Is the site near a known or potential bat roost?
8. Does the site contain topographical features that could concentrate bird or bat
movements (for example, ridges, peninsulas, or other landforms that might
funnel bird or bat movement)? Is the site near a known or likely migrant
stopover site?
9. Is the site regularly characterized by seasonal weather conditions such as dense
fog or low cloud cover that might increase collision risks to birds and bats, and
do these events occur at times when birds might be concentrated?
Step 2: Determine CEQA and Wildl ife Protection LawRequirements
Permitting for wind energy projects is primarily handled by lead agencies (mostly
counties and cities) in accordance with the California Environmental Quality Act
(CEQA). In addition to complying with CEQA, lead agencies and project developers
should consider the local, state, and federal wildlife protection laws in assessing and
mitigating impacts to birds and bats The following list of laws includes those most

7/28/2019 Estudio California CEC 700 2007 008 CMF
http://slidepdf.com/reader/full/estudio-california-cec-700-2007-008-cmf 21/165
State Laws
California Environmental Quality ActThe California Environmental Quality Act governs how California counties, cities, and
other government entities evaluate environmental impacts in making discretionary
permitting decisions for wind energy development.
Fish and Game Code Wildlife Protection Laws
In the broadest sense, CEQA and Fish and Game Code wildlife protection laws require
that government
agencies
develop
standards
and
procedures
necessary
to
maintain,
protect, restore, and enhance environmental quality, including fish and wildlife
populations and plant and animal communities, and to ensure that projects comply with
these laws. Several California Fish and Game Code sections that relate to protection of
avian wildlife resources and are relevant to wind energy projects are described below.
• California Endangered Species Act (CESA), 1984 – Fish and Game Code section 2050
et seq
• Fully Protected Species, Fish and Game Code sections 3511, 4700, 5050, and 5515
• Migratory Birds, Fish and Game Code section 3513
• Birds of Prey and Their Eggs, Fish and Game Code section 3503.5
• Unlawful Sale or Purchase of Exotic Birds, Fish and Game Code section 3505
• Nongame Birds, Fish and Game Code section 3800 (a)
Federal Laws
The following federal laws may apply to protecting wildlife from impacts from wind
energy:
• National Environmental Policy Act
• Federal Endangered Species Act (FESA), 1973, Title 16, U.S. Code section 1531
• Migratory Bird
Treaty
Act
(MBTA),
1918,
Title
16,
U.S.
Code
sections
703
to
712
• Bald and Golden Eagle Protection Act, 1940, Title 16, U.S. Code section 668
While CEQA compliance will be the primary focus of the impact assessment for a wind
energy project, focusing on CEQA significance alone may not address all of the species

7/28/2019 Estudio California CEC 700 2007 008 CMF
http://slidepdf.com/reader/full/estudio-california-cec-700-2007-008-cmf 22/165
Step 3: Conduct Pre-Permit ting Assessment
Framework for Determining Bird and Bat Study Effor tWith information from the preliminary site assessment, proposed project sites can be
grouped into one of four categories to provide a general framework for determining the
duration and intensity of study needed for pre‐permitting and operations monitoring.
For all projects, base the duration and focus of pre‐permitting studies on the availability
of site‐specific, baseline data needed to answer impact questions; the species potentially
affected; and the magnitude of the anticipated effect.
Category 1 – Project Sites with Available Wind-Wildli fe Data
Some proposed projects have the advantage of an existing foundation of data on bird
and bat use and potential impacts from nearby similar projects. For these Category 1
projects, a reduced study effort may be appropriate. Projects potentially falling into
Category 1 might include infill development, repowering projects, and those near
existing wind facilities for which there is little uncertainty as to the level of impacts.
Consultation with
the
lead
agency,
USFWS,
CDFG,
biologists
with
specific
expertise,
and other appropriate stakeholders (such as a conservation organization representative)
is recommended when considering whether a project qualifies as Category 1. Factors to
consider in determining whether or not data from an adjacent facility would allow a
project to be classified as Category 1 include:
• Whether the field data were collected using a credible sample design
• Where the data were collected in relation to the proposed site
• Whether the existing data reflect comparable turbine type, layout, habitat,
suitability for migratory species, physical features, and winds
• Whether the data are scientifically defensible and still relevant
Category 1 projects may not need a full year of pre‐permitting studies to answer
questions about potential collision risk because of the availability of existing data.
Caution is warranted in extrapolating existing data to unstudied nearby sites. Slight topographical or habitat variations can make substantial differences in bird and bat site
use and potential impacts. In addition, technological changes including use of large
turbines, variations in turbine design or layout, increased operating times, and use of
different lighting may require new or additional data gathering.

7/28/2019 Estudio California CEC 700 2007 008 CMF
http://slidepdf.com/reader/full/estudio-california-cec-700-2007-008-cmf 23/165
assessment. Pre‐permitting surveys should last a minimum of one year to document
how birds and bats use a site during spring, summer, fall, and winter.
Category 3 – Project Sites with High or Uncertain Potential for Wildl ife Impacts
Projects with high levels of bird and/or bat use or considerable uncertainty regarding
bird and bat use or risk will need more study than Category 2 projects to help
understand and formulate ways to reduce the number of fatalities. Characteristics of a
site that might put a proposed project in Category 3 are:
• Known avian migration stopover destinations such as water bodies within or
immediately adjacent
to
the
project
• Special‐status species occurring on or adjacent to a proposed site
• High concentrations of wintering and/or breeding raptors
• Sites near or contiguous to wind projects that have experienced high bird or bat
fatalities that cannot be avoided or minimized
Pre‐permitting
studies
in
excess
of
one
year
may
be
necessary
for
Category
3 projects
when baseline information is lacking and when considerable annual and seasonal
variation in bird and bat populations is suspected or when there is potential for
declining or vulnerable species to occur at the site.
Category 4 – Project Sites Inappropr iate for Wind Development
Wind development should not be considered on land protected by local, state, or federal
government as: designated wilderness areas, national parks or monuments, state parks,
regional parks, and wildlife or nature preserves. Sites for which existing data indicate
unacceptable risk of bird or bat fatalities might also be appropriately classified as
Category 4, particularly if no feasible avoidance or mitigation measures are available to
reduce impacts.
Study Objectives and Design
The primary objective of bird and bat studies is to collect information useful for
estimating the direct and indirect impacts of the project on birds and bats. With this
objective in mind, development of a pre‐permitting study begins with a clear statement
of the questions to be answered. Specific study objectives will vary from site to site, but
key issues will typically include at least the following questions:
• Which species of birds and bats use the project area and how do their numbers

7/28/2019 Estudio California CEC 700 2007 008 CMF
http://slidepdf.com/reader/full/estudio-california-cec-700-2007-008-cmf 24/165
• What design and mitigation measures could reduce impacts?
Repowering
Repowering refers to modernizing an existing wind resource area by removing old
turbines and replacing them with new turbines that are generally larger, taller, and more
efficient than the old ones. Data for repowering projects may be available from nearby
existing wind projects. The lead agency should consult with CDFG, USFWS, and other
experts to assess whether these data are credible, scientifically defensible, and applicable
to the repowering site. If so, developers may use the data to reduce the extent of new
field
studies
needed
to
assess
impacts
and
develop
mitigation
measures.
Evaluate
the
applicability of the existing data in light of design and operational differences between
the old and replacement turbines.
General Pre-Permitting Monitoring Considerations
The standardized data collection method for diurnal birds is the bird use count; most
projects will also need raptor nest searches. Depending on characteristics of a proposed
project site and the bird species potentially affected by the project, additional pre‐
permitting study methods may be necessary.
For bats, monitoring with specialized acoustic systems is recommended to determine the
presence and activity levels of resident and migratory bats at proposed project sites. If
defensible, site‐specific data are available indicating that the project is unlikely to pose a
risk to bats, acoustic monitoring may not be warranted. Other bat research tools are
available to complement the information from acoustic surveys but are not
recommended on every project.
For nocturnal migratory birds, conduct additional studies as needed if characteristics of
the project site and surrounding areas potentially pose a high risk of collision to
migrating songbirds and other species. This document discusses some of the primary
tools available to study nocturnal birds (radar, acoustic monitoring, visual monitoring)
but does not provide standardized recommendations on duration or frequency of
sampling or study design.
Early consultation with the lead agency, CDFG, USFWS, and local environmental
groups is a crucial step in designing pre‐permitting studies and deciding whether or not
modifications to the standardized methods are warranted.

7/28/2019 Estudio California CEC 700 2007 008 CMF
http://slidepdf.com/reader/full/estudio-california-cec-700-2007-008-cmf 25/165
Number/Distribution of Sample Points. Select BUC sample sites at vantage points that
offer unobstructed views of the surrounding terrain and that are at least 5,200 feet (1,600
meters) apart,
coinciding
with
proposed
turbine
sites.
Establish
sufficient
sample
points
to achieve an average minimum density of 1 to 1.5 sample points every 1 square mile
(2.6 square kilometers). Distribute sample points to cover areas of the project site where
turbines will be located.
Variables. Record number and species of birds observed, distance from bird to observer,
flight height above ground, and environmental variables (for example, wind speed). The
surveyor should record locations and behavior at short intervals (for example, 30
seconds), noting behavior such as soaring, contour hunting, and flapping flight.
Metrics. Record bird use and flight height above ground within a defined area per 30‐
minute count.
Raptor Nest Searches
Raptor nest searches provide information for micrositing decisions, to aid in estimating
impacts, to establish an appropriately sized non‐disturbance buffer around the nesting
territory, and to develop compensatory mitigation measures, if needed. Consult with the
USFWS, CDFG, raptor biologists, and appropriate stakeholders to establish which
species to search for and to develop the site‐specific survey protocol.
Search Area. Conduct searches for raptor nests or raptor breeding territories on projects
with potential for impacts to raptors in suitable habitat during the breeding season
within at
least
one
mile
of
proposed
turbine
locations.
If
wide
‐ranging
species
such
as
bald or golden eagles or red‐tailed hawks are known or likely to nest in the vicinity of
the project area, consult CDFG, USFWS, and raptor experts to determine whether an
expansion of the search area is warranted. The search area can be reduced for species
with smaller home ranges (for example, American kestrel) or for species that generally
stay within the forest canopy and are unlikely to venture far into the open terrain of a
wind resource area (for example, Coopers’ hawk, spotted owl, and some species of small
owls).
Search Protocol. Conduct nest surveys from the ground or air, using helicopters if
necessary for large and inaccessible areas and in open country such as grassland or
desert. Avoid approaching the nest too closely to minimize disturbance, particularly
when surveying from helicopters Use existing survey protocol (refer to

7/28/2019 Estudio California CEC 700 2007 008 CMF
http://slidepdf.com/reader/full/estudio-california-cec-700-2007-008-cmf 26/165
Bats—Pre-Permitting Monitoring Protocol
Duration of Monitoring. Conduct acoustic monitoring for bats at all proposed wind
energy sites unless defensible, site‐specific data are available indicating that the project is unlikely to pose a risk to bats. Monitoring for a full year is recommended because little
is known about the timing of bat migratory activity in many parts of the state, and some
bat species overwinter in California and can be active throughout the year. Year‐round
surveys are particularly important at proposed project sites if, in the opinion of bat
experts involved in scoping the pre‐permitting studies, the sites are likely to support
resident bat populations and include habitat features conducive to general bat activity
(for example, nearby roosts, water bodies). If year‐round surveys are not feasible, acoustic monitoring should include at least spring and fall migration, the periods that
pose the greatest risk to bats. Collect data on environmental variables such as
temperature, precipitation, and wind speed concurrently with the acoustic monitoring
so these weather data can be correlated with bat activity levels. Consult bat experts,
CDFG, and USFWS to make a determination as to the credibility and applicability of any
existing data and to assess whether acoustic monitoring is warranted at a proposed
wind energy
site.
Number and Distribution of Monitoring Stations. Place two bat detection systems at
high and low positions on each meteorological tower in the proposed project area. Raise
the “ground‐level” detectors approximately 5 feet (1.5 meters) above the ground to
avoid interference from vegetation. Place elevated detectors as high as possible without
interfering with weather monitoring equipment.
Data Collection and Analysis. Monitor all night and at dusk and dawn. Consult with a
bat biologist with experience in acoustic analysis and with CDFG and USFWS before
making decisions on the level of effort needed for screening and analyzing the pre‐
permitting acoustic data.
Metrics. Record total bat passes and mean passes per detector night and per detector
hour (excluding nights with measurable precipitation).
Step 4: Assess Potential Impacts and Identi fy MitigationMeasures
To comply with CEQA and address other wildlife protection laws, lead and responsible

7/28/2019 Estudio California CEC 700 2007 008 CMF
http://slidepdf.com/reader/full/estudio-california-cec-700-2007-008-cmf 27/165
Impact Avoidance and Minimization
Consider the following elements in site selection and turbine layout and in developing
infrastructure for the facility:
• Minimize fragmentation and habitat disturbance.
• Establish buffer zones to minimize collision hazards (for example, avoiding
placement of turbines within 100 meters of a riparian area).
• Reduce impacts with appropriate turbine design and layout.
• Reduce
artificial
habitat
for
prey
at
turbine
base
area.
• Avoid lighting that attracts birds and bats.
• Minimize power line impacts by placing lines under ground whenever possible.
• Avoid using structures with guy wires.
• Decommission non‐operational turbines.
CompensationProject developers and permitting agencies should ensure that appropriate measures are
incorporated into the planning and construction of the project to avoid or minimize
impacts as much as possible. If these measures are insufficient to avoid or minimize
estimated impacts to birds and bats, compensation can be used to mitigate or offset such
impacts, including cumulative impacts. Development of effective compensation
measures should involve the CEQA lead agency, project proponent, wildlife agencies,
and the
affected
public
stakeholders
through
the
CEQA
process.
Because
a project’s
operational fatalities cannot be forecast with precision, lead agencies may be unable to
make some compensation decisions until fatality data have been collected. However, the
general terms and funding commitments for future compensatory mitigation and the
triggers or thresholds for implementing such compensation should be developed prior
to issuing final permits. Early planning for compensatory mitigation provides project
developers with upfront information of mitigation costs and assurance of adequate
funding to fulfill the required mitigation program. Triggers for additional compensatory
mitigation beyond that required at project approval should be well defined, bounded,
and feasible to implement, so the permittee will have an understanding of any potential
future mitigation requirements.
Establish a biologically meaningful nexus between the level of impact and the amount of

7/28/2019 Estudio California CEC 700 2007 008 CMF
http://slidepdf.com/reader/full/estudio-california-cec-700-2007-008-cmf 28/165
certainty in terms of the funds that will be expended and certainty that the mitigation
will continue to provide biological resource value over the life of the project. Consider
the following
list
of
potential
options
in
developing
compensatory
mitigation:
• Offsite conservation and protection of essential habitat
‐ Nesting and breeding areas
‐ Foraging habitat
‐ Roosting or wintering areas
‐ Migratory rest areas
‐ Habitat corridors and linkages
• Offsite conservation and habitat restoration
‐ Restored habitat function
‐ Increased carrying capacity
• Offsite habitat enhancement
‐ Predator control programs
‐ Exotic/invasive species removal
Compensation typically involves purchase of land through fee title or purchase of
conservation easements or other land conveyances and the permanent protection of the
biological resources on these lands. The land or easements can either consist of a newly
established, project
‐specific
purchase
or
be
part
of
a well
‐defined
and
established
conservation program, such as a mitigation bank. Before approving proposed
compensatory mitigation involving mitigation banks or conservation programs, the lead
agencies should determine whether such proposals are consistent with the following
components of CDFG’s official 1995 policy on mitigation programs:
• The mitigation site must provide for the long‐term conservation of the target species
and its habitat.
• The site must be large enough to be ecologically self‐sustaining and/or part of a
larger conservation strategy.
• The site must be permanently protected through fee title and/or a conservation
easement.

7/28/2019 Estudio California CEC 700 2007 008 CMF
http://slidepdf.com/reader/full/estudio-california-cec-700-2007-008-cmf 29/165
• Provisions should be made for the long‐term management of the property after the
project is completed or after all mitigation credits have been awarded for the
mitigation bank.
• Provisions should be made for ensuring implementation of the resource
management plan in the event of non‐performance by the owner of the property or
non‐performance by the mitigation bank owner and/or operator.
• Provisions should be made for the monitoring and reporting on the identified
species/habitat management objectives, with an adaptive management/effectiveness
monitoring to modify those management objectives as needed.
Operations Impact Mitigation and Adaptive Management
Operations impact mitigation and adaptive management generally occur only if the
level of fatalities at a project site was unanticipated when the project was permitted, and
therefore, measures included in the permit are inadequate to avoid, minimize, or
compensate for bird or bat fatalities. Once a project is operating, options for impact
avoidance and minimization are very limited. Therefore, the lead agency and developer
should develop contingency plans to mitigate high levels of unanticipated fatalities before issuing permits. Permit conditions should explicitly establish a range of
compensatory mitigation options to offset unexpected fatalities and the thresholds that
will trigger implementation. In extreme cases, additional compensatory mitigation may
not be adequate for high levels of unanticipated impacts, and project operators may
need to consider operational and facility changes such as habitat modification, seasonal
changes to cut‐in speed, limited and periodic feathering of wind turbines during low‐
wind nights,
seasonal
shutdowns,
or
removal
of
problem
turbines.
Use the adaptive management process as a means of testing these operational and
facility changes as experimental options to determine their effectiveness in reducing
fatalities. Establish the following elements for a successful adaptive management
program: clear, objective, and verifiable biological goals; a requirement to adjust
management and/or mitigation measures if those goals are not met; and a timeline for
periodic
reviews
and
adjustments.
Successful
adaptive
management
requires
a
firm
commitment by project owners to accountability and remedial action in response to new
information that pre‐determined bird and bat fatality thresholds are being exceeded.
This commitment must be included in the permit condition(s) during the permitting
process so that a mechanism is available to implement mitigation recommendations
after the project is permitted Permit conditions should also include language providing

7/28/2019 Estudio California CEC 700 2007 008 CMF
http://slidepdf.com/reader/full/estudio-california-cec-700-2007-008-cmf 30/165
collecting data on bird use at the project site. At a minimum, the primary objectives for
operations monitoring are to determine:
• Whether estimated fatality rates from the pre‐permitting assessment were
reasonably accurate
• Whether the avoidance, minimization, and mitigation measures implemented for
the project were adequate or whether additional corrective action or compensatory
mitigation is warranted
• Whether overall bird and bat fatality rates are low, moderate, or high relative to
other
projects
Operations Monitoring Protocol for Birds and Bats
Study Duration. The duration of operations monitoring should be sufficient to
determine whether pre‐permitting estimates of impacts to birds or bats were reasonably
accurate and to determine whether turbines are causing unanticipated fatalities that
require impact avoidance or mitigation actions. Base the duration and focus of
operations monitoring studies on the availability of existing, site‐specific data; the
species potentially affected; and the magnitude of the anticipated effect. Consult the
CDFG, USFWS, and other knowledgeable scientists and appropriate stakeholders
regarding study protocol and the duration of an operations monitoring program.
Category 2 and 3 projects will need two years of carcass count data to assess whether
pre‐permitting impact estimates were accurate, evaluate the effectiveness of mitigation
measures, and capture variability between years. One year of bird use count data is also
recommended for Category 2 and 3 projects.
Category 1 projects may need only one year of operations monitoring. Reduced
monitoring during the second year might be appropriate for Category 1 projects if the
first year provides scientifically defensible data documenting that fatality rates were as
expected and similar to those from nearby projects.
Assess results of the first year of data to determine whether modifications to the second
year of searches are warranted. For example, the second year of fatality monitoring may
need to focus more effort on turbines or habitat types where impacts were higher than
expected, or less on areas that showed little or no fatalities. Similarly, first year
monitoring results might indicate that a reallocation of study efforts to those seasons

7/28/2019 Estudio California CEC 700 2007 008 CMF
http://slidepdf.com/reader/full/estudio-california-cec-700-2007-008-cmf 31/165
Number of Carcass Search Plots. Search approximately 30 percent of the turbines (the
percent of turbines can vary as appropriate), selecting this subset of turbines either
randomly,
via
stratification,
or
systematically.
The
selection
process
must
be
scientifically defensible and should be developed in consultation with CDFG, USFWS,
and other knowledgeable scientists and appropriate stakeholders.
Search Plot Size. Configure search plots at selected turbine sites so that search width is
equal to the maximum rotor tip height. For example, for a turbine with a rotor tip height
of 400 feet (120 meters), the search area would extend 200 feet (60 meters) from the
turbine on each side. The search area may be a rectangle, square, or circle depending on
turbine locations and arrangements and adjusted as needed to accommodate variations
in terrain and other site‐specific characteristics. Searches beyond boundaries of the
proposed search area may be needed in some situations to make sure they encompass
approximately 80 percent of the carcasses. Consult CDFG, USFWS, and other
knowledgeable scientists and appropriate stakeholders before modifying search plot
size.
Search Protocol. Search for bird and bat carcasses using trained and tested searchers.
Search a standardized transect width of 20 feet (6 meters), the searcher looking at 10 feet
(3 meters) on either side. Adjust the transect width as necessary for vegetation and
topographic conditions on the site. Record and collect all carcasses located in the search
areas (unless they are being used as part of a scavenging trial) and determine a cause of
death, if possible.
Frequency of
Carcass
Searches.
Conduct
searches
approximately
every
two
weeks
for
two years. Search frequency may need adjustment depending on rates of carcass
removal (high scavenging rates warrant more frequent searches), target species, terrain,
and other site‐specific factors. Establish the frequency of carcass searches after analyzing
the results of pilot scavenging trials and in consultation with USFWS, CDFG, and other
knowledgeable scientists and appropriate stakeholders.
Searcher
Efficiency
Trials. Conduct
searcher
efficiency
trials
seasonally
during
operations monitoring. Test each searcher by planting carcasses of species likely to occur
in the project area within the search plots and monitoring searcher detection rates. Geo‐
reference the planted carcasses by global positioning system (GPS) and mark them in a
fashion undetectable to the searcher. Test new searchers when they are added to the
h t

7/28/2019 Estudio California CEC 700 2007 008 CMF
http://slidepdf.com/reader/full/estudio-california-cec-700-2007-008-cmf 32/165
pilot scavenger trials. Where possible, use fresh carcasses of different sized birds and
bats likely to occur in the project.
Bird Metrics. Record bird fatalities per MW of installed capacity per year and bird
fatalities per rotor‐swept square meter per year. Additionally, analyze data from
different bird groups (such as raptors) separately.
Bird Use Counts. For Category 2 and 3 projects, conduct one year of bird use counts
during project operation to characterize bird species composition, abundance, and
behavior. The bird use count methods should be consistent with those used during the
pre‐permitting studies, but can be tailored to specifically address issues that may have
arisen during those studies. Depending on the results of the first year of operation
fatality monitoring, bird use counts may also be needed in the second year. Consult with
experts and appropriate agencies, including CDFG and USFWS, in designing the bird
use surveys during operations and in deciding whether a second year of bird use data
might be needed.
Bat Acoustic
Monitoring. Acoustic monitoring for bats during operations is not
recommended unless data from pre‐permitting surveys or fatality monitoring indicate
information about bat activity is a necessary adjunct to the bat fatality data. Consult with
bat experts and appropriate agencies to determine if acoustic monitoring studies are
warranted during operations.
Monitoring Reports. Follow standard scientific report format in operations monitoring
reports and
provide
sufficient
detail
to
allow
agency
and
peer
reviewers
to
evaluate
the
methods used, understand the basis for conclusions, and independently check
conclusions. Append the tabulated raw data from the carcass counts and bird use
surveys. Monitoring data may be submitted to the CDFG’s Biogeographic Information
and Observation System (BIOS) program, <www.dfg.ca.gov/biogeodata/bios>. Chapter 5
provides details on submittal procedures to BIOS.
When Long-Term Monitoring May Be Appropriate
Upon completion of two years of operations monitoring, CDFG, USFWS, and other
scientists and stakeholders who may have been involved in developing the operations
monitoring protocol should assess whether continued, long‐term monitoring of fatalities
is warranted. Monitoring at some level beyond the second year may be justified if
operations monitoring detects fatalities unexpectedly higher than estimated during pre

7/28/2019 Estudio California CEC 700 2007 008 CMF
http://slidepdf.com/reader/full/estudio-california-cec-700-2007-008-cmf 33/165
due to climate change that might affect collision risk. Permit conditions should include
access to the project site for such long‐term monitoring.

7/28/2019 Estudio California CEC 700 2007 008 CMF
http://slidepdf.com/reader/full/estudio-california-cec-700-2007-008-cmf 34/165

7/28/2019 Estudio California CEC 700 2007 008 CMF
http://slidepdf.com/reader/full/estudio-california-cec-700-2007-008-cmf 35/165
CHAPTER 1: PRELIMINARY SITE
SCREENINGWind energy developers need information to assess the biological sensitivity of the
proposed project site early in the development process. This preliminary information
gathering, or site screening, consists of a reconnaissance field survey and a desktop
effort to collect data about the site from databases, agencies, and local experts. This
information is used to identify species potentially at risk and the impact questions that
must
be
addressed.
Site
screening
is
the
first
step
in
determining
the
kinds
of
studies
developers will need to conduct during the “pre‐permitting” phase to adequately
evaluate a wind project’s impacts to birds and bats.
Site screening information is required to conduct an informed impact analysis under the
California Environmental Quality Act (CEQA) and other state and federal wildlife laws.
Conduct data and information gathering (“desktop effort”) early in the siting and
development process, such as when the wind energy developer is seeking landowner
agreements and investigating transmission capacity. Information compiled and/or
analyzed early in the process allows time for conducting breeding bird surveys or raptor
nest searches and assessing the potential for site use by migrating or wintering species.
Early information gathering also allows the project proponent the opportunity to seek a
different site if unavoidable impacts seem likely despite careful turbine siting.
Reconnaissance Site Visit
Once the landowner has granted permission to access the proposed wind energy site,
arrange for a qualified wildlife biologist who is knowledgeable about the biology of
birds and bats in the region to conduct a reconnaissance survey of the site. The biologist
should prepare for the survey by securing recent, available aerial photography of the
site. Surveys should be of sufficient duration and intensity to allow coverage of all
habitat types in and immediately adjacent to the project area and provide a basis for
predictions about species occurrence at the site throughout the year.
Databases for Gathering Site Information
The following databases are useful sources of information for site screening.

7/28/2019 Estudio California CEC 700 2007 008 CMF
http://slidepdf.com/reader/full/estudio-california-cec-700-2007-008-cmf 36/165
occurrence in a specific area to infer absence of special‐status species. It is also important
to evaluate known occurrences of sensitive species and habitats near the site and in
comparable adjacent areas. Conduct the CNDDB search in the eight U.S. Geological
Service (USGS) quadrangles surrounding the quadrangles in which the project area is
located.
CDFG’s California Wildlife Habitat Relationships (CWHR) system,
<www.dfg.ca.gov/bdb/html/wildlife_habitats.html>, contains life history, geographic
range, habitat relationships, and management information for 692 regularly occurring
species of amphibians, reptiles, birds, and mammals in the state. CWHR is a
community‐level matrix model associating the wildlife species to a standardized habitat
classification scheme and rates suitability of habitats for reproduction, cover, and
feeding for each species.
The CDFG Biogeographic Information and Observation System (BIOS) is a data
management system designed to explore the attributes and spatial distribution of
biological organisms and systems studied by CDFG and partner organizations. BIOS
integrates geographic information systems, relational database management, and
Environmental Systems Research Institute’s ArcIMS (Integrated Map Server) technology
to create a statewide, integrated information management tool. Public users can access
BIOS at <www.dfg.ca.gov/biogeodata/bios>. BIOS and CNDDB are complementary
systems; users should consult the table at
<www.dfg.ca.gov/biogeodata/cnddb/compare_cnddb_bios.asp> to determine which
database to use. Chapter 5 discusses the utility of BIOS as a repository for wind‐related
wildlife data.
The National Agriculture Imagery Program (NAIP) was designed to provide the U.S.
Department of Agriculture with current digital orthophotography images. These images
are high quality and available for the entire state of California and, therefore, may be
used for a variety of environmental assessments. California NAIP imagery is currently
available in two forms—one‐meter digital orthophoto quarter quads and county
compressed
mosaics—and
can
be
found
online
at
<http://gis.ca.gov/>.
The
California
Spatial Information Library (CaSIL) freely distributes California NAIP aerial imagery.
CaSIL, the California Resources Agency, and the State of California are 2005 California
NAIP funding partners.
Federal and State Agencies as Resources

7/28/2019 Estudio California CEC 700 2007 008 CMF
http://slidepdf.com/reader/full/estudio-california-cec-700-2007-008-cmf 37/165
both as a source of information about special‐status biological resources and as a way to
communicate with those CDFG biologists who might be involved in the CEQA review
of the project. In addition, early consultation with both CDFG and U.S. Fish and Wildlife
Service (USFWS) will assist project proponents in determining the applicability of other
state and federal laws, including California Endangered Special Act (CESA), Federal
Endangered Species Act (FESA), and Department of Fish and Game Code sections
dealing with bird, bat, and raptor protection. Appendix A provides contact information
for the seven CDFG regional offices and headquarters.
The USFWS has developed lists of federally Threatened, Endangered, and candidate
species arranged by county or USGS quadrangle that are available from the Ecological
Services Offices (see Appendix B for Ecological Services Office contact information). The
USFWS also periodically identifies birds that are high priorities for conservation action,
<www.fws.gov/migratorybirds/reports/bcc2002.pdf>. USFWS biologists can also offer
information about listed species and designated critical habitat. Coordinate early with
USFWS biologists to identify potential impacts to federally listed and migratory species
that are high priorities for conservation.
Local Experts and Other Resources
Other helpful sources of information include contacts with biologists familiar with the
area, including staff from universities, colleges, bird observatories, and Audubon
chapters, <www.audubon.org/states/index.php?state=CA>, as well as local birders and
bat experts. National Audubon Society Christmas bird count data,
<www.audubon.org/bird/cbc>, and North American Breeding Bird Survey data,
<www.mbr‐pwrc.usgs.gov/bbs/>, can provide useful information about species and
abundance of birds during winter and spring in portions of California. Audubon
California has mapped approximately 150 areas in the state that it considers “Important
Bird Areas,” <www.audubon‐ca.org/IBA.htm>. Cities and counties may also have
adopted wind energy ordinances or elements that may contain useful information on
local bird and bat populations.
Evaluating Data from Nearby Wind Energy Facili tiesIf the proposed site is near one or more existing wind energy facilities, a biologist should
critically review the available pre‐permitting and operational studies completed for the
nearby facilities and compare the conclusions with results of the operational monitoring
data at those sites A site visit is also essential to determine if biological conditions at the

7/28/2019 Estudio California CEC 700 2007 008 CMF
http://slidepdf.com/reader/full/estudio-california-cec-700-2007-008-cmf 38/165
related wildlife data to BIOS, as described in Chapter 5, will facilitate such assessments
and the general accessibility of biological data from nearby wind energy facilities.
Regardless of the category into which a project is placed, study plans for pre‐permitting
and operations monitoring will have to be tailored specifically to the unique
characteristics of each site. Developing a detailed pre‐permitting study plan involves
asking questions about the potential for birds and bats to occur at the site, how birds and
bats might use the site, and whether they might be at risk from wind turbine collisions.
Pre‐permitting studies will provide the basis for an impact assessment and subsequent
recommendations for micrositing or other impact avoidance, minimization, or
mitigation measures. Consider the following questions when assessing the potential for
birds and bats to occur at the site, making a preliminary evaluation of collision risk, and
designing the pre‐permitting studies discussed in Chapter 3.
1. Are any of the following known or likely to occur on or near the proposed
project site? (“Near” refers to a distance that is within the area used by an animal
in the course of its normal movements and activities.)
a. Species listed as federal or state “Threatened” or “Endangered” (or candidates
for such listing)?
b. Special‐status bird or bat species?
c. Fully protected bird species?
2. Is the site near a raptor nest, or are large numbers of raptors known or likely to
occur at or near the site during portions of the year?
3. Is the site near important staging or wintering areas for waterfowl, shorebirds, or
raptors?
4. Are colonially
breeding
species
(for
example,
herons,
shorebirds,
seabirds)
known or likely to nest near the site?
5. Is the site likely to be used by birds whose behaviors include flight displays (for
example, common nighthawks, horned larks) or by species whose foraging
tactics put them at risk of collision (for example, contour hunting by golden
eagles)?
6. Does the site or do adjacent areas include habitat features (for example, riparian
habitat, water bodies) that might attract birds or bats for foraging, roosting,
breeding, or cover?
7. Is the site near a known or potential bat roost?
8. Does the site contain topographical features that could concentrate bird or bat
movements (for example, ridges, peninsulas, or other landforms that might
f l bi d b t t)? I th it k lik l i t

7/28/2019 Estudio California CEC 700 2007 008 CMF
http://slidepdf.com/reader/full/estudio-california-cec-700-2007-008-cmf 39/165
A “yes” answer to question #1 should prompt early and close consultation with CDFG
and USFWS to develop a study plan that addresses potential impacts of constructing
and operating the project on listed or special‐status species. Advance planning is needed
in particular for studies with a seasonal component (for example, nest searches or
evaluating potential bat hibernacula). Allow ample time for planning field evaluations
when special‐status species are involved because survey protocols for a number of listed
and special‐status species specify a limited window of time during which surveys must
be conducted.
“Yes” answers to questions #2 through #6 call for further investigation with the
techniques described in Chapter 3. The standardized bird use counts discussed in
Chapter 3 provide methods to assess the species composition and seasonal relative
abundance of birds present in the vicinity of proposed wind turbine sites, but additional
studies might also be needed to further investigate these questions. For example, a
project proponent may want to intensify the level of survey effort in the vicinity of
raptor nests, breeding colonies, or habitat elements (riparian habitat, stands of trees in
otherwise treeless areas) that might attract birds or bats. Such studies would provide
information to determine whether a non‐disturbance buffer might be warranted in the
vicinity of the sensitive feature, determine the appropriate size of the buffer zone, and
develop appropriate compensatory mitigation.
“Yes” answers to questions #7 through #9 should prompt consultation with CDFG,
USFWS, and scientists with expertise in migratory birds and bat biology. The nocturnal
survey methods described in Chapter 3 discuss techniques to assess nocturnally active
species in
the
project
area.
“No” answers to these questions might indicate that a more limited site evaluation is
warranted, but exercise caution before assuming a site will not result in high impacts to
birds and bats based solely on preliminary site screening

7/28/2019 Estudio California CEC 700 2007 008 CMF
http://slidepdf.com/reader/full/estudio-california-cec-700-2007-008-cmf 40/165

7/28/2019 Estudio California CEC 700 2007 008 CMF
http://slidepdf.com/reader/full/estudio-california-cec-700-2007-008-cmf 41/165
CHAPTER 2: CEQA, WILDLIFE PROTECTION
LAWS, AND THE PERMITTING PROCESSNumerous regulatory requirements and wildlife protection laws govern the permitting
process for locating a wind energy project. Approached individually, these regulatory
requirements may seem daunting to wind energy project developers. Therefore, this
chapter intends to clarify the permitting process and offer suggestions for successfully
completing the process and conforming to all appropriate laws and regulations by:
• Providing an
understanding
of
the
regulatory
framework
of
environmental
laws
and processes that govern project siting and permitting
• Providing an understanding of the agencies and other stakeholders that should
be engaged in these processes
• Encouraging consistent use of pre‐permitting assessment methods recommended
in these Guidelines to secure information on impacts and mitigation that will
apply both to the CEQA review and permitting process and wildlife protection
laws
Initiating the Permitting Process
In California, it is primarily the local agencies that handle the permitting process for
wind energy facilities under the mandates of their various land use authorities.
Discretionary decisions by local agencies to permit wind energy projects trigger the
application of
CEQA
requirements
to
the
permitting
process.
The
permitting
process
usually begins with the project developer approaching the county or other local public
agency responsible for issuing a land use permit. Typically this agency becomes the
“lead agency” under CEQA. CEQA provides direction on assessment of the significance
of impacts and the development of feasible mitigation, but the county or responsible
public agency may have its own resource standards as well. Contact the local agency
early in the process to determine whether it has its own standard conditions for
addressing specific resource policies that apply to bird and bat issues.
Wind energy facilities which have potential for take of state‐listed Threatened or
Endangered species may require an additional permit under the California Endangered
Species Act (CESA). If the affected species are also federally listed, the facilities may also
i it d FESA

7/28/2019 Estudio California CEC 700 2007 008 CMF
http://slidepdf.com/reader/full/estudio-california-cec-700-2007-008-cmf 42/165
Other state and federal protective wildlife laws, some of which mandate avoidance of
“take”3 without options for permitting, can also influence project siting and operations.
Project developers, permit decision makers, and the resource agencies involved should
consider these strict liability laws during the permitting process to ensure that impacts
to bird and bat species are minimized and mitigated to offset impacts. Implementing the
methods recommended in the Guidelines during the permitting process will demonstrate
a good faith effort to develop and operate projects in a fashion that is consistent with the
intent of these state and federal wildlife protection laws. Such good faith efforts will be
considered by CDFG before taking enforcement actions for violation of a California
wildlife protection law.
Involving and Communicating with Regulatory Agenciesand Stakeholders
Timely and thorough pre‐permitting assessment surveys are essential to facilitate the
permitting process. The developer should contact landowners; local environmental
groups; and local, state, and federal wildlife management agencies such as CDFG and
USFWS
early
in
the
permitting
process.
Pre‐
permitting
discussions
with
these
groups
may provide critical information on which to base site development decisions. There
may be an existing science advisory committee that has been involved with a nearby
wind resource area and that can provide information on bird and bat issues of local
concern. Local environmental groups and wildlife agencies may have relevant
information as well as concerns about special‐status birds or bats. Early discovery of
these issues can give the project developer a glimpse of the type and timing of surveys
that may be necessary. Early discussion of proposed survey protocols also will allow for
an evaluation of the level and timing of the effort in relation to project milestones such
as the desired construction start date.
Further, initiating assessment surveys early will help to avoid unnecessary and costly
delays during permitting. These early assessment surveys will facilitate the necessary
detailed analysis by the CEQA lead agency, responsible agencies such as CDFG, and
public stakeholders and should increase the speed of the permitting process. If review
under the National Environmental Policy Act (NEPA) as well as CEQA is required, then
efficient coordination of the combined CEQA/NEPA process can prevent redundancies
and ensure complete coverage of the joint review requirements.
Early identification of potential adverse impacts provides more opportunities for

7/28/2019 Estudio California CEC 700 2007 008 CMF
http://slidepdf.com/reader/full/estudio-california-cec-700-2007-008-cmf 43/165
project has begun. Finding suitable habitat for compensatory mitigation, if necessary,
can be time consuming; early and thorough data collection and analysis will aid this
process. Inadequate data acquisition may cause a lead agency to deny a permit, and if
potential impacts to listed species are of concern, may also prompt wildlife agencies to
apply more stringent impact avoidance, minimization, or mitigation measures and
operations monitoring requirements to ensure species protection.
Establishing Permit Conditions and Compliance
The CEQA lead agency and project proponent should consult frequently with CDFG
and
USFWS
throughout
the
impact
analysis
and
mitigation
development
process
and
particularly during development of permit conditions. Lead agencies should structure
permit conditions to clearly define the obligations of the operator and to solidly establish
triggers for additional mitigation beyond that required upon project approval. For
example, the permit could specify a range of expected impacts based on pre‐permitting
studies and existing data from other wind energy projects; requirements for additional
compensatory mitigation, described in the permit, would be triggered if operations
monitoring data revealed impacts in excess of the expected range. Compliance with
mitigation and operations monitoring requirements, as well as all other conditions of the
permit, are equally important after permits are issued.
Navigating CEQA Requirements and Local, State, andFederal Laws
The California Environmental Quality Act, or CEQA, governs how California counties,
cities, and
other
government
entities
evaluate
environmental
impacts
in
making
discretionary permitting decisions for wind energy development. The CEQA process is
key to achieving environmental compliance for a project, but all parties involved in
planning pre‐construction surveys should be aware that following the CEQA Guidelines
alone may not highlight all of the species and issues that need evaluation. A single,
coherent analysis of impacts to biological resources sets the stage for both CEQA
analysis and agency review of permit applications. To streamline the permit application
process,
consider
other
state
and
federal
wildlife
protection
laws,
discussed
below,
early
in the process and integrate them into the pre‐permitting study design. For example,
species at potential risk that are fully protected or that fall under the protection of the
federal Migratory Bird Treaty Act should be included in surveys, whether or not such
studies might be required to assess CEQA significance. Initiating timely and thorough

7/28/2019 Estudio California CEC 700 2007 008 CMF
http://slidepdf.com/reader/full/estudio-california-cec-700-2007-008-cmf 44/165
County Ordinances / Regulations
Some California counties have adopted wind resource elements as part of their general
plans and/or
wind
energy
zoning
ordinances.
County
siting
elements
and
zoning
ordinances govern the areas in which wind projects may or may not be located, with
restrictions to agricultural zones being a common theme. The ordinances generally
specify standards for setbacks, height, noise, safety, aesthetics, and other requirements.
Most county general plans specify that the processing of discretionary energy project
proposals shall comply with CEQA and direct that the environmental impacts of a
project must be taken into account as part of project consideration. Typically, general
plans
also
direct
planning
staff
to
work
with
local,
state,
and
federal
agencies
to
ensure
that energy projects (both discretionary and ministerial) avoid or minimize direct
impacts to fish, wildlife, and botanical resources, wherever practical. Some county
ordinances include language regarding assessment of impacts to birds and bats, but,
currently, none provide specific guidance on studies necessary for assessing significance
of impacts to bird and bat populations or provide direction for monitoring programs
and feasible mitigation options.
State Laws
California Environmental Quality Act
The California Environmental Quality Act (CEQA) requires lead agencies—that is, those
making land use decisions—as well as any other responsible state agencies issuing
discretionary permits, to evaluate and disclose the significance of all potential
environmental impacts of a project. The lead agency is also responsible for
implementing feasible impact avoidance, minimization, or mitigation measures that reduce and compensate for significant environmental impacts with the goal of reducing
those impacts to less than significant levels. Lead agencies determine significance on a
project‐ by‐project basis because they must consider all potential risk, including
cumulative impacts, within a local and regional context, as well as evaluate unique
factors particular to the project area when exercising their discretion to approve or
disapprove a project.
The CEQA Guidelines4 specify that a project has a significant effect on the environment
if, among other things, it has the potential to “substantially degrade the quality of the
environment; substantially reduce the habitat of a fish or wildlife species; cause a fish or
wildlife population to drop below self‐sustaining levels; threaten to eliminate a plant or

7/28/2019 Estudio California CEC 700 2007 008 CMF
http://slidepdf.com/reader/full/estudio-california-cec-700-2007-008-cmf 45/165
The Environmental Checklist Form in the CEQA Guidelines, Appendix G, states that
impacts to biological resources are considered “significant” if, among other things, a
proposed project will:
• Have a substantial adverse effect, either directly or through habitat modifications,
on any species identified as a candidate, sensitive, or special‐status species in local
or regional plans, policies, or regulations, or by CDFG or USFWS
• Have a substantial adverse effect on any riparian habitat or other sensitive natural
community identified in local or regional plans, policies, or regulations by CDFG or
USFWS
• Interfere substantially with the movement of any native resident or migratory fish
or wildlife species or with established native resident or migratory wildlife
corridors, or impede the use of native wildlife nursery sites
CEQA defines three types of impacts, all of which must be evaluated for each wind
energy project:
• “Direct or primary effects which are caused by the project and occur at the same
time and place“ (CEQA Guidelines §15358[a][1])
• “Indirect or secondary effects which are caused by the project and are later in time
or farther removed in distance, but are still reasonably foreseeable. Indirect or
secondary effects may include growth‐inducing effects and other effects related to
induced changes in the pattern of land use, population density, or growth rate, and
related effects on air and water and other natural systems, including ecosystems“
(CEQA Guidelines
§15358[a][2])
• “The cumulative impact from several projects is the change in the environment
which results from the incremental impact of the project when added to other
closely related past, present, and reasonably foreseeable probable future projects.
Cumulative impacts can result from individually minor but collectively significant
projects taking place over a period of time” (CEQA Guidelines §15355[b])
The CEQA
documentation
for
a project
typically
takes
the
form
of
an
Environmental
Impact Report (EIR), a mitigated negative declaration, or a negative declaration. It might
also be considered a categorical exemption, depending on the results of the initial study
undertaken for a project. These three categories of analysis are described below:
• EIRs are required under CEQA when there is substantial evidence in light of the

7/28/2019 Estudio California CEC 700 2007 008 CMF
http://slidepdf.com/reader/full/estudio-california-cec-700-2007-008-cmf 46/165
on proposed projects to reduce identified impacts to less than significant levels prior
to approval.
• Categorical exemptions
are
a list
of
classes
of
projects
which
the
secretary
of
the
resources agency has determined do not have a significant effect on the
environment (PRC §21084; CEQA Guidelines sections 15300 et seq.). Exceptions to
the exemptions due to a project’s location in a sensitive environment or due to
cumulative impact may still require a project to complete the CEQA review process
(PRC §21084; CEQA Guidelines sections 15300.2).
The Guidelines
does
not
provide
recommendations
about
deciding
the
CEQA
status
of
a
proposed wind energy project or whether an EIR or negative declaration is appropriate
for particular categories of project. Lead agencies need to make such decisions for each
project based on their own judgment, experience, and interpretation of CEQA
Guidelines.
Fish and Game Code Wildlife Protection Laws
In the broadest sense, CEQA and Fish and Game Code require that government agencies
develop standards and procedures necessary to maintain, protect, restore, and enhance
environmental quality, including fish and wildlife populations and plant and animal
communities, to ensure that projects are consistent with the intent of these laws.
For wind energy projects subject to CEQA, lead agencies are required to consult with
CDFG, pursuant to CEQA Guidelines section 15086. CDFG uses its biological expertise
to review and comment upon impacts to wildlife arising from the project and will make
recommendations regarding the protection of those resources it holds in trust for the
people of California. In addition, CDFG reviews and comments on environmental
documents and impacts arising from project activities (Fish and Game Code §1802).
CDFG is considered a trustee agency under CEQA Guidelines section 15386.
CDFG does not approve or disapprove a wind energy project as a trustee agency in the
CEQA process but does have authority to regulate activities that implicate one of the
statutes that CDFG administers. CDFG and the Energy Commission encourage the use
of the Guidelines for the biological assessment, mitigation, and monitoring of wind
energy development projects and wind turbine repowering projects in California. The
CDFG is aware that wind energy projects may result in bird and bat fatalities despite
avoidance and minimization measures. For projects that impact listed species, project

7/28/2019 Estudio California CEC 700 2007 008 CMF
http://slidepdf.com/reader/full/estudio-california-cec-700-2007-008-cmf 47/165
This document only relates to bird and bat species, but a wind energy project may
impact special‐status species other than birds or bats. These impacts must also be
analyzed, and in some cases treated as significant, as part of CEQA. Construction‐
related impacts at wind energy facilities which affect listed ”Threatened” and
“Endangered” species and other wildlife may also (and often do) trigger state and
federal permit requirements.
When CDFG is required to make a discretionary decision to permit a project under its
regulatory authority, CDFG must also comply with CEQA in the issuance of these
permits and other project approvals. When the project CEQA document is developed in
consultation with CDFG and fully addresses the related resource impacts and
mitigation, CDFG can use the document as a basis for CEQA compliance, thereby
accelerating any subsequent permit processes.
In addition to CDFG’s responsible and trustee role in the CEQA process, direct
consultation with CDFG is required to ensure that a proposed project will meet the
intent of Fish and Game Code statutes for the protection of wildlife species. Several
California Fish
and
Game
Code
sections
that
relate
to
protection
of
avian
wildlife
resources and are relevant to wind energy projects are described below.
• California Endangered Species Act (CESA), 1984 – Fish and Game Code section 2050
et seq. Species that are protected by the state (listed as Endangered, Threatened, or
as a candidate) cannot be taken without an Incidental Take Permit (ITP) provided
by CDFG or other document authorized by CESA. “Take” is defined in section 86 of
the Fish and Game Code as “hunt, pursue, catch, capture, or kill (and attempts to do
so).” CESA allows for permitted take incidental to otherwise lawful development projects if all standards in section 2081(b) of the Fish and Game Code are met. In
issuing an ITP, CDFG typically requires additional impact avoidance, minimization,
or mitigation measures beyond those that may be imposed pursuant to CEQA to
ensure that project impacts are minimized and fully mitigated. The issuance of an
ITP is a discretionary action by CDFG. When issuing a CESA Incidental Take
Permit, CDFG must itself also comply with CEQA. The following link provides
access to
the
full
statute:
<www.dfg.ca.gov/hcpb/ceqacesa/cesa/incidental/cesa_policy_law.shtml>.
• Fully Protected Species, Fish and Game Code sections 3511, 4700, 5050, and 5515 –
California identifies 13 species of birds as fully protected, including five raptors
(American peregrine falcon California condor golden eagle southern bald eagle

7/28/2019 Estudio California CEC 700 2007 008 CMF
http://slidepdf.com/reader/full/estudio-california-cec-700-2007-008-cmf 48/165
protected cannot receive a take authorization under CESA. Presence of fully
protected species will require close coordination with CDFG to ensure impacts are
minimized.
• Migratory Birds, Fish and Game Code section 3513 – This section protects
California’s migratory birds by making it unlawful to take or possess any migratory
non‐game bird as designated by the federal Migratory Bird Treaty Act, except as
authorized in regulations adopted by the federal government under provisions of
the Migratory Bird Treaty Act.
• Birds of Prey and Their Eggs, Fish and Game Code section 3503.5 – It is unlawful to
take, possess,
or
destroy
any
birds
in
the
orders
Falconiformes
or
Strigiformes
(birds
‐
of‐prey) or to take, possess, or destroy the nest or eggs of any such bird except as
otherwise provided by this code or any regulation adopted pursuant thereto.
• Unlawful Sale or Purchase of Exotic Birds, Fish and Game Code section 3505 – It is
unlawful to take, sell, or purchase any aigrette or egret, osprey, bird of paradise,
goura, numidi, or any part of such a bird.
• Nongame Birds, Fish and Game Code section 3800 (a) – All birds occurring
naturally in California that are not resident game birds, migratory game birds, or
fully protected birds are nongame birds. It is unlawful to take any nongame bird
except as provided in this code or in accordance with regulations of the Fish and
Game Commission or, when relating to mining operations, a mitigation plan
approved by CDFG.
Federal Laws
The following federal laws apply to protecting wildlife from impacts from wind energy
development.
• The National Environmental Policy Act (NEPA) is similar to CEQA, governing how
federal actions that may result in environmental impacts are evaluated. NEPA (42
USC 4321, 40 CFR 1500.1) applies to any action that requires permits, entitlements,
or funding from a federal agency; is jointly undertaken by a federal agency; or is
proposed on federal land. Specifically, all federal agencies are to prepare detailed
Environmental Impact Statements assessing the environmental impact of, and
alternatives to, major federal actions significantly affecting the environment. The
law applies to federal agencies and the programs that they fund, including projects
for which they issue permits. An example of a wind development project falling
d EPA d ld b h d l f d b

7/28/2019 Estudio California CEC 700 2007 008 CMF
http://slidepdf.com/reader/full/estudio-california-cec-700-2007-008-cmf 49/165
• Federal Endangered Species Act (FESA), 1973, Title 16, U.S. Code section 1531 –
FESA protects 18 bird species/subspecies listed as Threatened or Endangered in
California. No bats are currently listed as Threatened or Endangered in California.
FESA prohibits the take of protected animal species, including actions that “harm”
or “harass”; federal actions may not jeopardize listed species or adversely modify
habitat designated as critical. FESA authorizes permits for the take of protected
species if the permitted activity is for scientific purposes, is to establish
experimental populations, or is incidental to an otherwise legal activity.
• Migratory Bird Treaty Act (MBTA), 1918, Title 16, U.S. Code sections 703 to 712 –
MBTA prohibits the take, killing, possession, transportation, and importation of
migratory birds, their eggs, parts, and nests, except when specifically authorized by
USFWS. At least 603 migratory bird species have been recorded in California. The
MBTA authorizes permits for some activities, including but not limited to scientific
collecting, depredation, propagation, and falconry. No permit provisions are
available for incidental take for any project‐related incidental take, including take
associated with wind energy development. Only criminal penalties are possible,
with violators subject to fine and/or imprisonment.
• Bald and Golden Eagle Protection Act, 1940, Title 16, U.S. Code section 668 – This
law provides for the protection of the bald eagle and the golden eagle by
prohibiting, except under certain specified conditions, the take, possession, and
commerce of such birds. The law does not allow for any project‐related take,
including that associated with wind energy development projects. The 1972
amendments increased penalties for violating provisions of the act or regulations
issued pursuant thereto and strengthened other enforcement measures. Rewards
are provided for information leading to arrest and conviction for violation of the act.
Like the California laws, the latter three strict‐liability federal wildlife protection laws
prohibit most instances of take, although each law provides for exceptions, such as for
scientific purposes. FESA authorizes USFWS to permit some activities that take a
protected species as long as the take meets several requirements, including a
requirement that the take be incidental to an otherwise legal activity. Permits may be
issued under FESA to a federal permitting agency, or developers may seek an Incidental Take Permit under FESA for facilities sited on private land or where no federal funding
is used or no other federal permit is required. The MBTA and the Bald and Golden Eagle
Protection Act also allow permits for take, but incidental take of migratory birds is not
allowed Under all three statutes unauthorized take may be penalized even if the

7/28/2019 Estudio California CEC 700 2007 008 CMF
http://slidepdf.com/reader/full/estudio-california-cec-700-2007-008-cmf 50/165

7/28/2019 Estudio California CEC 700 2007 008 CMF
http://slidepdf.com/reader/full/estudio-california-cec-700-2007-008-cmf 51/165
CHAPTER 3: PRE-PERMITTING
ASSESSMENTThis chapter provides guidance on collecting biological information to assess the
potential direct and indirect impacts to birds and bats at proposed wind energy
development sites and to develop impact avoidance, minimization, or mitigation
measures. The chapter includes recommendations on developing a scientific pre‐
permitting study and assessing the level of effort required for such studies. Finally, the
chapter describes the study methods available for bird and bat field studies and
recommended protocols for using the methods.
Framework for Determining Bird and Bat Study Effort
With information from the preliminary site assessment, proposed project sites can be
grouped into one of four categories to provide a general framework to assist in
determining whether there should be any deviation from the standardized duration and
intensity of study needed for pre‐permitting and operations monitoring. Assigning
projects to categories may not always be a clear‐cut process, and projects may shift from
one category to another as information from the pre‐permitting studies either reveals
unanticipated issues or resolves expected concerns about potential impacts. In deciding
how to categorize a proposed project and when proposing to deviate from the
standardized monitoring level, consult with the CEQA lead agency, USFWS, CDFG,
biologists with specific expertise, and other appropriate stakeholders. Base the duration
and focus of pre‐permitting studies on the availability of site‐specific, baseline data
needed to answer impact questions; the species potentially affected; and the magnitude
of the anticipated effect.
Category 1 – Project Sites with Available Wind-Wildlife Data
Some proposed projects have the advantage of an existing foundation of data on bird
and bat use and potential impacts from nearby similar projects. For Category 1 projects
that have at least one year of information on use of a site by resident and migratory
species, as well as credible mortality data, reduced pre‐permitting study effort may be
appropriate. Category 1 might be appropriate for repowering projects and for other
projects surrounded by or near existing wind energy facilities that have been studied
sufficiently and for which there is little uncertainty as to the level of impact. Factors to
consider in determining whether or not data from an adjacent facility would allow a
Wh th th d t i tifi ll d f ibl d till l t

7/28/2019 Estudio California CEC 700 2007 008 CMF
http://slidepdf.com/reader/full/estudio-california-cec-700-2007-008-cmf 52/165
• Whether the data are scientifically defensible and still relevant
Consultation with the lead agency, USFWS, CDFG, biologists with specific expertise,
and other appropriate stakeholders (such as a conservation organization representative)
is recommended when considering whether a project qualifies as Category 1. Caution is
warranted in extrapolating existing data to unstudied nearby sites. Slight topographical
or habitat variations can make substantial differences in bird and bat site use and
potential impacts. In addition, technological changes including use of large turbines,
variations in turbine design or layout, increased operating times, and use of different
lighting may require new or additional data gathering. Pre‐permitting studies for
Category 1 projects should focus on information gaps and particular species of concern, if any, and the cumulative impact analysis should address the effects of the proposed
project combined with surrounding sites. These studies should build upon and expand
existing data about those species from nearby wind resource areas.
Category 2 – Project Sites with L ittle Exist ing Information andNo Indicators of High Wildl ife Impacts
Category 2 projects have no obvious “red flags” that emerge from the preliminary site assessment (for example, “red flags” might include known occurrences of special‐status
species or high levels of fatalities at nearby wind facilities) and no substantial body of
information from nearby projects that could provide information for an impact
assessment. Pre‐permitting surveys should last a minimum of one year for Category 2
projects to document how birds and bats use a site during spring, summer, fall, and
winter.
Pre‐permitting and operations monitoring may indicate that some project sites may
require additional study duration or specific study protocols focused upon a certain
species or type of impact. Caution is warranted in concluding that a project will have
low impacts to bats based on preliminary site screening data because currently little is
known about the range and distribution of California bat populations, their migratory
routes, and population variation from year to year.
Category 3 – Project Sites with High or Uncertain Potential for Wildlife Impacts
Projects with high levels of bird and/or bat use or considerable uncertainty regarding
bird and bat use or risk will need more study than Category 2 projects to help
which little information is available on bird and bat use and potential risk might also be

7/28/2019 Estudio California CEC 700 2007 008 CMF
http://slidepdf.com/reader/full/estudio-california-cec-700-2007-008-cmf 53/165
which little information is available on bird and bat use and potential risk might also be
appropriately included in Category 3.
For some Category 3 projects one year of data may not adequately characterize the
relative abundances of some bird and bat species at a project site because of high
variability in seasonal populations from year to year. For example, in California’s
Central Valley, wintering populations of rough‐legged hawks, short‐eared owls, sandhill
cranes, and many waterfowl species can vary considerably from year to year depending
on weather conditions in the northern portions of their ranges (Hejl and Beedy, 1986;
Garrison, 1993; Schlorff, 1994).
The number and size of turbines and the extent of the area covered by the project may
also influence the need for more or less study because as the number of turbines
increases, the magnitude of the potential impact to bird and bat populations will also
increase. Development of numerous projects over large geographical areas (such as a
new wind resource area) or those that cover a heterogeneous mix of habitats and terrain
may need additional specialized or multi‐year studies if these areas have never been
surveyed. Such
large
‐scale
studies
may
be
best
addressed
with
a collaborative
research
approach that encompasses a number of different projects within a region.
Category 4 – Project Sites Inappropriate for Wind Development
Wind development should not be considered on land protected by local, state, or federal
government, such as designated wilderness areas, national parks or monuments, state
parks, regional parks, and wildlife or nature preserves. Some projects for which
preliminary
information
gathering
or
existing
data
indicates
potential
for
unacceptable
risk of bird or bat fatalities might also be appropriately classified as Category 4,
particularly if no feasible avoidance or mitigation measures are available to reduce
impacts. If such a project moves forward despite indications that high levels of bird or
bat fatalities might occur, operations avoidance and minimization options to reduce the
impacts are limited, and the project may require costly, ongoing reassessment of impacts
and adjustment of mitigation.
For all categories of projects, recommendations to conduct more or less than one year of
pre‐permitting surveys should be accompanied by a well‐supported rationale and
justification for the recommendation. The burden of proof for providing that justification
rests with the party advocating the deviation from the standardized pre‐permitting
ff
scientists and from interested parties Lead agencies generally rely on experts hired by

7/28/2019 Estudio California CEC 700 2007 008 CMF
http://slidepdf.com/reader/full/estudio-california-cec-700-2007-008-cmf 54/165
scientists and from interested parties. Lead agencies generally rely on experts hired by
the project proponent and on biologists from USFWS and CDFG when they evaluate the
pre‐permitting study design, assess impacts, or establish permit conditions for
operations monitoring protocol and mitigation. Most scientific questions arising on
wind energy development project can be resolved with input from these scientists, but
for some projects, lead agencies may want additional scientific input and opinions from
recognized experts and researchers in the field of wind‐energy and wildlife interactions.
To provide this resource to lead agencies, the Energy Commission is working with the
CDFG to establish a statewide standing science advisory committee. The committee
would be available to lead, state, and federal agencies seeking expert advice on data
interpretation, study design recommendations, and other scientific issues relating to the
permitting of a wind energy project. Occasionally lead agencies may have information
needs that require input from a scientist with a specific subject‐matter expertise not
represented on the standing committee or a familiarity with a specific regional or local
issue(s). In these unique circumstances, the Energy Commission and the CDFG would
work with the lead agency to ensure that appropriate members are included in the
standing science
advisory
committee.
The
science
advisory
committee
would
function
solely as an advisory body; lead agencies are under no obligation to consult the science
advisory committee for any wind energy development project or to accept advice
received from the committee.
Committee members would include only those scientists who are widely recognized by
their peers for their technical expertise, objectivity, and professionalism and who have
demonstrated their commitment to keeping current in the field of wind‐wildlife research
nationwide and in California. Members should also have experience with designing and
conducting studies on the effects of wind development on wildlife and be free from
conflict of interest relevant to the proposed committee tasks. The Energy Commission
and the CDFG will provide opportunities for all interested parties to have input in
establishment of the science advisory committee.
Study Objectives and Design
Development of a pre‐permitting study begins with a clear identification of the impact
questions that must be addressed, and then establishing a study design appropriate for
answering those questions, including sampling units, parameters, metrics
(measurements), and specific methods to employ.
Study objectives will vary from site to site but key issues on most wind energy projects
7/28/2019 Estudio California CEC 700 2007 008 CMF
http://slidepdf.com/reader/full/estudio-california-cec-700-2007-008-cmf 55/165
Study objectives will vary from site to site, but key issues on most wind energy projects
in California will typically include at least the following questions:
• Which
species
of
birds
and
bats
use
the
project
area,
and
how
do
their
numbers
vary throughout the year?
• How much time do birds and bats spend in the risk zone (rotor‐swept area), and
does this vary by season?
• What is the estimated range of bird and bat fatalities from the project, and how
does bird/bat use of the site compare to use data from other wind power sites
that also have fatality information?
• What potential design and mitigation measures could reduce impacts?
• What pre‐permitting data are needed for an operations monitoring impact
assessment?
Answering these questions can involve a variety of diurnal and nocturnal bird survey
techniques as well as bat survey methods. The bird use count to assess bird species
composition and
seasonal
relative
abundance
is
one
of
the
most
commonly
used
bird
survey methods. Acoustic monitoring is currently the most frequently used method to
assess species composition and activity levels of bats. Other techniques include raptor
nest searches, which should be conducted on most wind energy development projects in
California, and a variety of less frequently used methods such as small bird counts, area
searches, migration counts, radar, mist‐netting, and visual imaging. Some of these
additional methods may be useful depending on the particular concerns at each project
site. The remainder of the chapter details the various methods and how to select the
most appropriate and useful method based on the concerns for each project site.
The study methods recommended below offer a standard set of protocols for collecting
data about birds and bats at a project site. While the specific protocols developed for
each wind energy project will vary somewhat depending on the unique characteristics of
each site and the category of the project, using similar methods and metrics throughout
the state will promote consistency in survey techniques and thus comparison capability.
For example, standardized bird use counts provide baseline data on avian species
richness, relative abundance, and diurnal bird use in the vicinity of proposed turbine
sites. These standardized methods have been used for many wind energy projects
throughout the United States and therefore have benefit for comparative purposes.
A d t l (1999) d ib th th d i d t il d di t d di d t i
Diurnal Avian Surveys

7/28/2019 Estudio California CEC 700 2007 008 CMF
http://slidepdf.com/reader/full/estudio-california-cec-700-2007-008-cmf 56/165
Diurnal Avian Surveys
The primary diurnal avian survey technique for pre‐permitting studies at wind energy
project areas
is
the
bird
use
count
(BUC).
Small
bird
counts
(SBCs),
area
searches,
raptor
nest searches, and a variety of other methods may also be needed if BUCs are not
adequate to answer questions about bird use and potential impacts. BUCs estimate the
spatial and temporal use of the site by all birds, including large birds such as raptors,
vultures, corvids, and waterfowl, as well as songbirds and other small species. Table 1
summarizes the diurnal avian survey techniques discussed below and when to use
them.
All of these survey techniques require experienced surveyors who are skilled at
identifying the birds likely to occur in the project area and who are proficient at
accurately estimating vertical and horizontal distances. Kepler and Scott (1981) provide
details on training observers to estimate distances and testing surveyors for their
abilities to identify birds by sight and sound. Analysis of data from BUCs, SBCs, and
other surveys should include suitable measures of precision of count data such as
standard error, coefficient of variation, or confidence interval (Rosenstock et al., 2002).
Table 1. Comparison of Diurnal Bird Survey Techniques for Pre‐Permitting Studies

7/28/2019 Estudio California CEC 700 2007 008 CMF
http://slidepdf.com/reader/full/estudio-california-cec-700-2007-008-cmf 57/165
43
p y q g
Technique Purpose When to Use
Bird Use
Counts
To provide baseline data on bird species composition,
occurrence, frequency, and behavior to compare with
operations use and fatality data; to inform micrositing
decisions; to provide estimate of potential collision risk
based on time spent in rotor‐swept area; to provide an
estimate of spatial and temporal use of site by all diurnal
birds, including large birds (raptors, vultures, corvids, and
waterfowl), songbirds, and other small diurnal bird
species.
Use on all proposed wind energy projects to provide
standardized baseline data on bird use and estimate
collision risk.
Raptor
Nest
Searches
To provide baseline data on location and activity level of
nesting raptors in relation to proposed wind turbine sites.
Use on all proposed projects where raptors are present to
microsite turbines to reduce potential impacts to nesting
raptors, to develop appropriate buffer zones around
breeding territories, and to develop compensatory
mitigation measures for impacts to raptors.
Small Bird
Counts
To provide a relative density estimate of resident breeding
songbirds.
Use if project poses a significant indirect impact to
resident songbird
populations,
such
as
displacement,
avoidance, or loss of special‐status bird breeding habitat.
Area
Searches
To sample the entire avifauna of a wind resource area,
including habitats not represented in BUC sample areas.
Use if BUCs might miss special‐status species potentially
impacted by the proposed project.
Migration
Counts
To provide a more complete picture of species
composition, passage rates, and flight height of diurnal
migrants.
Use if project site is within a known or likely migration
corridor and BUCs are insufficient (too brief in duration
or infrequent) to assess potential collision risk to diurnal
migrants.
Mist‐
Netting
To detect secretive, cryptic, rare, or hard to identify
species; to collect data on condition and age of birds in the
project area; to document species composition at migrant
stopover sites; to distinguish between wintering and
migrant birds.
Use if near a known or likely migratory stopover/fallout
site to assess species composition of migrants or if
demographic information is needed to make impact
assessment to special‐status bird population potentially
affected by the proposed project.
Bird Use Counts

7/28/2019 Estudio California CEC 700 2007 008 CMF
http://slidepdf.com/reader/full/estudio-california-cec-700-2007-008-cmf 58/165
The bird use count (BUC) is a modified point count that involves an observer recording bird
detections from a single vantage point for a specified time period. This survey technique
provides information on bird species composition, relative abundance, and bird behavior that
might influence vulnerability to collisions with wind turbines. Bird use counts are especially
useful to provide quantitative data on larger birds like raptors, waterfowl, and other
waterbirds, but provide less precise information on smaller birds.
Conduct BUCs for 30 minutes once every week during the seasons of interest, which for most
projects in California includes all four seasons. Sequence observation times to cover most
daylight hours (for example, alternate each week with morning and afternoon surveys) and
different weather conditions, such as windy days. Monitoring data collected at each BUC point
should include the number and species of birds observed during the survey and, using
surveyors trained in distance and flight height estimation, the distance and height at which
birds pass potential turbine locations. The height and distance data can later be stratified into
height and distance categories (below, within, or above the rotor‐swept area) based on size and
placement of turbines to be constructed as well as topographic location (for example, level,
sloping, ridge
top)
(Morrison,
1998).
During the BUCs, record flight pattern and flight or perching height. For raptor behavior
studies, the surveyor should record locations and behavior at short intervals (30 seconds, for
example) noting behavior such as soaring, contour hunting, and flapping flight, as well as
height above ground and type of perch being used. Recording wind speed at the start of the
survey is also important so that avian usage can be assessed under conditions similar to those
when the turbines are operating.
For consistency in comparing bird use, report the results of bird use surveys as number of birds
per a specified time period and area—for example, number of raptors per 30 minutes observed
within the range of the rotor‐swept area. The bird use per 30‐minute metric allows for
comparison with other past studies. This metric can be used to discuss bird use at the project
site and in the rotor‐swept area out to some distance, time spent in the area of interest, and bird
use at some height above ground. This information can be broken down to groups of birds or
individual species if desired.
It is important to estimate distance to each bird during BUCs to analyze bird use at incremental
distances from the observer. Distance estimation facilitates comparisons with studies that
d b d h d f h b f l h f
Morrison (1998) and others provide sample data sheets that offer a standardized format for data
collection during surveys (Appendix E). At a minimum, record the following data for each

7/28/2019 Estudio California CEC 700 2007 008 CMF
http://slidepdf.com/reader/full/estudio-california-cec-700-2007-008-cmf 59/165
observation period:
• Time
• Species
• Number
• Estimated distance from the observer to each bird
• Activity
• Habitat
• Flight direction
• Estimated distance of each bird to the turbine
• Flight height estimated to the nearest meter
Weather and environmental data to record at each visit include:
• Temperature
• Wind speed and direction
• Cloud cover
• Precipitation
Selecting Sampling Points
Select BUC
sample
sites
at
vantage
points
that
offer
unobstructed
views
of
the
surrounding
terrain. The sample sites should be approximately 5,200 feet (1,600 meters) apart for large wind
resource areas with good viewsheds. The spacing of sample sites can vary, as needed,
depending on topography and on which species or species groups are the targets of the surveys.
The BUC locations should coincide as much as possible with proposed turbine or turbine string
locations. If turbine locations are unknown for a proposed project site, the researcher can
superimpose a grid over the portion of the site that will support turbines and select sample
points either randomly or systematically from the grid. The point location may require minor
adjustments to provide an unobstructed view of the surrounding terrain and corresponding
airspace. Mark the observation points in the field with a labeled stake and geo‐referencing using
global positioning system (GPS).
On large projects, a randomized sampling method, such as a systematic sample with a random
start, is one way to help reduce bias and achieve independence of sample points. For example, if

7/28/2019 Estudio California CEC 700 2007 008 CMF
http://slidepdf.com/reader/full/estudio-california-cec-700-2007-008-cmf 60/165
the proposed project consists of nine or fewer turbines, sample each turbine site; however, if the
proposed project includes many turbines (for example, 50 or more), a systematic sample
selecting every third turbine may be used. The goal is to create enough sample points to meet analytical and statistical variance objectives and to completely cover the area occupied by the
proposed turbine locations. On sites that support multiple habitat types, systematically stratify
sampling among the habitats to ensure sufficient analysis of habitat variability. Categorize
habitats consistently with the California Wildlife Habitat Classification system
<www.dfg.ca.gov/biogeodata/cwhr> or other accepted California vegetation classification
system such as the California Native Plant Society’s Manual of California Vegetation (Sawyer and
Keeler‐Wolf,
1995).
Other Diurnal Bird Survey Techniques
Raptor Nest Searches
Raptor use of the project site is obtained through the BUCs, but if potential impacts to raptors
are a concern on a project, raptor nest searches will be necessary. They will provide information
to
estimate
impacts
to
raptors,
for
micrositing
decisions,
and
for
developing
an
appropriately
sized non‐disturbance buffer around the nesting territory, as well as baseline data to develop
compensatory mitigation measures for impacts to raptors. Consult with the CEQA lead agency,
USFWS, CDFG, and conservation organizations to establish the list of target raptor species for
nest surveys and to develop the appropriate search protocol for each site, including timing and
number of surveys needed, search radius, and search techniques.
Raptor nest search protocol will vary considerably from site to site depending on the target
raptor species and the habitat. For most projects in California, conduct raptor nest searches in
suitable habitat during the breeding season within a radius of at least one mile of proposed
turbine locations. If wide‐ranging species such as bald or golden eagles or red‐tailed hawks are
known or likely to nest in the vicinity of the project area, consult CDFG, USFWS, and raptor
experts to determine whether an expansion of the search area is warranted. Nest surveys should
provide sufficient information to assess the potential impact of the project on the local breeding
population, which requires data on the location of nests and number of nesting pairs on and
near the project site. Reducing the search radius is appropriate in other situations and can still provide adequate information about the appropriate size for a non‐disturbance nest buffer. For
example, researchers can reduce the search area for some forest dwelling raptors such as
Cooper’s hawk, spotted owl, and some species of small owls because they generally stay within
th f t d lik l t t f i t th t i f i d
way to survey for nests. Helicopters are also a particularly efficient means of surveying for nests
in open country such as grassland or desert. For both aerial and ground nest searches,
h h ld id hi h l l i i i di b i l l
7/28/2019 Estudio California CEC 700 2007 008 CMF
http://slidepdf.com/reader/full/estudio-california-cec-700-2007-008-cmf 61/165
researchers should avoid approaching the nest too closely to minimize disturbance, particularly
when surveying from helicopters.
Wildlife resource agencies have developed survey protocol for several listed or special‐status
raptor species such as Swainson’s hawk, northern goshawk, bald eagle, burrowing owl, and
northern spotted owl <www.dfg.ca.gov/hcpb/species/stds_gdl/survmonitr.shtml>. Consult
these references and the CDFG and USFWS if the project area could provide breeding habitat
for any of these special‐status species.
Small Bird Counts
Small bird counts (SBCs) are essentially BUCs conducted at a greater density of smaller‐radii
point count circles. This technique is useful for assessing displacement effects and habitat losses
to resident songbirds and other small birds (less than 10 inches [25 centimeters] in length) but is
less useful for estimating fatality rates because studies have not shown a strong correlation
between songbird use of the wind site and songbird fatalities. SBC sampling sites can be the
same as BUC sites, but with a smaller radius, ranging from 160 to 330 feet (50 to 100 meters),
depending on habitat type. Savard and Hooper (1995) found that a 300‐foot (100‐meter) radius
yielded nearly as many songbird detections as an unlimited radius for most species.
SBC sampling points should be 820 feet (250 meters) apart to reduce the probability of double‐
counting individual birds (Ralph et al., 1995). If turbine locations are known, establish SBC sites
every 820 feet (250 meters) in a row between turbines. If turbine locations are not known, but
the general area where turbines will be placed (such as a ridge top) is known, locate the SBC
sites along the ridge top. If turbine locations are unknown, superimpose a grid over a portion of
the site that will support turbines, thus enabling random or systematic selection. The exact
number of required sample sites is difficult to determine without knowing the size and extent of
the project site, but sample the site sufficiently to obtain data for answering the research
question within acceptable confidence limits. Permanently mark the observation points in the
field with a labeled stake and geo‐referencing using GPS.
To determine which birds are breeding on the project site, conduct SBCs three times at
approximately two‐week intervals during the appropriate time of year (April through July is
the breeding season in much of California). Conduct surveys no earlier than a half‐hour before
and no later than four hours after sunrise. Time spent at each count station should be 10
minutes (Ralph et al., 1995). At each point, observers should record all birds detected by sight or
sound during the survey period Data recorded for each bird observation should include time
will provide enough data to estimate a “detection function.” A detection function is the
probability of observing an object, such as a bird, given that the bird is a certain known distance
f th b D t ti f ti i t t f ti ti d it f l ti

7/28/2019 Estudio California CEC 700 2007 008 CMF
http://slidepdf.com/reader/full/estudio-california-cec-700-2007-008-cmf 62/165
from the observer. Detection functions are important for estimating density of a population
because they allow estimation of the overall probability of detecting an individual. If variance in
the observations is low, a lower number of sample points may provide an adequate detection
function. Pooling observations across similar groups and other techniques may yield acceptable
results when analyzing data from fewer than 100 observations. For birds that are detected both
individually and in flocks, more than 100 detections may be needed to smooth out the
anomalies for distance observations of flocking birds. For more information on sample size and
detection function, see Buckland et al. (2001).
Study Design
Use the study designs described below, before‐after/control‐impact (BACI) and impact gradient,
for proposed projects that need to address displacement effects. Small bird counts are typically
used for studies where displacement is a concern on a proposed project. Displacement refers to
the indirect loss of habitat if birds avoid the project site and its surrounding area due to turbine
operation and maintenance/visitor disturbance. Displacement can also include barrier effects in
which birds are deterred from using normal routes to feeding or roosting grounds.
A meaningful impact assessment requires BACI study design for projects where displacement
or avoidance by bird or bat populations is a source of concern. BACI designs use data collected
before and after a treatment (for example, construction of a wind project) at both the treatment
sites and reference sites. The BACI design recommends data collection in both reference
(control) and assessment (impact) areas using exactly the same protocol during both pre‐impact
and post‐impact periods (Anderson et al., 1999). Perfect control sites, which exactly replicate the
conditions at the proposed wind turbine site, usually do not exist in a field setting because of
inherent natural variation. The “controls” are therefore reference sites that most closely match
topographic, wind, and both on‐site and adjacent habitat conditions at the proposed wind
turbine site. Collecting data at both reference and assessment areas using the same protocol
during both pre‐ and post‐impact periods answers questions relating to construction and
operation effects on bird and bat abundance. Anderson et al. (1999) provide a thorough
discussion of the design, implementation, and analysis of these kinds of field studies and
should be consulted when designing the BACI study.
BACI designs with replicated reference sites provide a rigorous basis for statistical analysis and
supportable scientific conclusions. Multiple references improve discrimination between project
impacts and impacts resulting from natural temporal changes or other factors. This replication
id th b i f f l t ti ti l t ti th i t f th j t d ti t f
A BACI study design is not always possible because locating appropriate reference areas that
are not already planned for wind turbine development may be difficult. Furthermore,
alterations in land use or disturbance over the course of a multi year BACI study may

7/28/2019 Estudio California CEC 700 2007 008 CMF
http://slidepdf.com/reader/full/estudio-california-cec-700-2007-008-cmf 63/165
alterations in land use or disturbance over the course of a multi‐year BACI study may
complicate the analysis of study results. Researchers should be aware, however, that failure to
use BACI design when determining displacement effects could diminish confidence in the
study result.
In certain situations, such as for a proposed wind development site that is small and
homogeneous, an impact gradient design may be a more appropriate means to assess impacts
of wind turbines on resident populations (Strickland et al., 2002). Data collected at far distances
from turbines are the “reference data.” This approach not only provides information on
whether there
is
an
effect,
it
also
attempts
to
quantify
the
distance
at
which
the
effect
no
longer
exists. The assumption is that the data collected at the farthest distances from turbines are not
impacted by the turbines, and these data farthest from turbines are the reference sites (Erickson
et al., 2007). For example, a 10‐turbine project located in homogeneous grasslands might use
impact gradient analysis to assess project impacts to resident songbirds. An impact gradient
analysis would involve measuring the density of breeding grassland birds as a function of
distance from the wind turbines.
Area Searches fo r B irds
Area searches involve intensive searches of a project area with the objective of finding as many
bird species as possible. Area searches are used infrequently in wind energy bird studies but
can augment BUC data on species presence if the avifauna of the project site need more
thorough documentation. These searches are generally conducted only if it is important to
identify any threatened or endangered species that might occur near the turbines. For example,
researchers might use an area search if they are concerned that a special‐status bird species
might be present in the project area but undetected by BUCs because the bird is secretive or because the sampling sites do not include habitat that might support the bird. Standardize the
area search by specifying the search duration and the size of the area being searched to quantify
species numbers and abundance (Ralph et al., 1993; Watson, 2003).
Standardized area searches are also useful for providing species richness data that can be
compared between different project areas or for sites within a single large wind resource area.
Use area searches as an adjunct to BUCs to produce more complete lists of species and relative
abundance in habitats that may not be represented in the point count circle but which are part
of the wind energy project site. For example, if riparian habitat is not represented in point
counts because it constitutes a small, linear proportion of the project area, conduct an area
search in that habitat This approach allows sampling of the avifauna of entire sites
(for example, along coastal migratory corridors). Migration rates vary considerably from one
day to the next, depending on weather conditions; therefore, conducting several surveys per
week for the migration counts provides a more complete picture of risk to diurnal migrating

7/28/2019 Estudio California CEC 700 2007 008 CMF
http://slidepdf.com/reader/full/estudio-california-cec-700-2007-008-cmf 64/165
week for the migration counts provides a more complete picture of risk to diurnal migrating
birds than using only BUCs. If the project site is within a known or likely migration route for
raptors or other diurnal migratory species (for example, gulls, pelicans, ibis, and cranes), migration counts are a relatively simple, inexpensive technique to assess species composition
and relative abundance and to estimate flight height of migrants. To conduct a migration count,
establish vantage points at ridges or passes within the wind resource area that offer wide fields
of view. Station surveyors throughout the wind resource area approximately every two miles
along an east‐west axis. Start observations around 0900 hours and methodically scan the sky
and record all identified species, direction of movement, and estimated distance from the
observer and
above
the
ground.
Migration
counts
are
typically
conducted
for
an
eight
‐hour
period, four days per week for 10 to 13 weeks to assess large bird migrations during the fall and
8 to 10 weeks during spring.
Mist-Netting for Birds
Use mist‐netting to augment observational bird data if the BUCs and SBCs are not adequate to
characterize the avifauna of the project site or if additional population demographics are
needed (Ralph et al., 1993). Mist‐netting cannot generally be used to develop indices of relative
bird abundance, nor does it provide an estimate of collision risk. However, it can document
fallout or heavy use by migrants at migrant stopover sites in or near proposed turbine sites.
Mist‐netting detects species missed by other techniques, especially secretive or cryptic birds,
and provides opportunities to collect condition, age, and sex data and therefore can be useful in
situations where more detailed information is needed to assess potential project impacts on a
particular bird population (for example, if detailed demographic information is needed on a
special‐status species occurring within the project area). Mist‐netting is also useful for detecting
rare song birds and those species that are difficult to identify (for example, Empidonax flycatchers) and allows a researcher to distinguish wintering birds from those that are
migrating. If mist‐netting is to be used for complete coverage of a project area, establish mist‐net
stations, with 10 nets per station, approximately every two miles in an east‐west axis
throughout the wind resource area. Take habitat heterogeneity into account in establishment of
mist‐net stations. Operating mist‐nets requires considerable experience, as well as state and
federal permits. Follow procedures for operating nets and collecting data in accordance with
Ralph et al. (1993).
Nocturnal Bird Survey Methods
California is part of the Pacific Flyway, one of four major north‐south migratory corridors that
Most songbirds, waterfowl, shorebirds, herons, and egrets migrate at night (Kerlinger and
Moore, 1989), and radar studies yield some insight into general patterns of night flying
behavior Nocturnal migrants generally take off after sunset, ascend to their cruising altitude
7/28/2019 Estudio California CEC 700 2007 008 CMF
http://slidepdf.com/reader/full/estudio-california-cec-700-2007-008-cmf 65/165
behavior. Nocturnal migrants generally take off after sunset, ascend to their cruising altitude
between 300 and 2,000 feet (90 to 610 meters), and return to land before sunrise (Kerlinger,
1995). For most of their flight, songbirds and other nocturnal migrants are above the reach of wind turbines, but they pass through the altitudinal range of wind turbines during ascents and
descents and may also fly closer to the ground during inclement weather or when negotiating
mountain passes (Able, 1970; Richardson, 2000). In general, studies show that the paths of high
elevation nocturnal migrants are little affected by topography or habitat beneath, but some
studies suggest that landforms can have a significant guiding effect for birds flying below 3,300
feet (1,000 meters) (Williams et al., 2001). Radar studies reveal that major nocturnal migrations
are triggered
by
weather
(Gauthreaux
and
Belser,
2003)
and
often
occur
on
nights
with
light
tail
winds. Low cloud cover or head winds can reduce the above‐ground‐level altitudes of
migrants, bringing more birds within range of turbine blades (Richardson, 2000). Under certain
conditions, such as low‐lying fog, cloud cover might increase the flying height of birds that
might find clear skies above.
Once nocturnal migrants descend from their night’s flight and select a site for cover, foraging,
and resting, local landforms and habitat conditions may play a role in determining where they
alight (Mabey, 2004). Biologists knowledgeable about nocturnal bird migration and familiar
with patterns of migratory stopovers in the region should assess the potential risks to nocturnal
migrants at a proposed wind energy project site. In general, pre‐permitting nocturnal studies
are warranted only at sites with features that might strongly concentrate nocturnal birds, such
as along coastlines that are known to be migratory songbird corridors. If warranted, employ
radar and other nocturnal study methods to determine species composition, abundance, and
flight altitude of birds passing through the site to assess risk to migrating birds. If project areas
are within the range of nocturnal, special‐status bird species (for example, marbled murrelet or
northern spotted owl), surveyors should use species‐specific protocols recommended by CDFG
or USFWS to assess the species’ potential presence in the project area.
The following section describes nocturnal study methods that could help answer questions
about migrating birds’ use of a proposed site. In contrast to the diurnal avian survey techniques
previously described, considerable variation and uncertainty exist on the optimal protocols for
using acoustic monitoring devices, radar, and other techniques to evaluate species composition, relative abundance, flight height, and trajectory of nocturnal migrating birds. The use of radar
for determining passage rates, flight heights and flight directions of nocturnal migrating
animals has yet to be shown as a good indicator of risk of collision, and additional studies are
d d b f ki d ti th b f i ht th b f
The discussion below therefore does not make specific recommendations on duration or
frequency of sampling or study design. Instead, scientists experienced with the techniques must
tailor the study design and sampling protocol to the unique features of each site and to the

7/28/2019 Estudio California CEC 700 2007 008 CMF
http://slidepdf.com/reader/full/estudio-california-cec-700-2007-008-cmf 66/165
ai o e u y e ig a a p i g p o o o o e u ique ea u e o ea i e a o e
specific questions to be answered. Also consult the USFWS, CDFG, and migratory bird experts
to review study design and analytical methods to determine whether the proposed studies would answer questions about risk to nocturnal migrating birds.
The NWCC is developing guidelines that describe the metrics and methods used to study
nocturnal birds and bats (Kunz et al., in prep.). Consult these guidelines, which will be available
at the NWCC Web site, before developing pre‐permitting studies of nocturnal migration. Each
of the methods described here has strengths and weaknesses for answering questions about
collision risk.
No
one
method
by
itself
can
adequately
assess
the
spatial
and
temporal
variation
in nocturnal bird populations or the potential collision risk. The methods or combinations of
methods to be used at a proposed project site will depend on the recommendations of experts
familiar with the operation and limitations of these tools and with the particular questions at
issue about potential impacts of the project to nocturnal birds.
Nocturnal bird study methods and collision risk are areas of active research and worthy of
investigation by the collaborative, public‐private research partnership being considered by the
Energy Commission, CDFG, wind energy developers and non‐governmental organizations
interested in wind‐wildlife interactions. New information from such research may warrant
revisions to the recommendations in this section. Consult the Energy Commission Web site,
<www.energy.ca.gov/renewables/06‐OII‐1/>, to see whether Guidelines updates have been
posted on study methods for nocturnal migrating birds.
Radar
Radar surveys are useful for counting nocturnal migrants passing through a proposed project
area and for identifying the height and location of flight paths. Low‐power surveillance radar
can detect movements of birds within a range of a few kilometers (Gauthreaux and Belser,
2003). Horizontally mounted marine navigation radar allows accurate mapping of the
trajectories of birds, while vertically mounted scanning radar provides information on flight
altitude. Mobile, low‐power, high resolution marine surveillance radar has been used since 1979
to monitor collision risks of birds near power lines (Gauthreaux, 1985). NEXRAD Doppler
radars are weather surveillance tools that can determine general migratory pathways, migratory stopover habitat, roost sites, nightly dispersal patterns, and the effects of weather on
migration (Gauthreaux and Belser, 2003; Kunz, 2004). NEXRAD is not useful for characterizing
high resolution passage rates or altitude data over small spatial scales. Radar surveys are
d d f b d h l l l bl d h b d f b
Acoust ic Monitoring
Sensitive microphones aimed at the night sky can record vocalizations of night‐migrating birds.
The o ali atio a odu e a li t of e ie i ati o e a ite at i ht A ou ti

7/28/2019 Estudio California CEC 700 2007 008 CMF
http://slidepdf.com/reader/full/estudio-california-cec-700-2007-008-cmf 67/165
The vocalizations can produce a list of species migrating over a site at night. Acoustic
monitoring is biased toward detecting species that use contact calls during migration
(Farnsworth et al., 2004). Some 200 species are known to give calls during night migration, of
which approximately 150 are sufficiently distinctive to identify to species under most conditions
(Evans, 2000). The remaining species can be lumped into similar‐call species groups. Acoustic
data can either be processed by ear or analyzed by sound analysis software (Evans, 2000).
Nocturnal migrant monitoring systems can consist of single microphones connected to a digital
recorder. More complex systems involve four or more microphones connected to a computer,
providing an assessment of the height and position of each bird’s call. Acoustic monitoring does
not provide a complete assessment of the number of birds passing through an area, has a
limited range, and can be confounded by background noise such as insects. However, it can
provide insight about the regional variation in concentrations of migrants and their relative
flight heights, which are useful for assessing potential risk of collision. Acoustic monitoring can
be used in conjunction with other nocturnal survey methods as discussed below.
Visual Monitoring
Ceilometers and moonwatching are two visual techniques used by early investigators to
monitor nocturnal birds. A ceilometer is a vertically directed, conical light beam that can sample
low altitude bird migration (Able and Gauthreaux, 1975; Gauthreaux, 1969). Kerlinger (1995)
provides a detailed description of the techniques for using ceilometers and of their biases and
limitations. Ceilometers can detect birds below 1,500 feet (460 meters), and an experienced
observer can, under ideal conditions, distinguish different taxa of small birds. Ceilometers also
allow for measurement of bird traffic rates (number of birds per unit time passing through the
beam) and
direction
of
flight.
Moonwatching
is
similar
to
the
ceilometer
method
except
that
a
full or nearly full moon takes the place of the beam of light (that is, birds are observed as they
pass between the observer and the moon). Moonwatching is complementary to ceilometer
surveys because it is difficult to use ceilometers on bright moonlit nights. While these are
inexpensive options to secure some information about passage rates within the rotor‐swept
area, they sample only a very small area relative to the area potentially occupied by nocturnal
migrants, and it is difficult to accurately estimate flight altitude. Ceilometer results may also be
biased
because
the
ceilometer
itself
may
alter
the
flight
behavior
of
birds
by
either
attracting
or
repelling them.
More recent innovations for enhancing visual observations of nocturnal species are image
intensifying devices and thermal animal detection systems. Image intensifying devices such as
Whereas image intensifying devices such as night scopes and night vision goggles detect
infrared reflected off objects in the upper part of the spectrum, thermal animal detection systems
(TADS) use infrared imagery to detect heat emitted from objects in the lower part of the infrared

7/28/2019 Estudio California CEC 700 2007 008 CMF
http://slidepdf.com/reader/full/estudio-california-cec-700-2007-008-cmf 68/165
spectrum. TADS are better than radar for species recognition because TADS can assess shape,
size, and wing beat frequencies at night, providing information on nocturnal avoidance
behavior, flight altitude, species composition, and flock size. Desholm (2003) provides a detailed
discussion of TADS hardware and its uses.
These visual sampling methods are rarely used for pre‐permitting studies because they have
not been demonstrated to be useful in estimating collision risk. However, these techniques can
provide information about species composition and relative flight heights of migrants. Visual
sampling is
useful
for
making
behavioral
observations
of
how
birds
or
bats
interact
with
wind
turbines, so these techniques are generally more valuable for operations studies rather than for
pre‐permitting surveys.
Bat Survey Methods
Avian collisions with wind turbines have been a source of concern for almost two decades, but
only recently have researchers turned their attention to the risk of bat fatalities. Compared to
birds, much less is known about the life histories, habitat requirements, behavior, and geographic ranges of California’s 25 bat species, making impacts to bats a difficult subject to
address in pre‐permitting studies for wind development projects (California Bat Working
Group, 2006). Bats are long‐lived mammals with few predators and low reproductive rates
(Kunz, 1982). Sustained, high fatality rates from collisions with wind turbines could have
potentially significant impacts to bat populations because population growth is slow (Racey and
Entwistle, 2000).
In the United States, bat fatalities at wind farms have been documented in 10 states, mostly in
the east and mostly involving tree‐roosting bat species such as the silver‐haired, hoary, and
eastern red bats (Johnson, 2004 and 2005). Hoary bats account for nearly half of all bat fatalities
documented at wind farms (Johnson, 2004). Most known fatalities occur in late summer and
early fall during periods coinciding with bat migrations (Johnson, 2004; Kunz, 2004). Some
studies have indicated that tree‐roosting bats may be attracted to both moving and non‐moving
wind turbine blades and that many bat kills occur during low‐wind nights (Arnett, 2005). Kunz
et al. (2007) describe 11 hypotheses about possible reasons for fatalities at wind energy facilities.
California has a different bat species assemblage than the Northeast, where most of the bat
fatality studies have been conducted. In addition to hoary, red, and silver‐haired bats, other
movements within the state and the uncertainty surrounding potential impacts of wind turbines
on bat populations, pre‐permitting studies are needed at all proposed wind energy sites to
investigate the presence of migratory or resident bats and to assess collision risk.

7/28/2019 Estudio California CEC 700 2007 008 CMF
http://slidepdf.com/reader/full/estudio-california-cec-700-2007-008-cmf 69/165
Acoust ic DetectionAcoustic detection involves specialized acoustic systems that allow an experienced user to
identify some bat species by comparing the recorded calls to a reference library of known calls.
Because bats usually echolocate as they fly, broadband detection systems covering the
frequency range that bats use can provide an index of activity from echolocation calls. Acoustic
systems designed to monitor birds are not suitable for bats because of differences in the
vocalization frequencies of bats and birds.
Acoustic monitoring provides information about bat presence and activity, as well as seasonal
changes in species composition, but does not measure the number of individual bats or
population density. Acoustic monitoring only records detections, or bat passes, defined as a
sequence of two or more echolocation calls, with each sequence or pass, separated by one
second or more (Hayes, 1993). Furthermore, there is some question about how much bats use
echolocation while migrating as opposed to during foraging or while navigating among
obstacles,
so
caution
is
necessary
when
assessing
bat
use
of
an
area
based
only
on
acoustic
monitoring data. Passive acoustic surveys can provide useful pre‐permitting information by
establishing baseline patterns of seasonal bat activity at proposed wind energy sites, but
researchers should be aware that with the current state of knowledge about bat‐wind turbine
interactions, a fundamental gap exists regarding links between pre‐permitting assessments and
operations fatalities.
Conduct acoustic monitoring for bats at all proposed wind energy sites unless defensible, site‐
specific data are available indicating that the project is unlikely to pose a risk to bats.
Monitoring for a full year is recommended because little is known about the timing of bat
migratory activity in many parts of the state, and some bat species overwinter in California and
can be active throughout the year. Year‐round surveys are particularly important at proposed
project sites if, in the opinion of bat experts involved in scoping the pre‐permitting studies, the
sites are likely to support resident bat populations and include habitat features conducive to
general bat activity (for example, nearby roosts, water bodies). If year‐round surveys are not
feasible, acoustic monitoring should include at least spring and fall migration, the periods that pose the greatest risk to bats. Data on environmental variables such as temperature,
precipitation, and wind speed should be collected concurrent with the acoustic monitoring so
these weather data can be correlated with bat activity levels. Consult bat experts, CDFG, and
US S k d h d b l d l b l f d d
on meteorological towers without interfering with weather monitoring equipment, ideally at
the future rotor‐swept zone. Reynolds (2006) and Lausen (2006) provide detailed guidelines for
detector deployment and operation. Rainey et al. (2006) provide an in‐depth discussion of

7/28/2019 Estudio California CEC 700 2007 008 CMF
http://slidepdf.com/reader/full/estudio-california-cec-700-2007-008-cmf 70/165
acoustic monitoring systems.
Some acoustic monitoring systems are designed to run unattended for long periods of time
using solar power and collect data passively by storing bat calls for later analysis. Once the
detectors have been established on towers, monitor nightly. Analysis of the data, however, can
be conducted on a subset of the recordings by making a preliminary screening of the data to
look for spikes of activity, with the remainder stored for later analysis if warranted. Make
decisions on the level of effort needed for screening and analyzing the pre‐permitting acoustic
data in
consultation
with
a bat
biologist
experienced
in
acoustic
analysis.
Bat studies and research beyond those recommended in the Guidelines are needed to assess
species composition and relative abundance of bats at proposed wind energy sites, to assess
migration routes and the timing of migration, and to help researchers understand temporal and
spatial patterns of bat activity at facilities that encompass diverse landscapes (California Bat
Working Group, 2006; Kunz et al., 2007). The correlation of pre‐permitting acoustic data with
collision risk is an area of active research and a topic worthy of further investigation by the
collaborative, public‐private research partnership being considered by the Energy Commission,
CDFG, wind energy developers, and non‐governmental organizations interested in wind‐
wildlife interactions. A lead agency may choose to include contributions to this research fund as
a permit condition for proposed wind energy projects. These contributions would be in addition
to the pre‐permitting monitoring recommended here. Developers are urged to participate in
research to develop better bat risk assessment methodologies by making their project sites
available to researchers, by collaborative funding of research efforts, and by releasing study
results.
Other Bat Survey Techniques
Other research tools are available to complement the information from acoustic surveys. These
methods are not recommended for every project, but may be needed to answer particular
questions about size, species composition, behavior, and activity patterns of roosts or to further
investigate habitat features that might attract bats. The Western Bat Working Group has
developed a matrix summarizing recommended survey techniques for western bats <www.wbwg.org/survey_matrix.htm>. The California Bat Working Group (2006) provides
information on survey techniques and on potential risk posed by wind turbines to California
bat species. Kunz et al. (in prep.) also provides a comprehensive description of bat survey
h l d b l h b d f
Mist‐netting samples only a small area well below rotor height and must be conducted on no‐
or low‐wind nights (which are rare at wind resource areas) because bats detect and avoid
moving nets. However, this capture technique can help to distinguish species that are difficult
t id tif d t t ti ll d t th dditi l i f ti h i

7/28/2019 Estudio California CEC 700 2007 008 CMF
http://slidepdf.com/reader/full/estudio-california-cec-700-2007-008-cmf 71/165
to identify or detect acoustically and to gather additional information such as species, age, sex,
and reproductive status of local bat populations that no other source, short of collecting the bat, can provide. Such information may be relevant in pre‐permitting studies if the goal is to
evaluate potential project impacts to a local bat population.
Mist‐netting and acoustic monitoring are complementary techniques that, used together, can
provide an effective means of inventorying the species of bats present at a site (OʹFarrell et al.,
1999). If mist‐netting is to be used to augment acoustic monitoring data at a project site,
trapping efforts
should
concentrate
on
potential
commuting,
foraging,
drinking,
and
roosting
sites. Methods for assessing colony size, demographics, and population status of bats can be
found in O’Shea and Bogan (2003). Kunz et al. (1996) provide detailed guidelines on capture
techniques for bats, including mist‐nets and harp traps.
Exit Counts / Roost Searches
Pre‐permitting survey efforts should include an assessment to determine whether known or
likely bat roosts in mines, caves, bridges, buildings, or other potential roost sites could occur
near proposed wind turbine sites. If active roosts are detected during this assessment, exit
counts and roost searches can provide additional information about the size, species
composition, and activity patterns for any bat‐occupied features near project areas. An exit
count involves a skilled observer watching a bat roost exit at dusk when bats are leaving for
their nightly foraging. Exit counts require a skilled observer equipped with a bat detector and
call storage system, plus night vision equipment and supplemental infrared illumination.
Recording and later viewing of the exodus with one or more properly placed infrared video
cameras (with supplemental infrared illumination) can allow a single biologist to cover large
structures or abandoned mines with several portals. Rainey (1995) provides a guide to options
for exit counts.
Roost searches can also document bat species that are difficult to detect acoustically or with
mist‐net capture. Roost searches are conducted by looking into or entering potential bat roosts
(usually using artificial illumination) with the intent of finding roosting bats or bat ”sign,”
including guano,
culled
insect
parts,
and
urine
staining.
Conduct
roost
searches
cautiously
because roosting bats are sensitive to human disturbance (Kunz et al., 1996). Never conduct a
roost search at known maternity roosts. Searches of abandoned mines or caves can be
dangerous and should only be conducted by experienced researchers. For mine survey protocol
and guidelines for protection of bat roosts see the appendices in Pierson et al (1999)
Repowering—Pre-Permitting Assessment
Repowering refers to modernizing a wind resource area by removing old turbines and
replacing them with new turbines. The new turbines are generally larger, taller, and more

7/28/2019 Estudio California CEC 700 2007 008 CMF
http://slidepdf.com/reader/full/estudio-california-cec-700-2007-008-cmf 72/165
ep aci g t e wit ew tu bi es. e ew tu bi es a e ge e a y a ge , ta e , a d o e
efficient than the old. Repowering may be included in Category 1, depending on the state of
existing knowledge regarding usage, impacts, and the projected change in existing impacts in
light of repowering. Data for repowering projects may be available from the existing wind farm
project and/or from nearby repowering projects. The lead agency should consult with
appropriate agencies and experts to assess whether these data are credible and useful in
assessing the impacts of exchanging the existing turbines for the repowered turbines. If existing
data is determined to be credible and useful in assessing impacts, the extent of new required
field studies may be reduced. The lead agency should address the adequacy and applicability of
this information in consultation with USFWS, CDFG, and other appropriate stakeholders.
If little information is available regarding the potential impacts of a repowering project, pre‐
permitting study designs should address the fact that new turbines are typically taller than the
ones they replace, reach a higher airspace, and have a much larger rotor‐swept area. New
turbines also have a longer operating time, operate at lower and higher wind speeds, and may
have increased blade tip speed, all of which potentially affect different species (Barclay et al.,
2007).
CHAPTER 4: ASSESSING IMPACTS ANDSELECTING MEASURES FOR MITIGATION

7/28/2019 Estudio California CEC 700 2007 008 CMF
http://slidepdf.com/reader/full/estudio-california-cec-700-2007-008-cmf 73/165
SELECTING MEASURES FOR MITIGATIONThis chapter discusses approaches to assessing impacts to birds and bats that surveys revealed
during the pre‐permitting phase of wind energy development and to selecting the best
measures for avoiding, minimizing, or mitigating those impacts.
Pursuant to CEQA, lead and responsible agencies need estimates of potential fatalities and an
assessment of the level of risk to individuals and populations to make determinations of
“significance” and to establish impact avoidance, minimization, and mitigation requirements.
Assessment of impacts is based on the number of individuals and categories of species at risk, turbine size, design and layout, and the interaction of these attributes with physical factors such
as weather and topography.
The information gathered during pre‐permitting assessment and the impact analysis evaluated
during the CEQA process will also provide an assessment of a project’s ability to comply with
other state and federal wildlife agency permits besides CEQA requirements. Mitigation at
project sites
is
also
essential
to
ensure
that
projects
will
be
as
consistent
as
possible
with
fish
and
wildlife protection laws.
The chapter is organized into four sections:
• Evaluating and Determining Impacts
• Impact Avoidance and Minimization
• Compensation
• Operations Impact Mitigation/Adaptive Management Measures
Types of Impacts
CEQA lead and responsible agencies categorize impacts into one of three categories: “direct,”
“indirect,” and “cumulative.”
Direct ImpactsFor purposes of the Guidelines , “direct” impacts refer to bird and bat collisions with wind
turbine blades, meteorological towers, and guy wires. Potential direct impacts are determined
by reviewing all of the pre‐permitting data to evaluate which species might collide with
information on potential impacts. To learn of research advances, regularly consult the National
Wind Coordinating Committee Wildlife Workgroup Web site,
<www.nationalwind.org/workgroups/wildlife/>.

7/28/2019 Estudio California CEC 700 2007 008 CMF
http://slidepdf.com/reader/full/estudio-california-cec-700-2007-008-cmf 74/165
Indirect ImpactsPotential indirect impacts to birds and bats from wind energy projects include disturbance of
local populations and subsequent displacement or avoidance of the site and disruption to
migratory or movement patterns (NWCC, 2004). To date, displacement and site avoidance
impacts have not been evaluated as extensively in California as they have been in other areas.
Several studies have been published or are ongoing on the displacement and avoidance impacts
of wind turbines and associated infrastructure and activities on grassland and shrub‐steppe
breeding songbirds
and
other
open
country
birds
(for
example,
prairie
chicken
and
sage
grouse,
shorebirds, waterfowl). Some studies have documented decreased densities and avoidance by
grassland songbirds and other birds as a function of distance to wind turbines and roads
(Leddy et al., 1999; Erickson et al., 2003; Schmidt et al., 2003).
Impacts to movement patterns of waterfowl and shorebirds have been a concern in many
western European countries where offshore wind farms are in the pathway of daily commutes
of seabirds (Guillemette et al., 1999; Dirksen et al., 2000). A few studies have looked at the
relationship between nest occupancy and placement of turbines (Howell and Noone, 1992; Hunt
et al., 1999; Hunt, 2002; Erickson et al., 2003) and have documented relatively few impacts. Most
of these studies do not conclusively establish that a reduction in use of an area is due to
avoidance (indirect impact) versus the reduction in a local population due to collisions with
turbines (direct impact).
Indirect impacts may also result from construction and operations activities as well as changes
in land use (for example, changes in grazing practices, disturbance of soil, or introduction of
weeds) that attract prey species such as insects and small mammals. These prey species may in
turn attract raptors, insectivorous birds, and bats to the vicinity of wind turbines, putting them
at increased risk of collision. Biologists should be aware of these potential impacts and
recommend construction and management practices to minimize activities that might attract
prey and predators to the wind turbine site.
The before after/control impact (BACI) study design described in Chapter 3 enables researchers to assess indirect impacts to determine whether wind turbines are affecting bird or bat density.
The BACI study design may be particularly important to determine whether turbines are
attracting bat species at a project site.
Assessing cumulative impacts to birds and bats is difficult because population viability data are
unavailable for most species. Furthermore, it is difficult to establish an appropriate geographic
scope for a cumulative impact analysis, to secure comprehensive information on existing and
planned projects, and to gauge the relative contribution of a project’s impacts compared to past,

7/28/2019 Estudio California CEC 700 2007 008 CMF
http://slidepdf.com/reader/full/estudio-california-cec-700-2007-008-cmf 75/165
planned projects, and to gauge the relative contribution of a project s impacts compared to past,
present, and
future
projects.
Cumulative impact analyses for wind energy projects should focus on potential impacts to bird
or bat populations over the entire estimated operational life of the project. Cumulative impacts
could apply to the birds and bats in and immediately adjacent to the wind farm or in
populations or subpopulations some distance away due to changes in immigration and
emigration. The level of detail in a cumulative analysis need not be as great as for the project’s
direct
impact
analysis
but
should
reflect
the
severity
and
likelihood
of
occurrence
of
the
potential impacts. Standards of practicality and reasonableness should guide the cumulative
impact discussion (CEQA Guidelines §15130).
While the cumulative impacts of a project may be difficult to determine, do not discount the
impacts of a project based on relative size. The addition of one small wind energy project in an
existing wind resource area may seem trivial, but CEQA requires evaluation of the potential
cumulative impacts of an increasing number of projects, regardless of project size.
An adequate analysis of cumulative impacts on special‐status bird or bat species should include
the following steps:
1. Identify the species that warrant a cumulative impact analysis, including any species for
which a determination of potentially significant impacts has been made. Assess the
baseline population of the relevant species, as well as whether the population is resident,
seasonally breeding, migratory, or wintering and whether it is stable, increasing, or
decreasing. The assessment should include a discussion of natural and anthropogenic
factors contributing to population trends.
2. Establish an appropriate geographic scope for the analysis and provide a reasonable
explanation for the geographic limitation used. The geographic scope of the analysis will
generally include a larger area than the project site.
3. Compile a summary
list
of
past
and
present
projects
and
projects
in
the
reasonably
foreseeable future within the specified geographical range that could impact the species,
including construction of transmission lines and other related wind energy project
infrastructure. The list of projects should include other wind generation projects as well
th j t th t i l h bit t l lli i f t liti bl k f
and the contribution of the project to the cumulative impact. If, after thorough
investigation, the impact is considered too speculative for evaluation, state that
conclusion, and the cumulative impact assessment can be terminated (CEQA Guidelines
§15145). The lead agency needs to identify facts and analysis supporting any conclusion

7/28/2019 Estudio California CEC 700 2007 008 CMF
http://slidepdf.com/reader/full/estudio-california-cec-700-2007-008-cmf 76/165
§ ) g y y y pp g y
that the
cumulative
impact
is
less
than
significant.
5. Identify the impacts and impact avoidance, minimization, or mitigation measures to the
species, and make a determination regarding the significance of the project’s
contributions to cumulative significant impacts. The significance determination should
include an evaluation of the cumulative impacts the project and neighboring projects
might have on the local or regional species population or the species as a whole. For
some
projects,
the
only
feasible
mitigation
for
cumulative
impacts
may
involve
the
adoption of ordinances or regulations or implementation of a regional mitigation plan,
rather than the imposition of conditions on a project‐ by‐project basis.
Impact Assessment Approaches
One tool that other studies have used to assess direct impacts is collision risk assessment. The
goal of the risk assessment is to determine whether overall avian and bat fatality rates are low,
moderate, or
high
relative
to
other
projects
and
to
provide
measures
of
overall
avian
and
bat
casualties attributable to collisions with wind turbines. Information on bird and bat use of a
proposed wind energy site can be used to perform a qualitative assessment of risks, classified as
a Phase I risk assessment (Kerlinger, 2005). A Phase I risk assessment determines whether high
bird or bat use might represent a fatal flaw of a proposed project and helps to develop studies to
better evaluate risk. The next level of a risk analysis is to make the assessment more quantitative
by collecting data on the abundance and spatial and temporal distribution of birds and bats
using the site, as well as data on their behavior and on the time birds and bats spend in areas
where they might be at risk of collision and then comparing this information to existing data on
fatalities at wind resource areas. The “Pre‐Permitting Assessment” chapter describes methods
for collecting these data. Anderson et al. (1999) and Erickson (2006) discuss the analysis of
various types of risk to birds due to wind turbines.
For all quantification of risk and fatality estimates, apply a uniform metric of bird or bat
fatalities per megawatt (MW) of installed capacity per year. Refer to Appendix G for a
discussion of raptor use and fatality data from studies at existing wind resource areas.
Impact Avoidance and Minimization
The most important decision regarding impact avoidance and minimization comes early in site
Once a site is selected, micrositing efforts, such as appropriate placement of turbines, roads,
power lines, and other infrastructure, can avoid or reduce potential impacts to birds, bats, and
other biological resources. However, micrositing may not help reduce fatalities if a wind farm is
placed in a region with high levels of bird or bat use, such as an area used heavily by breeding

7/28/2019 Estudio California CEC 700 2007 008 CMF
http://slidepdf.com/reader/full/estudio-california-cec-700-2007-008-cmf 77/165
p g g y y g
and wintering
raptors.
Each wind energy project site is unique, and no one recommendation will apply to all pre‐
permitting site selection and layout planning. However, consideration of the following elements
in site selection, turbine layout, and development of infrastructure for the facility can be helpful
to avoid and minimize impacts. In addition to the recommendations described below, consult
the NWCC’s Mitigation Toolbox, a recent compilation of mitigation measures that can be used to
minimize
or
eliminate
impacts
to
wildlife
resulting
from
the
design,
construction,
and
operation
of wind farms (NWCC, 2007).
Minimize Fragmentation and Habitat Disturbance
Pre‐permitting studies must be sufficiently detailed to provide maps of special‐status species
habitats (such as wetlands or riparian habitat, oak woodlands, large, contiguous tracts of
undisturbed wildlife habitat, raptor nest sites) as well as bird and/or bat movement corridors
that are used daily, seasonally, or year‐round. Use maps that show the location of sensitive
resources to establish the layout of roads, fences, and other infrastructure to minimize habitat
fragmentation and disturbance.
Establish Buffer Zones to Minimize Collision Hazards
If pre‐permitting studies show that the proposed facility could pose a bird or bat collision
hazard, establish non‐disturbance buffer zones to protect raptor nests, bat roosts, areas of high
bird or bat use, or special‐status species habitat. For example, proposed wind energy project
sites near water and/or riparian habitat in an otherwise dry area could increase the number of
bird and bat collisions; therefore, do not encourage projects in these types of areas. Determine
the extent of the buffer zone in consultation with CDFG, USFWS, and biologists with specific
knowledge of the affected species.
Reduce Impacts with Appropriate Turbine Design
It is unclear whether larger and smaller wind turbines cause equivalent bird collision fatalities
based on rotor‐swept area or MW of generating capacity. For purposes of this document and
the current state of the technology, “large” turbines are defined as 750 kilowatt (kW) and larger,
and “small” as 40 kW to 400 kW.
There has been considerable discussion regarding the effects of tubular versus lattice towers
and whether lattice turbines contribute to higher fatality rates due to the increased availability
of perches (Orloff and Flannery, 1992; Hunt, 1995; Smallwood and Thelander, 2004 and 2005).
Turbines with guy wires and above‐ground transmission lines present additional collision

7/28/2019 Estudio California CEC 700 2007 008 CMF
http://slidepdf.com/reader/full/estudio-california-cec-700-2007-008-cmf 78/165
hazards. Newer
turbine
designs
generally
do
not
incorporate
guy
wires.
Although
newer,
large
turbines have a variable speed design and can operate at lower average revolutions per minute,
they can have a comparable tip speed. A secondary benefit of modern turbines may be the
presence of fewer turbines over a given area. For example, some older turbines at the Altamont
Pass Wind Resource Area are rated at 100 kW, while many of the newer turbines have at least
15 times the power rating. Many of the newer turbines, however, operate at both lower and
higher wind speeds, significantly increasing the operation time. Preliminary research indicates
that turbines operating at low speeds may pose a threat to some bat species (Arnett, 2005).
Additional research is underway to investigate the relative risk to wildlife from old, smaller
turbines compared to new, larger turbines. As credible results become available from these
studies, Guidelines recommendations regarding turbine design may be revised.
Reduce Impacts with Appropriate Turbine Layout
Pre‐permitting studies must be sufficiently detailed to establish normal movement patterns of
birds and bats to inform micrositing decisions about turbine configuration. Turbine alignments
that separate birds or bats from their daily roosting, feeding, or nesting sites or that are located
in high bird use or bat use areas can pose a collision threat.
Assessing the impacts of turbine siting and determining appropriate turbine placement requires
a thorough understanding of the distribution and abundance of birds and bats at a proposed
site as well as site‐specific knowledge of how wildlife interacts with landscape features at the
site. Orloff and Flannery (1992 and 1996), Smallwood and Thelander (2004 and 2005), and
Smallwood and Neher (2004) all estimated associations between bird fatalities and attributes of wind turbine locations relative to topography and other factors. They concluded that wind
turbine siting contributes substantially to bird fatalities and that careful siting of new wind
turbines could substantially reduce fatalities; these predicted associations, however, have not
been field tested. Strickland et al. (2001) concluded that wind turbines located away from the
edge of the ridge at Foote Creek Rim, Wyoming, would result in lower raptor fatality rates than
turbines located immediately adjacent to the edge. Smallwood and Neher (2004) had similar
findings in that they determined that raptors fly disproportionately more often on the prevailing windward aspects of slopes.
The topographical features of a site may or may not increase the risk of migrating nocturnal
b d ll d h d b E d f d f l fl h l f f
(2000) also noted that migration altitudes can be lower than cruising altitude when birds cross a
ridge or pass.
Reduce Habitat for Prey Near Turbines
7/28/2019 Estudio California CEC 700 2007 008 CMF
http://slidepdf.com/reader/full/estudio-california-cec-700-2007-008-cmf 79/165
Areas around
turbines
and
along
roads
that
have
been
disturbed
by
construction
and
operations activities may provide habitat for prey species such as insects and small mammals.
Increases in prey availability may in turn attract raptors, insectivorous birds, and bats, putting
them at increased risk of collision. Biologists should be aware of these potential impacts when
reviewing the site design and recommend construction and management practices to minimize
the activities that might attract prey and predators to the wind turbine site. To avoid impacts to
non‐target species, use only benign methods to eliminate or reduce fossorial animals or
suppress
weedy
vegetation,
Avoid Lighting that At tracts Birds and Bats
How birds and bats respond to lighting is poorly understood. Night‐migrating songbirds are
apparently attracted to steady‐ burning lights at communications towers and other structures,
increasing the potential for large‐scale fatality events (Kerlinger, 2004). Research by Evans et al.
(2007) indicates that the color of light and whether it is steady‐ burning or flashing makes a
significant difference in whether night‐migrating birds aggregate around tall, lit structures.
While red light has been blamed for bird fatalities at tall TV towers, the Evans et al. (2007) study
indicates that for birds migrating within cloud cover, blue, green, or white light would be more
likely to induce bird aggregation and associated fatality. Evans et al. concluded that while white
flashing lights are relatively safe, red flashing lights with a long dark interval and short flash
on‐time would likely be the safest lighting configuration for night‐flying birds.
Bats are known to feed on concentrations of insects at lights (Fenton, 1997). Thus, any source of
lighting that attracts insects may also attract bats at a wind facility. While the mean numbers of
insect passes were somewhat higher at lighted turbines than at unlighted turbines at the
Mountaineer Wind Energy Center in West Virginia, aviation lighting did not appear to affect
the incidence of foraging bats around turbines (Horn et al., in press). No studies have found
differences in bat fatalities between turbines equipped with red, flashing FAA lights and those
that were unlighted (Arnett et al., in press).
Under current Federal Aviation Administration (FAA) guidelines (FAA, 2007; <http://oeaaa.faa.gov>), anyone proposing construction of structures above a certain height
must notify the Federal Aviation Administration 30 days prior to construction and in that
notification should specify the type of lighting desired at the proposed structure. Plans for
Minimize Power Line Impacts
To prevent avian collisions and electrocutions, place all connecting power lines associated with
wind energy development underground, unless burial of the lines would result in greater
impacts to biological resources. All above‐ground lines, transformers, or conductors should

7/28/2019 Estudio California CEC 700 2007 008 CMF
http://slidepdf.com/reader/full/estudio-california-cec-700-2007-008-cmf 80/165
impacts to biological resources. All above ground lines, transformers, or conductors should
fully comply with the Avian Power Line Interaction Committee (APLIC) 2006 standards to
prevent avian fatality, including use of various bird deterrents.
Avoid Guy Wires
Guyed structures are known to pose a hazard to birds, especially if lighted for aviation safety or
other reasons. Communication towers and permanent meteorological towers should not be
guyed at turbine sites. If guy wires are necessary, then use bird deterrents.
Decommission Non-Operational Turbines
Remove wind turbines when they are no longer operational so they cannot present a collision
hazard to bird and bats. As part of permitting applications, developers should submit a
decommissioning and reclamation plan that describes the expected actions when some or all of
the wind turbines at a wind energy project site are non‐operational. The plan should discuss in
reasonable detail how the wind turbines and associated structures will be dismantled and
removed.
Decommissioning a project typically involves removal of turbine foundations to three feet (one
meter) below ground level and removal of access roads, unnecessary fencing, and ancillary
structures. The decommissioning plan should also include documentation showing financial
capability to carry out the decommissioning and restoration requirements, usually an escrow
account, surety bond, or insurance policy in an amount (approved by the lead agency) sufficient
to remove
the
wind
turbines
and
restore
the
site.
Plans
for
decommissioning
can
also
be
addressed as an obligation of the property owner as part of the lease arrangement with the
wind developer.
Compensation
Project developers and permitting agencies should ensure that appropriate measures are
incorporated into the planning and construction of the project to avoid or minimize impacts as
much as possible. If these measures are insufficient to avoid or minimize estimated impacts to birds and bats, compensation can be used to mitigate or offset such impacts, including
cumulative impacts. Although impacts still occur, the ability to compensate for them can
determine whether a project is delayed, approved in a timely manner, or not approved at all.
biological basis for ensuring protection or enhancement of the species affected by the project.
Development of effective compensation measures should involve the CEQA lead agency,
project proponent, wildlife agencies, and the affected public stakeholders, through the CEQA
process. Because a project’s operational fatalities cannot be forecast with precision, lead

7/28/2019 Estudio California CEC 700 2007 008 CMF
http://slidepdf.com/reader/full/estudio-california-cec-700-2007-008-cmf 81/165
agencies may
be
unable
to
make
some
compensation
decisions
until
fatality
data
have
been
collected. However, the general terms and funding commitments for future compensatory
mitigation and the triggers or thresholds for implementing such compensation should be
developed prior to issuing final permits. The lead agency can establish appropriate
compensation based on the pre‐permitting data, which should be implemented prior to project
operation. Then, if operational impacts exceed the threshold specified in the permit, additional
compensatory mitigation would be necessary. Additional compensatory mitigation beyond that
required at project approval should be well defined and feasible to implement, so the permittee
will have an understanding of any potential future mitigation requirements.
Compensation required as project mitigation must be monitored for success by the lead agency
pursuant to a CEQA mitigation monitoring plan. When a permit is required from CDFG or
USFWS, compensatory mitigation must satisfy those permit conditions to fully mitigate a
project’s effect on listed species.
The following potential compensation options are known to protect and enhance bird and bat
populations at biologically appropriate locations when properly designed and implemented:
• Offsite conservation and protection of essential habitat
‐ Nesting and breeding areas
‐ Foraging habitat
‐
Roosting
or
wintering
areas
‐ Migratory rest areas
‐ Habitat corridors and linkages
• Offsite conservation and habitat restoration
‐ Restored habitat function
‐ Increased carrying capacity
• Offsite habitat enhancement
‐ Predator control program(s)
Exotic/invasive species removal
banks need to be biologically suitable for the impacted species. Whether land is acquired
indirectly through a mitigation bank or directly through a project‐specific purchase or
easement, the mitigation should be consistent with certain aspects of CDFG’s official 1995 policy
on conservation banks <ceres.ca.gov/wetlands/policies/mitbank.html>. Potential mechanisms to

7/28/2019 Estudio California CEC 700 2007 008 CMF
http://slidepdf.com/reader/full/estudio-california-cec-700-2007-008-cmf 82/165
secure compensation
include
but
are
not
limited
to:
• The mitigation site must provide for the long‐term conservation of the target species and its
habitat.
• The site must be large enough to be ecologically self‐sustaining and/or part of a larger
conservation strategy.
• The site must be permanently protected through fee title and/or a conservation easement.
• Prior to sale of the property or easement or sale of credits at a mitigation bank, a resource
management plan should be approved by all appropriate agencies or a non‐governmental
organization involved in the property management.
• A sufficient level of funding with acceptable guarantees should be provided to fully ensure
the operation and maintenance of the property as may be required.
• Provisions should be made for the long‐term management of the property after the project
is completed
or
after
all
mitigation
credits
have
been
awarded
for
the
mitigation
bank.
• Provisions should be made for ensuring implementation of the resource management plan
in the event of non‐performance by the owner of the property or non‐performance by the
mitigation bank owner and/or operator.
• Provisions should be made for the monitoring and reporting on the identified
species/habitat management objectives, with an adaptive management/ effectiveness
monitoring loop to modify those management objectives as needed.
Regardless of the form of the compensatory mitigation, the permitting agency should establish
a nexus between the level of impact and the amount of mitigation. Unlike habitat impacts, in
which an acre of habitat loss can be compensated with an appropriate number of acres of
habitat protected or restored, bird and bat collisions with wind turbines are impacts that do not
suggest an obvious compensation ratio. Collision impacts take place in airspace rather than over
a specified acreage of land and are chronic impacts occurring each year. The impacts can extend
well beyond the local environment because the affected birds and bats are often migratory and
far ranging, sometimes coming from out of state or out of country. Finally, fatalities can vary
greatly between project sites and from year to year. Under these circumstances, it is difficult to
identify acreage of land that offers compensation value for some quantity of bird or bat
compensation formulas because all of these methods require some forecasting of impacts over
the life of the project based on pre‐permitting studies.
Operations Impact Mitigation and Adaptive Management

7/28/2019 Estudio California CEC 700 2007 008 CMF
http://slidepdf.com/reader/full/estudio-california-cec-700-2007-008-cmf 83/165
Operations impact mitigation and adaptive management generally occur only if the level of fatalities at a project site was unanticipated when the project was permitted, and therefore,
measures included in the permit are inadequate to avoid, minimize, or compensate for bird or
bat fatalities. Once a project is operating, it is difficult to modify turbine site layout, and
operations impact avoidance, minimization, and mitigation options are limited. Developing
contingencies and plans to mitigate high levels of unanticipated fatalities becomes even more
important when choices for operational impact avoidance or minimization are so limited. To
avoid open
‐ended
conditions
that
are
difficult
for
developers
to
include
when
planning
for
project costs and timing, establish minimization measures and compensatory mitigation that
could be needed for unexpected impacts as well as the thresholds that will trigger these actions.
Determine these measures and compensatory mitigation before permits are issued.
In extreme cases, the compensation specified in the permit may not be adequate for high levels
of unanticipated impacts, and project operators may need to consider operational and facility
changes. For
example,
if
a Category
3 site
is
developed
without
resolving
uncertainties
about
potential risk to birds and bats through pre‐permitting and operations monitoring studies,
adaptive management may be a necessary tool to reduce impacts to the level described in
permit conditions. The adaptive management process recognizes the uncertainty in forecasting
impacts to birds and bats and allows testing of options as experiments to achieve a goal and
determine impact avoidance, minimization, and mitigation effectiveness. These options include
maintenance activities or habitat modification to make the site less attractive to at‐risk species
and seasonal changes to cut‐in speed. During the bat migratory period, limited and periodic
feathering of wind turbines during low‐wind nights may help avoid impacts to bats. If multi‐
year monitoring documents high levels of fatalities, removal of problem turbines or seasonal
shutdowns of turbines may be options if other minimization measures are ineffective in
reducing fatalities.
Do not use adaptive management as a reason to defer impact analysis and mitigation
commitments. Rather, establish the biologically appropriate goals and triggers in the permitting
process. Mitigation measures should establish clear, objective, and verifiable biological goals, a
requirement to adjust management and/or mitigation measures if those goals are not met, and a
timeline for periodic reviews and adjustments.
develop management recommendations and may find it useful to establish a science advisory
committee for this purpose.

7/28/2019 Estudio California CEC 700 2007 008 CMF
http://slidepdf.com/reader/full/estudio-california-cec-700-2007-008-cmf 84/165
CHAPTER 5: OPERATIONS MONITORING ANDREPORTING

7/28/2019 Estudio California CEC 700 2007 008 CMF
http://slidepdf.com/reader/full/estudio-california-cec-700-2007-008-cmf 85/165
This chapter describes the standardized techniques recommended for collecting, interpreting, and reporting post‐construction operations monitoring data. The rationale for operations
monitoring at wind turbine sites is to collect bird and bat fatality data and bird use data and
compare them to use data and impact estimates from the pre‐permitting studies and other wind
energy facilities. This information is required to evaluate, verify, and report on compliance and
effectiveness of CEQA avoidance and minimization measures and to document compliance
with other applicable permit requirements. At a minimum, the primary objectives for
operations monitoring
are
to
determine:
• Whether estimated fatality rates described in pre‐permitting assessment were reasonably
accurate
• Whether the avoidance, minimization, and mitigation measures implemented for the
project were adequate or whether additional corrective action or compensatory mitigation
is warranted
• Whether overall
bird
and
bat
fatality
rates
are
low,
moderate,
or
high
relative
to
other
projects
On a larger scale, monitoring informs the development of new wind energy facilities in
California with project‐specific fatality data that will improve pre‐permitting estimates on other,
future projects. Collected in a consistent manner, including consistency with pre‐permitting
protocols and attention to environmental variables, monitoring data can provide insight into the
occurrence, magnitude, and reasons for bird and bat fatalities and will fine tune the
development of avoidance, minimization, and mitigation measures for wind energy projects
throughout the state.
Operations monitoring typically consists of counts of bird and bat carcasses in the vicinity of
wind turbines and ongoing bird use data collection. The number of carcasses counted during
operations monitoring is likely to be an underestimate of the birds and bats actually killed by
wind turbines for several reasons. Searchers will inevitably miss some of the carcasses. In
addition, some carcasses may disappear due to scavenging or be destroyed by farming activities such as plowing. Some birds and bats also may not be counted because they are injured by
turbines and fly or hop out of the search area. Most fatality estimates reported for wind energy
projects are therefore extrapolations of the number of fatalities with corrections for sampling
background fatality studies during the pre‐permitting studies or at reference sites during
operations monitoring to account for this potential bias in fatality estimates. Background fatality
survey methods should be consistent with carcass survey methods used at the turbines.

7/28/2019 Estudio California CEC 700 2007 008 CMF
http://slidepdf.com/reader/full/estudio-california-cec-700-2007-008-cmf 86/165
Duration of Operations Monitor ingThe duration of operations monitoring should be sufficient to determine whether pre‐
permitting estimates of impacts to birds or bats were reasonably accurate and to determine
whether turbines are causing unanticipated fatalities that require impact avoidance or
mitigation actions. Base the duration and focus of operations monitoring studies on the
availability of existing, site‐specific data; the species potentially affected; and the magnitude of
the anticipated effect. Consult the CDFG, USFWS, and other knowledgeable scientists and
appropriate stakeholders
regarding
study
protocol
and
the
duration
of
an
operations
monitoring program.
Category 2 and 3 projects will need two years of carcass count data to assess whether pre‐
permitting impact estimates were accurate, evaluate the effectiveness of mitigation measures,
and capture variability between years. Category 2 projects may be able to reduce the level of
study effort for year two if the results of year one monitoring indicate fatality rates equal to or
lower
than
those
estimated
during
pre‐
permitting
studies
and
if
CDFG,
USFWS,
and
experts
agree such a reduction is warranted. Category 3 projects may need additional study effort in
year two and possibly beyond if the first year of data shows fatalities higher than expected
and/or to different species than anticipated.
For both Category 2 and 3 projects, the results of the first year of data should be critically
assessed to determine which modifications, if any, are needed for the second year of study. For
example, the second year of fatality monitoring may need to focus more effort on turbines or
habitat types where impacts were higher than expected by shifting searches away from areas
that showed few or no fatalities. Similarly, first year monitoring results might warrant a
reallocation of study efforts to those seasons where more impacts were recorded.
Category 1 projects may need only one year of operations monitoring. Reduced monitoring
during the second year might be appropriate for Category 1 projects if the first year provides
scientifically defensible data documenting that fatality rates were as expected and similar to
those from nearby projects.
The two years of operations monitoring need not necessarily be consecutive. After monitoring
the turbines during the first year after operation, one option is to wait a few years to complete
mitigated. Upon completion of operations monitoring, CDFG, USFWS, and other scientists and
stakeholders who may have been involved in developing the operations monitoring protocol
should assess whether continued, long‐term monitoring of fatalities is warranted. Long‐term
monitoring on a periodic basis (for example, every five years) for the life of the project should
if
i
i i
d
h
i f i
h
j
i
i

7/28/2019 Estudio California CEC 700 2007 008 CMF
http://slidepdf.com/reader/full/estudio-california-cec-700-2007-008-cmf 87/165
occur if operations monitoring data or other new information suggests that project operation islikely to result in fatalities to birds or bats that were unanticipated and unmitigated during
permitting of the project. The purpose of such monitoring would be to gather information to
develop impact avoidance, minimization, and mitigation measures and to verify whether these
measures were effective in reducing fatalities. Factors to consider in assessing the potential for
unanticipated impacts include changes in bird and bat use of a site due to changes in habitat
conditions or shifts in migratory and movement patterns that are a result of climate change and
that might affect collision risk. Such long‐term monitoring could be coordinated with larger
regional studies within the entire wind resource area. Access to project sites for purposes of
long‐term monitoring should be permitted unless precluded by safety or private property
considerations.
Operations Monitoring for Repowered Sites
Operations monitoring for repowering projects will be similar to other wind energy projects
and
will
be
based
on
pre‐
permitting
site
screening
and
monitoring
results.
Additional
fatality
and use data that can augment the new data collection efforts may also be available from nearby
existing wind facilities. Generally, standardized protocol monitoring should be conducted to
determine operations fatality levels for birds and bats and whether the levels are approximately
those estimated during pre‐permitting assessment. The discussions in this chapter pertain to
repowering projects as well as other wind energy projects.
Determining Bird and Bat Abundance and Behavior DuringOperations
For Category 2 and 3 projects, conduct one year of bird use counts during project operation to
characterize bird species composition and abundance, behavior, and seasonal presence. This
information provides a context for interpreting fatality data, insight into turbine‐specific fatality
patterns, and a better understanding of the effects of the turbines on bird behavior and
distribution within the project area. The bird use count methods should be consistent with those
used during
the
pre
‐permitting
studies,
but
can
be
tailored
to
specifically
address
issues
that
may have arisen during those studies. For example, instead of conducting weekly counts
throughout the year for all birds at all turbine sites, the bird use counts may need to concentrate
survey efforts during a particular season, on certain species, or at specific problem locations
activity is a necessary adjunct to the bat fatality data. If such studies are warranted, methods
should be consistent with those used during pre‐permitting studies, and the study design
should be developed in consultation with CDFG, USFWS, and bat experts. Kunz (2004), Kunz et
al. (in prep), and the California Bat Working Group (2006) provide a discussion of post‐
t ti
th d
f
b t

7/28/2019 Estudio California CEC 700 2007 008 CMF
http://slidepdf.com/reader/full/estudio-california-cec-700-2007-008-cmf 88/165
construction survey methods for bats.
Carcass Searches
Establishing Carcass Search Plots
Establish search plots at approximately 30 percent of the turbines. The number of search plots
should reflect the desired precision in the fatality estimates. A sample larger or smaller than 30
percent may
be
needed
for
some
projects.
For
example,
projects
with
diverse
habitats
may
require sampling more than 30 percent of the turbines, while projects with more than 50
turbines may need fewer than 30 percent of the turbines sampled. The turbines to be sampled
can be selected at random, via stratification, or systematically as long as the lead agency, CDFG,
and USFWS has determined that the selection process is scientifically defensible. The
dimensions of carcass search plots will vary depending on turbine size and configuration and
characteristics of the site. The search area should have a width equal to the maximum rotor tip
height. For
example
if
the
rotor
tip
height
were
400
feet
(120
meters),
the
search
area
would
extend out 200 feet (60 meters) from the turbines on each side. The search area may be a
rectangle, square, or circle depending on turbine locations and arrangements. If the site is steep,
extend the search area on the downhill side because carcasses could fall farther from the
turbine. Studies conducted at other wind energy facilities indicate that most bat fatalities (more
than 80 percent) typically are found within half the maximum distance from the turbine tip
height to the ground (Kerns et al., 2005).
Surveyors can select a search area that does not encompass 100 percent of the carcasses, as
indicated by pilot searches or incidental observations of carcasses outside the search area.
However, surveyors must quantify that source of error, make corrections in the final calculation
of fatalities, and disclose that information in the monitoring report. Surveyors should establish a
search area that includes approximately 80 percent or more of the carcasses.
Another source of error in carcass counts is crippling bias, the undercounting that occurs
because some birds or bats might be injured by turbines and move outside of the search area. Accounting for crippling bias is difficult. This document does not provide recommendations for
methods to estimate crippling bias because such attempts in previous studies produced
relatively little relevant data per unit time of effort (EPRI et al., 2003).
with adjustment to the transect width for vegetation and topographic conditions on the site. The
rate of searching will also vary depending on terrain and vegetation. Searching an area at one
large turbine can take from one hour to several hours depending on the site conditions.
Collecting Carcass Data

7/28/2019 Estudio California CEC 700 2007 008 CMF
http://slidepdf.com/reader/full/estudio-california-cec-700-2007-008-cmf 89/165
Record and collect all carcasses located in the search areas (unless they are being used as part of
a scavenging trial) and determine a cause of death, if possible. Questions of non‐turbine caused
death may require necropsy. State and federal collecting permits are required to salvage dead
birds or bats and include specific data reporting requirements. For more information on when
to obtain federal permits, how to treat eagle carcasses, and where to obtain a permit application,
visit <www.fws.gov/permits/mbpermits/birdbasics>. For permit information from CDFG, visit
<www.dfg.ca.gov/licensing/specialpermits/specialpermits>.
The searcher should not necessarily assume that all carcasses in the search area are the result of
turbine strikes and should consider other causes such as wire strikes, vehicle collisions, and
electrocutions (Smallwood and Thelander, 2004). The condition of the carcass and location of
the bird or bat relative to turbines, transmission lines, and roads can provide vital clues as to the
cause of death and should be carefully observed and recorded. For example, birds or bats that
have severed body parts and are near turbines are likely turbine kills, whereas electrocuted
birds may have singe marks on the body and are typically found under power poles. Searchers have also found carcasses intact with no apparent cause of death, so documentation regarding
nearby structures is important. Consider any injured birds or bats encountered during the
search as fatalities unless the injured animal has been successfully rehabilitated and released to
the wild. Take injured birds or bats to a nearby rehabilitation center.
Record the carcass condition in one of the following categories (Anderson et al., 1999):
• Intact – a carcass that is not badly decomposed and shows no sign of having been fed upon
by a predator or scavenger, although it may show signs of traumatic injury such as
amputation from a turbine collision
• Scavenged – an entire carcass that shows signs of having been fed upon by a predator or
scavenger or a partial carcass that has been scavenged, with portions of it (for example,
wings, skeletal remains, legs, pieces of skin) found in more than one location
• Feather spot – 10 or more feathers at one location, indicating predation or scavenging
Data collected during each carcass search should include: a unique carcass identification
number, site, date, observer, species, sex, age, and when possible, time, condition (intact,
Remains of Selected Species of California Raptors <www.energy.ca.gov/2005publications/CEC‐500‐
2005‐001/CEC‐500‐2005‐001.PDF>.
Birds and bats collected during carcass counts can provide invaluable data for advancing
knowledge
about
the
geographic
source
and
abundance
of
resident
and
migratory
populations
Ti l b d f l i f i i i d l i f

7/28/2019 Estudio California CEC 700 2007 008 CMF
http://slidepdf.com/reader/full/estudio-california-cec-700-2007-008-cmf 90/165
knowledge about the geographic source and abundance of resident and migratory populations.Tissue samples can be used for analysis of genetic variation and population structure, for
assessing population size using DNA markers, and for assessing the geographic origin of
migrants based on stable isotope and genetic analysis (Simmons et al., 2006). Use of
mitochondrial and nuclear DNA sequence data derived from bats and birds killed by wind
turbines also offers the potential for identifying closely related or cryptic species. For bats, the
American Museum of Natural History in New York serves as a repository for carcasses and
tissues collected from dead bats recovered beneath wind turbines or from other sources (contact
Dr. Nancy B. Simmons, e‐mail: [email protected]).
Frequency of Carcass Searches
Carcass searches for birds and bats should occur approximately every two weeks, with searches
more or less frequent if pilot scavenging trials indicate high or low levels of carcass removal.
Small birds and bats may be scavenged more quickly than large birds (Morrison 2002), which
may warrant searches more frequently than every two weeks at sites where pre‐permitting
studies indicate high potential for impacts to these smaller species and where scavenging rates
are high. Establish the frequency of carcass searches at a wind energy project site after
analyzing the results of pilot scavenging trials and in consultation with USFWS, CDFG, and
other knowledgeable scientists and appropriate stakeholders. Carcass removal rates can vary
greatly between project sites. Therefore, researchers should not rely on removal rates from other
projects unless compelling evidence is available to demonstrate that these rates are truly
applicable.
Most researchers conduct carcass searches on a regular schedule of days (for example, every 3,
7, 14, or 30 days) with the assumption that fatalities occur at uniformly distributed, independent
random times between search days. If the search interval is more than seven days, researchers
can relax this assumption by conducting searches over multiple days to better assess temporal
variation in fatality rates. Researchers should be aware that if the fatalities are highly clustered,
as might be the case with rare periodic fatalities of migratory birds or bats, estimates of fatalities
could be
biased,
especially
if
carcass
removal
rates
are
high.
The
study
design
for
carcass
searches can involve intensive searches at a subset of the turbines, with less frequent sampling
at the remainder of the carcass search plots. This stratified sampling can help clarify the
relationship between weather events and fatalities and allow researchers to fine tune the
f l f h l f h d d h
Bias Correction
Researchers have noted numerous sources of bias in the carcass count that can make the
extrapolated estimate of bird and bat fatalities too high or too low (Morrison, 2002; Smallwood,
2006). Therefore, estimates of fatalities must incorporate corrections based on searcher efficiency
and scavenging rates as described below and these estimates must be statistically independent

7/28/2019 Estudio California CEC 700 2007 008 CMF
http://slidepdf.com/reader/full/estudio-california-cec-700-2007-008-cmf 91/165
and scavenging rates, as described below, and these estimates must be statistically independent of each other. Because season, topography, and vegetation influence searcher efficiency and
scavenging, calculate these correction factors based on season and vegetation‐specific data for
every study. Correction factors should not rely on literature values because of substantial
variability between studies and sites.
Searcher Effic iency
Searchers will
vary
in
their
ability
to
detect
dead
birds
or
bats
in
the
field
because
of
inherent
individual differences (visual acuity, physical vigor, motivation, experience, and training) and
differences in field conditions (weather, vegetation density, and height). Morrison (2002) found
that the number of carcasses that searchers found varied considerably depending on observer
training, vegetation type, and size of the bird. Estimates of animal fatalities in wind
developments are therefore biased by inefficiencies of observers. Researchers need to quantify
and correct for these variations as much as possible.
Base corrections for searcher efficiency on vegetation type, plant phenology (season), and bird
or bat size. Searchers tend to underestimate the number of small bird fatalities, and tall, dense
vegetation also decreases detection rates (Morrison, 2002; Kerns et al., 2005). Searchers may also
easily overlook bats because of their small size and cryptic coloration (Keeley et al., 2001; Arnett
and Tuttle, 2004). To correct for variation in searcher efficiency, conduct on‐site trials to test
each searcher using fresh carcasses of species likely to occur in the project area. Be aware that
observer detection rates may change as carcasses decompose. Personnel conducting searches
should not know when trials are being conducted because awareness of the trial makes
searchers more vigilant and generally improves search results. Conduct trials at regular
intervals throughout all four seasons to address changes in vegetation and weather. Geo‐
reference the planted carcasses by GPS and mark them in a fashion that is not detectable to the
searcher. Spread the carcasses across a large area so that searchers are less likely to suspect or
recognize that a trial is in process. If new searchers are added to the search team, conduct
additional detection trials to ensure that detection rates incorporate searcher differences.
Trained search dogs can enhance the efficiency of carcass searches, particularly in dense
vegetation (Arnett, 2006; Gutzwiller, 1990; Homan et al., 2001). While the olfactory abilities of
dogs can increase detection rates, relying on dog‐enhanced searches can introduce new biases
the removal rate. Check planted carcasses at least every day for a minimum of the first three
days and thereafter at intervals determined by results from pilot scavenger trials. Track the
percentage of carcasses removed, and use that information to adjust fatality rates (Gauthreaux,
1995; Erickson, 2004) and to help determine the appropriate search interval.
Conduct Carcass Removal Trials

7/28/2019 Estudio California CEC 700 2007 008 CMF
http://slidepdf.com/reader/full/estudio-california-cec-700-2007-008-cmf 92/165
Conduct Carcass Removal Trials
Researchers should conduct carcass removal trials by planting a sufficient number of carcasses
at the site to calculate percent recovery (for example, percent recovery cannot be calculated with
just two carcasses) but should not put out so many that scavengers are swamped with a
superabundance of food. Spread trials over spring, summer, fall, and winter to incorporate
effects of varying weather conditions and scavenger densities. Researchers have reported
seasonal variation in carcass removal rates (Morrison, 2002). Also consider the effects of carcass
size (Gauthreaux, 1995) and use different sizes of birds, ranging from large to small, in the trials. A small bird is defined as a bird 10 inches (25 centimeters) or smaller in body length (beak to
tail tip); a large bird, as greater than 10 inches. In establishing the scavenging estimates,
researchers should be aware that smaller birds might disappear more frequently and more
quickly than larger birds (Orloff and Flannery, 1992; Gauthreaux, 1995).
Conduct carcass removal trials throughout the monitoring period because removal rates may
vary as scavengers come and go and as they learn to search near wind turbines. Ravens, coyotes, and other vertebrate predators are fast learners when it comes to exploiting new food
sources (Erickson et al., 2004). A few individual scavengers that have learned to incorporate
wind turbines into their daily foraging routine could make large differences in carcass removal
rates over the course of a study (Smallwood, 2006). Such changes can only be assessed and
corrected if scavenging studies continue throughout the monitoring period.
Fresh carcasses
representing
local
species
are
often
difficult
to
secure,
and
permission
from
USFWS and CDFG is required for use of raptor carcasses. Carcasses for the experiments can be
birds collected during carcass searches, road‐killed birds (if fresh), and carcasses from
veterinary colleges or wildlife rehabilitation centers. Verify carcasses from the latter sources as
free of disease and poison. House sparrows and brown‐headed cowbirds, which are often
available from wildlife control programs, are a potential source of surrogates for small bird
searches. Finding suitable surrogates for bat carcasses is a particular problem because few
studies have addressed bat scavenging. Using domestic species should be avoided if possible
because these surrogate carcasses may provide different cues that could affect their detection
and appeal to scavengers. If using frozen specimens, thaw them completely prior to use.
The state of decay of the carcasses is also important to consider Some scavengers may not be
should establish criteria for removing carcasses and report the criteria and removal protocol in
the monitoring report.
Data Analysis and Metrics
Estimates
of
bird
and
bat
fatalities
must
incorporate
corrections
based
on
searcher
efficiency
and scavenging rates Corrections for scavenging play an important role in extrapolation of

7/28/2019 Estudio California CEC 700 2007 008 CMF
http://slidepdf.com/reader/full/estudio-california-cec-700-2007-008-cmf 93/165
p yand scavenging rates. Corrections for scavenging play an important role in extrapolation of
fatality estimates, so researchers must consider all components of the scavenger trials carefully
and make a complete disclosure of all assumptions and methods in the monitoring reports. The
larger the correction factor, the higher the uncertainty in the fatality estimates. Calculate
corrected fatality rates as the observed‐per‐MW fatality rate divided by the estimated average
probability a carcass is available during a search and is found. The denominator in this formula
is a function of carcass removal, searcher efficiency, interval between searches, search area
visibility index, and other factors. Other analyses might include correlations of fatality metrics
with environmental and turbine characteristics such as wind speed, prey availability, turbine
rotations per minute, and lighting.
Gauthreaux (1995), Orloff and Flannery (1992), Kerns and Kerlinger (2004), Erickson (2004),
Shoenfeld (2004), and Smallwood (2006) provide details on formulae and methods for
calculating adjusted fatality rates and other factors affecting fatality rates. Appendix F provides
a suggested formula for adjusting fatality rates. In expressing the fatality rate, use the number of fatalities per MW of installed capacity per year as the metric. This avoids the problem of
comparing turbines that have substantially different rotor‐swept areas and capacities.
Reporting Monitor ing Data
CEQA requires a public agency to adopt a program for monitoring or reporting mitigation
measures identified in an EIR or negative declaration to make sure those measures are being
implemented (see CEQA Guidelines §15097 and Public Resources Code §21081.6[a]).
ʺReportingʺ generally consists of a written compliance review that is presented to the decision‐
making body or authorized staff person. A report may be required by lead agencies at various
stages during project implementation or upon completion of the mitigation. Individual project
permits typically specify which agencies should receive monitoring reports directly. In the
context of CEQA, ʺmonitoringʺ is generally an ongoing or periodic process of project oversight.
CEQA monitoring ensures that project compliance is checked on a regular basis during and
after implementation, and reporting ensures that the approving agency is informed of compliance.
Operations monitoring reports are crucial to improving the accuracy of future pre‐permitting
observations of special‐status species to the California Natural Diversity Database (CNDDB)
<www.dfg.ca.gov/bdb/html/submitting_data_to_cnddb.html>.
Making pre‐permitting and operations bird and bat data publicly available serves several
important functions and would be a useful permit condition of all wind energy projects. Aside
from facilitating maximum utility of results from bird and bat surveys, sharing the data may

7/28/2019 Estudio California CEC 700 2007 008 CMF
http://slidepdf.com/reader/full/estudio-california-cec-700-2007-008-cmf 94/165
from facilitating maximum utility of results from bird and bat surveys, sharing the data may
foster collaboration among individuals working on similar projects in various parts of the state.
Operations monitoring reports and raw data have value as public documents because they
facilitate the learning process for application on subsequent projects and can supplement
baseline data for nearby new projects. Making raw data available to the public is useful in
cumulative impact analyses and potentially provides an overview of trends. Additional study
results from impact avoidance, minimization, and mitigation monitoring and adaptive
management programs would similarly be useful to the public.
Where to Submit Bird and Bat Data
The Energy Commission and CDFG encourage data owners to share raw data by participating
in CDFG’s Biogeographic Information and Observation System (BIOS) program
<www.dfg.ca.gov/biogeodata/bios>. Contributing data to a central online repository like BIOS
will help others make data comparisons among wind energy‐related biological datasets and
ultimately help inform and improve management decisions. Another benefit of contributing to
BIOS is that datasets can be viewed without specialized software and in conjunction with other
data layers (for example, geographic features, other species, critical habitat) to accommodate
larger planning efforts. Individual data owners may also limit data access to selected groups or
individuals, but those submitting data should be careful not to include information that may be
considered proprietary or confidential.
At this
time,
the
recommended
method
of
submitting
raw
bird
and
bat
data
and
monitoring
reports to BIOS is for data owners to send electronic data to the Energy Commission’s Biology
Unit Supervisor (contact information follows below). Energy Commission staff will then work
closely with BIOS staff to upload the dataset to BIOS, which involves data review and possible
formatting to fit the BIOS Data Viewer. The BIOS program’s guidelines for contributors note the
following necessary elements of data submittals: 1) electronic format, 2) geographic locations of
biological observations including projected or geographic coordinate system and datum, 3)
attributes
defining
observational
data,
and
4)
metadata.
If
desired,
monitoring
reports
(preferably in PDF format) can be stored along with raw data for particular projects on BIOS.
Please e‐mail a complete dataset (smaller than 8 megabytes) with metadata to
b l l h b b l d f l
observations through BIOS. A standard database and format for metadata will help streamline
the uploading and updating of datasets to the California Wind Energy Biological Database on
BIOS. The Energy Commission and CDFG are also considering a future project to develop a
Web portal for receiving wind‐related BIOS data submissions.
Self-Reporting of Incidental Findings

7/28/2019 Estudio California CEC 700 2007 008 CMF
http://slidepdf.com/reader/full/estudio-california-cec-700-2007-008-cmf 95/165
p g g
Field personnel at wind energy facilities can augment information from operations monitoring
programs by reporting incidental findings of dead or injured birds and bats. Orloff and
Flannery (1992) provide guidance and template data sheets for self‐reporting monitoring
programs, which are typically implemented in collaboration with USFWS. The Avian Powerline
Interaction Committee (APLIC, 2006) also offers suggestions on developing avian fatality
reporting programs by trained field personnel. While not part of a systematic data collection
effort, incidental observation data from trained workers who record and report bird and bat
carcasses discovered in the project area can supplement fatality data from the standard
operations monitoring studies. If such incidental observations are to be included in the data
analysis and monitoring reports, researchers should coordinate closely with field personnel
collecting the data, establish criteria for which self‐reported data are appropriate for inclusion,
and fully describe the criteria and protocol for incidental observation data collection in the
monitoring reports.
It is also helpful to submit incidental findings and observations to BIOS (common species) and
CNDDB (special‐status species) because other researchers and future nearby projects can benefit
from a larger body of existing public data for a wind resource area. However, the absence of
fatality records from self‐reporting monitoring programs and databases like BIOS and CNDDB
should not be used to demonstrate absence of fatalities.

7/28/2019 Estudio California CEC 700 2007 008 CMF
http://slidepdf.com/reader/full/estudio-california-cec-700-2007-008-cmf 96/165
REFERENCESAble, K. P., “A Radar Study of the Altitude of Nocturnal Passerine Migration,” Journal of Field
Ornithology, Volume 41, 1970, pp. 282–290.
Abl K P d S A G h J “Q ifi i f N l P i Mi i i h

7/28/2019 Estudio California CEC 700 2007 008 CMF
http://slidepdf.com/reader/full/estudio-california-cec-700-2007-008-cmf 97/165
Able, K. P., and S. A. Gauthreaux, Jr., “Quantification of Nocturnal Passerine Migration with a
Portable Ceilometer,” Condor , Volume 77, 1975, pp. 92–96.
Anderson, R. L., M. Morrison, K. Sinclair, and D. Strickland, Studying Wind Energy/Bird
Interactions: A Guidance Document , National Wind Coordinating Committee, Washington,
D.C., 1999. Available at
<www.nationalwind.org/publications/wildlife/avian99/Avian_booklet.pdf>.
Anderson, R. L., J. Tom, N. Neumann, J. Cleckler, and J. A. Brownell, Avian Monitoring and Risk
Assessment at Tehachapi Pass Wind Resource Area, California, 1995 , progress report to the
California Energy Commission, CEC‐700‐95‐001, 1995.
Anderson, R. L., J. Tom, N. Neumann, W. P. Erickson, M. D. Strickland, M. Bourassa, K. J. Bay,
and K.
J.
Sernka,
Avian
Monitoring
and
Risk
Assessment
at
the
San
Gorgonio
Wind
Resource
Area , National Research Energy Laboratory, Golden, Colorado, NREL/SR‐500‐38054,
2005.
Arnett, E. B. “A Preliminary Evaluation on the Use of Dogs to Recover Bat Fatalities at Wind
Energy Facilities,” Wildlife Society Bulletin Volume 34, Issue 5, 2006.
Arnett, E. B. (technical ed.), Relationships Between Bats and Wind Turbines in Pennsylvania and West
Virginia: An Assessment of Bat Fatality Search Protocols, Patterns of Fatality, and Behavioral
Interactions with Wind Turbines , Bat Conservation International, Austin, Texas, 2005.
Arnett, E. B., K. Brown, W. P. Erickson, J. Fiedler, T. H. Henry, G. D. Johnson, J. Kerns, R. R.
Kolford, C. P. Nicholson, T. O’Connell, M. Piorkowski, and R. Tankersley, Jr., “Patterns
of Fatality of Bats at Wind Energy Facilities in North America,” Journal of Wildlife
Management , Volume 71, in press.
Arnett, E. B., and M. D. Tuttle, “Cooperative Efforts to Assess the Impacts of Wind Turbines on
Bats,” Bat Research News , Volume 45, Issue 4, 2004, pp. 201–202.
Barclay, R. M. R., E. F. Baerwald, and J. C. Gruver, “Variation in Bird and Bat Fatalities at Wind
Energy Facilities: Assessing the Effects of Rotor Size and Tower Height,” Canadian
Journal of Zoology , Volume 85, 2007, pp. 381‐387.
Bloom, P. H., Raptor Status and Management Recommendations for Naval Ordnance Center, Pacific
Division, Fallbrook Detachment, and Naval Weapons Station, Seal Beach, 1993/95 ,

7/28/2019 Estudio California CEC 700 2007 008 CMF
http://slidepdf.com/reader/full/estudio-california-cec-700-2007-008-cmf 98/165
unpublished report for Southwest Division, Naval Facilities Engineering Command, San
Diego, California, May 1, 1996.
Bloom, P. H., Draft Project Report for Avian Predator Abundance and Usage at Naval Weapons
Station, Seal Beach, California , Western Foundation of Vertebrate Zoology, in prep.
Bruderer, B., and L. Jenni, “Migration Across the Alps,” in E. Gwinner (ed.), Bird Migration: Physiology and Ecophysiology , Springer Verlag, Berlin, 1990, pp. 61–77.
Buckland, S. T., R. Anderson, K. P. Burnham, J. L. Laake, D. L. Borchers, and L. Thomas, An
Introduction to Distance Sampling , Oxford University Press, Oxford, United Kingdom,
2001.
California Bat Working Group, Guidelines for Assessing and Minimizing Impacts to Bats at Wind Energy Development Sites in California , September 2006. Available at
<www.wbwg.org/Papers/CBWG%20wind%20energy%20guidelines.pdf>.
California Resources Agency, Guidelines for Implementation of the California Environmental Quality
Act , Sacramento, California, 2006. Available at
<ceres.ca.gov/topic/env_law/ceqa/guidelines/>.
Canadian Wildlife Service, Recommended Protocols for Monitoring Impacts of Wind Turbines on
Birds , Environment Canada, July 28, 2006.
Desholm, M., Thermal Animal Detection System (TADS): Development of a Method for Estimating
Collision Frequency of Migrating Birds at Offshore Wind Turbines , National Environmental
Research Institute, Technical Report, Volume 440, 2003, p. 27. Available at
<www2.dmu.dk/1_viden/2_Publikationer/3_fagrapporter/rapporter/FR440.pdf>.
Desholm, M., T. Fox, and P. Beasley, Best Practice Guidance for the Use of Remote Techniques for
Observing Bird Behavior in Relation to Offshore Windfarms , Collaborative Offshore Wind
R h i t th E i t 2004 A il bl t
EPRI et al., Bird Strike Indicator/Bird Activity Monitor and Field Assessment of Avian Fatalities , EPRI,
Palo Alto, California; Audubon National Wildlife Refuge, Coleharbor, North Dakota;
Edison Electric Institute, Washington, D.C.; Bonneville Power Administration, Portland,
Oregon; California Energy Commission, Sacramento, California; NorthWestern Energy,
Butte, Montana; Otter Tail Power Company, Fergus Falls, Minnesota; Southern
California Edison, Rosemead, California; Western Area Power Administration,
k d l d A l bl h // / /

7/28/2019 Estudio California CEC 700 2007 008 CMF
http://slidepdf.com/reader/full/estudio-california-cec-700-2007-008-cmf 99/165
Lakewood, Colorado, 2003. Available at <http://www.energy.ca.gov/reports/2004‐03‐
05_500‐03‐107F.PDF>
Erickson, W. P., “Bird and Bat Fatality Monitoring Methods,” Proceedings of the Wind Energy and
Birds/Bats Workshop: Understanding and Resolving Bird and Bat Impacts , Washington, D.C.,
May 18–19, 2004 , Susan Savitt Schwarz (ed.), September 2004.
Erickson, W. P., “Example Impact Assessment Methods at Wind Projects,” presentation at
Toward Wildlife‐Friendly Wind Power: a Focus on the Great Lakes, June 27–29, 2006,
Toledo, Ohio. Available at
<www.fws.gov/midwest/greatlakes/windpowerpresentations/erickson.pdf>.
Erickson, W. P., J. Jeffrey, K. Kronner, and K. Bay, Stateline Wind Project Wildlife Monitoring
Annual Report,
Results
for
the
Period
July
2001
–
December
2002 , report submitted to FPL
Energy, the Oregon Office of Energy, and the Stateline Technical Advisory Committee,
2003.
Erickson, W. P., J. Jeffrey, K. Kronner, and K. Bay, Stateline Wind Project Wildlife Monitoring
Annual Report, Results for the Period July 2001 – December 2003 , report submitted to FPL
Energy, the Oregon Office of Energy, and the Stateline Technical Advisory Committee,
2004.
Erickson, W. P., G. D. Johnson, M. D. Strickland, and K. Kronner, Avian and Bat Mortality
Associated with the Vansycle Wind Project, Umatilla County Oregon: 1999 Study Year ,
technical report prepared by WEST, Inc. for Umatilla County Department of Resource
Services and Development, Pendleton, Oregon, 2000.
Erickson, W. P., G. D. Johnson, M. D. Strickland, K. J. Sernka, and R. E. Good, Avian Collisions
with Wind Turbines: A Summary of Existing Studies and Comparisons to Other Sources of
Avian Collision Mortality in the United States, report prepared for the National Wind
Coordinating Committee, 2001. Available at <http://www.west‐inc.com>.
Erickson, W. P., M. D. Strickland, G. D. Johnson, and J. Shaffer, Protocol for Investigating
Displacement Effects of Wind Facilities on Grassland Songbirds , peer‐reviewed technical
publication prepared for the National Wind Coordinating Committee, 2007.
Evans, W. R., “Applications of Acoustic Bird Monitoring for the Wind Power Industry,”
Proceedings from the National Avian‐Wind Power Planning Meeting III, San Diego, California,
M 1998 LGL Ltd E i t l R h A i t Ki Cit O t i J 2000

7/28/2019 Estudio California CEC 700 2007 008 CMF
http://slidepdf.com/reader/full/estudio-california-cec-700-2007-008-cmf 100/165
May 1998, LGL, Ltd., Environmental Research Associates, King City, Ontario, June 2000.
Evans, W. R., Y. Akashi, N. S. Altman, and A. M. Manville, 2007, Response of Night‐ Migrating
Birds in Cloud to Colored and Flashing Light , a report to the Communications Tower
Working Group, January 2007. Available from author by correspondence (e‐mail:
Farnsworth, A., S. A. Gauthreaux, Jr., and D. Van Blaricom, “A Comparison of Nocturnal Call
Counts of Migrating Birds and Reflectivity Measurements on Doppler Radar,” Journal of
Avian Biology, Volume 35, 2004, pp. 365–369.
Federal Aviation Administration, Obstruction Marking and Lighting , Advisory Circular AC‐
70/7460‐1K, Effective February 1, 2007.
Fenton, M. B. “Science and the Conservation of Bats,” Journal of Mammalogy Volume 78, 1997,
pp. 1‐14.
Garrison, B. A., “Distribution and Trends in Abundance of Rough‐Legged Hawks Wintering in
California,” Journal of Field Ornithology, Volume 64, Issue 4, 1993, pp. 566–574.
Gauthreaux, S.
A.,
Jr.,
“A
Portable
Ceilometer
Technique
for
Studying
Low
Level
Nocturnal
Migration,” Journal of Field Ornithology, Volume 40, 1969, pp. 309–319.
Gauthreaux, S. A., Jr., Radar, Electro‐optical, and Visual Methods of Studying Bird Flight near
Transmission Lines , Electric Power Research Institute, Palo Alto, California, 1985.
Gauthreaux, S. A., Jr., “Suggested Practices for Monitoring Bird Populations, Movements, and
Mortality in Wind Resource Areas,” Proceedings of National Avian‐Wind Power Planning
Meeting, Denver, Colorado, 20–21 July, 1994 , LGL Ltd., Environmental Research
Associates, King City, Ontario, 1995. Available at
<www.nationalwind.org/publications/wildlife/avian95/avian95‐10.htm>.
Guillemette, M., J. K. Larsen, and I. Clausager, Assessing the Impact of the Tunø Knob Wind Park on
Sea Ducks: the Influence of Food Resources , National Environmental Research Institute,
technical report No. 263, February 1999. Available at
<www2.dmu.dk/1_viden/2_Publikationer/3_fagrapporter/rapporter/fr263.pdf>.
Gutzwiller, K. J., “Minimizing Dog‐Induced Biases in Game Bird Research,” Wildlife Society
Bulletin Volume 18 1990 pp 351 356
7/28/2019 Estudio California CEC 700 2007 008 CMF
http://slidepdf.com/reader/full/estudio-california-cec-700-2007-008-cmf 101/165
Bulletin, Volume 18, 1990, pp. 351–356.
Hayes, J. P., “Temporal Variation in Activity of Bats and the Design of Echolocation‐Monitoring
Studies,” Journal of Mammalogy, Volume 78, 1997, pp. 514–524.
Hejl, S. J., and E. C. Beedy, “Weather‐Induced Variation in the Abundance of Birds,” in J.
Verner, M. L. Morrison, and C. J. Ralph (eds.), Wildlife 2000: Modeling Habitat Relationships of Terrestrial Vertebrates , University of Wisconsin Press, Madison, Wisconsin,
1986, pp. 241–244.
Homan, H. J., G. Linz, and B. D. Peer, “Dogs Increase Recovery of Passerine Carcasses in Dense
Vegetation,” Wildlife Society Bulletin, Volume 29, 2001, pp. 292–296.
Horn, J.,
T.
H.
Kunz,
and
E.
B.
Arnett,
“Interactions
of
Bats
with
Wind
Turbines
Based
on
Thermal Infrared Imaging,” Journal of Wildlife Management , Volume 71, in press.
Howell, J. A., and J. Noone, Examination of Avian Use and Mortality at a U.S. Windpower Wind
Energy Development Site, Solano County, California , final report to Solano County
Department of Environmental Management, Fairfield, CA, 1992.
Hunt, W.
G.,
A
Pilot
Golden
Eagle
Population
Project
in
the
Altamont
Pass
Wind
Resource
Area,
California , prepared by The Predatory Bird Research Group, University of California,
Santa Cruz, for The National Renewable Energy Laboratory, Golden, Colorado, 1995.
Hunt, W. G., Golden Eagles in a Perilous Landscape: Predicting the Effects of Mitigation for Wind
Turbine Blade‐Strike Mortality , California Energy Commission report, P500‐02‐043F,
Sacramento, California, 2002.
Hunt, W. G., R. E. Jackman, T. L. Brown, and L. Culp, A Population Study of Golden Eagles in the
Altamont Pass Wind Resource Area: Population Trend Analysis 1994–1997 , report to the
National Renewable Energy Laboratory, Subcontracts XAT‐6‐16459‐01 to the Predatory
Bi d R h G U i it f C lif i S t C 1999
Johnson, G. D., “A Review of Bat Mortality at Wind‐Energy Developments in the United
States,” Bat Research News, Volume 46, Issue 2, 2005, pp. 45–49.
Johnson, G. D., W. P. Erickson, M. D. Strickland, M. F. Shepherd, and D. A. Shepherd, Final
Report: Avian Monitoring Studies at the Buffalo Ridge, Minnesota Wind Resource Area: Results
of a 4‐Year Study , prepared for Northern States Power, Minnesota, by Western
EcoSystems Technology Inc September 22 2000

7/28/2019 Estudio California CEC 700 2007 008 CMF
http://slidepdf.com/reader/full/estudio-california-cec-700-2007-008-cmf 102/165
EcoSystems Technology, Inc., September 22, 2000.
Keeley, B., S. Ugoretz, and D. Strickland, “Bat ecology and wind turbine considerations,”
Proceedings of the National Avian‐Wind Power Planning Meeting, National Wind
Coordinating Committee, Washington, D.C., Volume 4, 2001, pp. 135–146.
Kepler, C. B., and J. M. Scott, “Reducing Bird Count Variability by Training Observers,” Studies in Avian Biology, Volume 6, 1981, pp. 366–371.
Kerlinger, P., How Birds Migrate, Stackpole Books, Mechanicsburg, Pennsylvania, 1995.
Kerlinger, P., “Attraction of Night Migrating Birds to FAA and Other Types of Lights,”
Proceedings of the: Onshore Wildlife Interactions with Wind Developments: Research Meeting V ,
Lansdowne, Virginia,
November
3–4,
2004,
prepared
for
the
Wildlife
Subcommittee
of
the National Wind Coordinating Committee by RESOLVE, Inc., Washington, D.C., 2004.
Kerlinger, P. R., “Phase I Risk Assessment for Wind Power Facilities,” Proceedings of the Onshore
Wildlife Interactions with Wind Developments: Research Meeting V, Lansdowne, Virginia,
November 3–4, 2004, prepared for the Wildlife Subcommittee of the National Wind
Coordinating Committee by RESOLVE, Inc., Washington, D.C., 2005.
Kerlinger, P., R. Curry, L. Culp, A. Jain, C. Wilkerson, B. Fischer, and A. Hasch, Post‐
Construction Avian and Bat Fatality Monitoring Study for the High Winds Power Project,
Solano County, California: Two Year Report , prepared for High Winds, LLC and FPL
Energy by Curry & Kerlinger, LLC, April 2006.
Kerlinger, P., and F. R. Moore, “Atmospheric Structure and Avian Migration,” Current
Ornithology, Volume 6, 1989, pp. 109–142.
Kerns, J., and P. Kerlinger, A Study of Bird and Bat Collision Fatalities at the Mountaineer Wind
Energy Center, Tucker County, West Virginia: Annual Report For 2003 , technical report
d f FPL E d M t i Wi d E C t T h i l R i
submitted to the Bats and Wind Energy Cooperative, Bat Conservation International,
Austin, Texas, 2005, pp. 24–95.
Kunz, T. H., “Roosting Ecology of Bats,” in T. H. Kunz (ed.), Ecology of Bats , Plenum Press, New
York, 1982, pp. 1–55.
Kunz T H “Wind Power: Bats and Wind Turbines ”Proceedings of the Wind Energy and

7/28/2019 Estudio California CEC 700 2007 008 CMF
http://slidepdf.com/reader/full/estudio-california-cec-700-2007-008-cmf 103/165
Kunz, T. H., Wind Power: Bats and Wind Turbines , Proceedings of the Wind Energy and
Birds/Bats Workshop: Understanding and Resolving Bird and Bat Impacts , Washington, D.C.,
May 18–19, 2004, prepared by RESOLVE, Inc., Washington, D.C., September 2004.
Available at
<www.awea.org/pubs/documents/WEBBProceedings9.14.04%5BFinal%5D.pdf>.
Kunz, T. H., E. B. Arnett, W. P. Erickson, A. R. Hoar, G.D. Johnson, R. P Larkin, M. D. Strickland, R. W. Thresher, and M. D. Tuttle. “Ecological Impacts of Wind Energy
Development on Bats: Questions, Research”, Frontiers in Ecology and the Environment,
Volume 5, Issue 6, 2007, pp. 315–324.
Kunz, T. H., E. B. Arnett, B. Cooper, W. P. Erickson, R. P. Larkin, T. Mabee, M. L. Morrison, M.
D. Strickland, and J. M. Szewczak, “Methods and Metrics for Assessing Impacts of Wind
Energy Development
on
Nocturnally
Active
Birds
and
Bats,”
in
prep.
Kunz, T. H., C. R. Tidemann, and G. C. Richards, “Capturing Mammals: Small Volant
Mammals,” in D. E. Wilson, F. R. Cole, J. D. Nichols, R. Rudran, and M. S. Foster (eds.),
Measuring and Monitoring Biological Diversity: Standard Methods for Mammals , Smithsonian
Institution Press, Washington, D.C., 1996, pp. 22–146.
Lausen,
C.,
E.
Baerwald,
J.
Gruver,
and
R.
Barclay,
“Bats
and
Wind
Turbines:
Pre‐
Siting
and
Pre‐
Construction Survey Protocols,” in M. Vonhof (ed.), Handbook of Inventory Methods and
Standard Protocols for Surveying Bats in Alberta , Appendix 5. Alberta Sustainable Resource
Development, Fish and Wildlife Division, Edmonton, Alberta, 2002, Revised 2005, 2006.
Available at <www.wbwg.org/Papers/TurbineProtocol15May06R.pdf>.
Leddy, K. L., K. F. Higgins, and D. E. Naugle, “Effects of Wind Turbines on Upland Nesting
Birds in Conservation Reserve Program Grasslands,” Wilson Bulletin, Volume 111, 1999,
pp. 100–104.
Mabee, T. J, J. H. Plissner, B. A. Cooper, R. H. Day, A. Prichard, and A. Gall, “Designing Radar
St di f N t l Bi d Mi ti t Wi d E P j t ” P P i t t ti
RESOLVE, Inc., Washington, D.C., September 2004. Available at
<www.awea.org/pubs/documents/WEBBProceedings9.14.04%5BFinal%5D.pdf>.
McCrary, M. D., R. L. McKernan, R. E. Landry, W. D. Wagner, and R. W. Schreiber, Nocturnal
Avian Migration Assessment of the San Gorgonio Wind Resource Study Area, Spring 1982 ,
report prepared for Research and Development, Southern California Edison Company,
1983.

7/28/2019 Estudio California CEC 700 2007 008 CMF
http://slidepdf.com/reader/full/estudio-california-cec-700-2007-008-cmf 104/165
1983.
Morrison, M., Avian Risk and Fatality Protocol , National Research Energy Laboratory, Golden,
Colorado, NREL/SR‐500‐24997, November 1998. Available at
<www.nrel.gov/docs/fy99osti/24997.pdf>.
Morrison, M., Searcher Bias and Scavenging Rates in Bird/Wind Energy Studies , National Research
Energy Laboratory, Golden, Colorado, NREL/SR‐500‐30876, June 2002. Available at
<www.nrel.gov/docs/fy99osti/24997.pdf>.
National Wind Coordinating Committee, Mitigation Toolbox , compiled by NWCC Mitigation
Subgroup & Jenny Rectenwald, Consultant, National Wind Coordinating Committee,
Washington, D.C., May 2007. Available at
<www.nationalwind.org/publications/wildlife/Mitigation_Toolbox.pdf>.
National Wind Coordinating Committee, Wind Turbine Interactions with Birds and Bats: A
Summary of Research Results and Remaining Questions. Fact sheet: Second Edition , National
Wind Coordinating Committee, Washington, D.C., 2004. Available at
<www.nationalwind.org/publications/wildlife/wildlife_factsheet.pdf>.
Norvell,
R.
E.,
F.
P.
Howe,
and
J.
R.
Parrish,
“A
Seven‐
Year
Comparison
of
Relative
Abundance
and Distance‐Sampling Methods,” Auk, Volume 120, 2003, pp. 1013–1028.
OʹFarrell, M. J., B. W. Miller, and W. L. Gannon, “Qualitative Identification of Free‐Flying Bats
Using the Anabat Detector,” Journal of Mammalogy , Volume 80, 1999, pp. 11–23.
Orloff, S., and A. Flannery, Wind Turbine Effects on Avian Activity, Habitat Use, and Mortality in
Altamont Pass and Solano County WRAs , prepared for the California Energy Commission
by BioSystems Analysis, Inc., Tiburon, California, CEC‐ 700‐92‐001, 1992.
Orloff, S., and A. Flannery, A Continued Examination of Avian Mortality in the Altamont Pass Wind
R A fi l t t th C lif i E C i i b Bi S t A l i
Pendelton, G. W., “Effects of Sampling Strategy, Detection Probability, and Independence of
Counts on the Use of Point Counts,” in C. J. Ralph, J. R. Sauer, and S. Droege (eds.),
Monitoring Bird Populations by Point Counts, U.S. Department of Agriculture, Forest
Service general technical report, PSW‐GTR‐149, 1995, pp.131–133.
Pierson, E. D., M. C. Wackenhut, J. S. Altenbach, P. Bradley, P. Call, D. L. Genter, C. E. Harris, B.
L. Keller, B. Lengus, L. Lewis, B. Luce, K. W. Navo, J. M. Perkins, S. Smith, and L. Welch,

7/28/2019 Estudio California CEC 700 2007 008 CMF
http://slidepdf.com/reader/full/estudio-california-cec-700-2007-008-cmf 105/165
, g , , , , J , , ,
Species Conservation Assessment and Strategy for Townsendʹs Big‐Eared Bat (Corynorhinus
townsendii townsendii and Corynorhinus townsendii pallescens) , Idaho Conservation
Effort, Idaho Department of Fish and Game, Boise, Idaho, 1999. Available at the Western
Bat Working Group Web site <www.wbwg.org>.
Racey, P. A., and A. C. Entwistle, “Life History and Reproductive Strategies of Bats,” in E. G. Crighton and P. H. Krutzsch (eds.), Reproductive Biology of Bats , Academic Press, New
York, 2000, pp. 363–414.
Rainey, W. E., “Tools for low‐disturbance monitoring of bat activity,” in B. R. Riddle (ed.),
Inactive Mines as Bat Habitat: Guidelines for Research, Survey, Monitoring and Mine
Management in Nevada , Biological Research Center, University of Nevada, Reno, 1995,
pp. 62–71.
Rainey, W. E., M. E. Power, and S. M. Clinton, “Temporal and Spatial Variation in Aquatic
Insect Emergence and Bat Activity in a Restored Floodplain Wetland,” Consumnes
Research Group: Final Report, California Bay‐Delta Authority Ecosystem Restoration
Program and National Fish & Wildlife Foundation , 2006. Available at
<baydelta.ucdavis.edu/files/crg/reports/AquaticInsectBat_Raineyetal2006.pdf>.
Ralph, C. J., S. Droege, and J. R. Sauer, “Managing and Monitoring Birds Using Bird Point
Counts: Standards and Applications,” in J. R. Sauer, S. Droege (eds.) , Monitoring Bird
Populations by Point Counts , general technical report PSW‐GTR‐149, Albany, California,
Southwest Research Station, Forest Service, U.S. Department of Agriculture, 1995.
Ralph, C. J., G. R. Geupel, P. Pyle, T. E. Martin, and D. F. DeSante, Handbook of Field Methods for
Monitoring Landbirds , general technical report PSW‐GTR‐144, Albany, California, Pacific
Southwest Research Station, Forest Service, U.S. Department of Agriculture, 1993.
Available at <www.fs.fed.us/psw/publications/documents/gtr‐144/>.
R ld D S “M it i th P t ti l I t f Wi d D l t Sit B t i th
Rosenstock, S. S., D. R. Anderson, K. M. Giesen, T. Leukering, and M. F. Carter, “Landbird
Counting Techniques: Current Practices and an Alternative,” Auk, Volume 119, 2002, pp.
46–53.
Savard, J. L., and T. D. Hooper, “Influence of Survey Length and Radius Size on Grassland Bird
Surveys by Point Counts at Williams Lake, British Columbia,” in C. J. Ralph, J. R. Sauer,
7/28/2019 Estudio California CEC 700 2007 008 CMF
http://slidepdf.com/reader/full/estudio-california-cec-700-2007-008-cmf 106/165
y y p
S. Droege (eds.), Monitoring Bird Populations by Point Counts , general technical report
PSW‐GTR‐149, Albany, California, Southwest Research Station, Forest Service, U.S.
Department of Agriculture, 1995.
Sawyer, J. O., and T. Keeler‐Wolf, A Manual of California Vegetation , Sacramento, California, 1995.
Schlorff, R. W., Five‐Year Status Review: Greater Sandhill Crane (Grus canadensis tabida), California
Department of Fish and Game Wildlife Management Division, Nongame Bird and
Mammal Program, Sacramento, California, 1994.
Schmidt, E., A. J. Piaggio, C. E. Bock, and D. M. Armstrong, National Wind Technology Center Site
Environmental Assessment: Bird and Bat Use and Fatalities – Final Report, NREL/SR‐500‐
32981, National
Renewable
Energy
Laboratory,
Golden,
Colorado,
2003.
Seber, G. A. F., The Estimation of Animal Abundance and Related Parameters , Macmillan Publishing
Company, New York, 1982.
Shoenfeld, P., Suggestions Regarding Avian Mortality Extrapolation , unpublished report to West
Virginia Highlands Conservancy, Davis, West Virginia, 2004.
Simmons, N. B., M. J. Vonhof, T. L. King, and G. F. McCracken, “Documenting the Effects of
Wind Turbines on Bat Populations Using Genetic Data,” presentation at the Wildlife
Workgroup Research Meeting VI, November 14–16, 2006, San Antonio, TX , National Wind
Coordinating Committee, Washington, DC, 2006. Available at
<www.nationalwind.org/events/wildlife/2006‐3/presentations/applicable/Simmons.pdf>.
Smallwood, K. S., Biological Effects of Repowering a Portion of the Altamont Wind Resource Area,
California: the Diablo Winds Energy Project , unpublished report, July 27, 2006.
Smallwood, K. S., and L. Neher, Repowering the APWRA: Forecasting and Minimizing Avian
M t lit With t Si ifi t L f P G ti C lif i E C i i
Consultants, August 2004. Available at
<www.energy.ca.gov/pier/final_project_reports/500‐04‐052.html>.
Smallwood, K. S., and C. Thelander, Bird Mortality at the Altamont Pass Wind Resource Area,
March 1998–September 2001 Final Report , National Renewable Energy Laboratory,
NREL/SR‐500‐36973, Golden, Colorado, 2005.

7/28/2019 Estudio California CEC 700 2007 008 CMF
http://slidepdf.com/reader/full/estudio-california-cec-700-2007-008-cmf 107/165
Somershoe, S. C., D. J. Twedt, and B. Reid, “Combining Breeding Bird Survey and Distance
Sampling to Estimate Density of Migrant and Breeding Birds,” Condor, Volume 108,
Issue 3, 2006, pp. 691–699.
Strickland, M. D., W. M. Block, W. L. Kendall, and M. L. Morrison, “Wildlife Study Design,”
Springer Series on Environmental Management , Springer Verlag, New York, New York, 2002.
Strickland, M. D., W. P. Erickson, G. Johnson, D. Young, and R. Good, “Risk Reduction Avian
Studies at the Foote Creek Rim Wind farm in Wyoming,” Proceedings of the National
Avian‐Wind Power Planning Meeting IV, Carmel, CA, May 16–17, 2000 , National Wind
Coordinating Committee, Washington, D.C., 2001, pp. 107–114.
Strickland, M. D., D. Johnson, W. P. Erickson, and G. D. Johnson, “Overview of What We Know
About Avian/Wind Interactions,” presentation at the National Wind Coordinating
Committees Wildlife‐Wind Research Planning Meeting VI, November 14‐16, 2006, San Antonio,
Texas, 2006.
Watson, D. M., “The ʹStandardized Searchʹ: An Improved Way to Conduct Bird Surveys,”
Austral Ecology, Volume 28, Issue 5, 2003, p. 515.
WEST, Inc., Combine Hills Wildlife Monitoring Report, Combine Hills Oregon, unpublished report,
2006.
WEST, Inc., Diablo Winds Wildlife Monitoring Progress Report: March 2005–February 2006 ,
unpublished report, 2006.
WEST, Inc. and Northwest Wildlife Consultants, Inc., Wildlife Baseline Study for the Nine Canyon
Wind Project , technical report prepared for Energy Northwest, unpublished report, 2001.
WEST I d N th t Wildlif C lt t I A i d B t M t liti f th Fi t Y
Young, Jr., D. P., W. P. Erickson, R. E. Good, and G. D. Johnson, Avian and Bat Mortality
Associated with the Initial Phase of the Foote Creek Rim Wind Power Project, Carbon County,
Wyoming, November 1998–June 2002 , final report, January 10, 2003. Available at
<www.west‐inc.com>.

7/28/2019 Estudio California CEC 700 2007 008 CMF
http://slidepdf.com/reader/full/estudio-california-cec-700-2007-008-cmf 108/165
LIST OF ACRONYMSAPLIC Avian Power Line Interaction Committee
BACI before‐after/control‐impact
BIOS
Biogeographic Information and Observation System
BUC bird use count
C SIL C lif i S ti l I f ti Lib

7/28/2019 Estudio California CEC 700 2007 008 CMF
http://slidepdf.com/reader/full/estudio-california-cec-700-2007-008-cmf 109/165
CaSIL California Spatial Information Library
CDFG California Department of Fish and Game
CEQA California Environmental Quality Act
CESA California Endangered Species Act
CNDDB California Natural Diversity Database
CWHR
California Wildlife Habitat Relationships System
FAA Federal Aviation Administration
FESA Federal Endangered Species Act
GPS global positioning system
ITP Incidental Take Permit
MBTA Migratory Bird Treaty Act
NAIP National Agriculture Imagery Program
NEPA
National Environmental Policy Act NWCC National Wind Coordinating Committee
PIER Public Interest Energy Research
SBC small bird count
TADS thermal animal detection systems
USFWS U.S. Fish and Wildlife Service
USGS U.S. Geological Survey

7/28/2019 Estudio California CEC 700 2007 008 CMF
http://slidepdf.com/reader/full/estudio-california-cec-700-2007-008-cmf 110/165
APPENDIX A: CONTACT INFORMATION FORTHE CALIFORNIA DEPARTMENT OF FISH AND
GAME HEADQUARTERS AND REGIONSDepartment of Fish and Game Headquarters
1416 9th Street Sacramento CA 95814

7/28/2019 Estudio California CEC 700 2007 008 CMF
http://slidepdf.com/reader/full/estudio-california-cec-700-2007-008-cmf 111/165
1416 9th Street, Sacramento, CA 95814
Information Desk: Room 117
(916) 445‐0411
http://www.dfg.ca.gov/direc/contact.html
Northern Region
(Region
1)
601 Locust Street, Redding, CA 96001
(530) 225‐2300
http://www.dfg.ca.gov/regions/region1.html
Del Norte, Humboldt, Lassen, Mendocino, Modoc, Shasta, Siskiyou, Tehama, and Trinity
Counties
North Central Region (Region 2)
1701 Nimbus Road, Rancho Cordova, CA 95670
(916) 358‐2900
http://www.dfg.ca.gov/regions/region2.html
Alpine, Amador, Butte, Calaveras, Colusa, El Dorado, Glenn, Lake, Nevada, Placer, Plumas,
Sacramento (north of railroad tracks), San Joaquin (east of Interstate 5), Sierra, Solano,
Sutter, Yolo (north of railroad tracks), and Yuba Counties
Bay Delta
Region
(Region
3)
7329 Silverado Trail, Napa, CA 94558
(707) 944‐5517
http://www.dfg.ca.gov/regions/region3.html
Alameda, Contra Costa, Marin, Napa, Sacramento (south of railroad tracks), San Joaquin
(west of Interstate 5), San Mateo, Santa Clara, Santa Cruz, San Francisco, Sonoma Solano,
and Yolo (south of railroad tracks) Counties
Central Region (Region 4)
1234 E. Shaw Avenue, Fresno, CA 93710
(559) 243 4014 x 210
South Coast Region (Region 5)
4949 Viewridge Avenue, San Diego, CA 92123
(858) 467‐4201
http://www.dfg.ca.gov/regions/region5.html
Los Angeles, Orange, San Diego, Santa Barbara, and Ventura Counties
Inland Deserts Region (Region 6)
3602 Inland Empire Boulevard Suite C‐220 Ontario CA 91764‐4913

7/28/2019 Estudio California CEC 700 2007 008 CMF
http://slidepdf.com/reader/full/estudio-california-cec-700-2007-008-cmf 112/165
3602 Inland Empire Boulevard, Suite C‐220, Ontario, CA 91764‐4913
(909) 484‐0167
http://www.dfg.ca.gov/regions/region6.html
Imperial, Inyo, Mono, Riverside, and San Bernardino Counties
Marine Region
(Region
7)
Department of Fish and Game Headquarters, 1416 Ninth Street, Sacramento, CA 95814
(831) 649‐2870
http://www.dfg.ca.gov/mrd/index.html
California coastline from border to border and three nautical miles out to sea

7/28/2019 Estudio California CEC 700 2007 008 CMF
http://slidepdf.com/reader/full/estudio-california-cec-700-2007-008-cmf 113/165

7/28/2019 Estudio California CEC 700 2007 008 CMF
http://slidepdf.com/reader/full/estudio-california-cec-700-2007-008-cmf 114/165
APPENDIX B: CONTACT INFORMATION FORUNITED STATES FISH AND WILDLIFE SERVICE
ECOLOGICAL SERVICES OFFICES WITHJURISDICTION IN CALIFORNIAArcata

7/28/2019 Estudio California CEC 700 2007 008 CMF
http://slidepdf.com/reader/full/estudio-california-cec-700-2007-008-cmf 115/165
Arcata
1655 Heindon Road
Arcata, CA 95521
(707) 822‐7201
http://www.fws.gov/arcata/
Yreka (Arcata sub office)
1829 S. Oregon Street
Yreka, CA 96097
(530) 842‐5763
http://www.fws.gov/yreka/
Sacramento
2800 Cottage Way
Room W‐2605
Sacramento, CA 95825
(916) 414‐6600
http://www.fws.gov/sacramento/
Red Bluff
10950 Tyler Road
Red Bluff, CA 96080
(530) 527‐3043
http://www.fws.gov/redbluff/
Ventura
2493
Portola
Road
Suite B
Ventura, CA 93003
(805) 644‐1766
Klamath Falls, OR
6610 Washburn Way
Klamath Falls, OR 97603
(541) 885‐8481
http://www.fws.gov/klamathfallsfwo/
Reno, NV
1340 Financial Boulevard
Suite 234
Reno, NV 89502
(775) 861‐6300
http://www.fws.gov/nevada/
Pacific Region Office
911 NE 11th Avenue
Portland, OR 97232
(503) 231‐6118
http://www.fws.gov/pacific/
California/Nevada Operations Office
2800 Cottage Way
Room W‐2606
Sacramento, CA 95825
(916) 414‐6464
http://www.fws.gov/cno/

7/28/2019 Estudio California CEC 700 2007 008 CMF
http://slidepdf.com/reader/full/estudio-california-cec-700-2007-008-cmf 116/165
APPENDIX C: GLOSSARY OF TERMSAccuracy: The agreement between a measurement and the true or correct value.
Adaptive mitigation/management: An analytical process for adjusting management and
research decisions to better achieve management objectives, such as reducing bird
f t liti f ti f i d t bi

7/28/2019 Estudio California CEC 700 2007 008 CMF
http://slidepdf.com/reader/full/estudio-california-cec-700-2007-008-cmf 117/165
fatalities from operation of a wind turbine.
Avian: Pertaining to or characteristic of birds.
Before‐
after/control‐
impact:
A
study
design
that
involves
comparisons
of
observational
data, such as bird counts, before and after an environmental disturbance and in a
disturbed and undisturbed site. This study design allows a researcher to assess the
effects of constructing and operating a wind turbine by comparing data from the
“control” sites (before and undisturbed) with the “treatment” sites (after and disturbed).
Buffer zone: Non‐disturbance areas that provide a protected zone for sensitive resources
such as raptor nests or bat roosts.
California Environmental Quality Act (CEQA): (Refers to California Public Resources
Code section 21000 et seq. and the CEQA Guidelines.) Enacted in 1970, CEQA requires
California public agency decision makers to document and consider the environmental
impacts of their actions. It also requires an agency to identify ways to avoid or reduce
environmental damage and to implement those measures where feasible and provides a
means to encourage public participation in the decision‐making process.
Category 1: A classification of a proposed wind energy project site that is characterized
by the availability of data on wind‐wildlife interactions from nearby, similar projects.
Category 1 projects might include infill projects, repowering projects, and those near
existing, well‐studied wind resource areas.
Category 2: A classification of a proposed wind energy site characterized by little
existing information
and
no
indicators
of
high
wildlife
impacts.
Category 3: A classification of a proposed wind energy site characterized by high or
uncertain potential for wildlife impacts For example sites with known avian migration
Category 4: A classification of a proposed wind energy site that is inappropriate for
wind energy development, such as land protected by local, state, or federal government
and sites for which existing data indicates unacceptable risk of bird or bat fatalities.
Ceilometer: A device used for monitoring the number and types of birds that pass through a given area at night. It uses a conical light beam oriented into the sky so that an
observer can count and categorize the birds that pass through the beam.
7/28/2019 Estudio California CEC 700 2007 008 CMF
http://slidepdf.com/reader/full/estudio-california-cec-700-2007-008-cmf 118/165
Coefficient of variation: The standard deviation expressed as a percentage of the mean
used to measure the imprecision in a survey estimate due to sampling error. A high
coefficient of variation (for example 50 percent) would indicate an imprecise estimate.
Confidence intervals: A measure of the precision of an estimated value. The interval
represents the range of values, consistent with the data, which is believed to encompass
the ʺtrueʺ value with high probability (usually 95 percent).
Contour hunting: A foraging method typical of some raptors, such as golden eagles, in
which a bird will fly 3 to 10 feet (1 to 3 meters) above ground, the flight path conforming
to features of the landscape.
Cumulative impact: The effect on the environment that results from the incremental
impact of the action when added to other past, present, and reasonably foreseen future
actions. Cumulative impacts result from individually minor but collectively significant
actions taking place over a period of time.
Decommissioning: The closure of a facility followed by the removal of equipment and
structures. For wind turbines, decommissioning involves removal of turbine
foundations (to four feet below ground level), as well as other features such as fencing
and access roads.
Detection function: The probability of observing an object, such as a bird, given that the
bird is a certain known distance from the observer. Detection function is an important
component for estimating density of a population because it allows estimation of the
overall probability of detecting an individual.
Displacement effects: Displacement refers to the indirect loss of habitat if birds or bats
id j t it d it di d t di t b Di l t l
Echolocation: The detection of an object by means of reflected sound. The animal emits a
sound, usually at a very high frequency, which bounces off an object and returns as an
echo. Interpreting the echo and the time taken for it to return allows the animal to
determine the position, distance, and size of the object and thus helps the animal to
orientate, navigate, and find food.
Empidonax flycatcher: A genus of flycatchers that includes 11 species in North America.
Bi d i thi k f l ki k bl lik d ft di ti i h bl

7/28/2019 Estudio California CEC 700 2007 008 CMF
http://slidepdf.com/reader/full/estudio-california-cec-700-2007-008-cmf 119/165
Birds in this group are known for looking remarkably alike and are often distinguishable
only by their vocalizations, breeding habitat, nest structure, or by examination in the
hand. California supports one species of Endangered Empidonax , the willow flycatcher
(Empidonax traillii).
Environmental Impact Report: A detailed document prepared in accordance with the
California Environmental Quality Act that describes and analyzes the environmental
impacts of a project and discusses ways to mitigate or avoid those impacts.
Exit count: A technique for observing bats in which an observer watches a roost at dusk
to count the bats emerging from it.
Falconiformes: A classification of birds containing the diurnal birds of prey, including
falcons, hawks, vultures, and eagles.
Feathering: A form of overspeed control for wind turbines that occurs either by rotating
the individual blades to reduce their angle into the wind, thereby reducing rotor speed,
or by turning the whole unit out of the wind. When rotors are feathered they are pitched
parallel to the wind, essentially making them stationary.
Flyway: A broad‐front band or pathway used in migration.
Fossorial: Adapted for digging or burrowing.
Fully protected species: A statutory designation created by the California legislature for
some species of birds, reptiles, and fish. By statute, permits are not allowed for the
taking of fully protected species unless it is required for scientific research or recovery
purposes.
G O f l i f l t d d i f th G
Habitat: The place where an animal or plant usually lives, often characterized by a
dominant plant form or physical characteristic.
Harp traps: Traps used to capture bats and consisting of one or more rectangular frames,
strung with a series of vertical wires or monofilament lines usually spaced about 1 inch
(2.5 centimeters) apart. When a bat hits the bank of wires, or lines, it falls into a bag
beneath the trap where it can be retrieved and examined.
7/28/2019 Estudio California CEC 700 2007 008 CMF
http://slidepdf.com/reader/full/estudio-california-cec-700-2007-008-cmf 120/165
Impact gradient analysis: A sampling design used to detect the effects of an
environmental disturbance when no reference areas are available. This design assumes
that the impact is greatest closest to the disturbance, and the effects of the disturbance
decline with
distance
from
it.
Incidental finds: Carcasses found by personnel at times other than the scheduled
carcass search.
Indirect impact: Impacts that are caused by a project but occur at a different time or
place (for example, displacement of local populations).
Initial Study: A study required by the California Environmental Quality Act when a
lead agency proposes a discretionary project. The initial study determines whether the
project may have a significant effect on the environment and provides information about
why an Environmental Impact Report or negative declaration should be prepared.
Large birds: Birds larger than 10 inches (25 centimeters) in length, as described in the
National Geographic Field Guide to the Birds of North America.
Large‐sized turbine: A wind turbine capable of generating 750 kW or more of electricity.
Lattice design: A wind turbine design characterized by a structure with horizontal bars
rather than a single pole supporting the nacelle and rotor.
Lead agency: The public agency that has the principal responsibility for carrying out or
approving a project.
Line transect: A method of monitoring, which involves traveling a pre‐determined path,
”li ” f d t i d di t (th t t) ti bj t f i t t
Macrositing: The selection of large wind resource areas suitable for regional
development.
Medium‐sized turbine: A turbine that is capable of generating between 400 kW and 750
kW of electricity.
Megawatt (MW): A measurement of electric‐generating capacity equivalent to 1,000
kilowatts (kW) or 1 000 000 watts

7/28/2019 Estudio California CEC 700 2007 008 CMF
http://slidepdf.com/reader/full/estudio-california-cec-700-2007-008-cmf 121/165
kilowatts (kW), or 1,000,000 watts.
Metadata: The California Department of Fish and Game’s Biogeographic Information
and Observation System (BIOS) program defines metadata as information about data
that describes
its
“who,
what,
where,
when,
why,
and
how.”
Metadata
describes
the
purpose, intended uses, limitations, assumptions, data collection methods, and results,
and ideally, it includes a detailed definition of each field within a dataset. BIOS
considers metadata to include both the geographic information necessary to define the
data in space and the scientific reporting information associated with data quality and
use.
Micrositing: Small‐scale site selection for wind turbines, typically involving placement
of turbines; involves locating the placement of turbines, roads, power lines, and other
facilities.
Migration: Regular, extensive, seasonal movements of birds between their breeding
regions and their ʺwinteringʺ regions.
Migratory flyway: A broad geographical swath through which migratory birds travel
seasonally between breeding grounds to wintering areas. California is within the Pacific
Flyway, one of four major waterfowl flyways in North America.
Migratory route: Migration routes or corridors are the relatively predictable pathways
that a migratory species travels between breeding and wintering grounds. Migratory
routes are diverse and vary widely between species.
Monitoring: A continuous, ongoing process of project oversight. Monitoring, rather than
simply reporting, is suited to projects with complex mitigation measures that may
exceed the expertise of the local agency to oversee, that are expected to be implemented
i d f ti th t i f l i l t ti t li
Pacific Flyway: The westernmost route of North America’s four major migratory routes,
extending from Alaska to Central America.
Parameter: A statistical term denoting a numerical characteristic about the population of
interest.
Passerine: Describes birds that are members of the Order Passeriformes, typically called
ʺsongbirds ʺ

7/28/2019 Estudio California CEC 700 2007 008 CMF
http://slidepdf.com/reader/full/estudio-california-cec-700-2007-008-cmf 122/165
songbirds.
Phenology: The study of the relationship between climate and the timing of periodic
natural phenomena such as migration of birds, bud bursting, or flowering of plants.
Point count: A count of bird detections recorded by an observer from a fixed
observation point and over a specified time interval.
Population: A group of individuals in a particular location that are of the same species
and can reproduce with each other.
Precision: The repeatability or reproducibility of a measurement, without respect to its
correctness (accuracy).
Range: The distance between the highest and lowest score. Range is one of several
indices of variability that statisticians use to characterize the dispersion among the
measures in a given population.
Raptor: Pertaining to eagles, hawks, and owls; birds which are predatory, preying upon
other animals.
Relative abundance: A percent measure or index of abundances of individuals of all
species in a community.
Renewable energy: Energy resources that do not get depleted because they renew
themselves. Sources of renewable energy include solar, wind, geothermal hydroelectric,
and biomass.
Reporting: A written review of mitigation activities that is presented to the approving
b d b ith t ff th j t d l A t b i d t i t
Riparian: The vegetation, habitats, or ecosystems that are associated with streams,
rivers, or lakes, or are dependent upon the existence of perennial, intermittent, or
ephemeral surface or subsurface water drainage.
Rotor: The part of a wind turbine that interacts with wind to produce energy. It consists of the turbine’s blades and the hub to which the blades attach.
Rotor‐swept area: The vertical airspace within which the turbine blades rotate on a pivot

7/28/2019 Estudio California CEC 700 2007 008 CMF
http://slidepdf.com/reader/full/estudio-california-cec-700-2007-008-cmf 123/165
oto swept a ea: e ve tica ai space wit i w ic t e tu bi e b ades otate o a pivot
point or drive train rotor.
Significant: According to CEQA Guidelines, “A project has a significant effect on the
environment if,
among
other
things,
it
substantially
reduces
the
habitat
of
a fish
or
wildlife species, causes a fish or wildlife population to drop below self‐sustaining levels,
threatens to eliminate a plant or animal community, substantially reduces the number or
restricts the range of an endangered, rare, or threatened species.” (CEQA Guidelines
§15065[a][1]).
Small birds: Birds 10 inches (25 centimeters) in length or smaller.
Small‐sized turbine: A turbine that is capable of generating between 40 kW and 400 kW
of electricity.
Songbird: A bird, especially one of the suborder Oscines of passerine birds, having a
melodious song or call.
Special‐status species: Animals or plants in California that belong to one or more of the
following categories:
• Listed on California Department of Fish and Game’s Special Animals List
<www.dfg.ca.gov/biogeodata/cnddb/pdfs/SPAnimals.pdf>
• Officially listed or proposed for listing under the California and/or Federal
Endangered Species Acts
• State or federal candidate for possible listing
• Taxa that meet the criteria for listing, even if not currently included on any list, as
described in section 15380 of the California Environmental Quality Act Guidelines
T id d b th C lif i D t t f Fi h d G t b S i f
• Populations in California that may be on the periphery of a taxon’s range, but are
threatened with extirpation in California
• Taxa closely associated with a habitat that is declining in California at an alarming
rate (for example, wetlands, riparian, old growth forests, desert aquatic systems,
native grasslands, vernal pools, etc.)
• Taxa designated as a special‐status, sensitive, or declining species by other state or
federal agencies or non‐governmental organization

7/28/2019 Estudio California CEC 700 2007 008 CMF
http://slidepdf.com/reader/full/estudio-california-cec-700-2007-008-cmf 124/165
Species richness: The number of species in a given area.
Standard deviation: A statistical measure of spread or variability defined as the square
root of the sum of squared differences between the average value and all observed
values.
Standard error: An estimate of the standard deviation of the sampling distribution of
means, based on the data from one or more random samples.
Strigiformes: A classification of birds that includes owls.
Strobe light: Light consisting of pulses (of light) that are high in intensity and short in
duration.
Take: Defined by California Department of Fish and Game (Fish and Game Code §86)
as: “To hunt, pursue, catch, capture or kill, or attempt to hunt, pursue, catch, capture, or
kill.” Under the federal Migratory Bird Treaty Act, “take” means to pursue, hunt, shoot,
wound, kill, trap, capture, or collect, or attempt to pursue, hunt, shoot, wound, kill, trap, capture, or collect (50 CFR 10.12). Under the Bald and Golden Eagle Protection Act,
“take” includes to pursue, shoot, shoot at, poison, wound, kill, capture, trap, collect, or
molest or disturb (50 CFR 22.3).
Taxon: A classification or group of organisms (that is, kingdom, phylum, class, order,
family, genus, species). Plural: taxa.
Trustee agency: A state agency such as the Department of Fish and Game that has
jurisdiction over natural resources affected by a project, as defined by CEQA.
Turbine height: The distance from the ground to the highest point reached by the blades
of a wind turbine.
Use permit: An entitlement granted by the appropriate county agency pursuant to the
county zoning
ordinance
governing
the
design,
operation,
and
occupancy
of
land
uses
on a specific property.
Variance: A statistical measure of the dispersion of a set of values about its mean.

7/28/2019 Estudio California CEC 700 2007 008 CMF
http://slidepdf.com/reader/full/estudio-california-cec-700-2007-008-cmf 125/165
Wind resource area: The geographic area or footprint within which wind turbines are
located and operated. The term may be used to describe an existing facility or a general
area in
which
development
of
a facility
is
proposed.
Wind turbine: A machine for converting the kinetic energy in wind into mechanical
energy, which is then converted to electricity.

7/28/2019 Estudio California CEC 700 2007 008 CMF
http://slidepdf.com/reader/full/estudio-california-cec-700-2007-008-cmf 126/165
APPENDIX D: SCIENTIFIC NAMES OF BIRDS AND MAMMALS MENTIONED IN TEXT
Common Name
Scientific
Name
BIRDS
American kestrel Falco sparverius
American peregrine falcon Falco peregrinus

7/28/2019 Estudio California CEC 700 2007 008 CMF
http://slidepdf.com/reader/full/estudio-california-cec-700-2007-008-cmf 127/165
American peregrine falcon Falco peregrinus
Bald eagle Haliaeetus leucocephalus
Burrowing owl Athene cunicularia
Brown‐headed cowbird Molothrus ater
California condor Gymnogyps californianus Common nighthawk Chordeiles minor
Cooper’s hawk Accipiter cooperii
Golden eagle Aquila chrysaetos
Greater prairie chicken Tympanuchus cupido
Horned lark Eremophila alpestris
House sparrow Passer domesticus
Marbled murrelet Brachyramphus marmoratus Northern goshawk Accipiter gentilis
Red‐tailed hawk Buteo jamaicensis
Rough‐legged hawk Buteo lagopus
Sage grouse Centrocercus urophasianus
Sandhill crane Grus canadensis
Short‐eared owl Asio flammeus
Spotted owl Strix occidentalis Swainson’s hawk Buteo swainsonii
White‐tailed kite Elanus leucurus
Willow flycatcher Empidonax traillii
MAMMALS
California ground squirrel Spermophilus beecheyi
Eastern red bat Lasiurus borealis
Hoary bat Lasiurus cinereus Mexican free‐tailed bat Tadarida brasiliensis
Silver haired bat Lasionycteris noctivagans

7/28/2019 Estudio California CEC 700 2007 008 CMF
http://slidepdf.com/reader/full/estudio-california-cec-700-2007-008-cmf 128/165
APPENDIX E: SAMPLE DATA SHEETSThe following samples provide suggested data sheets and coding for use when
conducting
bird
use
counts
or
fatality
studies
and
other
field
surveys.

7/28/2019 Estudio California CEC 700 2007 008 CMF
http://slidepdf.com/reader/full/estudio-california-cec-700-2007-008-cmf 129/165

7/28/2019 Estudio California CEC 700 2007 008 CMF
http://slidepdf.com/reader/full/estudio-california-cec-700-2007-008-cmf 130/165

7/28/2019 Estudio California CEC 700 2007 008 CMF
http://slidepdf.com/reader/full/estudio-california-cec-700-2007-008-cmf 131/165

7/28/2019 Estudio California CEC 700 2007 008 CMF
http://slidepdf.com/reader/full/estudio-california-cec-700-2007-008-cmf 132/165

7/28/2019 Estudio California CEC 700 2007 008 CMF
http://slidepdf.com/reader/full/estudio-california-cec-700-2007-008-cmf 133/165

7/28/2019 Estudio California CEC 700 2007 008 CMF
http://slidepdf.com/reader/full/estudio-california-cec-700-2007-008-cmf 134/165

7/28/2019 Estudio California CEC 700 2007 008 CMF
http://slidepdf.com/reader/full/estudio-california-cec-700-2007-008-cmf 135/165

7/28/2019 Estudio California CEC 700 2007 008 CMF
http://slidepdf.com/reader/full/estudio-california-cec-700-2007-008-cmf 136/165

7/28/2019 Estudio California CEC 700 2007 008 CMF
http://slidepdf.com/reader/full/estudio-california-cec-700-2007-008-cmf 137/165

7/28/2019 Estudio California CEC 700 2007 008 CMF
http://slidepdf.com/reader/full/estudio-california-cec-700-2007-008-cmf 138/165

7/28/2019 Estudio California CEC 700 2007 008 CMF
http://slidepdf.com/reader/full/estudio-california-cec-700-2007-008-cmf 139/165

7/28/2019 Estudio California CEC 700 2007 008 CMF
http://slidepdf.com/reader/full/estudio-california-cec-700-2007-008-cmf 140/165
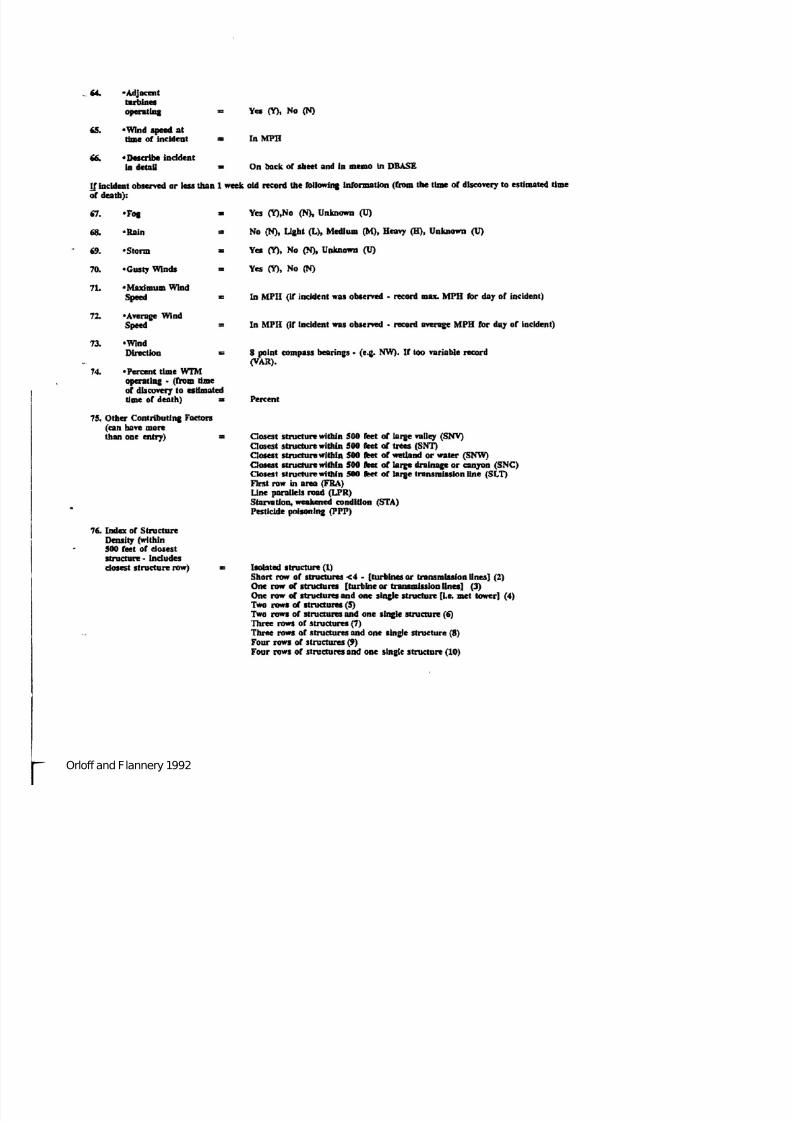
7/28/2019 Estudio California CEC 700 2007 008 CMF
http://slidepdf.com/reader/full/estudio-california-cec-700-2007-008-cmf 141/165

7/28/2019 Estudio California CEC 700 2007 008 CMF
http://slidepdf.com/reader/full/estudio-california-cec-700-2007-008-cmf 142/165

7/28/2019 Estudio California CEC 700 2007 008 CMF
http://slidepdf.com/reader/full/estudio-california-cec-700-2007-008-cmf 143/165
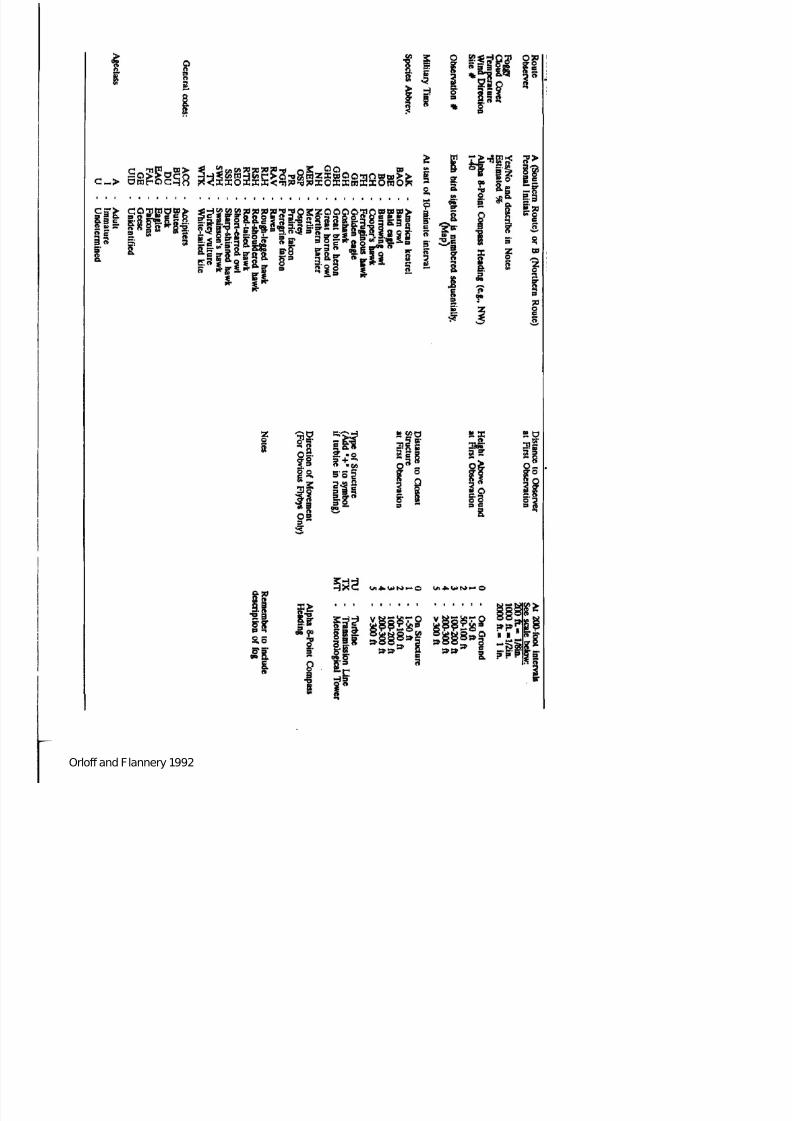
7/28/2019 Estudio California CEC 700 2007 008 CMF
http://slidepdf.com/reader/full/estudio-california-cec-700-2007-008-cmf 144/165

7/28/2019 Estudio California CEC 700 2007 008 CMF
http://slidepdf.com/reader/full/estudio-california-cec-700-2007-008-cmf 145/165

7/28/2019 Estudio California CEC 700 2007 008 CMF
http://slidepdf.com/reader/full/estudio-california-cec-700-2007-008-cmf 146/165

7/28/2019 Estudio California CEC 700 2007 008 CMF
http://slidepdf.com/reader/full/estudio-california-cec-700-2007-008-cmf 147/165

7/28/2019 Estudio California CEC 700 2007 008 CMF
http://slidepdf.com/reader/full/estudio-california-cec-700-2007-008-cmf 148/165

7/28/2019 Estudio California CEC 700 2007 008 CMF
http://slidepdf.com/reader/full/estudio-california-cec-700-2007-008-cmf 149/165

7/28/2019 Estudio California CEC 700 2007 008 CMF
http://slidepdf.com/reader/full/estudio-california-cec-700-2007-008-cmf 150/165

7/28/2019 Estudio California CEC 700 2007 008 CMF
http://slidepdf.com/reader/full/estudio-california-cec-700-2007-008-cmf 151/165

7/28/2019 Estudio California CEC 700 2007 008 CMF
http://slidepdf.com/reader/full/estudio-california-cec-700-2007-008-cmf 152/165

7/28/2019 Estudio California CEC 700 2007 008 CMF
http://slidepdf.com/reader/full/estudio-california-cec-700-2007-008-cmf 153/165

7/28/2019 Estudio California CEC 700 2007 008 CMF
http://slidepdf.com/reader/full/estudio-california-cec-700-2007-008-cmf 154/165

7/28/2019 Estudio California CEC 700 2007 008 CMF
http://slidepdf.com/reader/full/estudio-california-cec-700-2007-008-cmf 155/165

7/28/2019 Estudio California CEC 700 2007 008 CMF
http://slidepdf.com/reader/full/estudio-california-cec-700-2007-008-cmf 156/165
APPENDIX F: RECOMMENDED FORMULASFOR ADJUSTING FATALITY RATES
Conceptual Adjusted Fatality Equation
The conceptual equation for the adjusted fatality rate per megawatt of installed capacity
per search interval estimate is:
dnr
UA
pS
MM
ˆˆ
ˆˆ = .

7/28/2019 Estudio California CEC 700 2007 008 CMF
http://slidepdf.com/reader/full/estudio-california-cec-700-2007-008-cmf 157/165
UM ‐is the unadjusted fatality rate, the number of fatalities per megawatt of installed
capacity per search interval. The standard interval recommended in the Guidelines for
bird carcass searches is every two weeks. If intervals are of differing time periods, the
estimates should account for this variation.
nrS ‐is the probability that a carcass has not been removed in an interval.
dp ‐is the probability that a carcass present at the time of a count period is detected.
Carcass Removal Rate Estimation
1. The estimation of carcass removal rate based on birds or bats planted by the
researcher should be designed so that the estimate is statistically independent of
the detection probability by the searcher.
2. The estimation of carcass removal rates should be repeated in all seasons because
vegetation heights will vary, and scavengers move in and out of the area.
3. Estimate the removal rate per interval based on the simplifying assumption that the removal rate is constant over time. Two estimation methods are given here,
one for the removal rate being variable over time and the second for the removal
rate being constant over time (modified from Seber, 1982, pp.408–414).
Estimation Procedure ‐ In this situation a cohort of planted carcasses is followed over
various time intervals, and the number remaining is analogous to a cohort age specific
life table
approach
described
on
pages
408–414
of
Seber
(1982).
Therefore,
the
estimates
and standard errors presented there can be used to solve this estimation problem.
Now consider the special case where Sx is constant (that is, nrS in our original notation).
This is a geometric model, which is just the discrete analogue of the exponential model.
The maximum likelihood estimator is
∑−
=
−−=1
0
0 /)(1ˆ w
x
xwnr lllS ,
and this can be rewritten as
∑∑−
==
=1
01
/ˆw
xx
w
xxnr llS ,

7/28/2019 Estudio California CEC 700 2007 008 CMF
http://slidepdf.com/reader/full/estudio-california-cec-700-2007-008-cmf 158/165
with
31
01
0 ]/[)()ˆ( ∑∑−
==
−=w
xx
w
xxwnr llllSSE . These equations are from Seber (1982 p. 413).
Estimation of Searcher Efficiency Trials
1. Searcher efficiency trials (also called carcass detection probability) should be
repeated in
all
seasons
since
detection
probability
can
vary
during
different
seasons. Each estimate will be of a simple binomial form:
npppSEnxp dddd /)ˆ1(ˆ)ˆ(,/ˆ −== . Here x is the number of planted carcasses detected
and n is the number planted.
2. It is assumed that the detection probabilities estimated from the planted
carcasses are an unbiased estimate of the detection rates for real bird fatalities.
3. The carcasses used should be native species and as fresh as possible.
APPENDIX G: ESTIMATING IMPACTS TORAPTORS USING BIRD USE COUNT AND
FATALITY DATA FROM EXISTING PROJECTSThis section provides examples and background information to evaluate a project’s
potential impacts to raptors. Raptors were used for these impact estimate examples
because a large data set is available for use and fatality rates for this set of birds.
Furthermore, raptors are a visible and valued wildlife resource in California, and raptor
deaths from wind energy projects such as those at Altamont Pass Wind Resource Area
in Alameda County California have received worldwide attention Numerous studies

7/28/2019 Estudio California CEC 700 2007 008 CMF
http://slidepdf.com/reader/full/estudio-california-cec-700-2007-008-cmf 159/165
in Alameda County, California, have received worldwide attention. Numerous studies
have noted
that
raptors
disproportionately
collide
with
wind
turbines
(Orloff
and
Flannery, 1996; Anderson et al., 1995; Erickson et al., 2006). Consequently, raptors merit
special attention at most proposed wind energy sites in California.
The data in Table 1 and Figures 1 and 2 were taken from studies at wind energy projects
in California, Oregon, Washington, Wyoming, and Minnesota. These studies were
selected as data sources because they used standardized methods similar to those
recommended in
the
Guidelines.
These
wind
energy
projects
are
also
useful
for
comparisons because the wind turbines at these sites (with the exception of Tehachapi
and San Gorgonio) are the large, newer generation models (0.6 MW to 1.5 MW) similar
to those that will be built on future projects. For several of these studies, raptor use had
been estimated using 20‐minute counts, so the data were adjusted in this table to
provide a uniform metric of raptor use per 30‐minute count.
Table 1. Raptor Use and Raptor Fatalities.
Study Site Raptor
Use/30‐
Minute
Count
Raptor
Fatalities/
MW Installed
Capacity/Year
Source
High Winds, CA 5.250 0.68 Kerlinger et al., 2006
Diablo Winds, CA* 4.350 0.52 WEST, 2006
Combine Hills, OR 1.350 0.00 WEST, 2006
Tehachapi Pass, CA * 0.900 ‐‐‐‐ Anderson et al., 1996
Foote Creek Rim, WY 0.735 0.04 Young et al., 2003
Buffalo Ridge, MN 0.720 0.02 Johnson et al., 2000
Kl dik OR 0 705 0 00 WEST 2003

7/28/2019 Estudio California CEC 700 2007 008 CMF
http://slidepdf.com/reader/full/estudio-california-cec-700-2007-008-cmf 160/165
Klondike, OR 0.705 0.00 WEST, 2003
Nine Canyon, WA 0.660 0.05 WEST, 2001
Stateline, WA/OR 0.615 0.09 Erickson et al., 2003, 2004
Vansycle, OR 0.450 0.00 Erickson et al., 2000
San Gorgonio, CA 0.150 0.03 Anderson et al., 2005
*A range of 0.40 to 0.64 raptor fatalities per MW per year was calculated for Diablo
Winds—the mid‐range value of 0.52 is used in this table. Fatality data for studies at
Tehachapi, California were not included because carcass searches were too infrequent to
be comparable to other studies.
1
2
3
4
5
6
p t o r U s e p e r 3 0 - m i n u t e
C o u n t s
Raptor Use
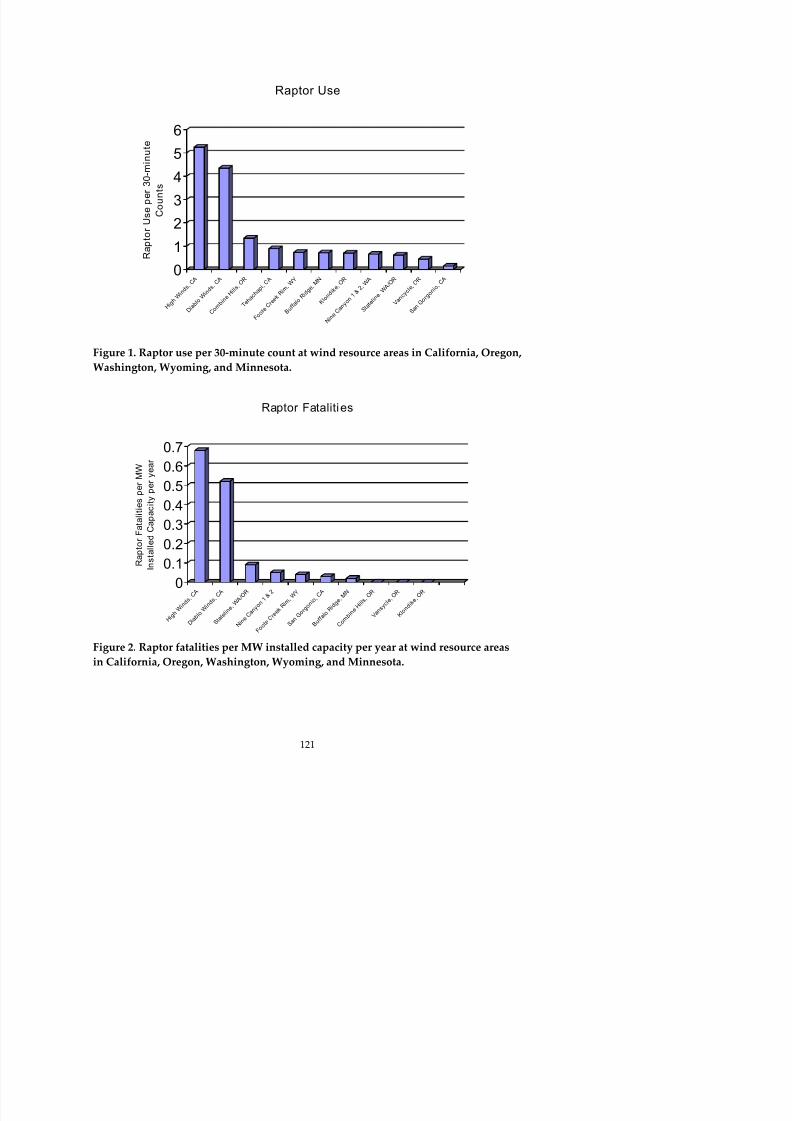
7/28/2019 Estudio California CEC 700 2007 008 CMF
http://slidepdf.com/reader/full/estudio-california-cec-700-2007-008-cmf 161/165
0
1 R
a p
H i g h W
i n d s
, C A
D i a b
l o W i n
d s , C
A
C o m
b i n e H i
l l s , O R
T e h a
c h a p
i , C A
F o o t
e C r e
e k R i
m , W Y
B u f f a
l o R i d g e ,
M N
K l o n
d i k e , O
R
N i n e
C a n
y o n 1 &
2 , W
A
S t a t
e l i n e , W
A / O R
V a n c
y c l e ,
O R
S a n G
o r g o n
i o , C A
Figure 1. Raptor use per 30‐minute count at wind resource areas in California, Oregon,
Washington, Wyoming,
and
Minnesota.
0
0.1
0.2
0.3
0.4
0.50.6
0.7
R a p t o r F a t a l i t i e s p e r M W
I n s t a l l e d C a p a c i t y p e r y e a r
Wi n d s
, C A
Wi n d s
, C A
e, W A /
O R
y o n 1 &
2
R i m
, W Y
go n i o ,
C A
Ri d g e ,
M N
H i l l s ,
O R
sy c l e ,
O R
nd i k e , O
R
Raptor Fatalities
Examples of Projects wi th Potential for High and LowRaptor Fatality Rates
Example 1: Pre‐permitting bird use counts (BUCs) find an average of 0.15 raptors per 30‐
minute count at a proposed project site. Table 1 shows that the 0.15 raptors per 30‐minute count is the same as found at San Gorgonio, California. Looking at Figures 1 and
2, raptor use and raptor fatality graphs, allows a visual comparison of where the 0.15
raptors per 30‐minute count fit in the distribution of other projects that have been
studied using standardized methods and metrics. The raptor use number of 0.15 is on
the low end of the comparison graph, similar to San Gorgonio, which also is on the low
side of the raptor fatalities graph. Therefore the proposed project might be expected to

7/28/2019 Estudio California CEC 700 2007 008 CMF
http://slidepdf.com/reader/full/estudio-california-cec-700-2007-008-cmf 162/165
have a relatively
low
fatality
rate
for
raptors.
Example 2: Pre‐permitting BUCs find an average of 4.35 raptors per 30‐minute count at a
proposed project site. Table 1 shows that the 4.35 raptors per 30‐minute count is the
same as found at Diablo Winds, California (in Altamont Pass). Compare this BUC count
in Table 1 with Figures 1 and 2. The raptor use number of 4.35 is on the high end of the
comparison graph, similar to Diablo Winds, which also is on the high side of the raptor
fatalities graph. Therefore the proposed project might be expected to have a relatively
high fatality rate for raptors.
Figure 3, from Strickland et al. (2006), provides a regression analysis showing the
association between standardized metrics for raptor use and fatality rates from projects
with the newer turbines. This figure also illustrates the positive correlation of raptor use
and raptor fatality rates at wind energy facilities.
FacilitiesHigh Winds, CADiablo Winds, CA
Klondike, ORStateline, WA/ORNine Canyon 1 &2, WAFoote Creek Rim,

7/28/2019 Estudio California CEC 700 2007 008 CMF
http://slidepdf.com/reader/full/estudio-california-cec-700-2007-008-cmf 163/165
Figure 3. Comparison of raptor use and fatalities at new turbine sites that used
comparable study methods (20‐minute bird use counts) (Strickland, 2006).
Cautions
Exercise caution when using this simple assessment approach to extrapolate fatality
rates and make impact assessments, and be careful in analyzing and presenting the data.
Any regression
analysis
should
be
interpreted
with
the
awareness
that
other
important
hidden or unmeasured variables might be present that could account for an apparent
relationship between the variables of interest. Inappropriate grouping of data for species
and bird groups can alter conclusions about potential impacts and mislead the reader,
and behavioral differences between species are known to be an important explanatory
variable for risk of collision with turbines. Be aware that grouping species into a bird
group such as raptors can mask impacts to a particular species that may be of concern.
For example, both Diablo Winds at Altamont Pass, California, and High Winds in
Solano County, California have relatively high raptor use and fatalities; however, the
mix of raptors is different. High Winds has more American kestrels and red‐tailed
,
WYVansycle, ORBuffalo Ridge,MNCombine Hills,OR
bird use can be low, but raptor use can be high on a project, as illustrated theoretically in
Table 2 below. Consider the following hypothetical example while referring to Table 2:
assume a hypothetical national average of 17 birds per 30‐minute bird use count and 3.0
bird fatalities per MW of installed capacity per year. Suppose studies at a wind energy
site showed an average of 11 birds per 30‐minute bird use count and 2.0 bird fatalities
per MW of installed capacity per year. This hypothetical site looks reasonably good
compared to the national average with lower bird use and lower bird fatalities.
However, a closer review of the results shows the national average includes 0.3 raptors
per 30‐minute count and 0.07 raptor fatalities per MW of installed capacity per year, but
the theoretical project raptor use is 3.0 per 30‐minute count and 0.75 fatalities per MW of
installed capacity. The new project has 10 times the raptor use and 11 times the raptor
fatalities of the national average, while having less overall bird use and less overall bird

7/28/2019 Estudio California CEC 700 2007 008 CMF
http://slidepdf.com/reader/full/estudio-california-cec-700-2007-008-cmf 164/165
fatalities. In this example, if only the “all bird use” numbers were used, the assessment would reach an inappropriate conclusion.
Table 2. Illustration that Overall Bird Use Can Be Low on a Project with High Raptor
Use.
Bird Use Bird Fatality Raptor Use Raptor Fatality
Theoretical
national
average
17.0 3.0 0.3 0.07
Theoretical
project
11.0 2.0 3.0 0.75
To avoid the problems described above, analyze data for each bird group and special‐
status species separately, as appropriate for the site. In making the impact assessment,
consider
whether
a
local
bird
population
has
experienced
declines
and
the
effects
of
additional losses to such a population. Be aware that the use‐fatality rate relationship
depicted in Figure 3 has only been demonstrated for raptors. Bird use data for songbirds
does not reflect the same clear correlation of bird use to bird fatalities as does raptor use
data.
Figure 4 displays raptor use information for many wind energy project sites throughout
the nation. This figure shows the range of raptor use at wind energy project sites in
California and elsewhere in the country and is provided to allow convenient
comparisons for new project data.
RAPTOR USE
3
4
5
6
3 0 - m i n u t e c o u n t

7/28/2019 Estudio California CEC 700 2007 008 CMF
http://slidepdf.com/reader/full/estudio-california-cec-700-2007-008-cmf 165/165
125
0
1
2
3
H i g h W i n d s , C A
A l t a m o
n t P a s s , C A
C o t t e r e l M t n . ,
I D
E l k h o r n ,
O R
K i t t i t a s
V a l l e y , W A
R e a r d o n ,
W A
B
i g h o r n ,
W A
C o l u m b
i a H i l l s ,
W A
D e s e r t C l a i m ,
W A
K l i c k i t a t C o . ,
W A
H o p
k i n ' s R i d g e ,
W A
S h e p h
e r d ' s R i d g e ,
O R
C o m b i n e H i l l s ,
O R
L e a n i n g J u n i p e r ,
O R
C h i n C h u t e ,
A B
F o o t e
C r e e k R i m ,
W Y
B u f f a l o R i d g e ,
M N
H O M E S T E A D ,
C A
K
l o n d i k e ,
O R
Z i n t e l C a n y o n ,
W A
S t a t e l i n e ,
W A / O R
W i l d
H o r s e ,
W A
M a i d e n ,
W A
C o n d o n ,
O R
T e c h a
p i P a s s ,
C A
B i g l o w ,
O R
O w l F e a t h e r , S D
N i n e C a n y o n ,
W A
S a n G
o r g o n i o ,
C A
Wind Resource Area
R a p t o r s p e r
3
Figure 4. Raptor use estimates at several wind resource areas within and outside California. Blue columns depict data from studies at
California wind resource areas.
T e h a c h a p i P a s s ,
C A
H o m e s t e a d ,
C A


![CMF Presentation[]](https://img.pdfslide.net/doc/110x75/58894fed1a28abde5a8b708b/cmf-presentationpdf-file.jpg)