Embed Size (px)
Citation preview
Ethna-AKTIV ESemi-annual report for the period ended 30 June 2014
Investment fund under Luxembourg law
Investment fund pursuant to Part I of the law of 17 December 2010on Undertakings for Collective Investment, taking the legal form of aFonds Commun de Placement (FCP)
Luxembourg registered company B 155427

SEMI-ANNUAL REPORT FOR THE PERIOD ENDED 30 JUNE 2014
Content
The Sales Prospectus with integrated management regulations, the Key Investor Information Documents (KIID) and the fund’s annual and semi-annual reports are available free of charge by post, fax or e-mail from the registered office of the management company, or from the custodian bank, paying agents and the distributor in the respective countries of distribution and the representative in Switzerland. Additional information is available from the management company at all times during regular business hours.
Unit subscriptions are valid only if they are made on the basis of the most recent version of the Sales Prospectus (including its annexes) in conjunction with the latest available annual report and any subsequent semi-annual report.
Unit classes (R-A) and (R-T) are intended exclusively for distribution in Italy, France and Spain.
The information and figures contained in this report relate to past performance only and give no indication of future performance.
Page
Geographical breakdown by country and breakdown by economic sector of Ethna-AKTIV E
2
Composition of the net fund assets of Ethna-AKTIV E
7
Statement of operations of Ethna-AKTIV E 11
Statement of net assets of Ethna-AKTIV E as of 30 June 2014
14
Acquisitions and disposals from 1 January 2014 to 30 June 2014
24
Notes to the semi-annual report for the period ended 30 June 2014 30
Administration, distribution and advisory 34
2
SEMI-ANNUAL REPORT FOR THE PERIOD ENDED 30 JUNE 2014
Semi-annual report1 January 2014 - 30 June 2014
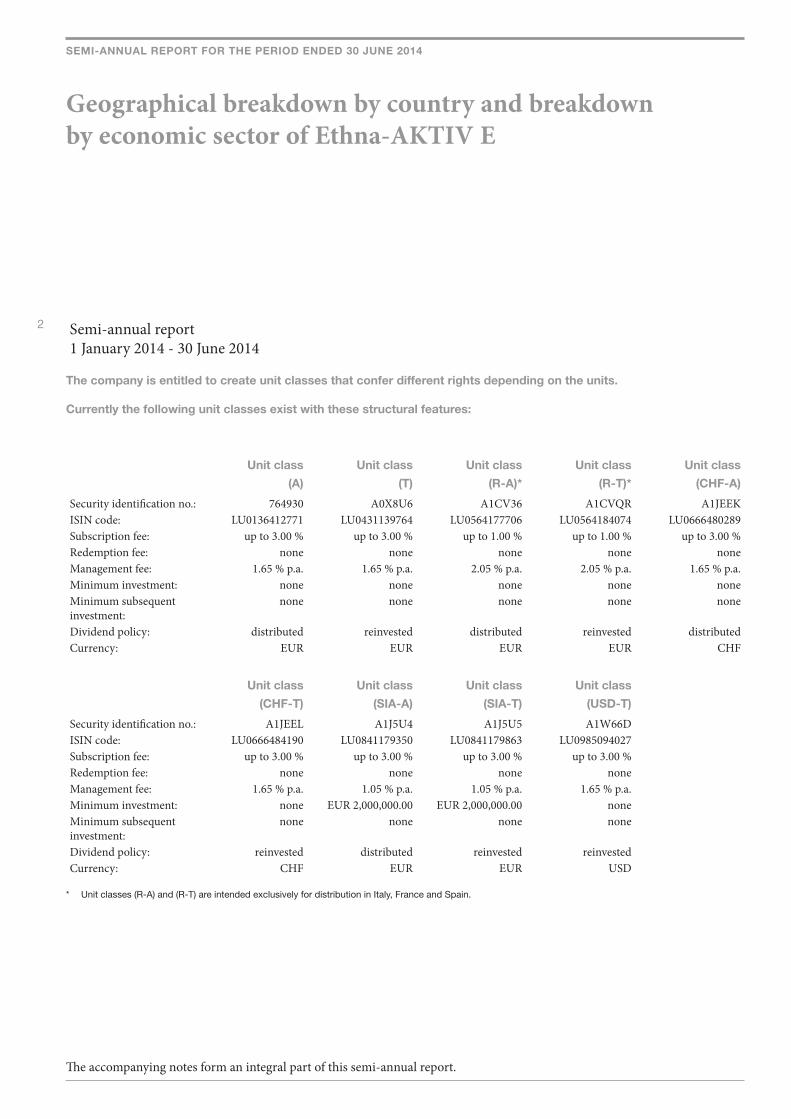
The company is entitled to create unit classes that confer different rights depending on the units. Currently the following unit classes exist with these structural features:
Unit class
(A)
Unit class
(T)
Unit class
(R-A)*
Unit class
(R-T)*
Unit class
(CHF-A)
Security identification no.: 764930 A0X8U6 A1CV36 A1CVQR A1JEEKISIN code: LU0136412771 LU0431139764 LU0564177706 LU0564184074 LU0666480289Subscription fee: up to 3.00 % up to 3.00 % up to 1.00 % up to 1.00 % up to 3.00 %Redemption fee: none none none none noneManagement fee: 1.65 % p.a. 1.65 % p.a. 2.05 % p.a. 2.05 % p.a. 1.65 % p.a.Minimum investment: none none none none noneMinimum subsequent investment:
none none none none none
Dividend policy: distributed reinvested distributed reinvested distributedCurrency: EUR EUR EUR EUR CHF
Unit class
(CHF-T)
Unit class
(SIA-A)
Unit class
(SIA-T)
Unit class
(USD-T)
Security identification no.: A1JEEL A1J5U4 A1J5U5 A1W66DISIN code: LU0666484190 LU0841179350 LU0841179863 LU0985094027Subscription fee: up to 3.00 % up to 3.00 % up to 3.00 % up to 3.00 %Redemption fee: none none none noneManagement fee: 1.65 % p.a. 1.05 % p.a. 1.05 % p.a. 1.65 % p.a.Minimum investment: none EUR 2,000,000.00 EUR 2,000,000.00 noneMinimum subsequent investment:
none none none none
Dividend policy: reinvested distributed reinvested reinvestedCurrency: CHF EUR EUR USD
* Unit classes (R-A) and (R-T) are intended exclusively for distribution in Italy, France and Spain.
The accompanying notes form an integral part of this semi-annual report.
Geographical breakdown by country and breakdown by economic sector of Ethna-AKTIV E
3
SEMI-ANNUAL REPORT FOR THE PERIOD ENDED 30 JUNE 2014
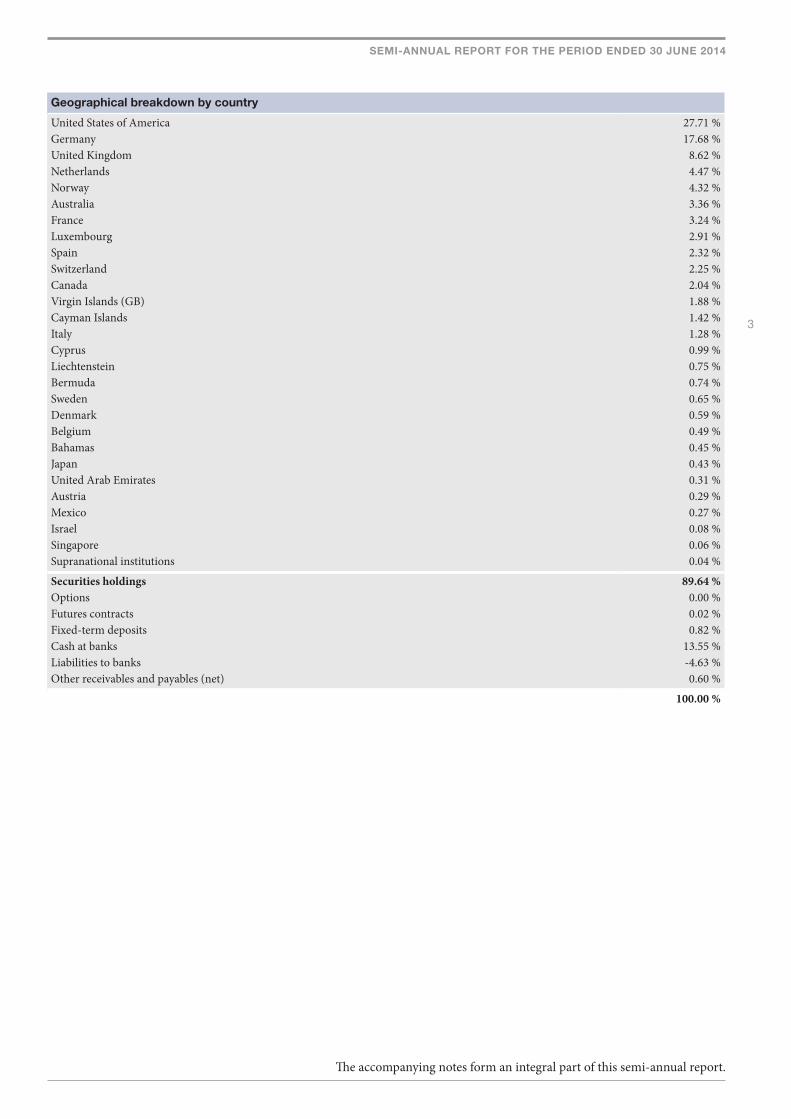
Geographical breakdown by country
United States of America 27.71 %Germany 17.68 %United Kingdom 8.62 %Netherlands 4.47 %Norway 4.32 %Australia 3.36 %France 3.24 %Luxembourg 2.91 %Spain 2.32 %Switzerland 2.25 %Canada 2.04 %Virgin Islands (GB) 1.88 %Cayman Islands 1.42 %Italy 1.28 %Cyprus 0.99 %Liechtenstein 0.75 %Bermuda 0.74 %Sweden 0.65 %Denmark 0.59 %Belgium 0.49 %Bahamas 0.45 %Japan 0.43 %United Arab Emirates 0.31 %Austria 0.29 %Mexico 0.27 %Israel 0.08 %Singapore 0.06 %Supranational institutions 0.04 %
Securities holdings 89.64 %Options 0.00 %Futures contracts 0.02 %Fixed-term deposits 0.82 %Cash at banks 13.55 %Liabilities to banks -4.63 %Other receivables and payables (net) 0.60 %
100.00 %
The accompanying notes form an integral part of this semi-annual report.
4
SEMI-ANNUAL REPORT FOR THE PERIOD ENDED 30 JUNE 2014
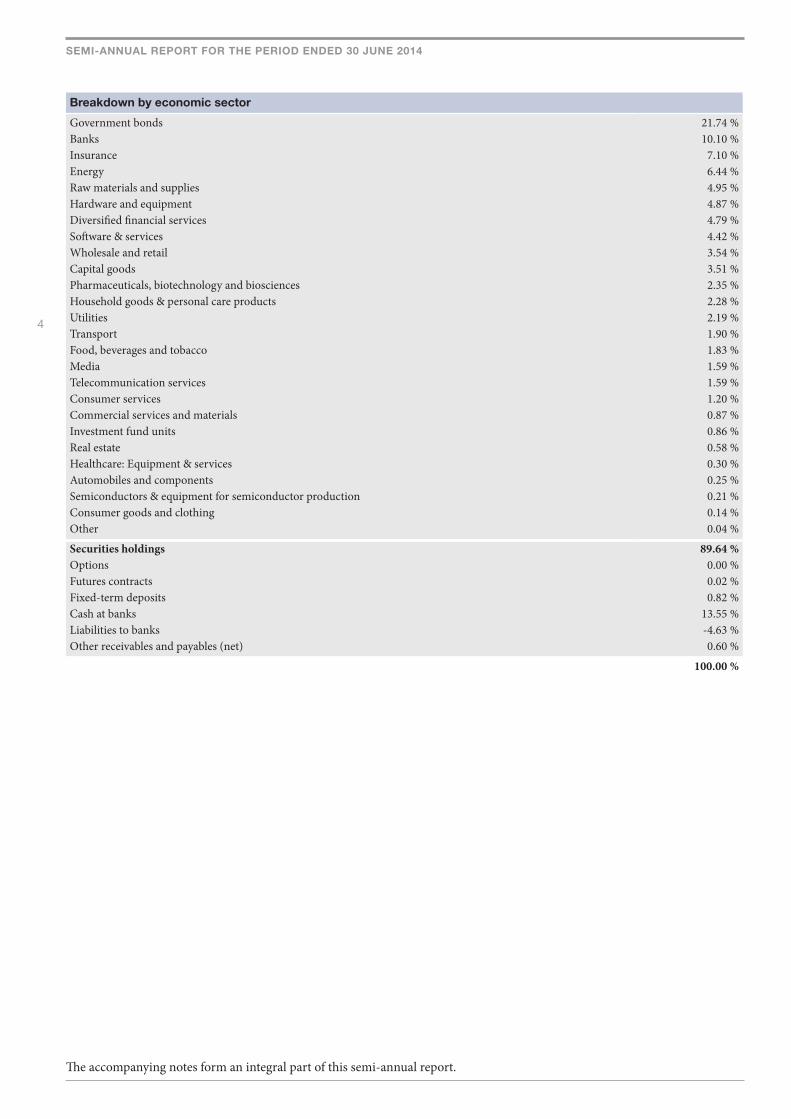
Breakdown by economic sector
Government bonds 21.74 %Banks 10.10 %Insurance 7.10 %Energy 6.44 %Raw materials and supplies 4.95 %Hardware and equipment 4.87 %Diversified financial services 4.79 %Software & services 4.42 %Wholesale and retail 3.54 %Capital goods 3.51 %Pharmaceuticals, biotechnology and biosciences 2.35 %Household goods & personal care products 2.28 %Utilities 2.19 %Transport 1.90 %Food, beverages and tobacco 1.83 %Media 1.59 %Telecommunication services 1.59 %Consumer services 1.20 %Commercial services and materials 0.87 %Investment fund units 0.86 %Real estate 0.58 %Healthcare: Equipment & services 0.30 %Automobiles and components 0.25 %Semiconductors & equipment for semiconductor production 0.21 %Consumer goods and clothing 0.14 %Other 0.04 %
Securities holdings 89.64 %Options 0.00 %Futures contracts 0.02 %Fixed-term deposits 0.82 %Cash at banks 13.55 %Liabilities to banks -4.63 %Other receivables and payables (net) 0.60 %
100.00 %
The accompanying notes form an integral part of this semi-annual report.
5
SEMI-ANNUAL REPORT FOR THE PERIOD ENDED 30 JUNE 2014
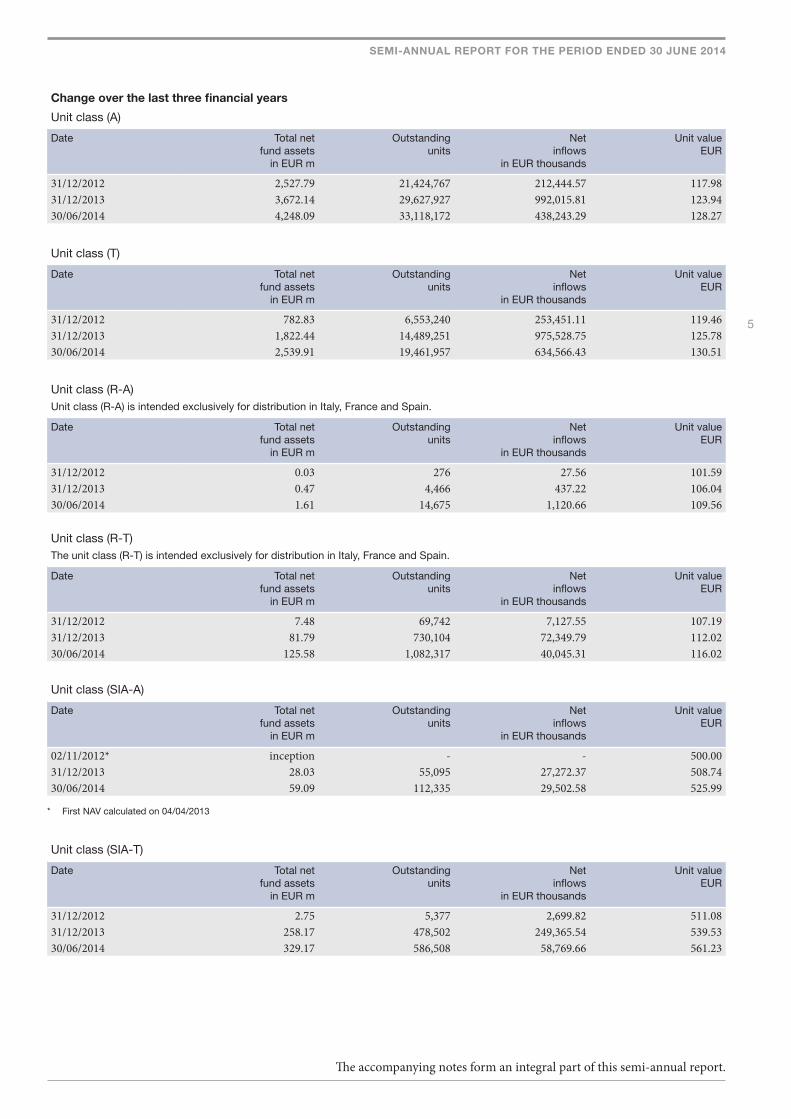
Change over the last three financial years
Unit class (A)
Date Total netfund assets
in EUR m
Outstanding units
Net inflows
in EUR thousands
Unit valueEUR
31/12/2012 2,527.79 21,424,767 212,444.57 117.9831/12/2013 3,672.14 29,627,927 992,015.81 123.9430/06/2014 4,248.09 33,118,172 438,243.29 128.27
Unit class (T)
Date Total netfund assets
in EUR m
Outstanding units
Net inflows
in EUR thousands
Unit valueEUR
31/12/2012 782.83 6,553,240 253,451.11 119.4631/12/2013 1,822.44 14,489,251 975,528.75 125.7830/06/2014 2,539.91 19,461,957 634,566.43 130.51
Unit class (R-A)Unit class (R-A) is intended exclusively for distribution in Italy, France and Spain.
Date Total netfund assets
in EUR m
Outstanding units
Net inflows
in EUR thousands
Unit valueEUR
31/12/2012 0.03 276 27.56 101.5931/12/2013 0.47 4,466 437.22 106.0430/06/2014 1.61 14,675 1,120.66 109.56
Unit class (R-T)The unit class (R-T) is intended exclusively for distribution in Italy, France and Spain.
Date Total netfund assets
in EUR m
Outstanding units
Net inflows
in EUR thousands
Unit valueEUR
31/12/2012 7.48 69,742 7,127.55 107.1931/12/2013 81.79 730,104 72,349.79 112.0230/06/2014 125.58 1,082,317 40,045.31 116.02
Unit class (SIA-A)
Date Total netfund assets
in EUR m
Outstanding units
Net inflows
in EUR thousands
Unit valueEUR
02/11/2012* inception - - 500.0031/12/2013 28.03 55,095 27,272.37 508.7430/06/2014 59.09 112,335 29,502.58 525.99
* First NAV calculated on 04/04/2013
Unit class (SIA-T)
Date Total netfund assets
in EUR m
Outstanding units
Net inflows
in EUR thousands
Unit valueEUR
31/12/2012 2.75 5,377 2,699.82 511.0831/12/2013 258.17 478,502 249,365.54 539.5330/06/2014 329.17 586,508 58,769.66 561.23
The accompanying notes form an integral part of this semi-annual report.
6
SEMI-ANNUAL REPORT FOR THE PERIOD ENDED 30 JUNE 2014
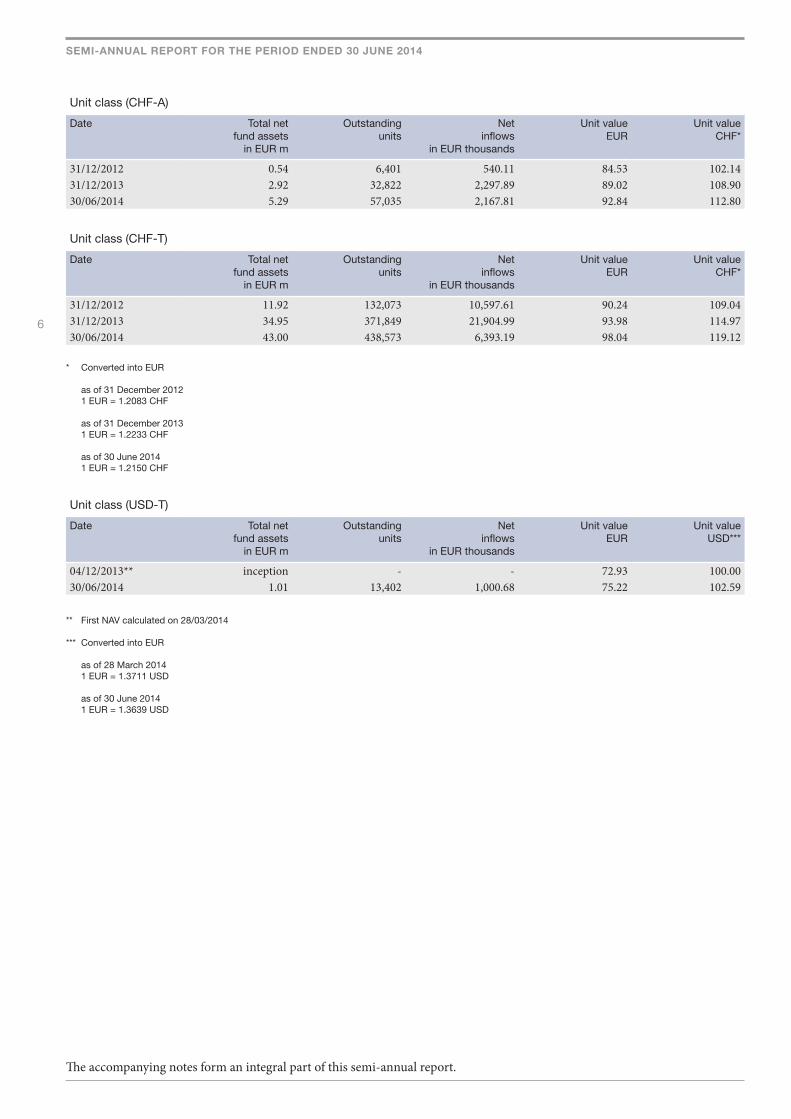
Unit class (CHF-A)
Date Total netfund assets
in EUR m
Outstanding units
Net inflows
in EUR thousands
Unit valueEUR
Unit valueCHF*
31/12/2012 0.54 6,401 540.11 84.53 102.1431/12/2013 2.92 32,822 2,297.89 89.02 108.9030/06/2014 5.29 57,035 2,167.81 92.84 112.80
Unit class (CHF-T)
Date Total netfund assets
in EUR m
Outstanding units
Net inflows
in EUR thousands
Unit valueEUR
Unit valueCHF*
31/12/2012 11.92 132,073 10,597.61 90.24 109.0431/12/2013 34.95 371,849 21,904.99 93.98 114.9730/06/2014 43.00 438,573 6,393.19 98.04 119.12
* Converted into EUR
as of 31 December 2012 1 EUR = 1.2083 CHF
as of 31 December 2013 1 EUR = 1.2233 CHF
as of 30 June 2014 1 EUR = 1.2150 CHF
Unit class (USD-T)
Date Total netfund assets
in EUR m
Outstanding units
Net inflows
in EUR thousands
Unit valueEUR
Unit valueUSD***
04/12/2013** inception - - 72.93 100.0030/06/2014 1.01 13,402 1,000.68 75.22 102.59
** First NAV calculated on 28/03/2014
*** Converted into EUR
as of 28 March 2014 1 EUR = 1.3711 USD
as of 30 June 2014 1 EUR = 1.3639 USD
The accompanying notes form an integral part of this semi-annual report.
7
SEMI-ANNUAL REPORT FOR THE PERIOD ENDED 30 JUNE 2014
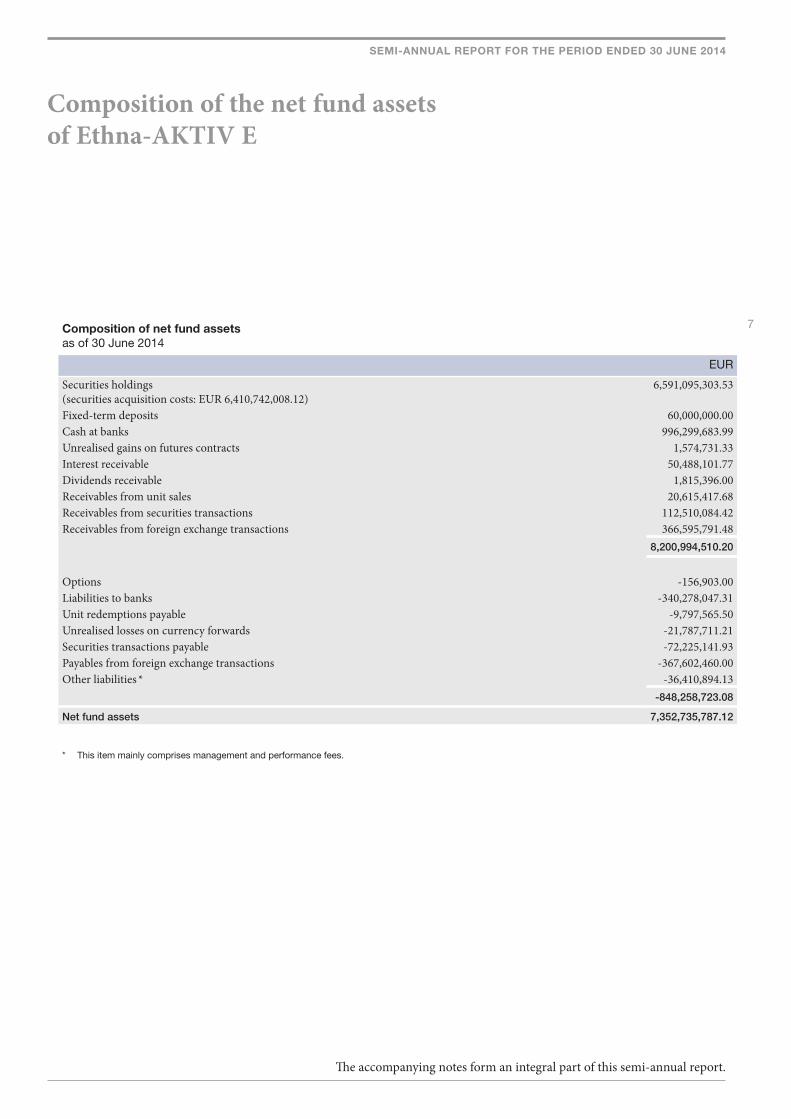
Composition of net fund assetsas of 30 June 2014
EUR
Securities holdings (securities acquisition costs: EUR 6,410,742,008.12)
6,591,095,303.53
Fixed-term deposits 60,000,000.00Cash at banks 996,299,683.99Unrealised gains on futures contracts 1,574,731.33Interest receivable 50,488,101.77Dividends receivable 1,815,396.00Receivables from unit sales 20,615,417.68Receivables from securities transactions 112,510,084.42Receivables from foreign exchange transactions 366,595,791.48 8,200,994,510.20
Options -156,903.00Liabilities to banks -340,278,047.31Unit redemptions payable -9,797,565.50Unrealised losses on currency forwards -21,787,711.21Securities transactions payable -72,225,141.93Payables from foreign exchange transactions -367,602,460.00Other liabilities * -36,410,894.13 -848,258,723.08
Net fund assets 7,352,735,787.12
* This item mainly comprises management and performance fees.
The accompanying notes form an integral part of this semi-annual report.
Composition of the net fund assets of Ethna-AKTIV E
8
SEMI-ANNUAL REPORT FOR THE PERIOD ENDED 30 JUNE 2014
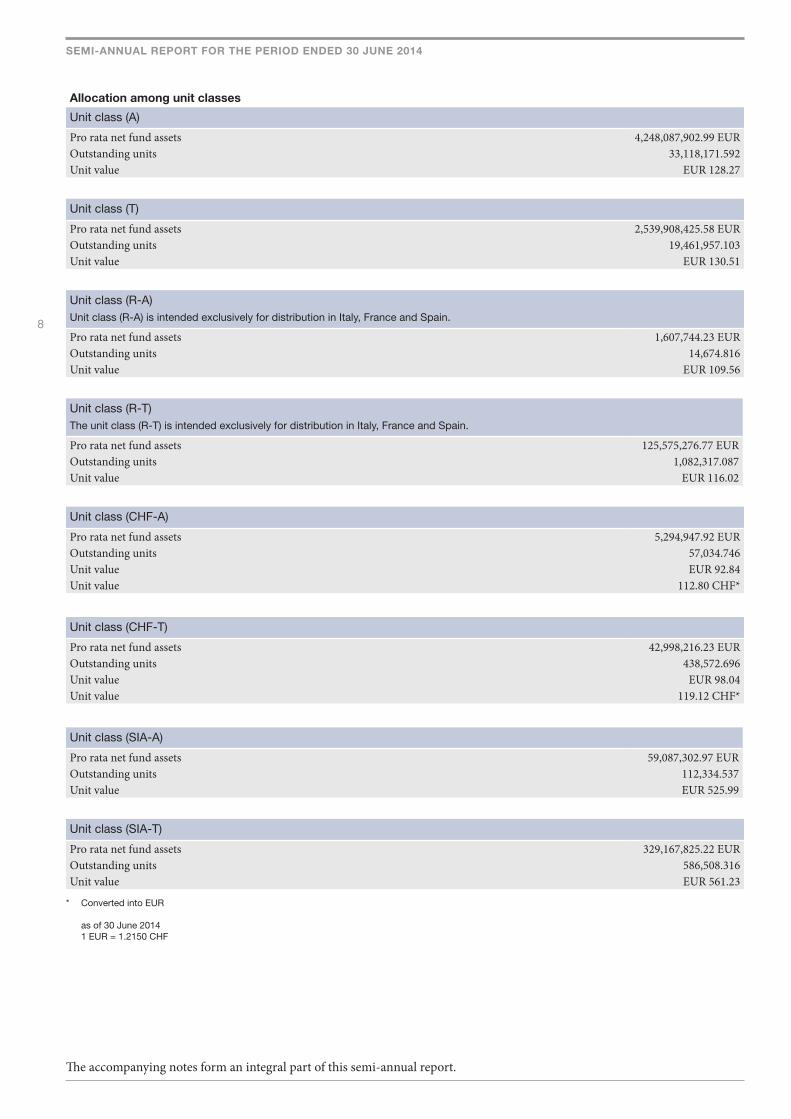
Allocation among unit classes
Unit class (A)
Pro rata net fund assets 4,248,087,902.99 EUROutstanding units 33,118,171.592Unit value EUR 128.27
Unit class (T)
Pro rata net fund assets 2,539,908,425.58 EUROutstanding units 19,461,957.103Unit value EUR 130.51
Unit class (R-A)Unit class (R-A) is intended exclusively for distribution in Italy, France and Spain.
Pro rata net fund assets 1,607,744.23 EUROutstanding units 14,674.816Unit value EUR 109.56
Unit class (R-T)The unit class (R-T) is intended exclusively for distribution in Italy, France and Spain.
Pro rata net fund assets 125,575,276.77 EUROutstanding units 1,082,317.087Unit value EUR 116.02
Unit class (CHF-A)
Pro rata net fund assets 5,294,947.92 EUROutstanding units 57,034.746Unit value EUR 92.84Unit value 112.80 CHF*
Unit class (CHF-T)
Pro rata net fund assets 42,998,216.23 EUROutstanding units 438,572.696Unit value EUR 98.04Unit value 119.12 CHF*
Unit class (SIA-A)
Pro rata net fund assets 59,087,302.97 EUROutstanding units 112,334.537Unit value EUR 525.99
Unit class (SIA-T)
Pro rata net fund assets 329,167,825.22 EUROutstanding units 586,508.316Unit value EUR 561.23
* Converted into EUR
as of 30 June 2014 1 EUR = 1.2150 CHF
The accompanying notes form an integral part of this semi-annual report.
9
SEMI-ANNUAL REPORT FOR THE PERIOD ENDED 30 JUNE 2014
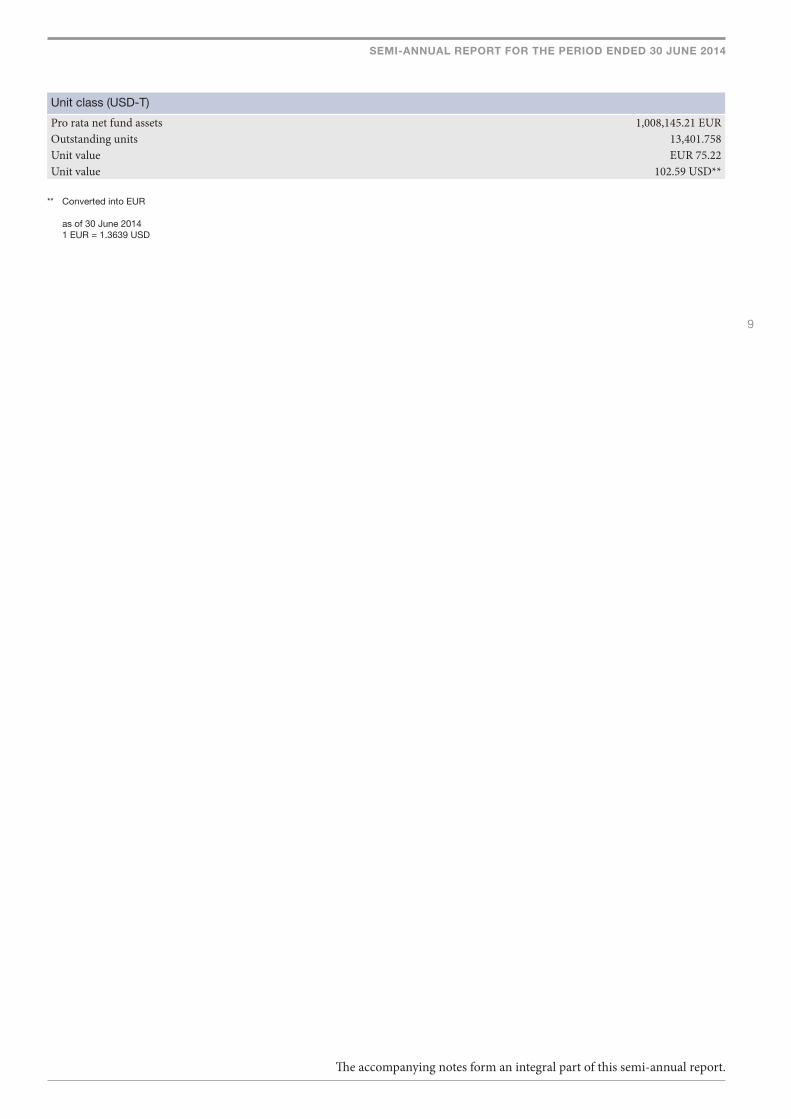
Unit class (USD-T)
Pro rata net fund assets 1,008,145.21 EUROutstanding units 13,401.758Unit value EUR 75.22Unit value 102.59 USD**
** Converted into EUR
as of 30 June 2014 1 EUR = 1.3639 USD
The accompanying notes form an integral part of this semi-annual report.
10
SEMI-ANNUAL REPORT FOR THE PERIOD ENDED 30 JUNE 2014
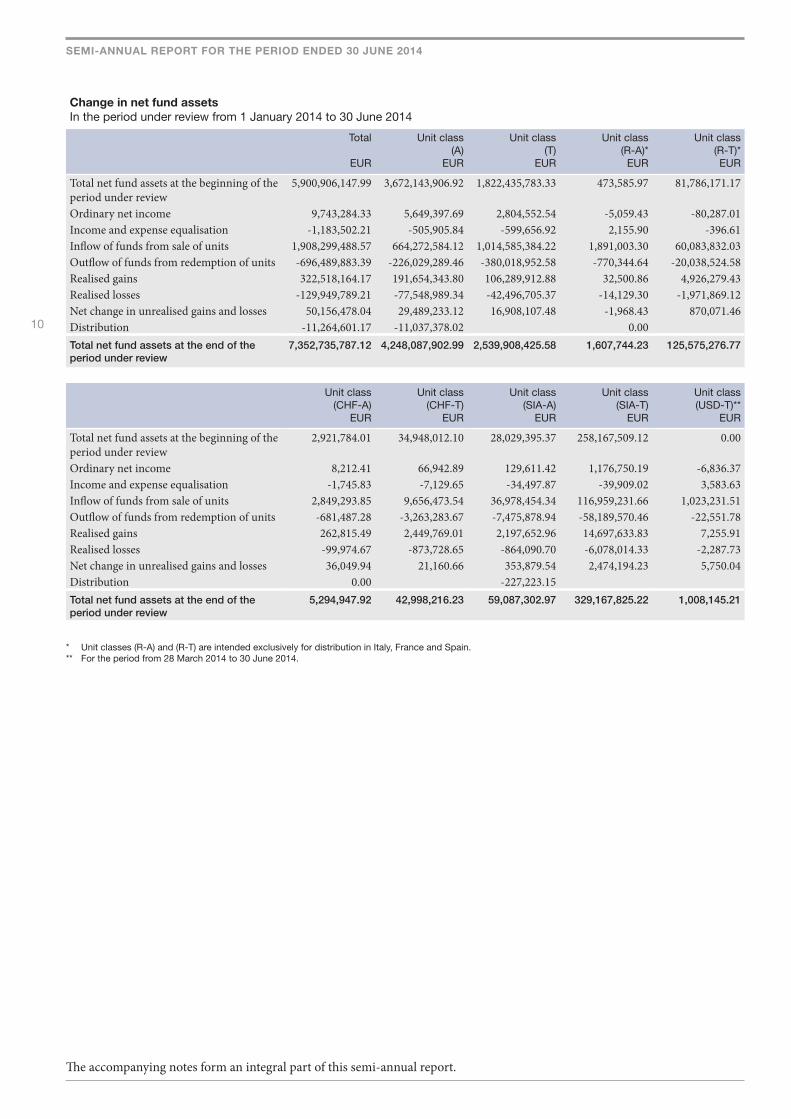
Change in net fund assetsIn the period under review from 1 January 2014 to 30 June 2014
Total
EUR
Unit class (A)
EUR
Unit class (T)
EUR
Unit class (R-A)*
EUR
Unit class(R-T)*EUR
Total net fund assets at the beginning of the period under review
5,900,906,147.99 3,672,143,906.92 1,822,435,783.33 473,585.97 81,786,171.17
Ordinary net income 9,743,284.33 5,649,397.69 2,804,552.54 -5,059.43 -80,287.01Income and expense equalisation -1,183,502.21 -505,905.84 -599,656.92 2,155.90 -396.61Inflow of funds from sale of units 1,908,299,488.57 664,272,584.12 1,014,585,384.22 1,891,003.30 60,083,832.03Outflow of funds from redemption of units -696,489,883.39 -226,029,289.46 -380,018,952.58 -770,344.64 -20,038,524.58Realised gains 322,518,164.17 191,654,343.80 106,289,912.88 32,500.86 4,926,279.43Realised losses -129,949,789.21 -77,548,989.34 -42,496,705.37 -14,129.30 -1,971,869.12Net change in unrealised gains and losses 50,156,478.04 29,489,233.12 16,908,107.48 -1,968.43 870,071.46Distribution -11,264,601.17 -11,037,378.02 0.00Total net fund assets at the end of the period under review
7,352,735,787.12 4,248,087,902.99 2,539,908,425.58 1,607,744.23 125,575,276.77
Unit class (CHF-A)
EUR
Unit class (CHF-T)
EUR
Unit class(SIA-A)
EUR
Unit class(SIA-T)
EUR
Unit class (USD-T)**
EUR
Total net fund assets at the beginning of the period under review
2,921,784.01 34,948,012.10 28,029,395.37 258,167,509.12 0.00
Ordinary net income 8,212.41 66,942.89 129,611.42 1,176,750.19 -6,836.37Income and expense equalisation -1,745.83 -7,129.65 -34,497.87 -39,909.02 3,583.63Inflow of funds from sale of units 2,849,293.85 9,656,473.54 36,978,454.34 116,959,231.66 1,023,231.51Outflow of funds from redemption of units -681,487.28 -3,263,283.67 -7,475,878.94 -58,189,570.46 -22,551.78Realised gains 262,815.49 2,449,769.01 2,197,652.96 14,697,633.83 7,255.91Realised losses -99,974.67 -873,728.65 -864,090.70 -6,078,014.33 -2,287.73Net change in unrealised gains and losses 36,049.94 21,160.66 353,879.54 2,474,194.23 5,750.04Distribution 0.00 -227,223.15Total net fund assets at the end of the period under review
5,294,947.92 42,998,216.23 59,087,302.97 329,167,825.22 1,008,145.21
* Unit classes (R-A) and (R-T) are intended exclusively for distribution in Italy, France and Spain.** For the period from 28 March 2014 to 30 June 2014.
The accompanying notes form an integral part of this semi-annual report.

11
SEMI-ANNUAL REPORT FOR THE PERIOD ENDED 30 JUNE 2014
Statement of OperationsIn the period under review from 1 January 2014 to 30 June 2014
Total
EUR
Unit class (A)
EUR
Unit class (T)
EUR
Unit class (R-A)*
EUR
Unit class (R-T)*EUR
Income
Dividends 13,625,903.18 8,015,348.16 4,573,097.00 1,298.53 218,465.29Interest on bonds 79,185,785.43 47,131,288.04 26,133,032.47 8,101.32 1,218,374.87Income from withholding tax refunds 84,785.04 50,547.74 27,745.40 12.32 1,286.25Bank interest 1,100,841.76 658,904.44 359,962.38 105.66 16,577.78Trailer fees 257,186.82 151,803.89 85,832.90 29.99 4,055.61Income equalisation 7,549,557.39 2,845,383.37 3,967,371.08 12,766.10 280,314.15Total income 101,804,059.62 58,853,275.64 35,147,041.23 22,313.92 1,739,073.95
Expense
Interest expense -80,564.77 -48,284.46 -26,309.98 -7.88 -1,204.61Performance fee -25,343,201.80 -14,626,793.85 -8,609,301.00 -3,780.71 -371,395.49Management fee -54,758,773.55 -32,931,138.95 -18,502,043.34 -8,000.53 -1,079,443.93Custodian fee -1,702,794.44 -1,013,129.37 -562,334.43 -176.06 -26,235.21Taxe d’abonnement -1,734,987.21 -1,015,505.48 -586,179.44 -273.39 -28,705.85Publication and audit expenses -987,235.05 -582,173.67 -330,493.91 -94.26 -15,815.68Typesetting, printing and postage and packaging for the annual and semi-annual reports
-129,932.07 -76,940.78 -43,135.36 -13.14 -2,042.91
Registrar and transfer agent fee -7,863.06 -4,609.33 -2,660.64 -0.78 -128.49Government fees -190,213.24 -113,430.79 -62,244.86 -27.01 -2,883.50Other expenses 1) -759,154.92 -452,393.74 -250,071.57 -77.59 -11,587.75Expense equalisation -6,366,055.18 -2,339,477.53 -3,367,714.16 -14,922.00 -279,917.54Total expense -92,060,775.29 -53,203,877.95 -32,342,488.69 -27,373.35 -1,819,360.96
Ordinary net income 9,743,284.33 5,649,397.69 2,804,552.54 -5,059.43 -80,287.01
Swiss total expense ratio in percent before performance fee 2)
(for period 1 July 2013 to 30 June 2014)1.84 1.87 - -
Swiss total expense ratio in percent including performance fee 2)
(for period 1 July 2013 to 30 June 2014)1.93 1.94 - -
Swiss performance fee in percent 2)
(for period 1 July 2013 to 30 June 2014)0.09 0.07 - -
1) This item mainly comprises general management costs and legal costs.2) See notes to the Annual Report.
* Unit classes (R-A) and (R-T) are intended exclusively for distribution in Italy, France and Spain.
The accompanying notes form an integral part of this semi-annual report.
Statement of operations of Ethna-AKTIV E

12
SEMI-ANNUAL REPORT FOR THE PERIOD ENDED 30 JUNE 2014
Statement of OperationsIn the period under review from 1 January 2014 to 30 June 2014
Unit class(CHF-A)
EUR
Unit class(CHF-T)
EUR
Unit class(SIA-A)
EUR
Unit class(SIA-T)
EUR
Unit class(USD-T)*
EUR
Income
Dividends 10,002.55 78,742.83 103,499.67 625,052.46 396.69Interest on bonds 53,214.02 460,379.82 539,139.17 3,640,453.48 1,802.24Income from withholding tax refunds 61.26 496.12 571.72 4,064.23 0.00Bank interest 720.96 6,406.12 7,112.41 51,037.08 14.93Trailer fees 186.61 1,489.08 1,891.67 11,890.95 6.12Income equalisation 8,783.05 45,096.87 166,656.58 217,606.60 5,579.59Total income 72,968.45 592,610.84 818,871.22 4,550,104.80 7,799.57
Expense
Interest expense -52.81 -468.38 -515.75 -3,719.88 -1.02Performance fee -15,658.44 -130,604.08 -265,774.34 -1,316,703.16 -3,190.73Management fee -38,162.37 -324,384.68 -251,218.75 -1,622,313.89 -2,067.11Custodian fee -1,145.36 -9,899.78 -11,617.32 -78,216.48 -40.43Taxe d’abonnement -1,261.55 -10,285.62 -13,168.86 -79,483.49 -123.53Publication and audit expenses -702.49 -5,732.27 -7,384.03 -44,807.74 -31.00Typesetting, printing and postage and packaging for the annual and semi-annual reports
-92.83 -757.11 -933.34 -6,013.78 -2.82
Registrar and transfer agent fee -5.68 -45.59 -60.90 -351.37 -0.28Government fees -136.46 -1,113.12 -1,280.74 -9,096.56 -0.20Other expenses 1) -500.83 -4,410.10 -5,147.06 -34,950.68 -15.60Expense equalisation -7,037.22 -37,967.22 -132,158.71 -177,697.58 -9,163.22Total expense -64,756.04 -525,667.95 -689,259.80 -3,373,354.61 -14,635.94
Ordinary net income 8,212.41 66,942.89 129,611.42 1,176,750.19 -6,836.37
Swiss total expense ratio in percent before performance fee 2)
(for period 1 July 2013 to 30 June 2014)1.89 1.85 1.03 1.17 2.43 ³)
Swiss total expense ratio in percent including performance fee 2)
(for period 1 July 2013 to 30 June 2014)2.20 1.95 1.03 1.32 2.43 ³)
Swiss performance fee in percent 2)
(for period 1 July 2013 to 30 June 2014)0.31 0.10 - 0.15 -
1) This item mainly comprises general management costs and legal costs.2) See notes to the Annual Report.3) Estimated for the period from 1 July 2013 to 30 June 2014.
* For the period from 28 March 2014 to 30 June 2014.
The accompanying notes form an integral part of this semi-annual report.
13
SEMI-ANNUAL REPORT FOR THE PERIOD ENDED 30 JUNE 2014
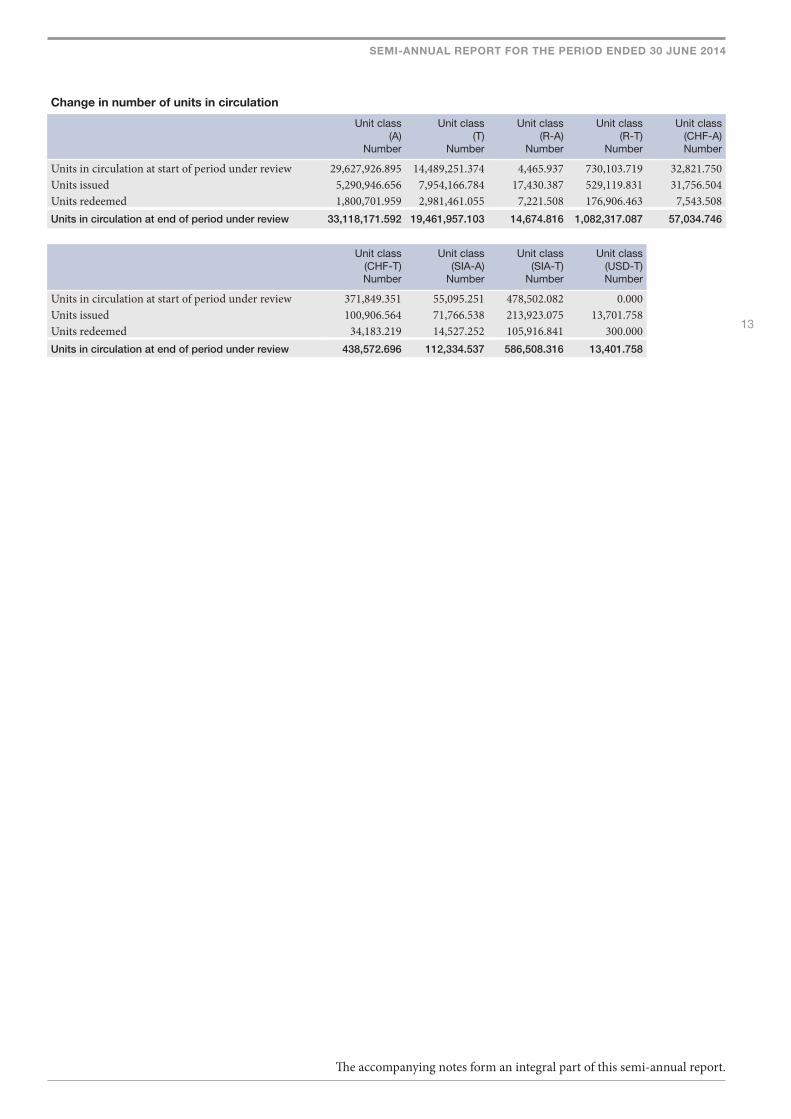
Change in number of units in circulation
Unit class (A)
Number
Unit class (T)
Number
Unit class (R-A)
Number
Unit class (R-T)
Number
Unit class (CHF-A)Number
Units in circulation at start of period under review 29,627,926.895 14,489,251.374 4,465.937 730,103.719 32,821.750Units issued 5,290,946.656 7,954,166.784 17,430.387 529,119.831 31,756.504Units redeemed 1,800,701.959 2,981,461.055 7,221.508 176,906.463 7,543.508Units in circulation at end of period under review 33,118,171.592 19,461,957.103 14,674.816 1,082,317.087 57,034.746
Unit class (CHF-T)Number
Unit class(SIA-A)
Number
Unit class (SIA-T)
Number
Unit class (USD-T)Number
Units in circulation at start of period under review 371,849.351 55,095.251 478,502.082 0.000Units issued 100,906.564 71,766.538 213,923.075 13,701.758Units redeemed 34,183.219 14,527.252 105,916.841 300.000Units in circulation at end of period under review 438,572.696 112,334.537 586,508.316 13,401.758
The accompanying notes form an integral part of this semi-annual report.
* NFA = net fund assets
The accompanying notes form an integral part of this semi-annual report.
14
SEMI-ANNUAL REPORT FOR THE PERIOD ENDED 30 JUNE 2014
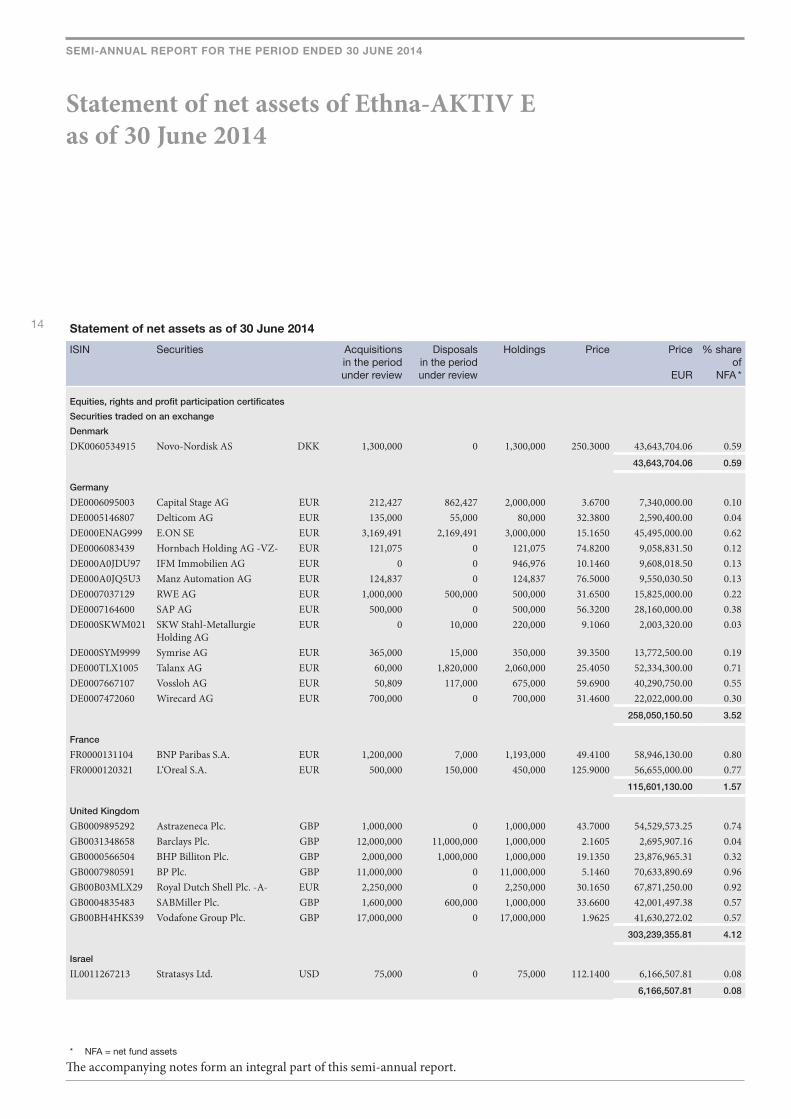
Statement of net assets as of 30 June 2014
ISIN Securities Acquisitionsin the period under review
Disposalsin the period under review
Holdings Price Price
EUR
% share of
NFA *
Equities, rights and profit participation certificates
Securities traded on an exchange
Denmark
DK0060534915 Novo-Nordisk AS DKK 1,300,000 0 1,300,000 250.3000 43,643,704.06 0.59 43,643,704.06 0.59
Germany
DE0006095003 Capital Stage AG EUR 212,427 862,427 2,000,000 3.6700 7,340,000.00 0.10DE0005146807 Delticom AG EUR 135,000 55,000 80,000 32.3800 2,590,400.00 0.04DE000ENAG999 E.ON SE EUR 3,169,491 2,169,491 3,000,000 15.1650 45,495,000.00 0.62DE0006083439 Hornbach Holding AG -VZ- EUR 121,075 0 121,075 74.8200 9,058,831.50 0.12DE000A0JDU97 IFM Immobilien AG EUR 0 0 946,976 10.1460 9,608,018.50 0.13DE000A0JQ5U3 Manz Automation AG EUR 124,837 0 124,837 76.5000 9,550,030.50 0.13DE0007037129 RWE AG EUR 1,000,000 500,000 500,000 31.6500 15,825,000.00 0.22DE0007164600 SAP AG EUR 500,000 0 500,000 56.3200 28,160,000.00 0.38DE000SKWM021 SKW Stahl-Metallurgie
Holding AGEUR 0 10,000 220,000 9.1060 2,003,320.00 0.03
DE000SYM9999 Symrise AG EUR 365,000 15,000 350,000 39.3500 13,772,500.00 0.19DE000TLX1005 Talanx AG EUR 60,000 1,820,000 2,060,000 25.4050 52,334,300.00 0.71DE0007667107 Vossloh AG EUR 50,809 117,000 675,000 59.6900 40,290,750.00 0.55DE0007472060 Wirecard AG EUR 700,000 0 700,000 31.4600 22,022,000.00 0.30 258,050,150.50 3.52
France
FR0000131104 BNP Paribas S.A. EUR 1,200,000 7,000 1,193,000 49.4100 58,946,130.00 0.80FR0000120321 L‘Oreal S.A. EUR 500,000 150,000 450,000 125.9000 56,655,000.00 0.77 115,601,130.00 1.57
United Kingdom
GB0009895292 Astrazeneca Plc. GBP 1,000,000 0 1,000,000 43.7000 54,529,573.25 0.74GB0031348658 Barclays Plc. GBP 12,000,000 11,000,000 1,000,000 2.1605 2,695,907.16 0.04GB0000566504 BHP Billiton Plc. GBP 2,000,000 1,000,000 1,000,000 19.1350 23,876,965.31 0.32GB0007980591 BP Plc. GBP 11,000,000 0 11,000,000 5.1460 70,633,890.69 0.96GB00B03MLX29 Royal Dutch Shell Plc. -A- EUR 2,250,000 0 2,250,000 30.1650 67,871,250.00 0.92GB0004835483 SABMiller Plc. GBP 1,600,000 600,000 1,000,000 33.6600 42,001,497.38 0.57GB00BH4HKS39 Vodafone Group Plc. GBP 17,000,000 0 17,000,000 1.9625 41,630,272.02 0.57 303,239,355.81 4.12
Israel
IL0011267213 Stratasys Ltd. USD 75,000 0 75,000 112.1400 6,166,507.81 0.08 6,166,507.81 0.08
Statement of net assets of Ethna-AKTIV E as of 30 June 2014
* NFA = net fund assets
The accompanying notes form an integral part of this semi-annual report.
15
SEMI-ANNUAL REPORT FOR THE PERIOD ENDED 30 JUNE 2014
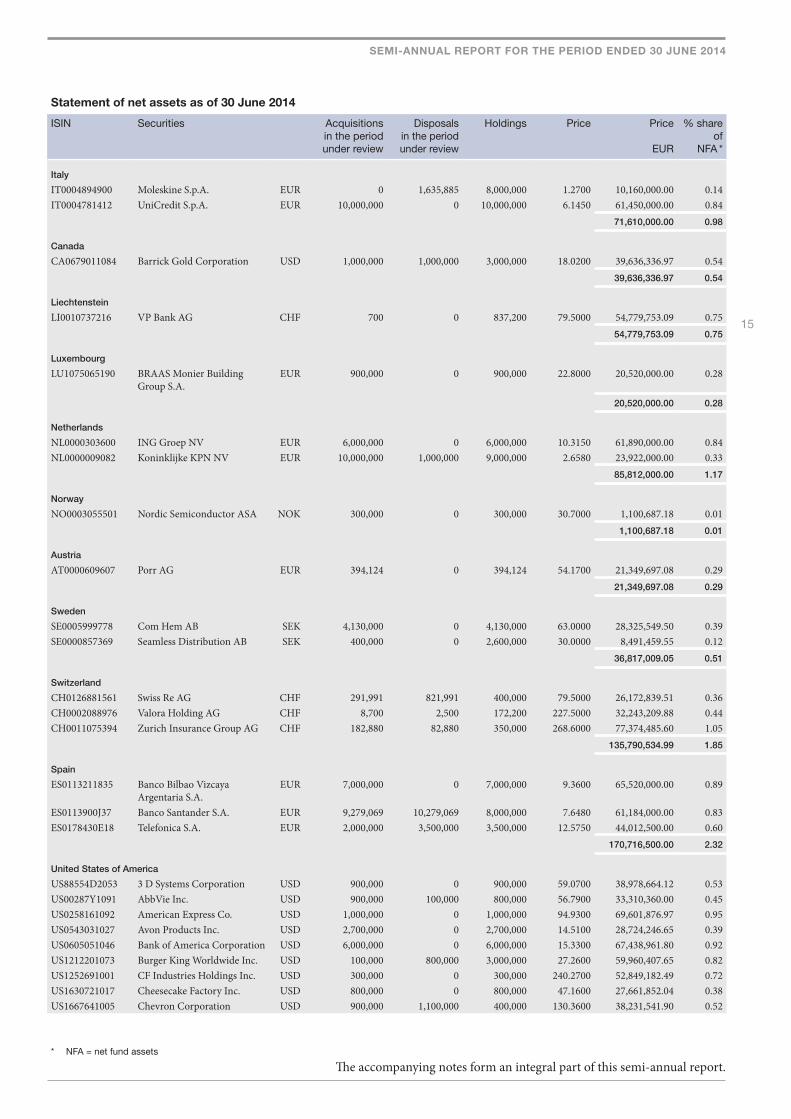
Statement of net assets as of 30 June 2014
ISIN Securities Acquisitionsin the period under review
Disposalsin the period under review
Holdings Price Price
EUR
% share of
NFA *
Italy
IT0004894900 Moleskine S.p.A. EUR 0 1,635,885 8,000,000 1.2700 10,160,000.00 0.14IT0004781412 UniCredit S.p.A. EUR 10,000,000 0 10,000,000 6.1450 61,450,000.00 0.84 71,610,000.00 0.98
Canada
CA0679011084 Barrick Gold Corporation USD 1,000,000 1,000,000 3,000,000 18.0200 39,636,336.97 0.54 39,636,336.97 0.54
Liechtenstein
LI0010737216 VP Bank AG CHF 700 0 837,200 79.5000 54,779,753.09 0.75 54,779,753.09 0.75
Luxembourg
LU1075065190 BRAAS Monier Building Group S.A.
EUR 900,000 0 900,000 22.8000 20,520,000.00 0.28
20,520,000.00 0.28
Netherlands
NL0000303600 ING Groep NV EUR 6,000,000 0 6,000,000 10.3150 61,890,000.00 0.84NL0000009082 Koninklijke KPN NV EUR 10,000,000 1,000,000 9,000,000 2.6580 23,922,000.00 0.33 85,812,000.00 1.17
Norway
NO0003055501 Nordic Semiconductor ASA NOK 300,000 0 300,000 30.7000 1,100,687.18 0.01 1,100,687.18 0.01
Austria
AT0000609607 Porr AG EUR 394,124 0 394,124 54.1700 21,349,697.08 0.29 21,349,697.08 0.29
Sweden
SE0005999778 Com Hem AB SEK 4,130,000 0 4,130,000 63.0000 28,325,549.50 0.39SE0000857369 Seamless Distribution AB SEK 400,000 0 2,600,000 30.0000 8,491,459.55 0.12 36,817,009.05 0.51
Switzerland
CH0126881561 Swiss Re AG CHF 291,991 821,991 400,000 79.5000 26,172,839.51 0.36CH0002088976 Valora Holding AG CHF 8,700 2,500 172,200 227.5000 32,243,209.88 0.44CH0011075394 Zurich Insurance Group AG CHF 182,880 82,880 350,000 268.6000 77,374,485.60 1.05 135,790,534.99 1.85
Spain
ES0113211835 Banco Bilbao Vizcaya Argentaria S.A.
EUR 7,000,000 0 7,000,000 9.3600 65,520,000.00 0.89
ES0113900J37 Banco Santander S.A. EUR 9,279,069 10,279,069 8,000,000 7.6480 61,184,000.00 0.83ES0178430E18 Telefonica S.A. EUR 2,000,000 3,500,000 3,500,000 12.5750 44,012,500.00 0.60 170,716,500.00 2.32
United States of America
US88554D2053 3 D Systems Corporation USD 900,000 0 900,000 59.0700 38,978,664.12 0.53US00287Y1091 AbbVie Inc. USD 900,000 100,000 800,000 56.7900 33,310,360.00 0.45US0258161092 American Express Co. USD 1,000,000 0 1,000,000 94.9300 69,601,876.97 0.95US0543031027 Avon Products Inc. USD 2,700,000 0 2,700,000 14.5100 28,724,246.65 0.39US0605051046 Bank of America Corporation USD 6,000,000 0 6,000,000 15.3300 67,438,961.80 0.92US1212201073 Burger King Worldwide Inc. USD 100,000 800,000 3,000,000 27.2600 59,960,407.65 0.82US1252691001 CF Industries Holdings Inc. USD 300,000 0 300,000 240.2700 52,849,182.49 0.72US1630721017 Cheesecake Factory Inc. USD 800,000 0 800,000 47.1600 27,661,852.04 0.38US1667641005 Chevron Corporation USD 900,000 1,100,000 400,000 130.3600 38,231,541.90 0.52
* NFA = net fund assets
The accompanying notes form an integral part of this semi-annual report.
16
SEMI-ANNUAL REPORT FOR THE PERIOD ENDED 30 JUNE 2014
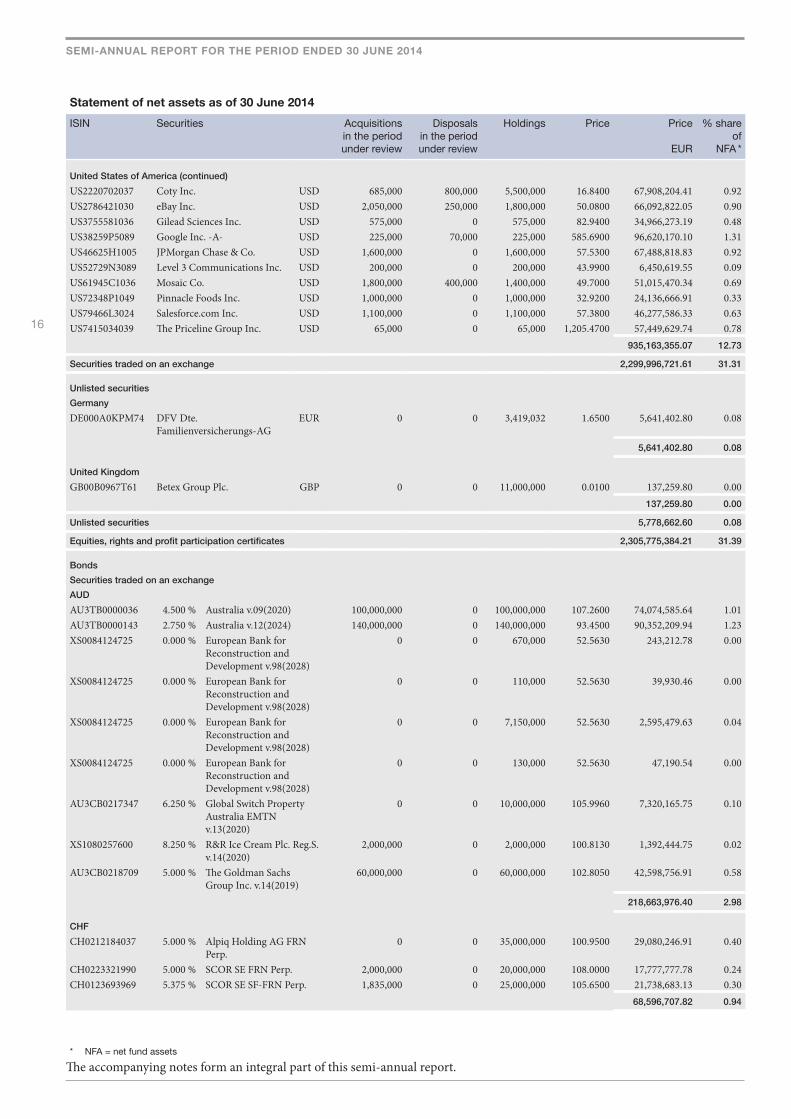
Statement of net assets as of 30 June 2014
ISIN Securities Acquisitionsin the period under review
Disposalsin the period under review
Holdings Price Price
EUR
% share of
NFA *
United States of America (continued)
US2220702037 Coty Inc. USD 685,000 800,000 5,500,000 16.8400 67,908,204.41 0.92US2786421030 eBay Inc. USD 2,050,000 250,000 1,800,000 50.0800 66,092,822.05 0.90US3755581036 Gilead Sciences Inc. USD 575,000 0 575,000 82.9400 34,966,273.19 0.48US38259P5089 Google Inc. -A- USD 225,000 70,000 225,000 585.6900 96,620,170.10 1.31US46625H1005 JPMorgan Chase & Co. USD 1,600,000 0 1,600,000 57.5300 67,488,818.83 0.92US52729N3089 Level 3 Communications Inc. USD 200,000 0 200,000 43.9900 6,450,619.55 0.09US61945C1036 Mosaic Co. USD 1,800,000 400,000 1,400,000 49.7000 51,015,470.34 0.69US72348P1049 Pinnacle Foods Inc. USD 1,000,000 0 1,000,000 32.9200 24,136,666.91 0.33US79466L3024 Salesforce.com Inc. USD 1,100,000 0 1,100,000 57.3800 46,277,586.33 0.63US7415034039 The Priceline Group Inc. USD 65,000 0 65,000 1,205.4700 57,449,629.74 0.78 935,163,355.07 12.73
Securities traded on an exchange 2,299,996,721.61 31.31
Unlisted securities
Germany
DE000A0KPM74 DFV Dte. Familienversicherungs-AG
EUR 0 0 3,419,032 1.6500 5,641,402.80 0.08
5,641,402.80 0.08
United Kingdom
GB00B0967T61 Betex Group Plc. GBP 0 0 11,000,000 0.0100 137,259.80 0.00 137,259.80 0.00
Unlisted securities 5,778,662.60 0.08
Equities, rights and profit participation certificates 2,305,775,384.21 31.39
Bonds
Securities traded on an exchange
AUD
AU3TB0000036 4.500 % Australia v.09(2020) 100,000,000 0 100,000,000 107.2600 74,074,585.64 1.01AU3TB0000143 2.750 % Australia v.12(2024) 140,000,000 0 140,000,000 93.4500 90,352,209.94 1.23XS0084124725 0.000 % European Bank for
Reconstruction and Development v.98(2028)
0 0 670,000 52.5630 243,212.78 0.00
XS0084124725 0.000 % European Bank for Reconstruction and Development v.98(2028)
0 0 110,000 52.5630 39,930.46 0.00
XS0084124725 0.000 % European Bank for Reconstruction and Development v.98(2028)
0 0 7,150,000 52.5630 2,595,479.63 0.04
XS0084124725 0.000 % European Bank for Reconstruction and Development v.98(2028)
0 0 130,000 52.5630 47,190.54 0.00
AU3CB0217347 6.250 % Global Switch Property Australia EMTN v.13(2020)
0 0 10,000,000 105.9960 7,320,165.75 0.10
XS1080257600 8.250 % R&R Ice Cream Plc. Reg.S. v.14(2020)
2,000,000 0 2,000,000 100.8130 1,392,444.75 0.02
AU3CB0218709 5.000 % The Goldman Sachs Group Inc. v.14(2019)
60,000,000 0 60,000,000 102.8050 42,598,756.91 0.58
218,663,976.40 2.98
CHF
CH0212184037 5.000 % Alpiq Holding AG FRN Perp.
0 0 35,000,000 100.9500 29,080,246.91 0.40
CH0223321990 5.000 % SCOR SE FRN Perp. 2,000,000 0 20,000,000 108.0000 17,777,777.78 0.24CH0123693969 5.375 % SCOR SE SF-FRN Perp. 1,835,000 0 25,000,000 105.6500 21,738,683.13 0.30 68,596,707.82 0.94
* NFA = net fund assets
The accompanying notes form an integral part of this semi-annual report.
17
SEMI-ANNUAL REPORT FOR THE PERIOD ENDED 30 JUNE 2014
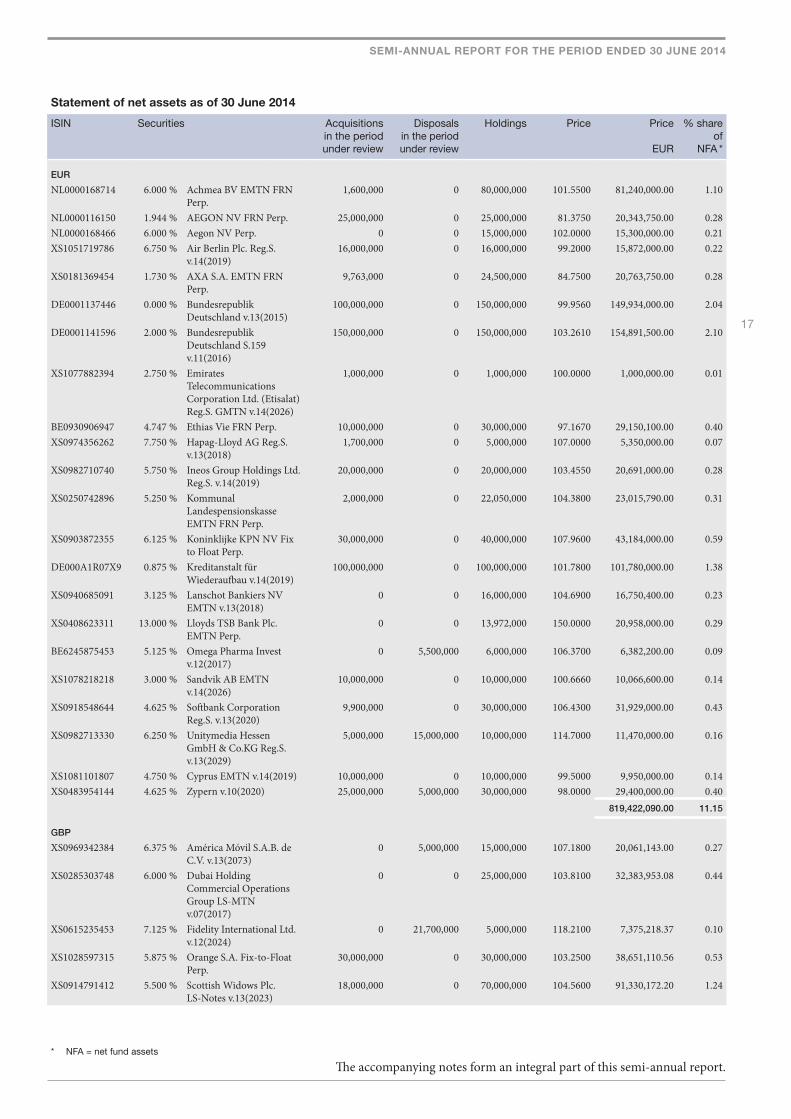
Statement of net assets as of 30 June 2014
ISIN Securities Acquisitionsin the period under review
Disposalsin the period under review
Holdings Price Price
EUR
% share of
NFA *
EUR
NL0000168714 6.000 % Achmea BV EMTN FRN Perp.
1,600,000 0 80,000,000 101.5500 81,240,000.00 1.10
NL0000116150 1.944 % AEGON NV FRN Perp. 25,000,000 0 25,000,000 81.3750 20,343,750.00 0.28NL0000168466 6.000 % Aegon NV Perp. 0 0 15,000,000 102.0000 15,300,000.00 0.21XS1051719786 6.750 % Air Berlin Plc. Reg.S.
v.14(2019)16,000,000 0 16,000,000 99.2000 15,872,000.00 0.22
XS0181369454 1.730 % AXA S.A. EMTN FRN Perp.
9,763,000 0 24,500,000 84.7500 20,763,750.00 0.28
DE0001137446 0.000 % Bundesrepublik Deutschland v.13(2015)
100,000,000 0 150,000,000 99.9560 149,934,000.00 2.04
DE0001141596 2.000 % Bundesrepublik Deutschland S.159 v.11(2016)
150,000,000 0 150,000,000 103.2610 154,891,500.00 2.10
XS1077882394 2.750 % Emirates Telecommunications Corporation Ltd. (Etisalat) Reg.S. GMTN v.14(2026)
1,000,000 0 1,000,000 100.0000 1,000,000.00 0.01
BE0930906947 4.747 % Ethias Vie FRN Perp. 10,000,000 0 30,000,000 97.1670 29,150,100.00 0.40XS0974356262 7.750 % Hapag-Lloyd AG Reg.S.
v.13(2018)1,700,000 0 5,000,000 107.0000 5,350,000.00 0.07
XS0982710740 5.750 % Ineos Group Holdings Ltd. Reg.S. v.14(2019)
20,000,000 0 20,000,000 103.4550 20,691,000.00 0.28
XS0250742896 5.250 % Kommunal Landespensionskasse EMTN FRN Perp.
2,000,000 0 22,050,000 104.3800 23,015,790.00 0.31
XS0903872355 6.125 % Koninklijke KPN NV Fix to Float Perp.
30,000,000 0 40,000,000 107.9600 43,184,000.00 0.59
DE000A1R07X9 0.875 % Kreditanstalt für Wiederaufbau v.14(2019)
100,000,000 0 100,000,000 101.7800 101,780,000.00 1.38
XS0940685091 3.125 % Lanschot Bankiers NV EMTN v.13(2018)
0 0 16,000,000 104.6900 16,750,400.00 0.23
XS0408623311 13.000 % Lloyds TSB Bank Plc. EMTN Perp.
0 0 13,972,000 150.0000 20,958,000.00 0.29
BE6245875453 5.125 % Omega Pharma Invest v.12(2017)
0 5,500,000 6,000,000 106.3700 6,382,200.00 0.09
XS1078218218 3.000 % Sandvik AB EMTN v.14(2026)
10,000,000 0 10,000,000 100.6660 10,066,600.00 0.14
XS0918548644 4.625 % Softbank Corporation Reg.S. v.13(2020)
9,900,000 0 30,000,000 106.4300 31,929,000.00 0.43
XS0982713330 6.250 % Unitymedia Hessen GmbH & Co.KG Reg.S. v.13(2029)
5,000,000 15,000,000 10,000,000 114.7000 11,470,000.00 0.16
XS1081101807 4.750 % Cyprus EMTN v.14(2019) 10,000,000 0 10,000,000 99.5000 9,950,000.00 0.14XS0483954144 4.625 % Zypern v.10(2020) 25,000,000 5,000,000 30,000,000 98.0000 29,400,000.00 0.40 819,422,090.00 11.15
GBP
XS0969342384 6.375 % América Móvil S.A.B. de C.V. v.13(2073)
0 5,000,000 15,000,000 107.1800 20,061,143.00 0.27
XS0285303748 6.000 % Dubai Holding Commercial Operations Group LS-MTN v.07(2017)
0 0 25,000,000 103.8100 32,383,953.08 0.44
XS0615235453 7.125 % Fidelity International Ltd. v.12(2024)
0 21,700,000 5,000,000 118.2100 7,375,218.37 0.10
XS1028597315 5.875 % Orange S.A. Fix-to-Float Perp.
30,000,000 0 30,000,000 103.2500 38,651,110.56 0.53
XS0914791412 5.500 % Scottish Widows Plc. LS-Notes v.13(2023)
18,000,000 0 70,000,000 104.5600 91,330,172.20 1.24
* NFA = net fund assets
The accompanying notes form an integral part of this semi-annual report.
18
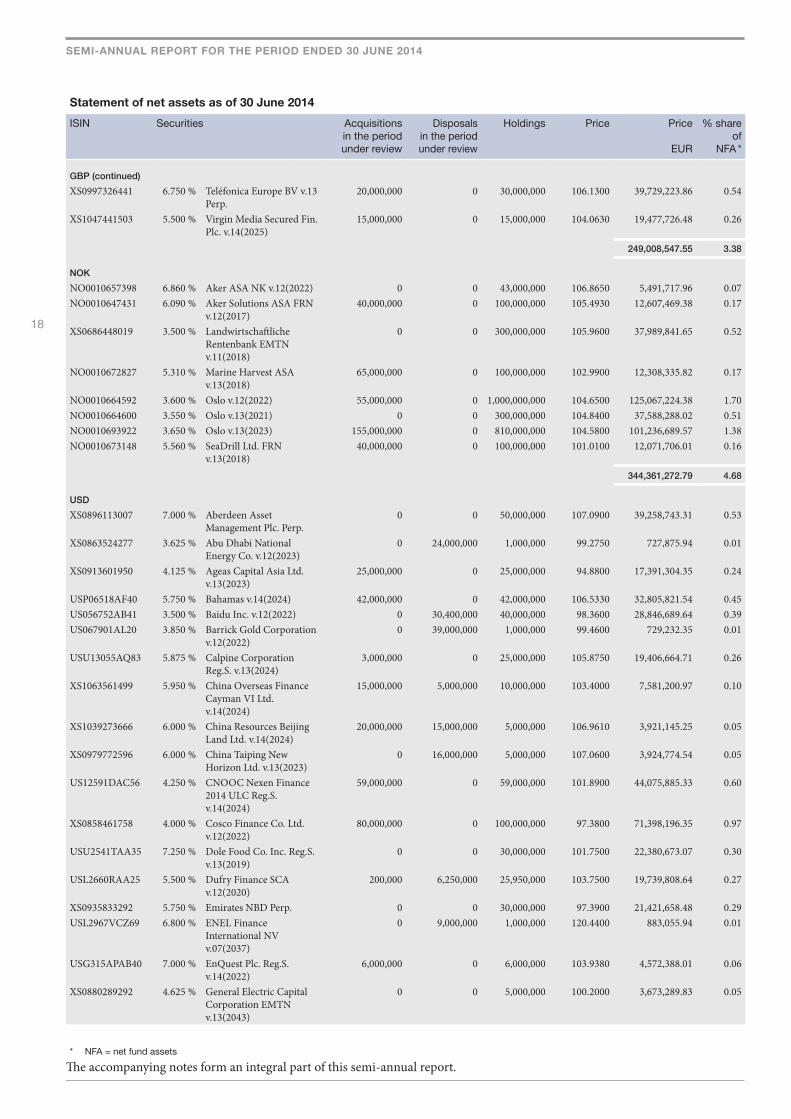
SEMI-ANNUAL REPORT FOR THE PERIOD ENDED 30 JUNE 2014
Statement of net assets as of 30 June 2014
ISIN Securities Acquisitionsin the period under review
Disposalsin the period under review
Holdings Price Price
EUR
% share of
NFA *
GBP (continued)
XS0997326441 6.750 % Teléfonica Europe BV v.13 Perp.
20,000,000 0 30,000,000 106.1300 39,729,223.86 0.54
XS1047441503 5.500 % Virgin Media Secured Fin. Plc. v.14(2025)
15,000,000 0 15,000,000 104.0630 19,477,726.48 0.26
249,008,547.55 3.38
NOK
NO0010657398 6.860 % Aker ASA NK v.12(2022) 0 0 43,000,000 106.8650 5,491,717.96 0.07NO0010647431 6.090 % Aker Solutions ASA FRN
v.12(2017)40,000,000 0 100,000,000 105.4930 12,607,469.38 0.17
XS0686448019 3.500 % Landwirtschaftliche Rentenbank EMTN v.11(2018)
0 0 300,000,000 105.9600 37,989,841.65 0.52
NO0010672827 5.310 % Marine Harvest ASA v.13(2018)
65,000,000 0 100,000,000 102.9900 12,308,335.82 0.17
NO0010664592 3.600 % Oslo v.12(2022) 55,000,000 0 1,000,000,000 104.6500 125,067,224.38 1.70NO0010664600 3.550 % Oslo v.13(2021) 0 0 300,000,000 104.8400 37,588,288.02 0.51NO0010693922 3.650 % Oslo v.13(2023) 155,000,000 0 810,000,000 104.5800 101,236,689.57 1.38NO0010673148 5.560 % SeaDrill Ltd. FRN
v.13(2018)40,000,000 0 100,000,000 101.0100 12,071,706.01 0.16
344,361,272.79 4.68
USD
XS0896113007 7.000 % Aberdeen Asset Management Plc. Perp.
0 0 50,000,000 107.0900 39,258,743.31 0.53
XS0863524277 3.625 % Abu Dhabi National Energy Co. v.12(2023)
0 24,000,000 1,000,000 99.2750 727,875.94 0.01
XS0913601950 4.125 % Ageas Capital Asia Ltd. v.13(2023)
25,000,000 0 25,000,000 94.8800 17,391,304.35 0.24
USP06518AF40 5.750 % Bahamas v.14(2024) 42,000,000 0 42,000,000 106.5330 32,805,821.54 0.45US056752AB41 3.500 % Baidu Inc. v.12(2022) 0 30,400,000 40,000,000 98.3600 28,846,689.64 0.39US067901AL20 3.850 % Barrick Gold Corporation
v.12(2022)0 39,000,000 1,000,000 99.4600 729,232.35 0.01
USU13055AQ83 5.875 % Calpine Corporation Reg.S. v.13(2024)
3,000,000 0 25,000,000 105.8750 19,406,664.71 0.26
XS1063561499 5.950 % China Overseas Finance Cayman VI Ltd. v.14(2024)
15,000,000 5,000,000 10,000,000 103.4000 7,581,200.97 0.10
XS1039273666 6.000 % China Resources Beijing Land Ltd. v.14(2024)
20,000,000 15,000,000 5,000,000 106.9610 3,921,145.25 0.05
XS0979772596 6.000 % China Taiping New Horizon Ltd. v.13(2023)
0 16,000,000 5,000,000 107.0600 3,924,774.54 0.05
US12591DAC56 4.250 % CNOOC Nexen Finance 2014 ULC Reg.S. v.14(2024)
59,000,000 0 59,000,000 101.8900 44,075,885.33 0.60
XS0858461758 4.000 % Cosco Finance Co. Ltd. v.12(2022)
80,000,000 0 100,000,000 97.3800 71,398,196.35 0.97
USU2541TAA35 7.250 % Dole Food Co. Inc. Reg.S. v.13(2019)
0 0 30,000,000 101.7500 22,380,673.07 0.30
USL2660RAA25 5.500 % Dufry Finance SCA v.12(2020)
200,000 6,250,000 25,950,000 103.7500 19,739,808.64 0.27
XS0935833292 5.750 % Emirates NBD Perp. 0 0 30,000,000 97.3900 21,421,658.48 0.29USL2967VCZ69 6.800 % ENEL Finance
International NV v.07(2037)
0 9,000,000 1,000,000 120.4400 883,055.94 0.01
USG315APAB40 7.000 % EnQuest Plc. Reg.S. v.14(2022)
6,000,000 0 6,000,000 103.9380 4,572,388.01 0.06
XS0880289292 4.625 % General Electric Capital Corporation EMTN v.13(2043)
0 0 5,000,000 100.2000 3,673,289.83 0.05
* NFA = net fund assets
The accompanying notes form an integral part of this semi-annual report.
19
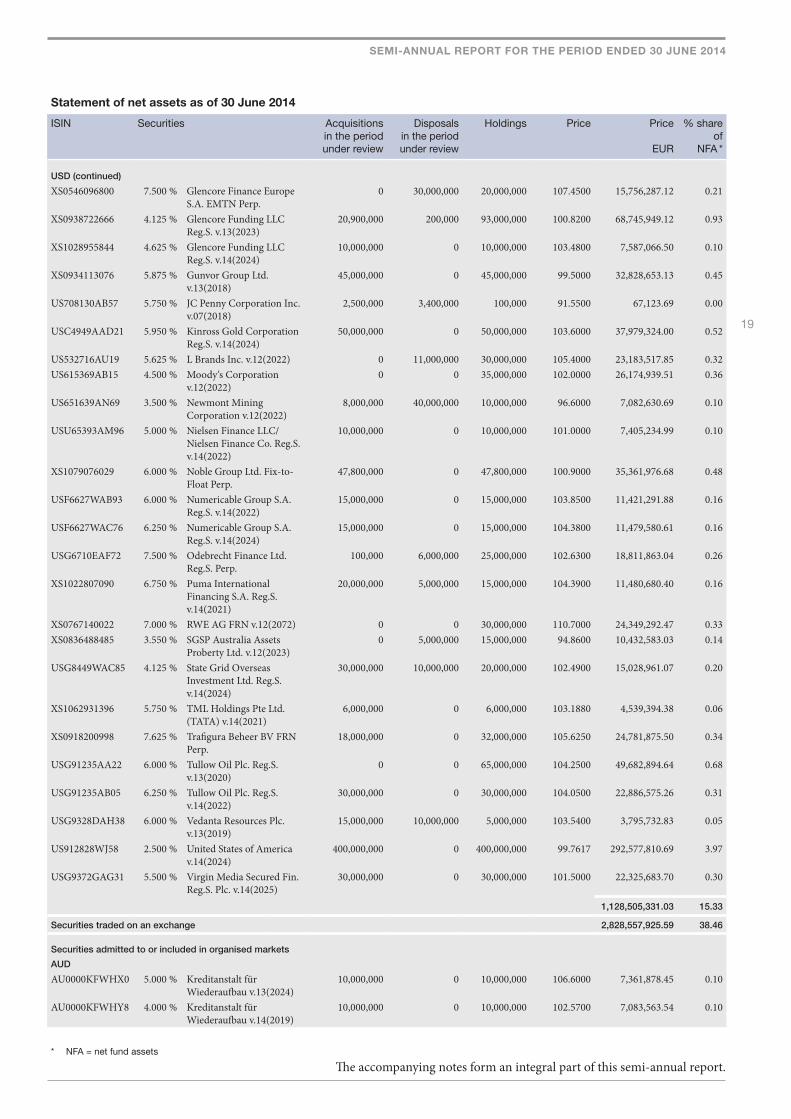
SEMI-ANNUAL REPORT FOR THE PERIOD ENDED 30 JUNE 2014
Statement of net assets as of 30 June 2014
ISIN Securities Acquisitionsin the period under review
Disposalsin the period under review
Holdings Price Price
EUR
% share of
NFA *
USD (continued)
XS0546096800 7.500 % Glencore Finance Europe S.A. EMTN Perp.
0 30,000,000 20,000,000 107.4500 15,756,287.12 0.21
XS0938722666 4.125 % Glencore Funding LLC Reg.S. v.13(2023)
20,900,000 200,000 93,000,000 100.8200 68,745,949.12 0.93
XS1028955844 4.625 % Glencore Funding LLC Reg.S. v.14(2024)
10,000,000 0 10,000,000 103.4800 7,587,066.50 0.10
XS0934113076 5.875 % Gunvor Group Ltd. v.13(2018)
45,000,000 0 45,000,000 99.5000 32,828,653.13 0.45
US708130AB57 5.750 % JC Penny Corporation Inc. v.07(2018)
2,500,000 3,400,000 100,000 91.5500 67,123.69 0.00
USC4949AAD21 5.950 % Kinross Gold Corporation Reg.S. v.14(2024)
50,000,000 0 50,000,000 103.6000 37,979,324.00 0.52
US532716AU19 5.625 % L Brands Inc. v.12(2022) 0 11,000,000 30,000,000 105.4000 23,183,517.85 0.32US615369AB15 4.500 % Moody‘s Corporation
v.12(2022)0 0 35,000,000 102.0000 26,174,939.51 0.36
US651639AN69 3.500 % Newmont Mining Corporation v.12(2022)
8,000,000 40,000,000 10,000,000 96.6000 7,082,630.69 0.10
USU65393AM96 5.000 % Nielsen Finance LLC/Nielsen Finance Co. Reg.S. v.14(2022)
10,000,000 0 10,000,000 101.0000 7,405,234.99 0.10
XS1079076029 6.000 % Noble Group Ltd. Fix-to-Float Perp.
47,800,000 0 47,800,000 100.9000 35,361,976.68 0.48
USF6627WAB93 6.000 % Numericable Group S.A. Reg.S. v.14(2022)
15,000,000 0 15,000,000 103.8500 11,421,291.88 0.16
USF6627WAC76 6.250 % Numericable Group S.A. Reg.S. v.14(2024)
15,000,000 0 15,000,000 104.3800 11,479,580.61 0.16
USG6710EAF72 7.500 % Odebrecht Finance Ltd. Reg.S. Perp.
100,000 6,000,000 25,000,000 102.6300 18,811,863.04 0.26
XS1022807090 6.750 % Puma International Financing S.A. Reg.S. v.14(2021)
20,000,000 5,000,000 15,000,000 104.3900 11,480,680.40 0.16
XS0767140022 7.000 % RWE AG FRN v.12(2072) 0 0 30,000,000 110.7000 24,349,292.47 0.33XS0836488485 3.550 % SGSP Australia Assets
Proberty Ltd. v.12(2023)0 5,000,000 15,000,000 94.8600 10,432,583.03 0.14
USG8449WAC85 4.125 % State Grid Overseas Investment Ltd. Reg.S. v.14(2024)
30,000,000 10,000,000 20,000,000 102.4900 15,028,961.07 0.20
XS1062931396 5.750 % TML Holdings Pte Ltd. (TATA) v.14(2021)
6,000,000 0 6,000,000 103.1880 4,539,394.38 0.06
XS0918200998 7.625 % Trafigura Beheer BV FRN Perp.
18,000,000 0 32,000,000 105.6250 24,781,875.50 0.34
USG91235AA22 6.000 % Tullow Oil Plc. Reg.S. v.13(2020)
0 0 65,000,000 104.2500 49,682,894.64 0.68
USG91235AB05 6.250 % Tullow Oil Plc. Reg.S. v.14(2022)
30,000,000 0 30,000,000 104.0500 22,886,575.26 0.31
USG9328DAH38 6.000 % Vedanta Resources Plc. v.13(2019)
15,000,000 10,000,000 5,000,000 103.5400 3,795,732.83 0.05
US912828WJ58 2.500 % United States of America v.14(2024)
400,000,000 0 400,000,000 99.7617 292,577,810.69 3.97
USG9372GAG31 5.500 % Virgin Media Secured Fin. Reg.S. Plc. v.14(2025)
30,000,000 0 30,000,000 101.5000 22,325,683.70 0.30
1,128,505,331.03 15.33
Securities traded on an exchange 2,828,557,925.59 38.46
Securities admitted to or included in organised markets
AUD
AU0000KFWHX0 5.000 % Kreditanstalt für Wiederaufbau v.13(2024)
10,000,000 0 10,000,000 106.6000 7,361,878.45 0.10
AU0000KFWHY8 4.000 % Kreditanstalt für Wiederaufbau v.14(2019)
10,000,000 0 10,000,000 102.5700 7,083,563.54 0.10
* NFA = net fund assets
The accompanying notes form an integral part of this semi-annual report.
20
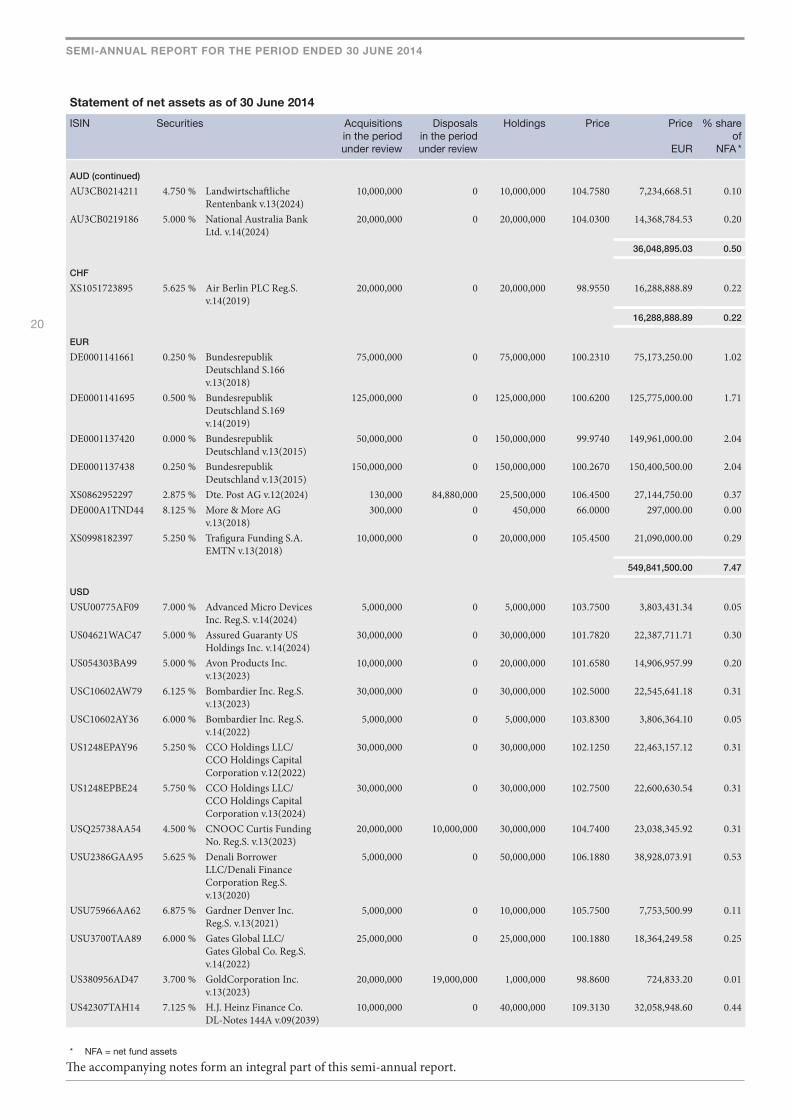
SEMI-ANNUAL REPORT FOR THE PERIOD ENDED 30 JUNE 2014
Statement of net assets as of 30 June 2014
ISIN Securities Acquisitionsin the period under review
Disposalsin the period under review
Holdings Price Price
EUR
% share of
NFA *
AUD (continued)
AU3CB0214211 4.750 % Landwirtschaftliche Rentenbank v.13(2024)
10,000,000 0 10,000,000 104.7580 7,234,668.51 0.10
AU3CB0219186 5.000 % National Australia Bank Ltd. v.14(2024)
20,000,000 0 20,000,000 104.0300 14,368,784.53 0.20
36,048,895.03 0.50
CHF
XS1051723895 5.625 % Air Berlin PLC Reg.S. v.14(2019)
20,000,000 0 20,000,000 98.9550 16,288,888.89 0.22
16,288,888.89 0.22
EUR
DE0001141661 0.250 % Bundesrepublik Deutschland S.166 v.13(2018)
75,000,000 0 75,000,000 100.2310 75,173,250.00 1.02
DE0001141695 0.500 % Bundesrepublik Deutschland S.169 v.14(2019)
125,000,000 0 125,000,000 100.6200 125,775,000.00 1.71
DE0001137420 0.000 % Bundesrepublik Deutschland v.13(2015)
50,000,000 0 150,000,000 99.9740 149,961,000.00 2.04
DE0001137438 0.250 % Bundesrepublik Deutschland v.13(2015)
150,000,000 0 150,000,000 100.2670 150,400,500.00 2.04
XS0862952297 2.875 % Dte. Post AG v.12(2024) 130,000 84,880,000 25,500,000 106.4500 27,144,750.00 0.37DE000A1TND44 8.125 % More & More AG
v.13(2018)300,000 0 450,000 66.0000 297,000.00 0.00
XS0998182397 5.250 % Trafigura Funding S.A. EMTN v.13(2018)
10,000,000 0 20,000,000 105.4500 21,090,000.00 0.29
549,841,500.00 7.47
USD
USU00775AF09 7.000 % Advanced Micro Devices Inc. Reg.S. v.14(2024)
5,000,000 0 5,000,000 103.7500 3,803,431.34 0.05
US04621WAC47 5.000 % Assured Guaranty US Holdings Inc. v.14(2024)
30,000,000 0 30,000,000 101.7820 22,387,711.71 0.30
US054303BA99 5.000 % Avon Products Inc. v.13(2023)
10,000,000 0 20,000,000 101.6580 14,906,957.99 0.20
USC10602AW79 6.125 % Bombardier Inc. Reg.S. v.13(2023)
30,000,000 0 30,000,000 102.5000 22,545,641.18 0.31
USC10602AY36 6.000 % Bombardier Inc. Reg.S. v.14(2022)
5,000,000 0 5,000,000 103.8300 3,806,364.10 0.05
US1248EPAY96 5.250 % CCO Holdings LLC/CCO Holdings Capital Corporation v.12(2022)
30,000,000 0 30,000,000 102.1250 22,463,157.12 0.31
US1248EPBE24 5.750 % CCO Holdings LLC/CCO Holdings Capital Corporation v.13(2024)
30,000,000 0 30,000,000 102.7500 22,600,630.54 0.31
USQ25738AA54 4.500 % CNOOC Curtis Funding No. Reg.S. v.13(2023)
20,000,000 10,000,000 30,000,000 104.7400 23,038,345.92 0.31
USU2386GAA95 5.625 % Denali Borrower LLC/Denali Finance Corporation Reg.S. v.13(2020)
5,000,000 0 50,000,000 106.1880 38,928,073.91 0.53
USU75966AA62 6.875 % Gardner Denver Inc. Reg.S. v.13(2021)
5,000,000 0 10,000,000 105.7500 7,753,500.99 0.11
USU3700TAA89 6.000 % Gates Global LLC/Gates Global Co. Reg.S. v.14(2022)
25,000,000 0 25,000,000 100.1880 18,364,249.58 0.25
US380956AD47 3.700 % GoldCorporation Inc. v.13(2023)
20,000,000 19,000,000 1,000,000 98.8600 724,833.20 0.01
US42307TAH14 7.125 % H.J. Heinz Finance Co. DL-Notes 144A v.09(2039)
10,000,000 0 40,000,000 109.3130 32,058,948.60 0.44
* NFA = net fund assets
The accompanying notes form an integral part of this semi-annual report.
21
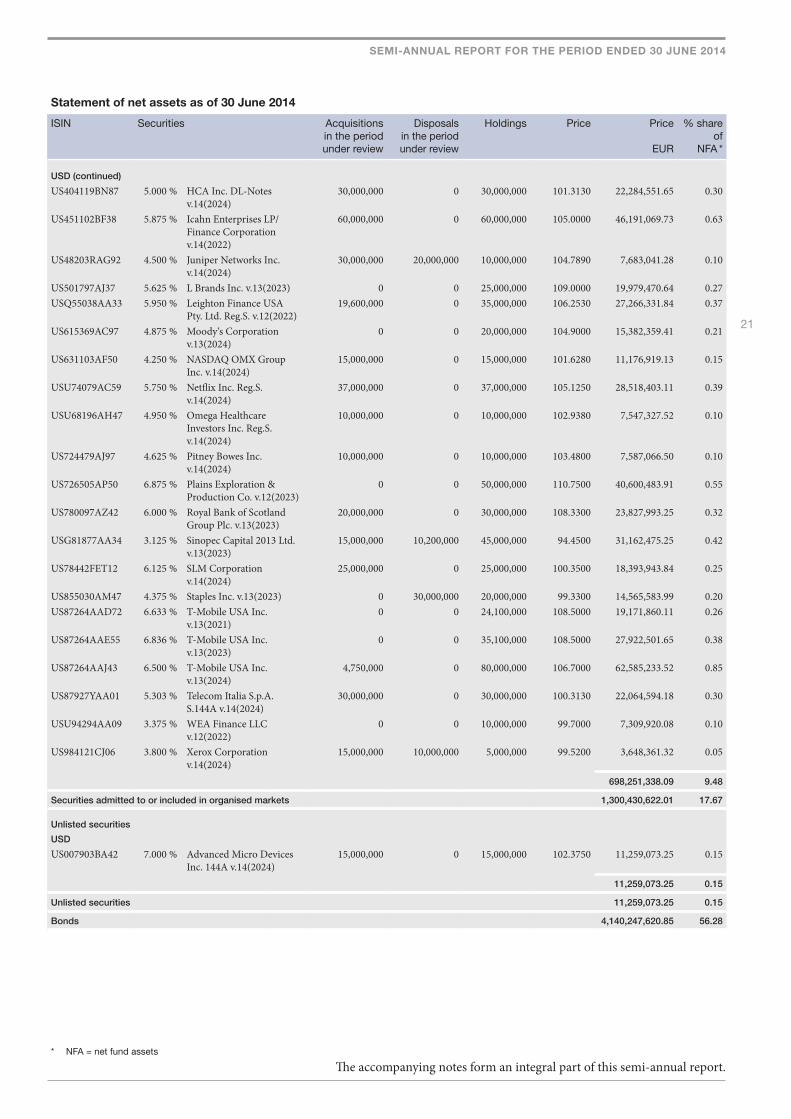
SEMI-ANNUAL REPORT FOR THE PERIOD ENDED 30 JUNE 2014
Statement of net assets as of 30 June 2014
ISIN Securities Acquisitionsin the period under review
Disposalsin the period under review
Holdings Price Price
EUR
% share of
NFA *
USD (continued)
US404119BN87 5.000 % HCA Inc. DL-Notes v.14(2024)
30,000,000 0 30,000,000 101.3130 22,284,551.65 0.30
US451102BF38 5.875 % Icahn Enterprises LP/Finance Corporation v.14(2022)
60,000,000 0 60,000,000 105.0000 46,191,069.73 0.63
US48203RAG92 4.500 % Juniper Networks Inc. v.14(2024)
30,000,000 20,000,000 10,000,000 104.7890 7,683,041.28 0.10
US501797AJ37 5.625 % L Brands Inc. v.13(2023) 0 0 25,000,000 109.0000 19,979,470.64 0.27USQ55038AA33 5.950 % Leighton Finance USA
Pty. Ltd. Reg.S. v.12(2022)19,600,000 0 35,000,000 106.2530 27,266,331.84 0.37
US615369AC97 4.875 % Moody‘s Corporation v.13(2024)
0 0 20,000,000 104.9000 15,382,359.41 0.21
US631103AF50 4.250 % NASDAQ OMX Group Inc. v.14(2024)
15,000,000 0 15,000,000 101.6280 11,176,919.13 0.15
USU74079AC59 5.750 % Netflix Inc. Reg.S. v.14(2024)
37,000,000 0 37,000,000 105.1250 28,518,403.11 0.39
USU68196AH47 4.950 % Omega Healthcare Investors Inc. Reg.S. v.14(2024)
10,000,000 0 10,000,000 102.9380 7,547,327.52 0.10
US724479AJ97 4.625 % Pitney Bowes Inc. v.14(2024)
10,000,000 0 10,000,000 103.4800 7,587,066.50 0.10
US726505AP50 6.875 % Plains Exploration & Production Co. v.12(2023)
0 0 50,000,000 110.7500 40,600,483.91 0.55
US780097AZ42 6.000 % Royal Bank of Scotland Group Plc. v.13(2023)
20,000,000 0 30,000,000 108.3300 23,827,993.25 0.32
USG81877AA34 3.125 % Sinopec Capital 2013 Ltd. v.13(2023)
15,000,000 10,200,000 45,000,000 94.4500 31,162,475.25 0.42
US78442FET12 6.125 % SLM Corporation v.14(2024)
25,000,000 0 25,000,000 100.3500 18,393,943.84 0.25
US855030AM47 4.375 % Staples Inc. v.13(2023) 0 30,000,000 20,000,000 99.3300 14,565,583.99 0.20US87264AAD72 6.633 % T-Mobile USA Inc.
v.13(2021)0 0 24,100,000 108.5000 19,171,860.11 0.26
US87264AAE55 6.836 % T-Mobile USA Inc. v.13(2023)
0 0 35,100,000 108.5000 27,922,501.65 0.38
US87264AAJ43 6.500 % T-Mobile USA Inc. v.13(2024)
4,750,000 0 80,000,000 106.7000 62,585,233.52 0.85
US87927YAA01 5.303 % Telecom Italia S.p.A. S.144A v.14(2024)
30,000,000 0 30,000,000 100.3130 22,064,594.18 0.30
USU94294AA09 3.375 % WEA Finance LLC v.12(2022)
0 0 10,000,000 99.7000 7,309,920.08 0.10
US984121CJ06 3.800 % Xerox Corporation v.14(2024)
15,000,000 10,000,000 5,000,000 99.5200 3,648,361.32 0.05
698,251,338.09 9.48
Securities admitted to or included in organised markets 1,300,430,622.01 17.67
Unlisted securities
USD
US007903BA42 7.000 % Advanced Micro Devices Inc. 144A v.14(2024)
15,000,000 0 15,000,000 102.3750 11,259,073.25 0.15
11,259,073.25 0.15
Unlisted securities 11,259,073.25 0.15
Bonds 4,140,247,620.85 56.28

The accompanying notes form an integral part of this semi-annual report.
22
SEMI-ANNUAL REPORT FOR THE PERIOD ENDED 30 JUNE 2014
* NFA = net fund assets
** Entry/exit charges and management fees:Information on subscription and redemption fees as well as the maximum amount of the management fee for target fund units may be obtained on application from the registered office of the management company and from the custodian bank and paying agents free of charge.
Subscription and redemption fees were not paid during the period under review from 1 January 2014 to 30 June 2014.
Statement of net assets as of 30 June 2014
ISIN Securities Acquisitionsin the period under review
Disposalsin the period under review
Holdings Price Price
EUR
% share of
NFA *
Convertible bonds
Securities traded on an exchange
EUR
XS0882243453 1.250 % GBL Verwaltung S.A./GdF Suez S.A. CV v.13(2017)
5,200,000 0 35,200,000 116.9700 41,173,440.00 0.56
41,173,440.00 0.56
Securities traded on an exchange 41,173,440.00 0.56
Securities admitted to or included in organised markets
USD
US67020YAB65 2.750 % Nuance Communications Inc. CV v.07(2027)
35,000,000 0 35,000,000 106.3570 27,293,020.01 0.37
27,293,020.01 0.37
Securities admitted to or included in organised markets 27,293,020.01 0.37
Unlisted securities
USD
US82922RAC79 1.000 % Sina Corporation CV v.13(2018)
20,000,000 0 20,000,000 91.2940 13,387,198.46 0.18
13,387,198.46 0.18
Unlisted securities 13,387,198.46 0.18
Convertible bonds 81,853,658.47 1.11
Investment fund units **
Luxembourg
LU0914398671 Mellinckrodt 2 SICAV - German Opportunities
EUR 0 0 6,000 10,536.4400 63,218,640.00 0.86
63,218,640.00 0.86
Investment fund units 63,218,640.00 0.86
Securities holdings 6,591,095,303.53 89.64
Options
Short positions
USD
Put on Amazon.Com Inc. October 2014/300,00 0 200 -200 -156,903.00 0.00
-156,903.00 0.00
Short positions -156,903.00 0.00
Options -156,903.00 0.00
Futures contracts
Long positions
JPY
Yen Denominated Nikkei 225 Index Future September 2014 3,000 0 3,000 1,574,731.33 0.02
1,574,731.33 0.02
Long positions 1,574,731.33 0.02
Futures contracts 1,574,731.33 0.02
Fixed-term deposits 60,000,000.00 0.82
Cash at banks - current accounts 996,299,683.99 13.55
Liabilities to banks -340,278,047.31 -4.63
Other receivables and payables (net) 44,201,018.58 0.60
Total net fund assets in EUR 7,352,735,787.12 100.00

* NFA = net fund assets
The accompanying notes form an integral part of this semi-annual report.
23
SEMI-ANNUAL REPORT FOR THE PERIOD ENDED 30 JUNE 2014
Forward foreign exchange contracts
The following forward foreign exchange contracts were open as of 30 June 2014:
Currency Counterparty Currency amount Price % share of
NFA *
CHF Currency purchases DZ PRIVATBANK S.A. 58,700,000.00 48,318,165.64 0.66USD Currency purchases DZ PRIVATBANK S.A. 1,250,000.00 916,407.50 0.01CHF Currency sales DZ PRIVATBANK S.A. 355,250,000.00 292,493,184.38 3.98GBP Currency sales DZ PRIVATBANK S.A. 430,000,000.00 536,078,209.02 7.29USD Currency sales DZ PRIVATBANK S.A. 1,900,020,000.00 1,392,828,164.99 18.94
Futures contracts
Holdings Commitments
EUR
% share of
NFA *
Long positions
JPY
Yen Denominated Nikkei 225 Index Future September 2014 3,000 164,273,691.11 2.23164,273,691.11 2.23
Long positions 164,273,691.11 2.23
Futures contracts 164,273,691.11 2.23

24
SEMI-ANNUAL REPORT FOR THE PERIOD ENDED 30 JUNE 2014
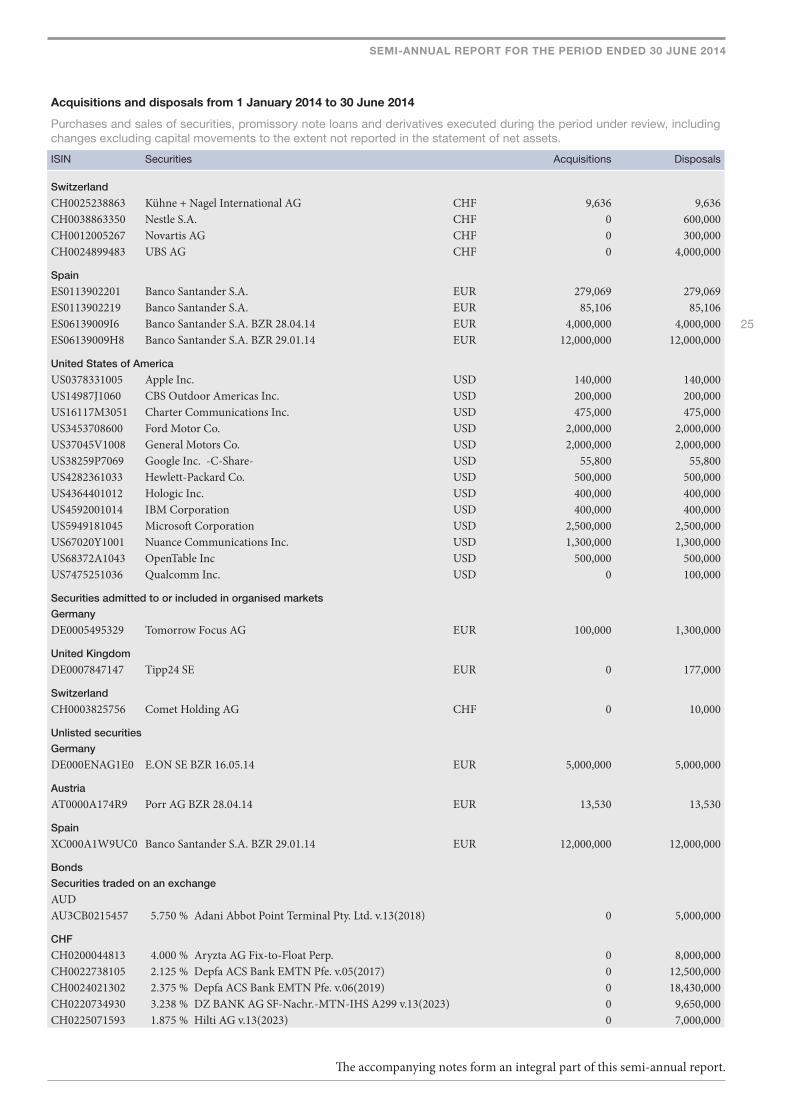
Acquisitions and disposals from 1 January 2014 to 30 June 2014
Purchases and sales of securities, promissory note loans and derivatives executed during the period under review, including changes excluding capital movements to the extent not reported in the statement of net assets.
ISIN Securities Acquisitions Disposals
Equities, rights and profit participation certificates
Securities traded on an exchange
Belgium
BE0003815322 RHJ International EUR 250,958 250,958
Germany
DE000BASF111 BASF SE EUR 600,000 600,000DE000KC01000 Klöckner & Co. SE EUR 100,000 100,000DE0005470405 LANXESS AG EUR 68,250 68,250DE000LTT0243 LOTTO24 AG EUR 0 980,000DE0008430026 Münchener Rückversicherungs - Gesellschaft AG EUR 0 350,000DE0005220909 Nexus AG EUR 0 100,000DE000A1PHBB5 R. Stahl AG EUR 7,000 100,000DE0007010803 Rational AG EUR 0 20,000DE000A111338 SLM Solutions Group AG EUR 292,000 292,000DE0005176903 SURTECO SE EUR 0 369,076DE0007664039 Volkswagen AG -VZ- EUR 130,000 130,000
Finland
FI4000072772 Sanitec Corp. SEK 0 50,000
France
FR0000052292 Hermes International EUR 0 130,000FR0000120693 Pernod-Ricard S.A. EUR 0 750,000
United Kingdom
GB0000031285 Aberdeen Asset Management Plc. GBP 500,000 500,000GB0059822006 Dialog Semiconductor Plc. EUR 700,000 700,000GB00B019KW72 J. Sainsbury Plc. GBP 0 1,500,000GB0007188757 Rio Tinto Plc. GBP 1,000,000 1,000,000GB00BHD66J44 Tipp24 SE EUR 106,000 106,000
Jersey
JE00B4T3BW64 Glencore Plc. GBP 3,000,000 3,000,000
Canada
CA3809564097 Goldcorp Inc. USD 1,500,000 1,500,000
Austria
AT0000A17548 Porr AG EUR 364,050 364,050AT0000821103 UNIQA Insurance Group AG EUR 0 280,000
Acquisitions and disposals from 1 January 2014 to 30 June 2014
The accompanying notes form an integral part of this semi-annual report.
25
SEMI-ANNUAL REPORT FOR THE PERIOD ENDED 30 JUNE 2014
Acquisitions and disposals from 1 January 2014 to 30 June 2014
Purchases and sales of securities, promissory note loans and derivatives executed during the period under review, including changes excluding capital movements to the extent not reported in the statement of net assets.
ISIN Securities Acquisitions Disposals
Switzerland
CH0025238863 Kühne + Nagel International AG CHF 9,636 9,636CH0038863350 Nestle S.A. CHF 0 600,000CH0012005267 Novartis AG CHF 0 300,000CH0024899483 UBS AG CHF 0 4,000,000
Spain
ES0113902201 Banco Santander S.A. EUR 279,069 279,069ES0113902219 Banco Santander S.A. EUR 85,106 85,106ES06139009I6 Banco Santander S.A. BZR 28.04.14 EUR 4,000,000 4,000,000ES06139009H8 Banco Santander S.A. BZR 29.01.14 EUR 12,000,000 12,000,000
United States of America
US0378331005 Apple Inc. USD 140,000 140,000US14987J1060 CBS Outdoor Americas Inc. USD 200,000 200,000US16117M3051 Charter Communications Inc. USD 475,000 475,000US3453708600 Ford Motor Co. USD 2,000,000 2,000,000US37045V1008 General Motors Co. USD 2,000,000 2,000,000US38259P7069 Google Inc. -C-Share- USD 55,800 55,800US4282361033 Hewlett-Packard Co. USD 500,000 500,000US4364401012 Hologic Inc. USD 400,000 400,000US4592001014 IBM Corporation USD 400,000 400,000US5949181045 Microsoft Corporation USD 2,500,000 2,500,000US67020Y1001 Nuance Communications Inc. USD 1,300,000 1,300,000US68372A1043 OpenTable Inc USD 500,000 500,000US7475251036 Qualcomm Inc. USD 0 100,000
Securities admitted to or included in organised markets
Germany
DE0005495329 Tomorrow Focus AG EUR 100,000 1,300,000
United Kingdom
DE0007847147 Tipp24 SE EUR 0 177,000
Switzerland
CH0003825756 Comet Holding AG CHF 0 10,000
Unlisted securities
Germany
DE000ENAG1E0 E.ON SE BZR 16.05.14 EUR 5,000,000 5,000,000
Austria
AT0000A174R9 Porr AG BZR 28.04.14 EUR 13,530 13,530
Spain
XC000A1W9UC0 Banco Santander S.A. BZR 29.01.14 EUR 12,000,000 12,000,000
Bonds
Securities traded on an exchange
AUDAU3CB0215457 5.750 % Adani Abbot Point Terminal Pty. Ltd. v.13(2018) 0 5,000,000
CHF
CH0200044813 4.000 % Aryzta AG Fix-to-Float Perp. 0 8,000,000CH0022738105 2.125 % Depfa ACS Bank EMTN Pfe. v.05(2017) 0 12,500,000CH0024021302 2.375 % Depfa ACS Bank EMTN Pfe. v.06(2019) 0 18,430,000CH0220734930 3.238 % DZ BANK AG SF-Nachr.-MTN-IHS A299 v.13(2023) 0 9,650,000CH0225071593 1.875 % Hilti AG v.13(2023) 0 7,000,000
The accompanying notes form an integral part of this semi-annual report.
26
SEMI-ANNUAL REPORT FOR THE PERIOD ENDED 30 JUNE 2014
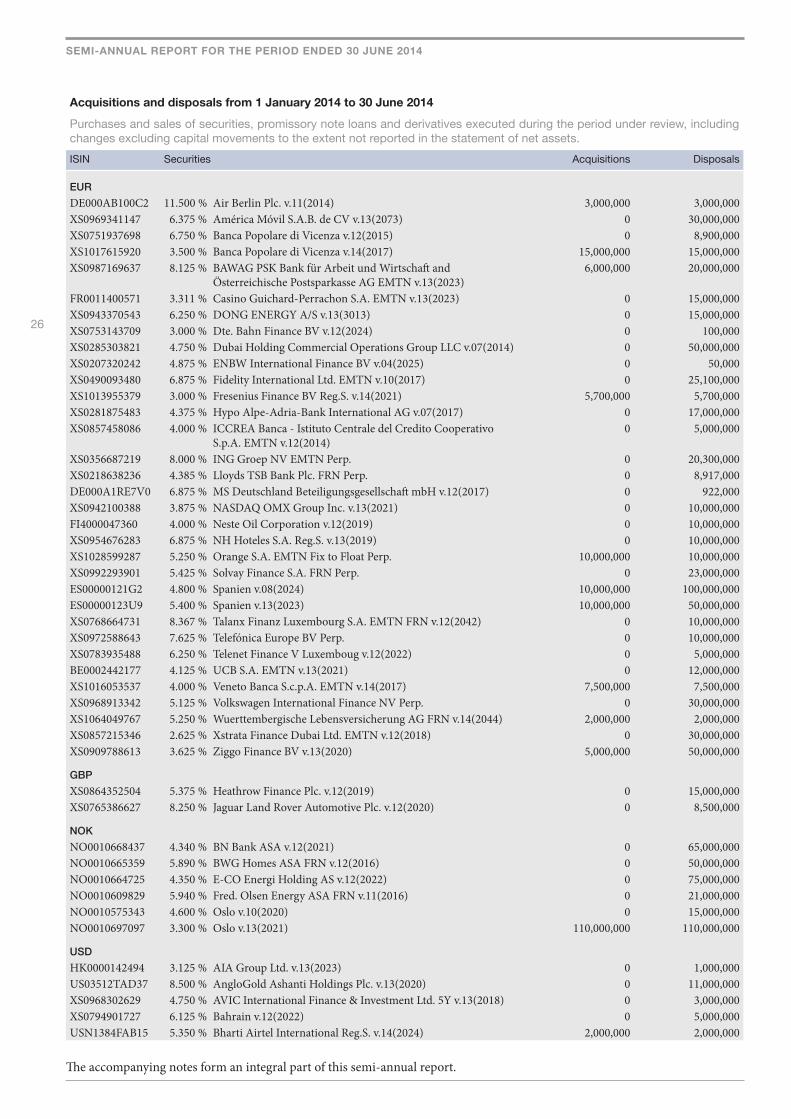
Acquisitions and disposals from 1 January 2014 to 30 June 2014
Purchases and sales of securities, promissory note loans and derivatives executed during the period under review, including changes excluding capital movements to the extent not reported in the statement of net assets.
ISIN Securities Acquisitions Disposals
EUR
DE000AB100C2 11.500 % Air Berlin Plc. v.11(2014) 3,000,000 3,000,000XS0969341147 6.375 % América Móvil S.A.B. de CV v.13(2073) 0 30,000,000XS0751937698 6.750 % Banca Popolare di Vicenza v.12(2015) 0 8,900,000XS1017615920 3.500 % Banca Popolare di Vicenza v.14(2017) 15,000,000 15,000,000XS0987169637 8.125 % BAWAG PSK Bank für Arbeit und Wirtschaft and
Österreichische Postsparkasse AG EMTN v.13(2023)6,000,000 20,000,000
FR0011400571 3.311 % Casino Guichard-Perrachon S.A. EMTN v.13(2023) 0 15,000,000XS0943370543 6.250 % DONG ENERGY A/S v.13(3013) 0 15,000,000XS0753143709 3.000 % Dte. Bahn Finance BV v.12(2024) 0 100,000XS0285303821 4.750 % Dubai Holding Commercial Operations Group LLC v.07(2014) 0 50,000,000XS0207320242 4.875 % ENBW International Finance BV v.04(2025) 0 50,000XS0490093480 6.875 % Fidelity International Ltd. EMTN v.10(2017) 0 25,100,000XS1013955379 3.000 % Fresenius Finance BV Reg.S. v.14(2021) 5,700,000 5,700,000XS0281875483 4.375 % Hypo Alpe-Adria-Bank International AG v.07(2017) 0 17,000,000XS0857458086 4.000 % ICCREA Banca - Istituto Centrale del Credito Cooperativo
S.p.A. EMTN v.12(2014)0 5,000,000
XS0356687219 8.000 % ING Groep NV EMTN Perp. 0 20,300,000XS0218638236 4.385 % Lloyds TSB Bank Plc. FRN Perp. 0 8,917,000DE000A1RE7V0 6.875 % MS Deutschland Beteiligungsgesellschaft mbH v.12(2017) 0 922,000XS0942100388 3.875 % NASDAQ OMX Group Inc. v.13(2021) 0 10,000,000FI4000047360 4.000 % Neste Oil Corporation v.12(2019) 0 10,000,000XS0954676283 6.875 % NH Hoteles S.A. Reg.S. v.13(2019) 0 10,000,000XS1028599287 5.250 % Orange S.A. EMTN Fix to Float Perp. 10,000,000 10,000,000XS0992293901 5.425 % Solvay Finance S.A. FRN Perp. 0 23,000,000ES00000121G2 4.800 % Spanien v.08(2024) 10,000,000 100,000,000ES00000123U9 5.400 % Spanien v.13(2023) 10,000,000 50,000,000XS0768664731 8.367 % Talanx Finanz Luxembourg S.A. EMTN FRN v.12(2042) 0 10,000,000XS0972588643 7.625 % Telefónica Europe BV Perp. 0 10,000,000XS0783935488 6.250 % Telenet Finance V Luxemboug v.12(2022) 0 5,000,000BE0002442177 4.125 % UCB S.A. EMTN v.13(2021) 0 12,000,000XS1016053537 4.000 % Veneto Banca S.c.p.A. EMTN v.14(2017) 7,500,000 7,500,000XS0968913342 5.125 % Volkswagen International Finance NV Perp. 0 30,000,000XS1064049767 5.250 % Wuerttembergische Lebensversicherung AG FRN v.14(2044) 2,000,000 2,000,000XS0857215346 2.625 % Xstrata Finance Dubai Ltd. EMTN v.12(2018) 0 30,000,000XS0909788613 3.625 % Ziggo Finance BV v.13(2020) 5,000,000 50,000,000
GBP
XS0864352504 5.375 % Heathrow Finance Plc. v.12(2019) 0 15,000,000XS0765386627 8.250 % Jaguar Land Rover Automotive Plc. v.12(2020) 0 8,500,000
NOK
NO0010668437 4.340 % BN Bank ASA v.12(2021) 0 65,000,000NO0010665359 5.890 % BWG Homes ASA FRN v.12(2016) 0 50,000,000NO0010664725 4.350 % E-CO Energi Holding AS v.12(2022) 0 75,000,000NO0010609829 5.940 % Fred. Olsen Energy ASA FRN v.11(2016) 0 21,000,000NO0010575343 4.600 % Oslo v.10(2020) 0 15,000,000NO0010697097 3.300 % Oslo v.13(2021) 110,000,000 110,000,000
USD
HK0000142494 3.125 % AIA Group Ltd. v.13(2023) 0 1,000,000US03512TAD37 8.500 % AngloGold Ashanti Holdings Plc. v.13(2020) 0 11,000,000XS0968302629 4.750 % AVIC International Finance & Investment Ltd. 5Y v.13(2018) 0 3,000,000XS0794901727 6.125 % Bahrain v.12(2022) 0 5,000,000USN1384FAB15 5.350 % Bharti Airtel International Reg.S. v.14(2024) 2,000,000 2,000,000
The accompanying notes form an integral part of this semi-annual report.

27
SEMI-ANNUAL REPORT FOR THE PERIOD ENDED 30 JUNE 2014
Acquisitions and disposals from 1 January 2014 to 30 June 2014
Purchases and sales of securities, promissory note loans and derivatives executed during the period under review, including changes excluding capital movements to the extent not reported in the statement of net assets.
ISIN Securities Acquisitions Disposals
USD (continued)
USU0925QAA95 4.750 % Blackstone Holdings Finance LLC v.12(2023) 0 1,000,000XS0925008533 4.375 % BOC Aviation Pte. Ltd. EMTN v.13(2023) 0 10,400,000XS0880288997 3.850 % China Railway Resources Huitung Ltd. v.13(2023) 10,000,000 20,000,000US18683KAD37 4.875 % Cliffs Natural Resources Inc. v.11(2021) 0 5,000,000USG23530AA92 3.875 % CNOOC Finance 2012 Ltd. v.12(2022) 0 1,000,000XS0928126340 3.500 % CRCC Yuxiang Ltd. v.13(2023) 0 33,000,000DE000A0LPMX0 5.125 % Depfa ACS Bank Pfe.Reg.S. v.07(2037) 10,000,000 35,000,000US25155FAB22 5.000 % Dte. Annington Finance BV S.144A v.13(2023) 0 4,000,000XS1071551474 6.250 % Dte. Bank AG Reg.S. Fix-to-Float Perp. 5,000,000 5,000,000US428236BV43 4.650 % Hewlett-Packard Co. v.11(2021) 0 30,100,000US44106MAS17 4.650 % Hospitality Properties Trust v.14(2024) 800,000 800,000USG4690AAB38 3.250 % Hutchison Whampoa International (12) Ltd. v.12(2022) 0 1,000,000USL5140PAC51 8.125 % Intelsat Luxembourg S.A. Reg.S. v.13(2023) 1,000,000 5,000,000USP58072AG71 4.375 % Inversiones CMPC S.A. Reg.S. v.13(2023) 0 12,000,000XS1064674127 4.700 % Lenovo Group Ltd. v.14(2019) 10,000,000 10,000,000US529772AF23 5.125 % Lexmark International Inc. v.13(2020) 0 20,050,000XS0841191991 4.250 % LS Finance Ltd. v.12(2022) 2,000,000 10,000,000XS0906440333 3.625 % Noble Group Ltd. Reg.S. v.13(2018) 0 15,000,000USY72596BT83 5.875 % Reliance Industries Ltd. Perp. 0 7,000,000NO0010589492 6.500 % SeaDrill Ltd. v.10(2015) 0 7,200,000USG8200QAB26 4.375 % Sinopec Group Overseas Development (2013) Ltd. Reg.S.
v.13(2023)20,000,000 35,000,000
XS0969864916 5.200 % Standard Chartered Reg.S. v.13(2024) 0 20,000,000XS0874014722 3.950 % Standard Chartered Bank Plc. v.13(2023) 200,000 40,200,000XS0903465127 4.750 % State Oil Company of the Azerbaijan Republic EMTN v.13(2023) 2,000,000 15,000,000USJ77549AA18 6.500 % Sumitomo Life Insurance Reg.S. FRN v.13(2073) 0 12,000,000US88732JAX63 4.125 % Time Warner Cable Inc. DL-Notes v.10(2021) 0 60,200,000US900123CF53 5.750 % Turkey v.14(2024) 10,000,000 10,000,000US91911TAM53 4.375 % Vale Overseas Ltd. v.12(2022) 0 30,000,000US92343VBR42 5.150 % Verizon Communications Inc. v.13(2023) 0 21,200,000
Securities admitted to or included in organised markets
EUR
XS0911388675 6.000 % Achmea BV EMTN Fix-to-Float v.13(2043) 0 20,000,000DE0001141570 2.250 % Bundesrepublik Deutschland S.157 v.10(2015) 100,000,000 153,000,000DE0001137370 0.250 % Bundesrepublik Deutschland v.12(2014) 0 50,000,000DE000A0BCLA9 4.875 % Depfa ACS Bank EMTN v.04(2019) 250,000 20,000,000DE000A1KQ1N3 5.875 % DIC Asset AG v.11(2016) 0 5,620,000XS0881803646 7.000 % Eurofins Scientific FRN Perp. 0 10,000,000XS0906420574 6.625 % Fiat Finance & Trade Ltd. v.13(2018) 0 10,000,000DE000A1TM5X8 3.875 % HOCHTIEF AG v.13(2020) 0 30,000,000
GBP
XS1014987355 6.625 % ENEL S.p.A. Reg.S. v.14(2076) 10,000,000 10,000,000
USD
US008252AM02 4.250 % Affiliated Managers Group Inc. v.14(2024) 2,000,000 2,000,000US03027XAD21 5.000 % American Tower Corporation v.13(2024) 10,000,000 30,000,000US054303AX02 4.600 % Avon Products Inc. v.13(2020) 0 7,000,000US06053FAA75 4.100 % Bank of America Corporation Reg.S. v.13(2023) 0 1,000,000US06051GFF19 4.000 % Bank of America Corporation v.14(2024) 4,000,000 4,000,000US12673PAE51 4.500 % CA Inc. v.13(2023) 0 14,000,000USU12700AA58 3.875 % Carlyle Holdings Finance LLC v.13(2023) 0 20,000,000
The accompanying notes form an integral part of this semi-annual report.
28
SEMI-ANNUAL REPORT FOR THE PERIOD ENDED 30 JUNE 2014
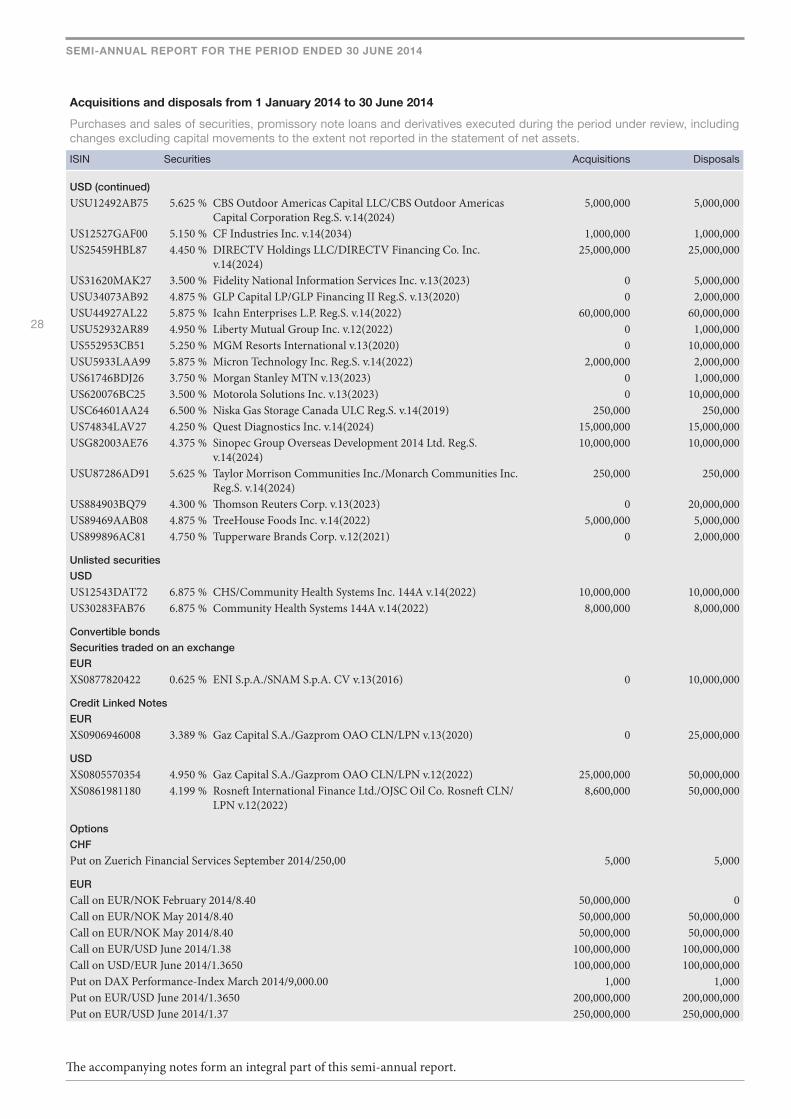
Acquisitions and disposals from 1 January 2014 to 30 June 2014
Purchases and sales of securities, promissory note loans and derivatives executed during the period under review, including changes excluding capital movements to the extent not reported in the statement of net assets.
ISIN Securities Acquisitions Disposals
USD (continued)
USU12492AB75 5.625 % CBS Outdoor Americas Capital LLC/CBS Outdoor Americas Capital Corporation Reg.S. v.14(2024)
5,000,000 5,000,000
US12527GAF00 5.150 % CF Industries Inc. v.14(2034) 1,000,000 1,000,000US25459HBL87 4.450 % DIRECTV Holdings LLC/DIRECTV Financing Co. Inc.
v.14(2024)25,000,000 25,000,000
US31620MAK27 3.500 % Fidelity National Information Services Inc. v.13(2023) 0 5,000,000USU34073AB92 4.875 % GLP Capital LP/GLP Financing II Reg.S. v.13(2020) 0 2,000,000USU44927AL22 5.875 % Icahn Enterprises L.P. Reg.S. v.14(2022) 60,000,000 60,000,000USU52932AR89 4.950 % Liberty Mutual Group Inc. v.12(2022) 0 1,000,000US552953CB51 5.250 % MGM Resorts International v.13(2020) 0 10,000,000USU5933LAA99 5.875 % Micron Technology Inc. Reg.S. v.14(2022) 2,000,000 2,000,000US61746BDJ26 3.750 % Morgan Stanley MTN v.13(2023) 0 1,000,000US620076BC25 3.500 % Motorola Solutions Inc. v.13(2023) 0 10,000,000USC64601AA24 6.500 % Niska Gas Storage Canada ULC Reg.S. v.14(2019) 250,000 250,000US74834LAV27 4.250 % Quest Diagnostics Inc. v.14(2024) 15,000,000 15,000,000USG82003AE76 4.375 % Sinopec Group Overseas Development 2014 Ltd. Reg.S.
v.14(2024)10,000,000 10,000,000
USU87286AD91 5.625 % Taylor Morrison Communities Inc./Monarch Communities Inc. Reg.S. v.14(2024)
250,000 250,000
US884903BQ79 4.300 % Thomson Reuters Corp. v.13(2023) 0 20,000,000US89469AAB08 4.875 % TreeHouse Foods Inc. v.14(2022) 5,000,000 5,000,000US899896AC81 4.750 % Tupperware Brands Corp. v.12(2021) 0 2,000,000
Unlisted securities
USD
US12543DAT72 6.875 % CHS/Community Health Systems Inc. 144A v.14(2022) 10,000,000 10,000,000US30283FAB76 6.875 % Community Health Systems 144A v.14(2022) 8,000,000 8,000,000
Convertible bonds
Securities traded on an exchange
EUR
XS0877820422 0.625 % ENI S.p.A./SNAM S.p.A. CV v.13(2016) 0 10,000,000
Credit Linked Notes
EUR
XS0906946008 3.389 % Gaz Capital S.A./Gazprom OAO CLN/LPN v.13(2020) 0 25,000,000
USD
XS0805570354 4.950 % Gaz Capital S.A./Gazprom OAO CLN/LPN v.12(2022) 25,000,000 50,000,000XS0861981180 4.199 % Rosneft International Finance Ltd./OJSC Oil Co. Rosneft CLN/
LPN v.12(2022)8,600,000 50,000,000
Options
CHF
Put on Zuerich Financial Services September 2014/250,00 5,000 5,000
EUR
Call on EUR/NOK February 2014/8.40 50,000,000 0Call on EUR/NOK May 2014/8.40 50,000,000 50,000,000Call on EUR/NOK May 2014/8.40 50,000,000 50,000,000Call on EUR/USD June 2014/1.38 100,000,000 100,000,000Call on USD/EUR June 2014/1.3650 100,000,000 100,000,000Put on DAX Performance-Index March 2014/9,000.00 1,000 1,000Put on EUR/USD June 2014/1.3650 200,000,000 200,000,000Put on EUR/USD June 2014/1.37 250,000,000 250,000,000
The accompanying notes form an integral part of this semi-annual report.
29
SEMI-ANNUAL REPORT FOR THE PERIOD ENDED 30 JUNE 2014
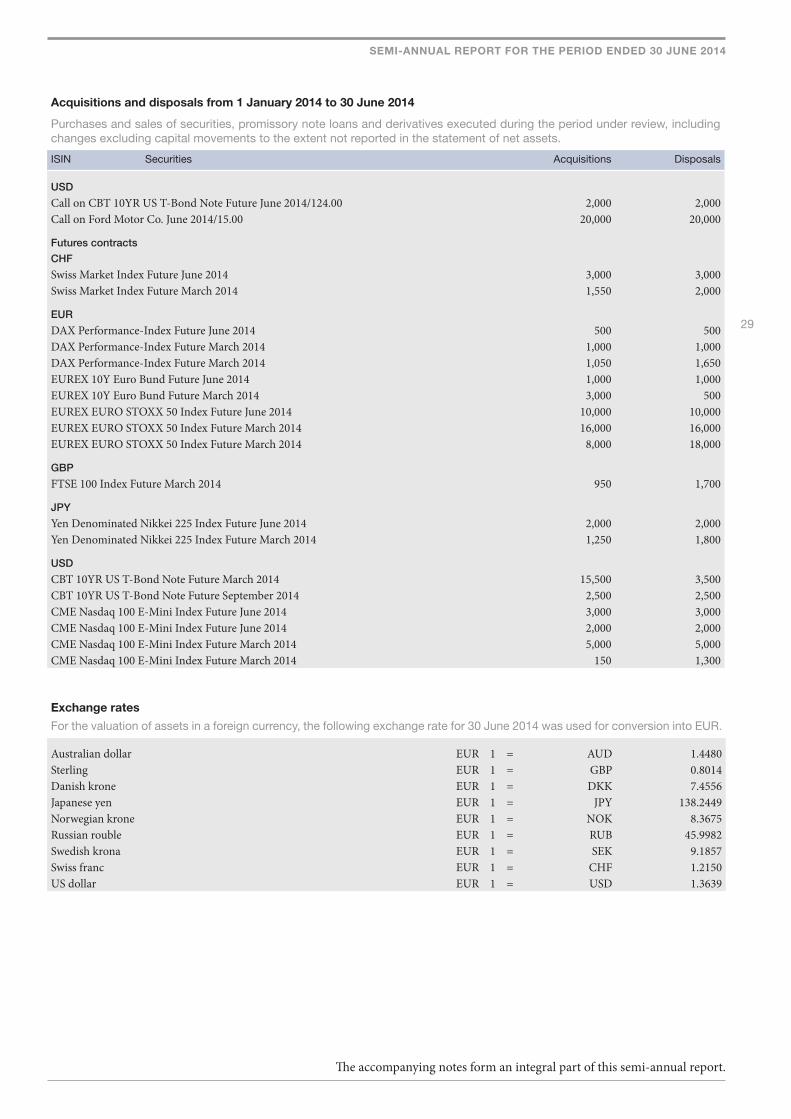
Acquisitions and disposals from 1 January 2014 to 30 June 2014
Purchases and sales of securities, promissory note loans and derivatives executed during the period under review, including changes excluding capital movements to the extent not reported in the statement of net assets.
ISIN Securities Acquisitions Disposals
USD
Call on CBT 10YR US T-Bond Note Future June 2014/124.00 2,000 2,000Call on Ford Motor Co. June 2014/15.00 20,000 20,000
Futures contracts
CHF
Swiss Market Index Future June 2014 3,000 3,000Swiss Market Index Future March 2014 1,550 2,000
EUR
DAX Performance-Index Future June 2014 500 500DAX Performance-Index Future March 2014 1,000 1,000DAX Performance-Index Future March 2014 1,050 1,650EUREX 10Y Euro Bund Future June 2014 1,000 1,000EUREX 10Y Euro Bund Future March 2014 3,000 500EUREX EURO STOXX 50 Index Future June 2014 10,000 10,000EUREX EURO STOXX 50 Index Future March 2014 16,000 16,000EUREX EURO STOXX 50 Index Future March 2014 8,000 18,000
GBP
FTSE 100 Index Future March 2014 950 1,700
JPY
Yen Denominated Nikkei 225 Index Future June 2014 2,000 2,000Yen Denominated Nikkei 225 Index Future March 2014 1,250 1,800
USD
CBT 10YR US T-Bond Note Future March 2014 15,500 3,500CBT 10YR US T-Bond Note Future September 2014 2,500 2,500CME Nasdaq 100 E-Mini Index Future June 2014 3,000 3,000CME Nasdaq 100 E-Mini Index Future June 2014 2,000 2,000CME Nasdaq 100 E-Mini Index Future March 2014 5,000 5,000CME Nasdaq 100 E-Mini Index Future March 2014 150 1,300
Exchange rates
For the valuation of assets in a foreign currency, the following exchange rate for 30 June 2014 was used for conversion into EUR.
Australian dollar EUR 1 = AUD 1.4480Sterling EUR 1 = GBP 0.8014Danish krone EUR 1 = DKK 7.4556Japanese yen EUR 1 = JPY 138.2449Norwegian krone EUR 1 = NOK 8.3675Russian rouble EUR 1 = RUB 45.9982Swedish krona EUR 1 = SEK 9.1857Swiss franc EUR 1 = CHF 1.2150US dollar EUR 1 = USD 1.3639
The accompanying notes form an integral part of this semi-annual report.
30
SEMI-ANNUAL REPORT FOR THE PERIOD ENDED 30 JUNE 2014
Notes to the semi-annual report for the period ended 30 June 2014
1.) GeneralThe "Ethna-AKTIV E" investment fund is managed by ETHENEA Independent Investors S.A. pursuant to the fund's management regulations. The management regulations first came into force on 28 January 2002.
They were filed with the Luxembourg Trade and Companies Register with a reference to this filing published in Mémorial, Recueil des Sociétés et Associations, Official Gazette of the Grand Duchy of Luxembourg ("Mémorial"), on 2 March 2002. The management regulations were last amended on 1 April 2014, and a reference to this filing with the Trade and Companies Register in Luxembourg was published in the Mémorial on 15 April 2014.
The Ethna-AKTIV E is a Luxembourg investment fund (Fonds Commun de Placement), which was set up in the form of a mono fund for an indefinite period in accordance with Part I of the Luxembourg law of 17 December 2010 on Undertakings for Collective Investment (hereinafter "the law of 17 December 2010").
The management company of the fund is ETHENEA Independent Investors S.A. ("management company"), a public limited liability company incorporated under the laws of the Grand Duchy of Luxembourg with its registered office at 9a, Rue Gabriel Lippmann, L-5365 Munsbach. The company was founded on 10 September 2010 for an indefinite period. Its Articles of Association were published on 15 September 2010 in the Mémorial. Amendments to the management company's Articles of Association entered into force on 1 October 2011 and were published in the Mémorial on 21 October 2011. The management company is registered with the Luxembourg Trade and Companies Register under the registration number R.C.S. Luxembourg B-155427.
Unit classes (R-A) and (R-T) are intended exclusively for distribution in Italy, France and Spain.
2.) Main accounting and valuation principlesThis report is being prepared under the responsibility of the Board of Directors of the management company in accordance with the statutory provisions and regulations on the preparation and presentation of reports applicable in Luxembourg.
1. The fund's net assets are stated in euros (EUR) ("reference currency").
2. The value of a fund unit ("unit value") is stated in the currency ("fund currency") as specified in the annex to the Sales Prospectus unless a currency other than the fund currency is specified for any other unit classes in the annex to the Prospectus ("unit class currency").
3. The unit value is calculated by the management company or by an agent commissioned by it under the supervision of the custodian bank on every day that is a banking day in Luxembourg with the exception of 24 and 31 December of each year ("valuation day") and is rounded to two decimal places. The management company may make different arrangements for the fund, while taking into account that the unit value must be calculated at least twice a month.
However, the management company may decide to determine the unit value on 24 and 31 December of any given year without reference to a calculation of the unit value on a valuation day as specified in sentence 1 above of this point 3. As a consequence, investors shall not be entitled to demand the issue, redemption and/or exchange of units on the basis of a unit value calculated on 24 and/or 31 December in any year.
4. To calculate the unit value, the value of the assets in the fund less any fund liabilities ("net fund assets") is calculated on each valuation day, divided by the number of fund units in circulation on the valuation day.
Trust in the power of experience.For balanced investments.
31
SEMI-ANNUAL REPORT FOR THE PERIOD ENDED 30 JUNE 2014
5. To the extent that information regarding the position of the fund assets as a whole needs to be provided in annual reports, semi-annual reports or other financial statistics in accordance with legal requirements or the rules in these fund management regulations, the fund assets are translated into the reference currency. Net fund assets are calculated in accordance with the following principles:
a) Securities, money market instruments, derivative financial instruments (derivatives) and other assets which are officially listed on a stock exchange are valued at the last available price of the trading day preceding the valuation day which ensures a reliable valuation. Where securities, money market instruments, derivative financial instruments (derivatives) and other assets are officially listed on several stock exchanges, the exchange with the highest liquidity is used.
b) Securities, money market instruments, derivative financial instruments (derivatives) and other assets not officially listed on a stock exchange (or whose exchange prices are not considered representative because of a lack of liquidity, for example) but which are traded on a regulated market are valued at a price that may be no lower than the bid price and no higher than the offer price of the trading day preceding the valuation day and that the management company considers to be the best possible price at which the securities, money market instruments, derivative financial instruments (derivatives) and other assets may be sold.
c) OTC derivatives are valued on a daily basis using a verifiable method to be specified by the management company.
d) Units of UCITS or UCIs shall be valued at the last redemption price determined before the valuation day, or at the last available price which ensures a reliable valuation. If redemption has been suspended for investment fund units or a redemption price has not been specified, these units are valued in the same way as all other assets at the relevant market value as determined by the management company in good faith using generally accepted and verifiable valuation rules.
e) If prices are not in line with the market and if no prices have been specified for financial instruments other than those under a) and d), these financial instruments and any of the other legally permissible assets are valued at the relevant market value as determined by the management company in good faith on the basis of generally accepted and verifiable valuation rules (e.g. suitable valuation models, taking into account current market conditions).
f) Liquid assets are valued at face value plus interest.
g) Receivables, such as deferred interest and liabilities, are generally valued at their nominal value.
h) The market value of securities, money market instruments, derivative financial instruments (derivatives) and other assets that are denominated in a currency other than the fund currency is converted into the relevant fund currency on the basis of the exchange rate determined at the WM/Reuters fixing at 5:00 p.m. (4:00 p.m. London time) on the trading day preceding the valuation day. Gains and losses on foreign exchange transactions will be added or deducted as appropriate.
Net fund assets are reduced by any distributions paid to investors in the fund.
6. The unit value is calculated in accordance with the aforementioned criteria. However, if unit classes have been created within the fund, the unit value is calculated in accordance with the aforementioned criteria separately for each unit class.
For accounting reasons, the tables published in this report may contain rounding discrepancies of +/ - one unit (currency, percent, etc.).
3.) TaxationTaxation of the fundThe fund assets are subject to a tax in the Grand Duchy of Luxembourg, the so-called “taxe d’abonnement”, currently of 0.05% p.a. This “taxe d’abonnement” is payable quarterly on the fund’s net assets reported at the end of each quarter. The rate of the “taxe d’abonnement” for the fund or unit classes is mentioned in the annex to the Prospectus. If the fund assets are invested in other Luxembourg investment funds that are already subject to the taxe d’abonnement, the tax is waived for the portion of the fund assets invested in those Luxembourg investment funds. The fund's income from the investment of fund assets is not taxed in the Grand Duchy of Luxembourg. However, this income may be subject to withholding tax in the countries in which the fund assets are invested. In such cases, neither the custodian bank nor the management company is required to collect tax certificates.
Taxation on income from investment fund units for the investorImplementing Directive 2003/48/EC on the taxation of interest income (“Directive”), the Grand Duchy of Luxembourg has levied a withholding tax since 1 July 2005. This withholding tax applies to certain interest income paid in Luxembourg to natural persons that are tax residents in another member state. Under certain conditions, this withholding tax may also apply to the interest income of an investment fund. By adopting the Directive, the EU member states agreed that all interest payments should be taxed in accordance with the regulations of the country of residence. To that end, an automatic exchange of information was agreed among the national tax authorities. An exception was agreed to the effect that Luxembourg would not participate for a transitional period in the automatic exchange of information agreed by the other states. Instead, a withholding tax on interest income was introduced in Luxembourg. The rate of this withholding tax is 35% of the interest payment. It is transferred anonymously to the Luxembourg tax authorities and the investor is issued a certificate in this regard. With this certificate, the withholding tax paid is fully deductible from the taxpayer’s tax liability in his country of residence. By granting power of attorney to allow voluntary participation in the exchange of information between tax authorities or by submitting a "certificate to enable exemption from the deduction of withholding tax" issued by the tax authorities in the country of residence, the deduction of withholding tax can be avoided.
Trust in the power of experience.For balanced investments.
32
SEMI-ANNUAL REPORT FOR THE PERIOD ENDED 30 JUNE 2014
Prospective investors should ensure they are informed about laws and regulations which apply to the purchase, ownership and redemption of units and obtain advice if necessary.
4.) Appropriation of incomeIncome from unit class (T), unit class (R-T), unit class (CHF-T), unit class (SIA-T) and unit class (USD-T) is reinvested. The income of share class (A), share class (R-A), share class (CHF-A) and share class (SIA-A) is distributed. Distribution takes place at the intervals determined from time to time by the management company. Further details on the use of income are provided in the Sales Prospectus.Unit class (R-A)Regardless of the income and the performance, a fixed amount of 3% of the net asset value of unit class R-A at the end of the financial year is distributed, provided that the total net fund assets do not fall below the minimum threshold of EUR 1,250,000.00 This fixed distribution will take place for the first time in 2015 for the 2014 financial year.
5.) Information relating to charges and expenditureInformation on management and custodian fees and charges may be found in the current Sales Prospectus.
6.) Income equalisationAn income equalisation amount and expense equalisation amount are set against ordinary income and expense. This covers net income arising during the period under review which the purchaser of units pays for as part of the issue price and the seller of units receives as part of the redemption price.
7.) Information for Swiss investors
a.) Securities numbers:Ethna-AKTIV E unit class (A) securities no. 1379668Ethna-AKTIV E unit class (T) securities no. 10383972Ethna-AKTIV E unit class (CHF-A) securities no. 13683768Ethna-AKTIV E unit class (CHF-T) securities no. 13684372Ethna-AKTIV E unit class (SIA-A) securities no. 19770878Ethna-AKTIV E unit class (SIA-T) securities no. 19770870Ethna-AKTIV E unit class (USD-T) securities no. 22829774
b.) Total expense ratio (TER) as per the Swiss Funds & Asset Management Association (SFAMA) guidelines of 16 May 2008.Commissions and costs incurred in the management of the collective investment scheme must be disclosed using the internationally recognised measure known as the "Total Expense Ratio (TER)". This figure expresses the total of those commissions and costs which are incurred by the assets of the collective investment scheme on an ongoing basis (operating expense) retrospectively as a percentage of net assets and is to be calculated using the following formula:
Total operating expense in UA*TER % = ------------------------------------------------------------------------------- x 100 Average net assets in UA*
* UA = Units in the currency of account of the collective investment scheme

33
SEMI-ANNUAL REPORT FOR THE PERIOD ENDED 30 JUNE 2014
For newly established funds, the TER is to be calculated for the first time using the statement of operations published in the first annual or semi-annual report. Operating expense may be converted to a 12-month period. The median of month-end values over the period under review is used to calculate the average value for fund assets.
Operating expense in n monthsAnnualised operating expense in UA* = ------------------------------------------------ x 12 N
* UA = Units in the currency of account of the collective investment scheme
As per the Swiss Funds & Asset Management Association (SFAMA) guidelines of 16 May 2008, the following TER in percent was calculated for the period 1 July 2013 to 30 June 2014:
Ethna-AKTIV E Swiss TER in % Swiss performance fee in %Unit class (A) 1.84 0.09Unit class (T) 1.87 0.07Unit class (CHF-A) 1.89 0.31Unit class (CHF-T) 1.85 0.10Unit class (SIA-A) 1.03 -Unit class (SIA-T) 1.17 0.15Unit class (USD-T) * 2.43 ** -
* For the period from 28 March 2014 to 30 June 2014.** Estimated for the period from 1 July 2013 to 30 June 2014
c.) Portfolio Turnover Rate (PTR) as per the Swiss Funds & Asset Management Association (SFAMA) guidelines of 16 May 2008.The Portfolio Turnover Rate (PTR) calculated as per the Swiss Funds & Asset Management Association (SFAMA) guidelines of 16 May 2008 shall be disclosed as an indicator of the relevance of the additional costs incurred by the fund as a result of buying and selling investments. (Total 1 - Total 2)PTR % = ----------------------------------------------------------------------- x 100 Average fund assets in UA*
*UA = Units in the currency of account of the collective investment scheme
Total 1 = Total securities transactions = X + Y Securities purchases in UA = X Securities sales in UA = Y Total 2 in UA = Total transactions in units of the collective investment scheme = S + TIssue of fund units in UA = SRedemption of fund units in UA = T
As per the Swiss Funds & Asset Management Association (SFAMA) guidelines of 16 May 2008, the following PTR was calculated in percent for the period 1 July 2013 to 30 June 2014: Ethna-AKTIV E: 221.65 %
d.) Information for investorsPayments may be made from the fund management fee to distributors and asset managers in return for distribution of the investment fund (trailer fees). Reimbursements may be granted from the management fee to institutional investors which hold the fund units for third-party beneficial owners.
e.) Amendments to the Prospectus in the financial yearPublished amendments to the Prospectus in the financial year are made available in the Swiss Official Gazette of Commerce www.shab.ch and at www.swissfunddata.ch.
SEMI-ANNUAL REPORT FOR THE PERIOD ENDED 30 JUNE 2014
34 Management company: ETHENEA Independent Investors S.A.9a, Rue Gabriel LippmannL-5365 Munsbach
Managing directors of the management company: Thomas BernardFrank HauprichJosiane Jennes
Board of Directors of the management company:
Chairman: Luca PesariniETHENEA Independent Investors S.A.
Vice chairman: Julien ZimmerDZ PRIVATBANK S.A.
Members: Thomas BernardETHENEA Independent Investors S.A.
Nikolaus RummlerIPConcept (Luxemburg) S.A.
Loris Di VoraDZ PRIVATBANK S.A.
Ulrich JuchemDZ PRIVATBANK S.A.
Arnoldo ValsangiacomoETHENEA Independent Investors S.A.
Auditor for the fund and KPMG Luxembourg S.à r.l.the management company: Cabinet de révision agréé
9, allée SchefferL-2520 Luxembourg
Administration, distribution and advisory
35
SEMI-ANNUAL REPORT FOR THE PERIOD ENDED 30 JUNE 2014
Custodian bank: DZ PRIVATBANK S.A.4, rue Thomas EdisonL-1445 Luxembourg-Strassen
Central administration, DZ PRIVATBANK S.A.registrar and transfer agent: 4, rue Thomas Edison
L-1445 Luxembourg-Strassen
Paying agent in the DZ PRIVATBANK S.A.Grand Duchy of Luxembourg: 4, rue Thomas Edison
L-1445 Luxembourg-Strassen
Information for investors in the Federal Republic of Germany:
Paying agent and information agent: DZ BANK AGDeutsche Zentral-GenossenschaftsbankFrankfurt am MainPlatz der RepublikD-60265 Frankfurt am Main
Information for investors in Austria:
Unit classes (A), (T), (SIA-A), (SIA-T), (CHF-A), (CHF-T) and (USD-T) are licensed for public distribution in the Republic of Austria.
Credit institution as defined by section 141 (1) of the Austrian Investment Fund Act (InvFG) 2011:
ERSTE BANK der oesterreichischen Sparkassen AGGraben 21A-1010 Wien
Agent from which unitholders may obtain the prescribed information pursuant to section 141 of the Austrian Investment Fund Act (InvFG) 2011:
ERSTE BANK der oesterreichischen Sparkassen AGGraben 21A-1010 Wien
Domestic tax representative as defined by section 186 (2) no. 2 of the Austrian Investment Fund Act (InvFG) 2011:
ERSTE BANK der oesterreichischen Sparkassen AGGraben 21A-1010 Wien
36
SEMI-ANNUAL REPORT FOR THE PERIOD ENDED 30 JUNE 2014
Information for investors in Switzerland:
Representative in Switzerland: IPConcept (Schweiz) AGIn Gassen 6CH-8022 Zürich
Paying agent in Switzerland: DZ PRIVATBANK (Schweiz) AGMünsterhof 12P.O. Box 2918CH-8022 Zürich
Information for investors in Belgium:
Unit class (T) is licensed for public distribution in Belgium. Units in other unit classes may not be publicly distributed to investors in Belgium.
Paying agent and distributor: CACEIS Belgium SA/NV,Avenue du Port / Havenlaan 86C b 320B-1000 Brussels
Distributor: DEUTSCHE BANK AGBrussels branch, Marnixlaan 17B-1000 Brussels
Information for investors in the Principality of Liechtenstein:
Paying agent: VOLKSBANK AGFeldkircher Strasse 2FL-9494 Schaan


ETHENEA Independent Investors S.A.9a, rue Gabriel Lippmann · 5365 Munsbach · Luxembourg
Phone +352 276 921 10 · Fax +352 276 921 [email protected] · www.ethenea.com
Prod
uctio
n: K
NEI
P (w
ww.
knei
p.co
m)