Embed Size (px)
Citation preview
Etisalat GroupCapital Markets Day 2018
February 22nd, 2018
Fairmont Bab Al-Bahar, Abu Dhabi
Disclaimer
Emirates Telecommunications Group Company PJSC and its subsidiaries and associates (“Etisalat Group” or the “Company”) have prepared this presentation (“Presentation”) in good faith, however, no warranty or representation, express or implied is made as to the adequacy, correctness, completeness or accuracy of any numbers, statements, opinions or estimates, or other information contained in this Presentation.
The information contained in this Presentation is an overview, and should not be considered as the giving of investment advice by the Company or any of its shareholders, directors, officers, agents, employees or advisers. Each party to whom this Presentation is made available must make its own independent assessment of the Company after making such investigations and taking such advice as may be deemed necessary.
Where this Presentation contains summaries of documents, those summaries should not be relied upon and the actual documentation must be referred to for its full effect.
This Presentation includes certain “forward-looking statements”. Such forward looking statements are not guarantees of future performance and involve risks of uncertainties. Actual results may differ materially from these forward looking statements.
2
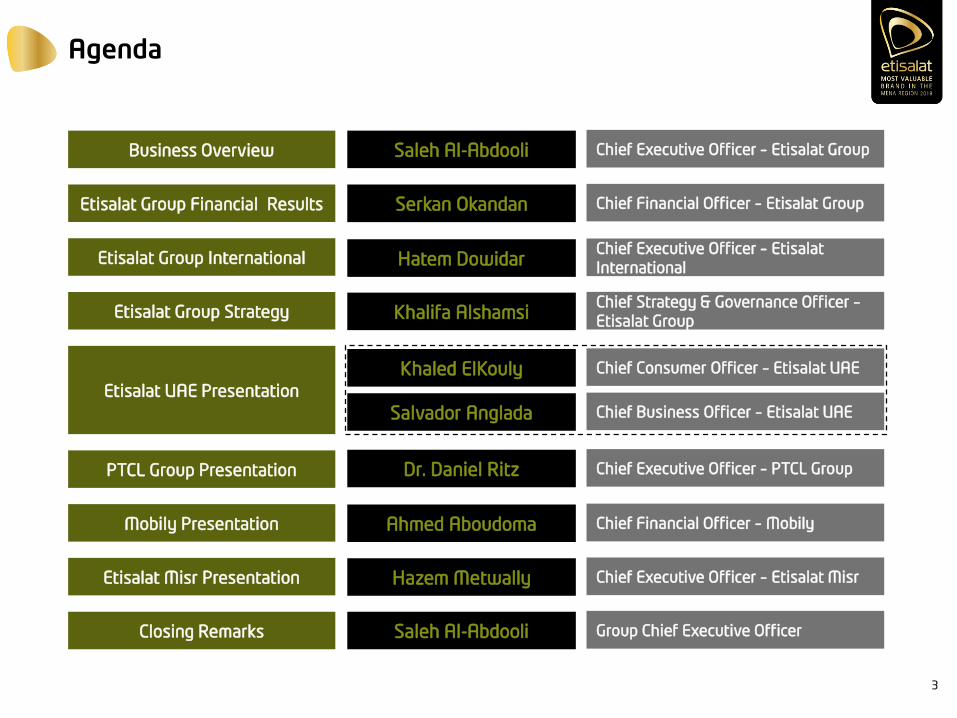
Agenda
Business Overview Saleh Al-Abdooli Chief Executive Officer – Etisalat Group
Etisalat Group Financial Results Serkan Okandan Chief Financial Officer – Etisalat Group
Etisalat Group International Hatem DowidarChief Executive Officer – Etisalat
International
Etisalat UAE Presentation
Khaled ElKouly Chief Consumer Officer – Etisalat UAE
Salvador Anglada Chief Business Officer – Etisalat UAE
PTCL Group Presentation Dr. Daniel Ritz Chief Executive Officer – PTCL Group
Mobily Presentation Ahmed Aboudoma Chief Financial Officer – Mobily
Etisalat Misr Presentation Hazem Metwally Chief Executive Officer – Etisalat Misr
Closing Remarks Saleh Al-Abdooli Group Chief Executive Officer
Etisalat Group Strategy Khalifa AlshamsiChief Strategy & Governance Officer –
Etisalat Group
3
Etisalat GroupCapital Markets Day 2018
Etisalat Group Business Overview
Saleh Al-Abdooli
Group Chief Executive Officer
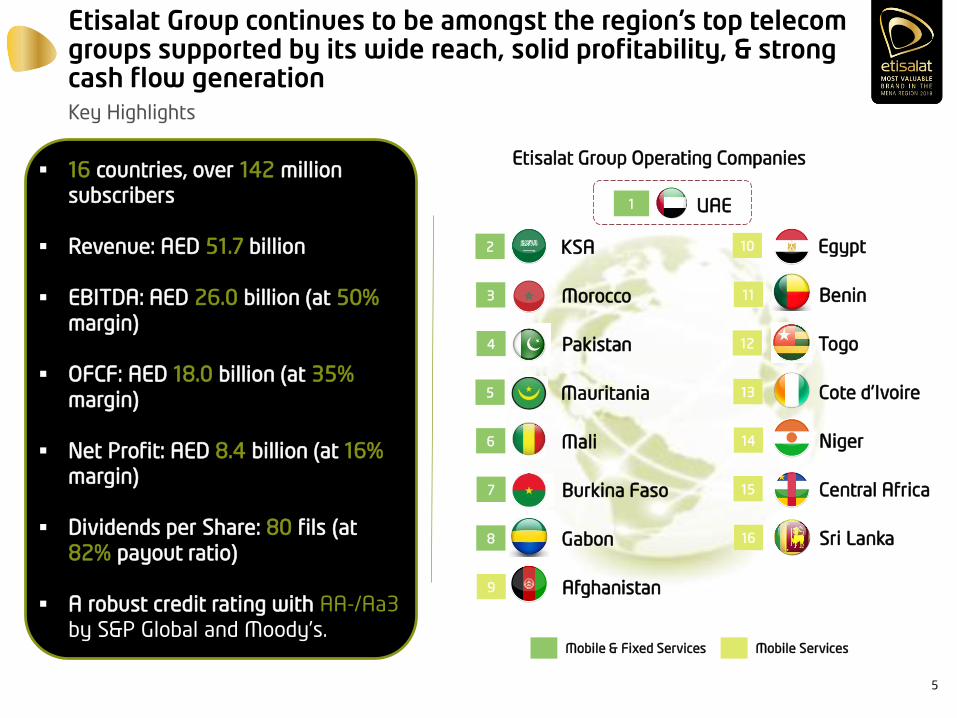
Etisalat Group continues to be amongst the region’s top telecom groups supported by its wide reach, solid profitability, & strong cash flow generationKey Highlights
Etisalat Group Operating Companies 16 countries, over 142 million
subscribers
Revenue: AED 51.7 billion
EBITDA: AED 26.0 billion (at 50%
margin)
OFCF: AED 18.0 billion (at 35%
margin)
Net Profit: AED 8.4 billion (at 16%
margin)
Dividends per Share: 80 fils (at
82% payout ratio)
A robust credit rating with AA-/Aa3
by S&P Global and Moody’s.
1
KSA2
Morocco3
Pakistan4
Mobile & Fixed Services Mobile Services
Mauritania5
Mali6
Burkina Faso7
Gabon8
Afghanistan9
Egypt10
Benin11
Togo12
Cote d’Ivoire13
Niger14
Central Africa15
Sri Lanka16
UAE
5
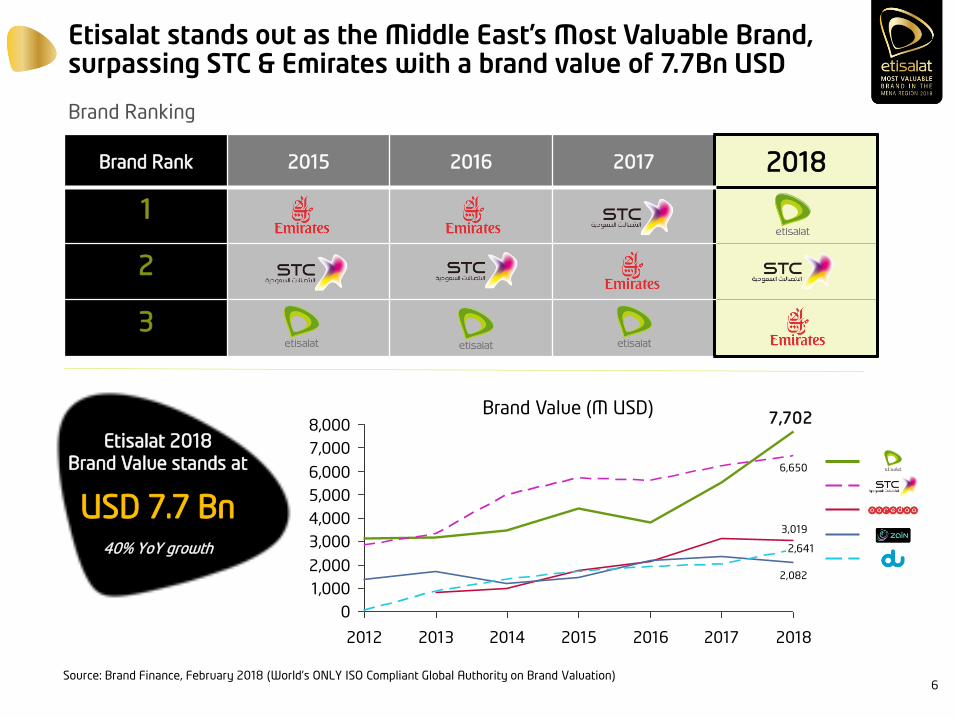
Etisalat stands out as the Middle East’s Most Valuable Brand, surpassing STC & Emirates with a brand value of 7.7Bn USD
Brand Ranking
Source: Brand Finance, February 2018 (World’s ONLY ISO Compliant Global Authority on Brand Valuation)
Brand Rank 2015 2016 2017 2018
1
2
3
Etisalat 2018
Brand Value stands at
USD 7.7 Bn40% YoY growth
7,702
6,650
3,019
2,082
0
1,000
2,000
3,000
4,000
5,000
6,000
7,000
8,000
2012 2013 2014 2015 2016 2017 2018
2,641
Etisalat
STC
Zain
du
Ooredoo
Brand Value (M USD)
6
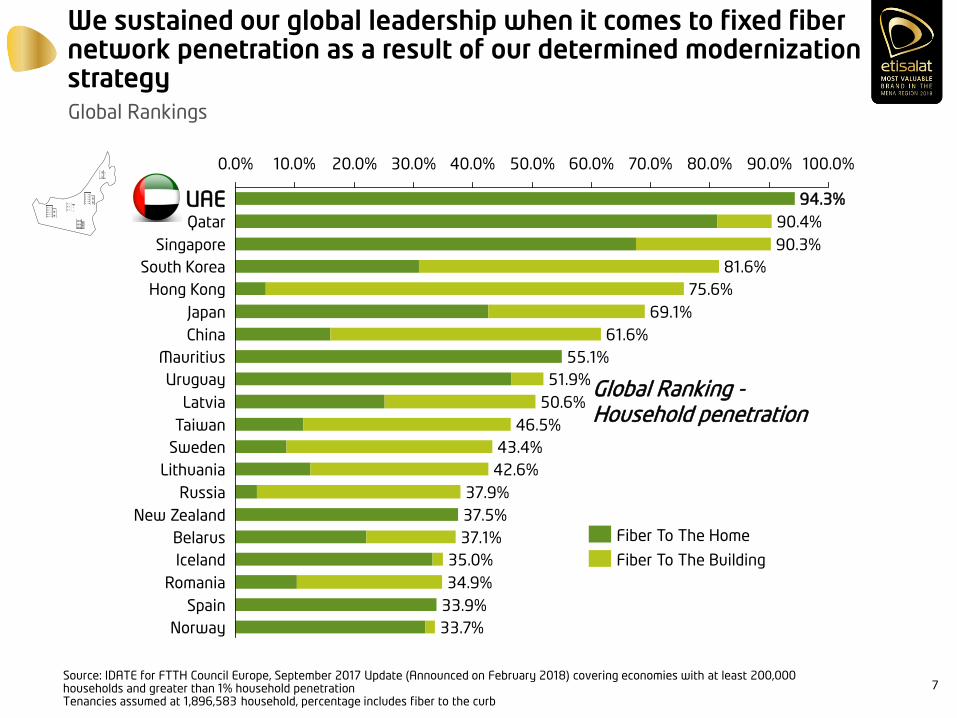
We sustained our global leadership when it comes to fixed fiber network penetration as a result of our determined modernization strategyGlobal Rankings
Source: IDATE for FTTH Council Europe, September 2017 Update (Announced on February 2018) covering economies with at least 200,000 households and greater than 1% household penetrationTenancies assumed at 1,896,583 household, percentage includes fiber to the curb
92.9%
30.0% 80.0%50.0%10.0% 100.0%70.0%60.0%40.0%20.0% 90.0%0.0%
51.9%
South Korea 81.6%
China 61.6%
Japan 69.1%
Hong Kong 75.6%
Lithuania 42.6%
Sweden 43.4%
94.3%
37.9%
55.1%
Belarus 37.1%
New Zealand 37.5%
Mauritius
Russia
Qatar 90.4%
UAE
Taiwan 46.5%
Latvia 50.6%
Spain 33.9%
Romania
Singapore 90.3%
34.9%
Iceland 35.0%
Uruguay
Norway 33.7%
Fiber To The Building
Fiber To The Home
Global Ranking -Household penetration
7
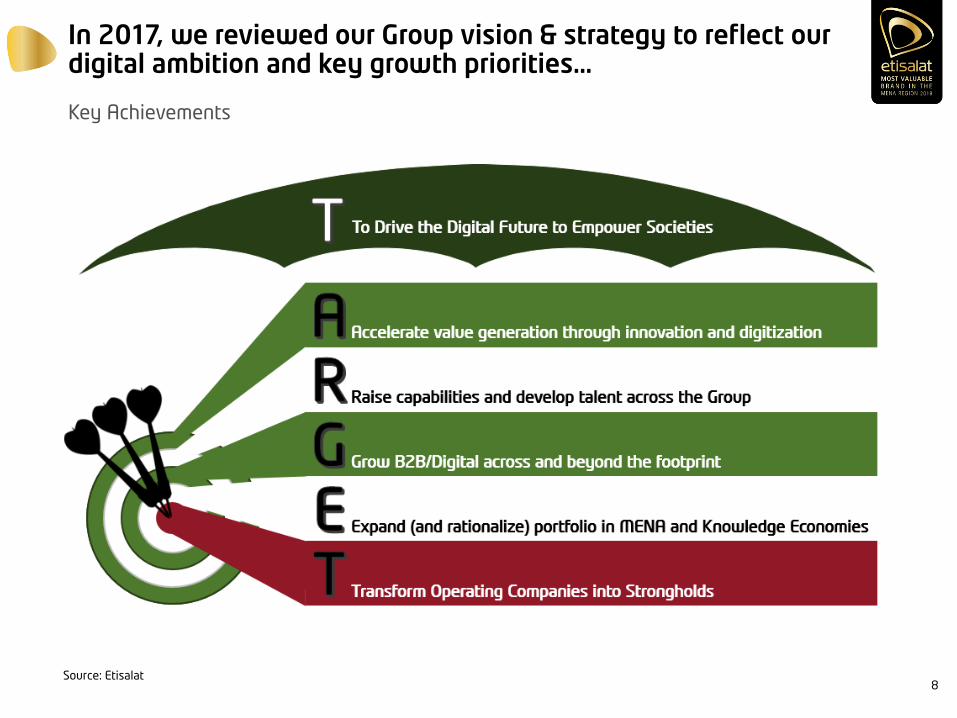
In 2017, we reviewed our Group vision & strategy to reflect our digital ambition and key growth priorities…
Key Achievements
Source: Etisalat8
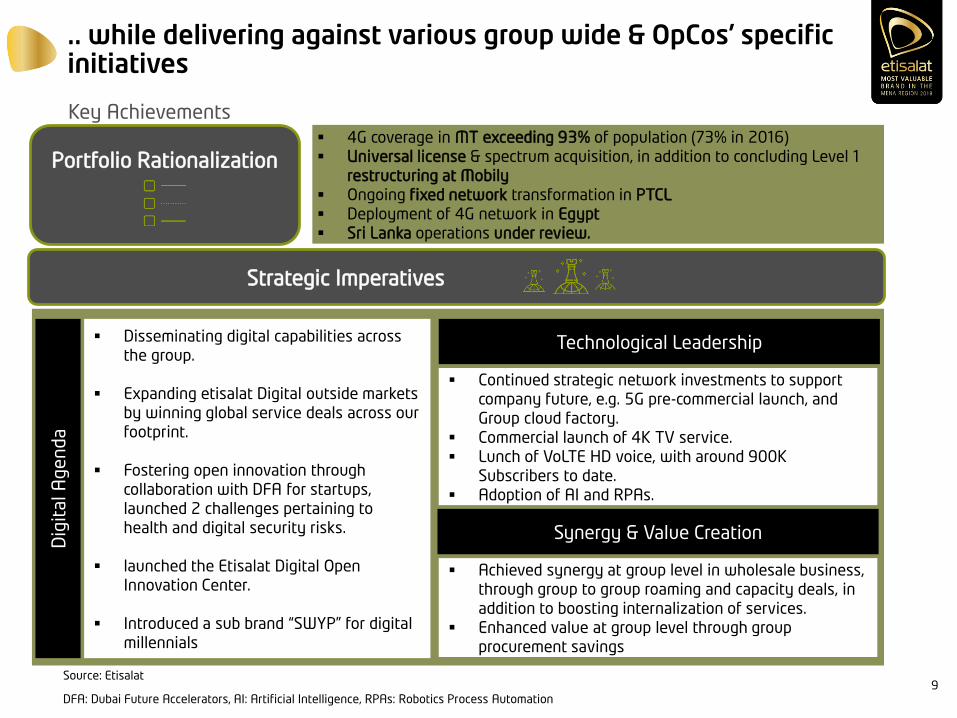
.. while delivering against various group wide & OpCos’ specific initiatives
Key Achievements
Source: Etisalat
DFA: Dubai Future Accelerators, AI: Artificial Intelligence, RPAs: Robotics Process Automation
Portfolio Rationalization 4G coverage in MT exceeding 93% of population (73% in 2016)
Universal license & spectrum acquisition, in addition to concluding Level 1
restructuring at Mobily
Ongoing fixed network transformation in PTCL
Deployment of 4G network in Egypt
Sri Lanka operations under review.
Strategic Imperatives
Disseminating digital capabilities across
the group.
Expanding etisalat Digital outside markets
by winning global service deals across our
footprint.
Fostering open innovation through
collaboration with DFA for startups,
launched 2 challenges pertaining to
health and digital security risks.
launched the Etisalat Digital Open
Innovation Center.
Introduced a sub brand “SWYP” for digital
millennials
Continued strategic network investments to support
company future, e.g. 5G pre-commercial launch, and
Group cloud factory.
Commercial launch of 4K TV service.
Lunch of VoLTE HD voice, with around 900K
Subscribers to date.
Adoption of AI and RPAs.
Dig
ital A
gen
da
Technological Leadership
Achieved synergy at group level in wholesale business,
through group to group roaming and capacity deals, in
addition to boosting internalization of services.
Enhanced value at group level through group
procurement savings
Synergy & Value Creation
9
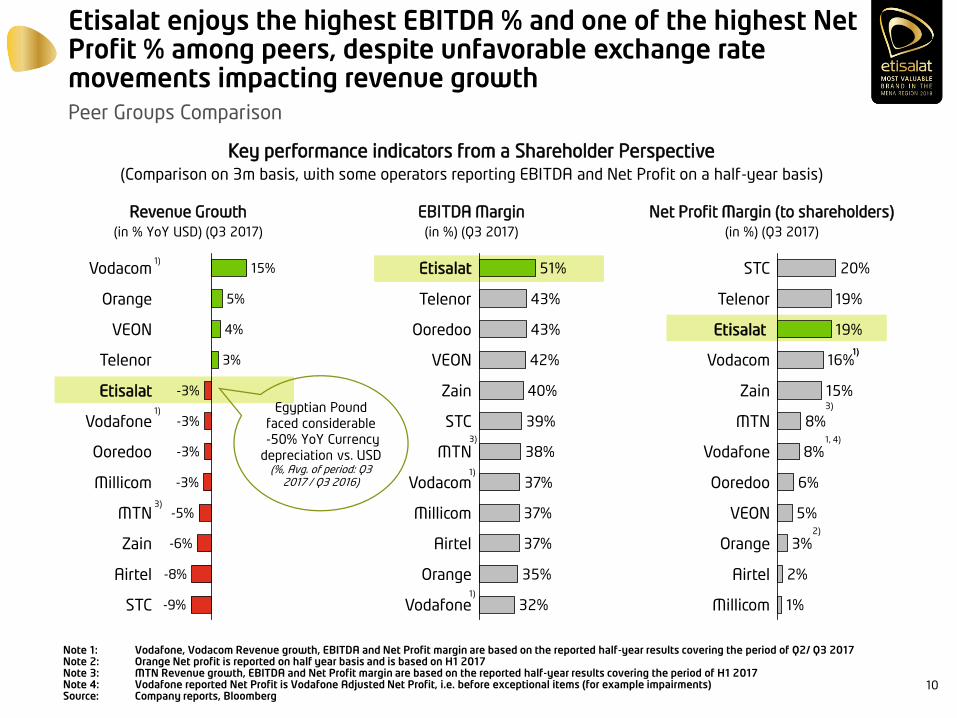
Etisalat enjoys the highest EBITDA % and one of the highest Net Profit % among peers, despite unfavorable exchange rate movements impacting revenue growthPeer Groups Comparison
Note 1: Vodafone, Vodacom Revenue growth, EBITDA and Net Profit margin are based on the reported half-year results covering the period of Q2/ Q3 2017Note 2: Orange Net profit is reported on half year basis and is based on H1 2017Note 3: MTN Revenue growth, EBITDA and Net Profit margin are based on the reported half-year results covering the period of H1 2017Note 4: Vodafone reported Net Profit is Vodafone Adjusted Net Profit, i.e. before exceptional items (for example impairments)Source: Company reports, Bloomberg
Revenue Growth
(in % YoY USD) (Q3 2017)
EBITDA Margin
(in %) (Q3 2017)
Key performance indicators from a Shareholder Perspective
(Comparison on 3m basis, with some operators reporting EBITDA and Net Profit on a half-year basis)
Net Profit Margin (to shareholders)
(in %) (Q3 2017)
STC -9%
Airtel -8%
Zain -6%
MTN -5%
Millicom -3%
Ooredoo -3%
Vodafone -3%
Etisalat -3%
Telenor 3%
VEON 4%
Orange 5%
Vodacom 15%
Telenor 43%
Etisalat 51%
Vodafone 32%
Orange 35%
Airtel 37%
Millicom 37%
Vodacom 37%
MTN 38%
STC 39%
Zain 40%
VEON 42%
Ooredoo 43%
Zain 15%
Vodacom 16%
Etisalat 19%
Telenor 19%
STC 20%
Millicom 1%
Airtel 2%
Orange 3%
VEON 5%
Ooredoo 6%
Vodafone 8%
MTN 8%1)
1)
1)
3)
1)
2)
3)
1, 4)
1)
1)
3)
Egyptian Pound
faced considerable
-50% YoY Currency
depreciation vs. USD (%, Avg. of period: Q3
2017 / Q3 2016)
10
Oil price currently high but still subject to risk
albeit countries are in the process of
diversifying their economies
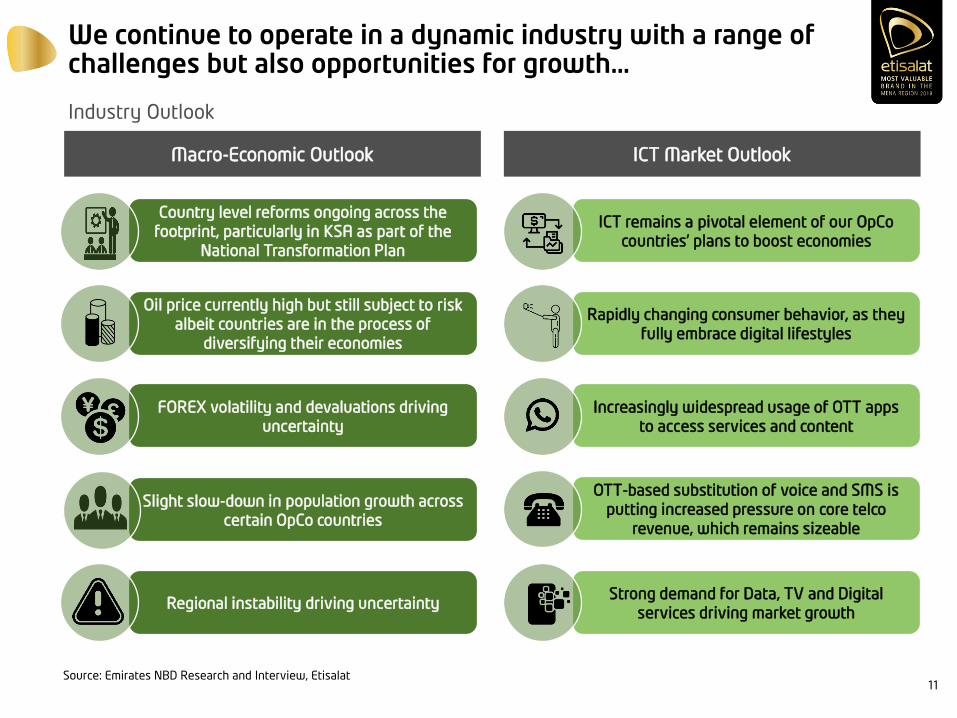
We continue to operate in a dynamic industry with a range of challenges but also opportunities for growth…
Industry Outlook
Source: Emirates NBD Research and Interview, Etisalat
Macro-Economic Outlook ICT Market Outlook
ICT remains a pivotal element of our OpCo
countries’ plans to boost economies
Country level reforms ongoing across the
footprint, particularly in KSA as part of the
National Transformation Plan
OTT-based substitution of voice and SMS is
putting increased pressure on core telco
revenue, which remains sizeable
Slight slow-down in population growth across
certain OpCo countries
Increasingly widespread usage of OTT apps
to access services and content
FOREX volatility and devaluations driving
uncertainty
Strong demand for Data, TV and Digital
services driving market growthRegional instability driving uncertainty
Rapidly changing consumer behavior, as they
fully embrace digital lifestyles
11

…fueled by new technologies and business models that are accelerating the transition into a digital future
Industry Outlook
Source: GSMA, Ovum, Analysys Mason, BMI, Huawei, EIU, Pyramid Research, IMF, IDC, Gartner, Etisalat
Selected Key Topics affecting the Telco Industry
Non-Exhaustive
Internet of
[Every]Thing
Artificial Intelligence
and Machine Learning
Cyber Security
Cloud Blockchain Entertainment
Content, and AR/VRe/m-Commerce
Big Data
Analytics
Next Generation
Connectivity
Omni-channel
Customer Experience
Robotics /
Automation
Smart Cities /
Verticals
12
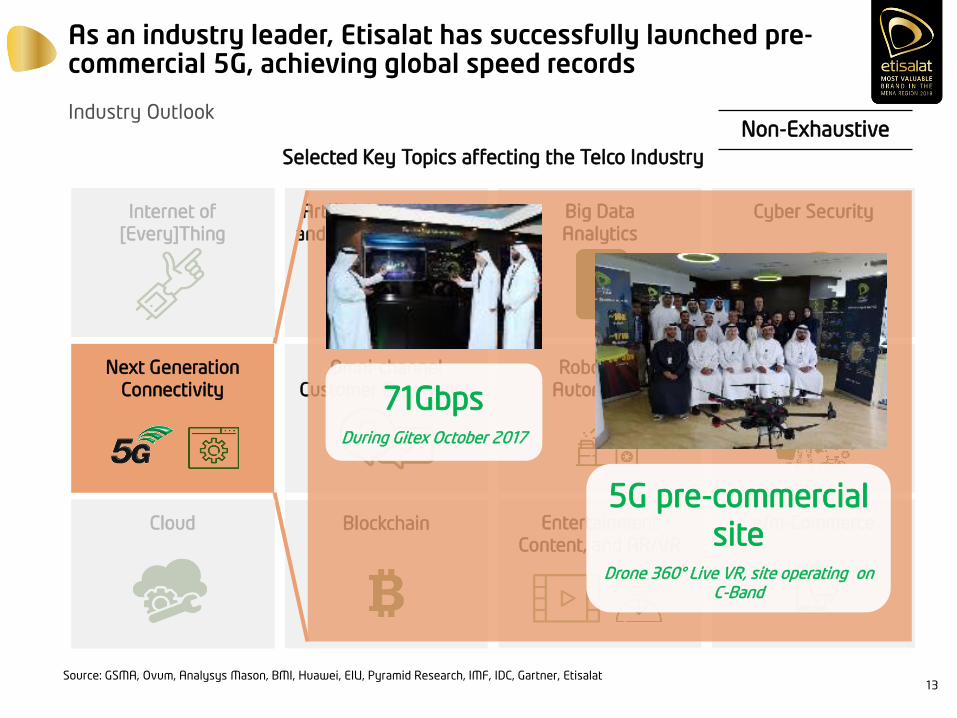
As an industry leader, Etisalat has successfully launched pre-commercial 5G, achieving global speed records
Industry Outlook
Source: GSMA, Ovum, Analysys Mason, BMI, Huawei, EIU, Pyramid Research, IMF, IDC, Gartner, Etisalat
Selected Key Topics affecting the Telco Industry
Internet of
[Every]Thing
Artificial Intelligence
and Machine Learning
Cyber Security
Cloud Blockchain Entertainment
Content, and AR/VRe/m-Commerce
Big Data
Analytics
Next Generation
Connectivity
Omni-channel
Customer Experience
Robotics /
Automation
Smart Cities /
Verticals71GbpsDuring Gitex October 2017
5G pre-commercial
siteDrone 360° Live VR, site operating on
C-Band
Non-Exhaustive
13
Non-Exhaustive
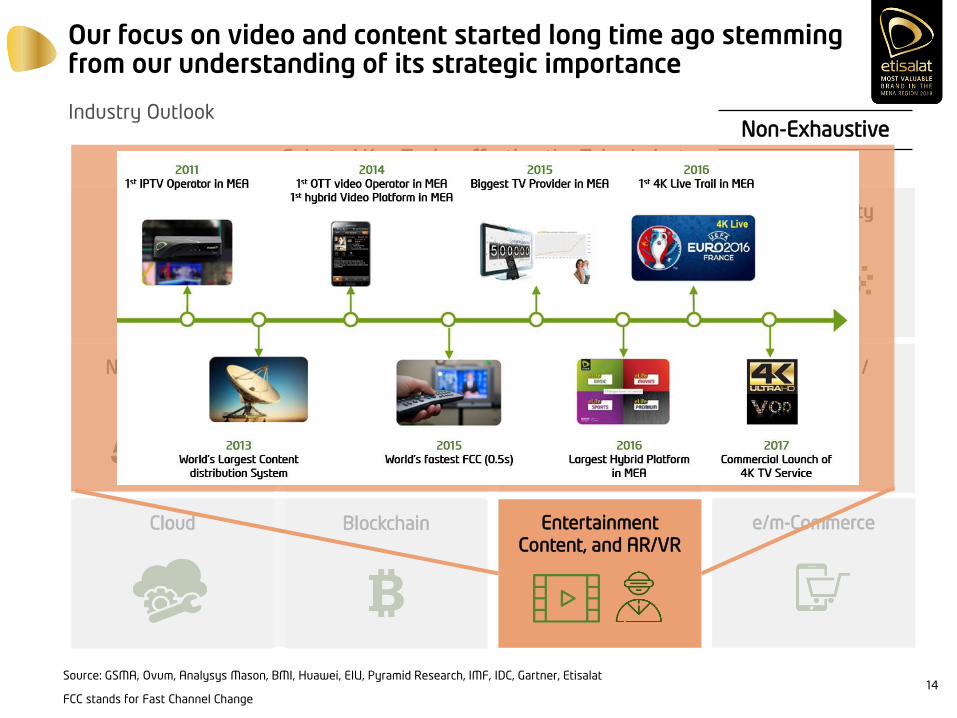
Our focus on video and content started long time ago stemming from our understanding of its strategic importance
Industry Outlook
Source: GSMA, Ovum, Analysys Mason, BMI, Huawei, EIU, Pyramid Research, IMF, IDC, Gartner, Etisalat
FCC stands for Fast Channel Change
Selected Key Topics affecting the Telco Industry
Internet of
[Every]Thing
Artificial Intelligence
and Machine Learning
Cyber Security
Cloud Blockchain Entertainment
Content, and AR/VRe/m-Commerce
Big Data
Analytics
Next Generation
Connectivity
Omni-channel
Customer Experience
Robotics /
Automation
Smart Cities /
Verticals
14
Non-Exhaustive
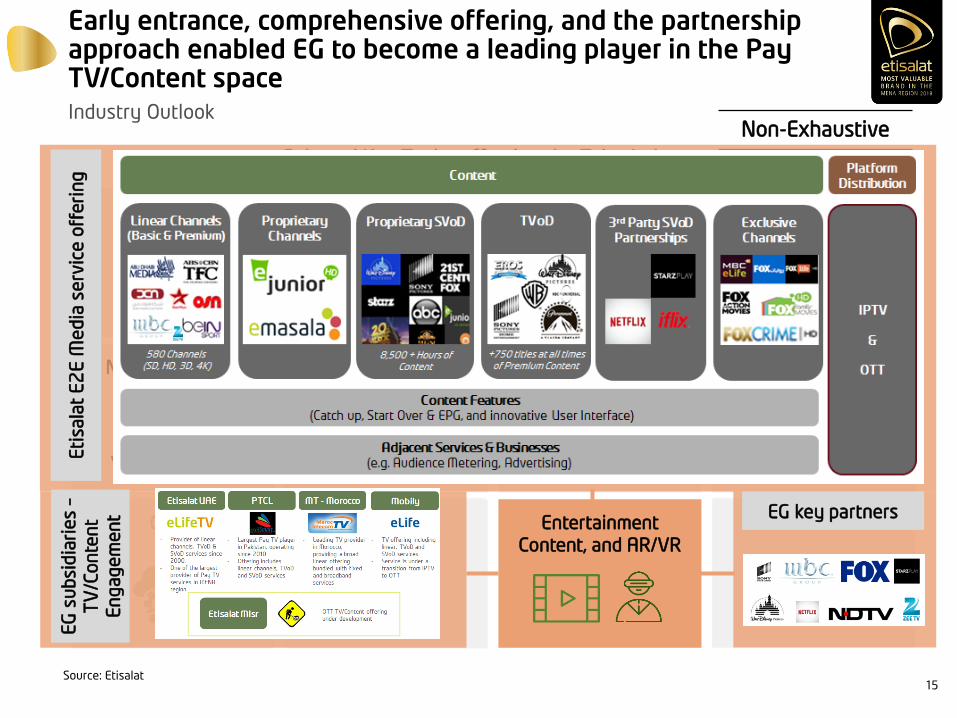
Early entrance, comprehensive offering, and the partnership approach enabled EG to become a leading player in the Pay TV/Content spaceIndustry Outlook
Source: Etisalat
Selected Key Topics affecting the Telco Industry
Internet of
[Every]Thing
Artificial Intelligence
and Machine Learning
Cyber Security
Cloud Blockchain Entertainment
Content, and AR/VRe/m-Commerce
Big Data
Analytics
Next Generation
Connectivity
Omni-channel
Customer Experience
Robotics /
Automation
Smart Cities /
Verticals
Eti
sala
t E
2E
Me
dia
se
rvic
e o
fferi
ng
EG
su
bsi
dia
rie
s –
TV
/Con
ten
t
En
gagem
en
t EG key partners
15
Non-Exhaustive
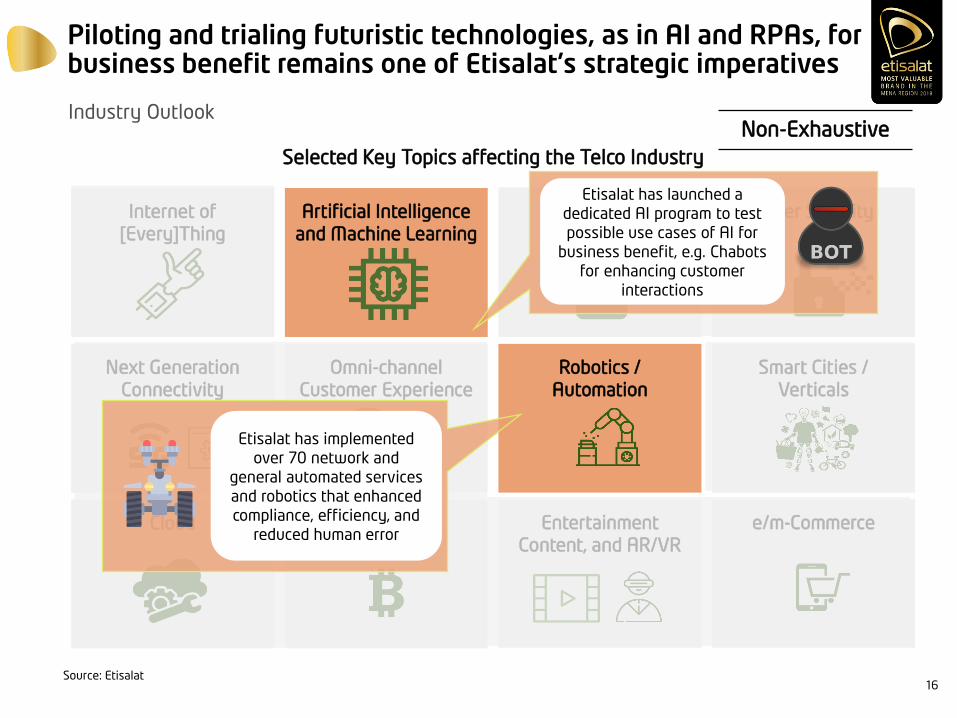
Piloting and trialing futuristic technologies, as in AI and RPAs, for business benefit remains one of Etisalat's strategic imperatives
Industry Outlook
Source: Etisalat
Selected Key Topics affecting the Telco Industry
Internet of
[Every]Thing
Artificial Intelligence
and Machine Learning
Cyber Security
Cloud Blockchain Entertainment
Content, and AR/VRe/m-Commerce
Big Data
Analytics
Next Generation
Connectivity
Omni-channel
Customer Experience
Robotics /
Automation
Smart Cities /
Verticals
Etisalat has launched a
dedicated AI program to test
possible use cases of AI for
business benefit, e.g. Chabots
for enhancing customer
interactions
Etisalat has implemented
over 70 network and
general automated services
and robotics that enhanced
compliance, efficiency, and
reduced human error
16
Moving forward, we will continue to follow a growth path while focusing on multiple business critical missions
Closing Remarks
Focusing on the implementation of our digital strategy by working closely with all OpCo’s
to realize “TARGET”.
Focusing on nurturing and institutionalizing innovation within the organization’s fabric,
while elevating the innovation level in surrounding ecosystem by adopting open
innovation.
Sustaining our technological leadership by adopting, trialing, and rolling out next
generation technologies that bring business value and enhance customer interactions.
Enhancing the bottom line through initiatives that drive group wide synergy and value
creation, operational excellence, and cost efficiency, which will support in mitigating the
currency exposures in certain markets.
Continue to invest in our brand, talent and Group Family Culture as key enablers for
company growth.
Portfolio rationalization and optimization will continue to be an area of focus, as we are
trying to enhance the relevance and fit of individual investments within the bigger
portfolio.
We will continue to pursue inorganic growth opportunities that meet our investment
criteria. 17
Etisalat GroupCapital Markets Day 2018
Group Financial Results
Serkan Okandan
Group Chief Financial Officer
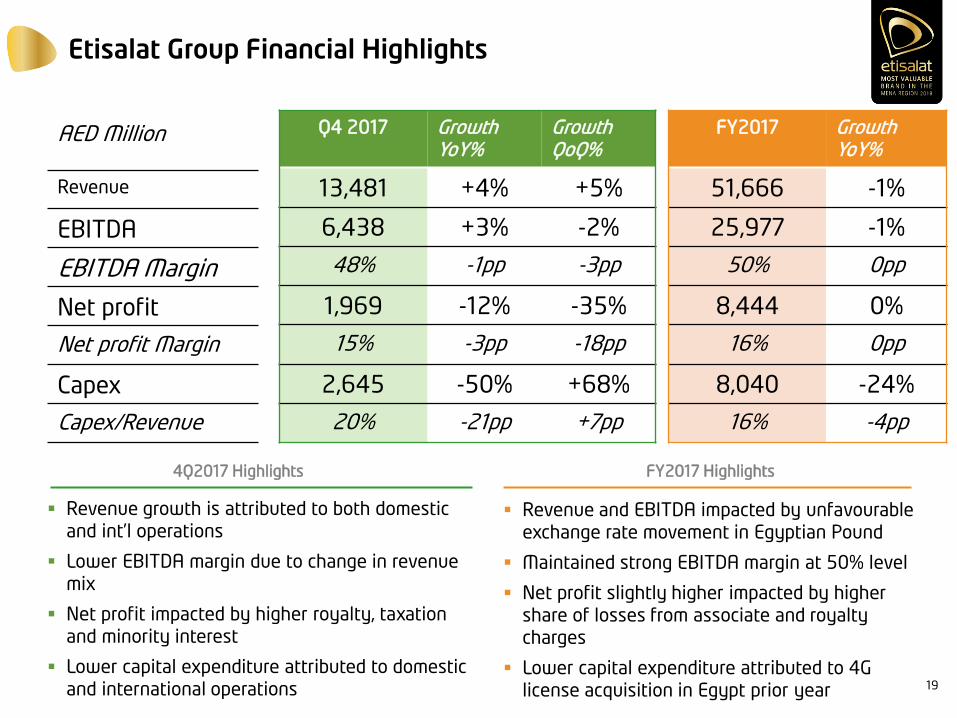
Etisalat Group Financial Highlights
AED Million
Revenue
EBITDA
EBITDA Margin
Net profit
Net profit Margin
Capex
Capex/Revenue
Q4 2017 GrowthYoY%
GrowthQoQ%
13,481 +4% +5%
6,438 +3% -2%
48% -1pp -3pp
1,969 -12% -35%
15% -3pp -18pp
2,645 -50% +68%
20% -21pp +7pp
FY2017 GrowthYoY%
51,666 -1%
25,977 -1%
50% 0pp
8,444 0%
16% 0pp
8,040 -24%
16% -4pp
Revenue growth is attributed to both domestic
and int’l operations
Lower EBITDA margin due to change in revenue
mix
Net profit impacted by higher royalty, taxation
and minority interest
Lower capital expenditure attributed to domestic
and international operations
4Q2017 Highlights
Revenue and EBITDA impacted by unfavourable
exchange rate movement in Egyptian Pound
Maintained strong EBITDA margin at 50% level
Net profit slightly higher impacted by higher
share of losses from associate and royalty
charges
Lower capital expenditure attributed to 4G
license acquisition in Egypt prior year
FY2017 Highlights
19
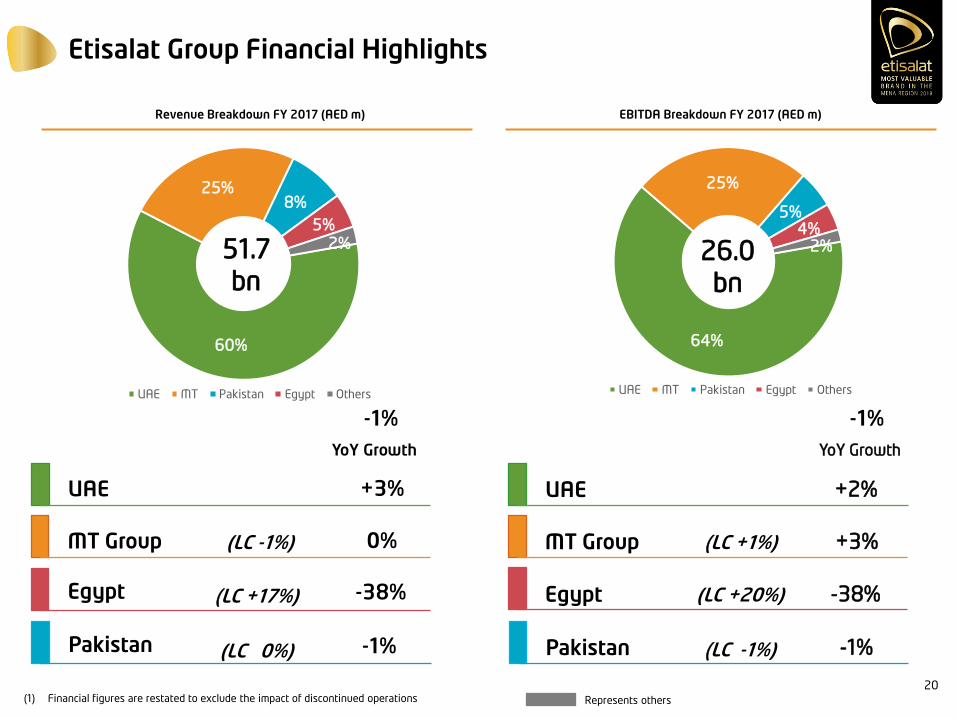
Etisalat Group Financial Highlights
60%
25%8%
5%2%
UAE MT Pakistan Egypt Others
64%
25%
5%4%
2%
UAE MT Pakistan Egypt Others
(1) Financial figures are restated to exclude the impact of discontinued operations
Revenue Breakdown FY 2017 (AED m) EBITDA Breakdown FY 2017 (AED m)
UAE +3%
MT Group 0%
Egypt -38%
Pakistan -1%
UAE +2%
MT Group +3%
Egypt -38%
Pakistan -1%
YoY Growth YoY Growth
-1% -1%
51.7
bn26.0
bn
(LC +17%)
(LC 0%)
(LC +20%)
(LC -1%)
Represents others
(LC -1%) (LC +1%)
20
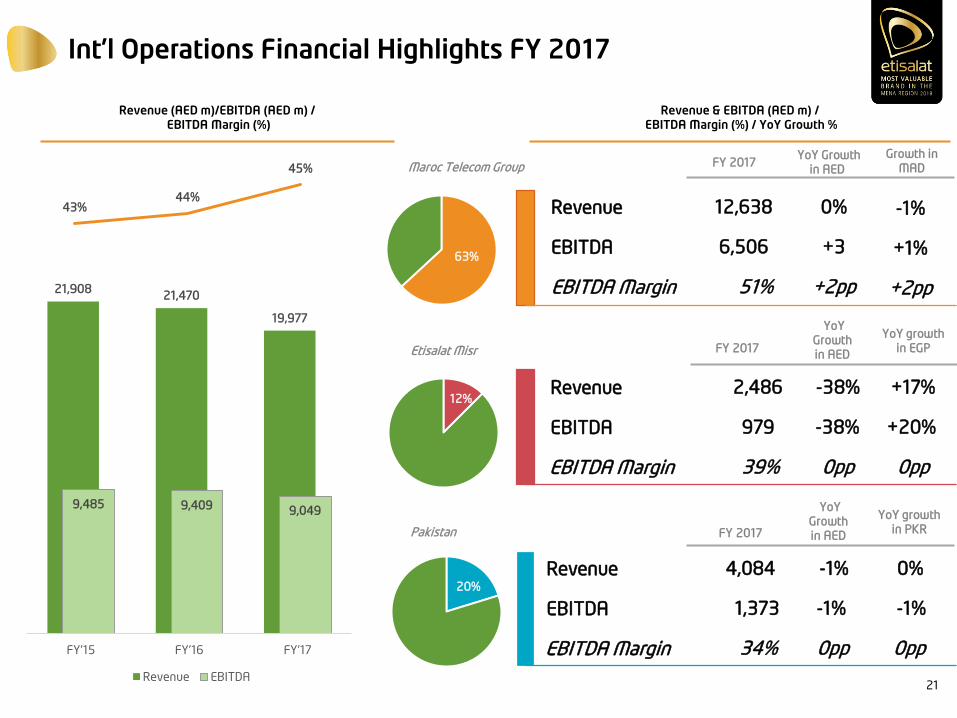
Int’l Operations Financial Highlights FY 2017
Revenue (AED m)/EBITDA (AED m) /EBITDA Margin (%)
YoY Growth
in AEDMaroc Telecom Group
Revenue 0%12,638
EBITDA +36,506
EBITDA Margin +2pp51%
Etisalat Misr
Pakistan
Revenue -1%4,084
EBITDA -1%1,373
EBITDA Margin 0pp34%
FY 2017
YoY
Growth
in AEDFY 2017
Revenue & EBITDA (AED m) /EBITDA Margin (%) / YoY Growth %
Growth in
MAD
0%
-1%
0pp
YoY growth
in PKR
Revenue -38%2,486
EBITDA -38%979
EBITDA Margin 0pp39%
YoY
Growth
in AED
+17%
+20%
0pp
YoY growth
in EGP
-1%
+1%
+2pp
FY 2017
43%44%
45%
63%
12%
20%
21,90821,470
19,977
9,485 9,409 9,049
FY'15 FY'16 FY'17
Revenue EBITDA21

Group Revenue
UAE
60%
Int'l
39%
Others
1%
In FY’17 consolidated revenue decreased Y/Y by 1% attributed
to Int’l operations that was impacted by currency depreciation
in Egypt
Growth in the UAE mainly due to higher broadband, digital
services, handsets and wholesale revenues
Revenues from international consolidated operations declined
by 7%, resulting in 39% contribution to Group revenues, 2pp
lower than prior year mainly attributed to currency
devaluation in Egypt
― Revenue growth in MT Group mainly from international
operations and domestic fixed segment
― Revenue growth in Egypt impacted by currency
devaluation
― Revenue growth in Pakistan impacted by lower
subscriber base, usage and mobile broadband
competition faced by EVO product
Domestic vs. Int’l
52,360 51,666 861 36
1,548 27 16
FY'16 UAE MT Group Egypt Pakistan Others FY'17
Highlights
Revenue (AED m) and YoY growth (%) Sources of Revenue growth – FY’17 vs FY’16 (AED m)
Revenue by Cluster (FY’17)
International
12,937 12,896 13,481
52,36051,666
3% -3%4%
2%-1%
Q4'16 Q3'17 Q4'17 FY'16 FY'17
Revenue YoY growth %
MT
Group
63%
Egypt
12%
Pakistan
21%
Others
4%
22
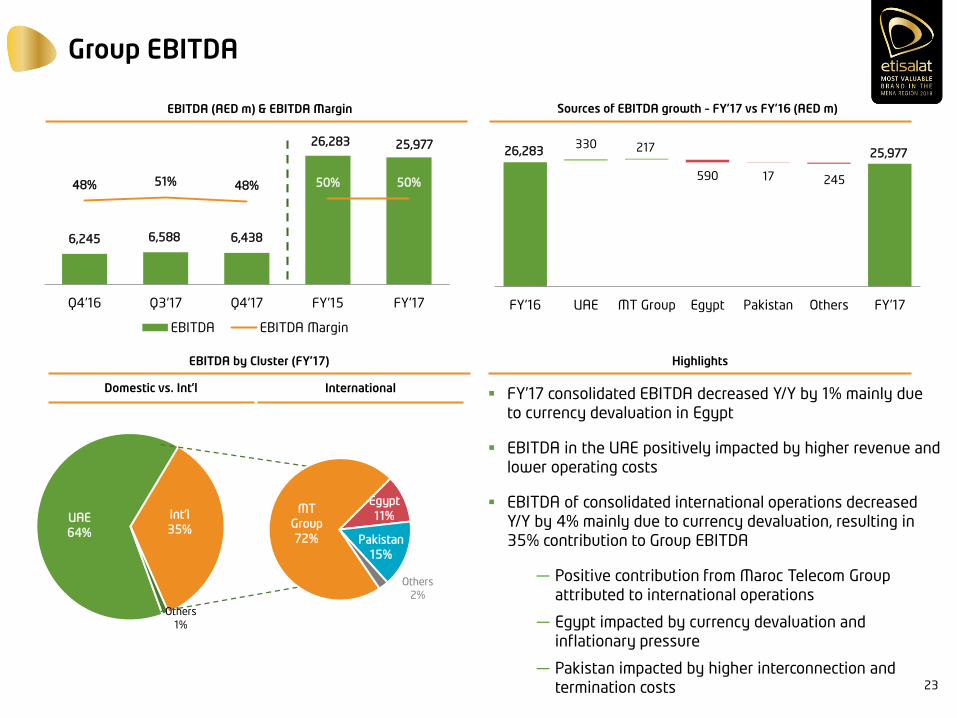
Group EBITDA
UAE
64%
Int'l
35%
Others
1%
FY’17 consolidated EBITDA decreased Y/Y by 1% mainly due
to currency devaluation in Egypt
EBITDA in the UAE positively impacted by higher revenue and
lower operating costs
EBITDA of consolidated international operations decreased
Y/Y by 4% mainly due to currency devaluation, resulting in
35% contribution to Group EBITDA
― Positive contribution from Maroc Telecom Group
attributed to international operations
― Egypt impacted by currency devaluation and
inflationary pressure
― Pakistan impacted by higher interconnection and
termination costs
6,245 6,588 6,438
26,283 25,977
48% 51% 48% 50% 50%
Q4'16 Q3'17 Q4'17 FY'15 FY'17
EBITDA EBITDA Margin
Highlights
EBITDA (AED m) & EBITDA Margin Sources of EBITDA growth – FY’17 vs FY’16 (AED m)
EBITDA by Cluster (FY’17)
Domestic vs. Int’l International
26,283 25,977 330 217
590 17 245
FY'16 UAE MT Group Egypt Pakistan Others FY'17
MT
Group
72%
Egypt
11%
Pakistan
15%
Others
2%
23
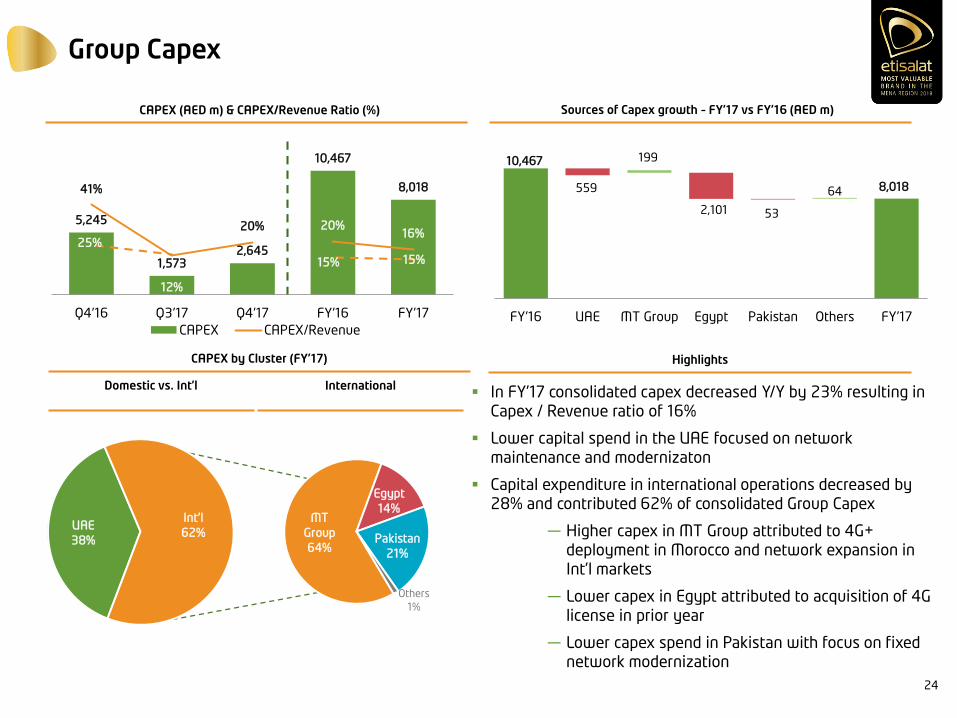
Group Capex
5,245
1,5732,645
10,467
8,01841%
12%
20% 20%16%
Q4'16 Q3'17 Q4'17 FY'16 FY'17
CAPEX CAPEX/Revenue
CAPEX (AED m) & CAPEX/Revenue Ratio (%)
In FY’17 consolidated capex decreased Y/Y by 23% resulting in
Capex / Revenue ratio of 16%
Lower capital spend in the UAE focused on network
maintenance and modernizaton
Capital expenditure in international operations decreased by
28% and contributed 62% of consolidated Group Capex
― Higher capex in MT Group attributed to 4G+
deployment in Morocco and network expansion in
Int’l markets
― Lower capex in Egypt attributed to acquisition of 4G
license in prior year
― Lower capex spend in Pakistan with focus on fixed
network modernization
HighlightsCAPEX by Cluster (FY’17)
Domestic vs. Int’l International
Sources of Capex growth – FY’17 vs FY’16 (AED m)
10,467
8,018 559
199
2,101 53
64
FY'16 UAE MT Group Egypt Pakistan Others FY'17
UAE
38%
Int'l
62%
MT
Group
64%
Egypt
14%
Pakistan
21%
Others
1%
15% 15%
25%
24
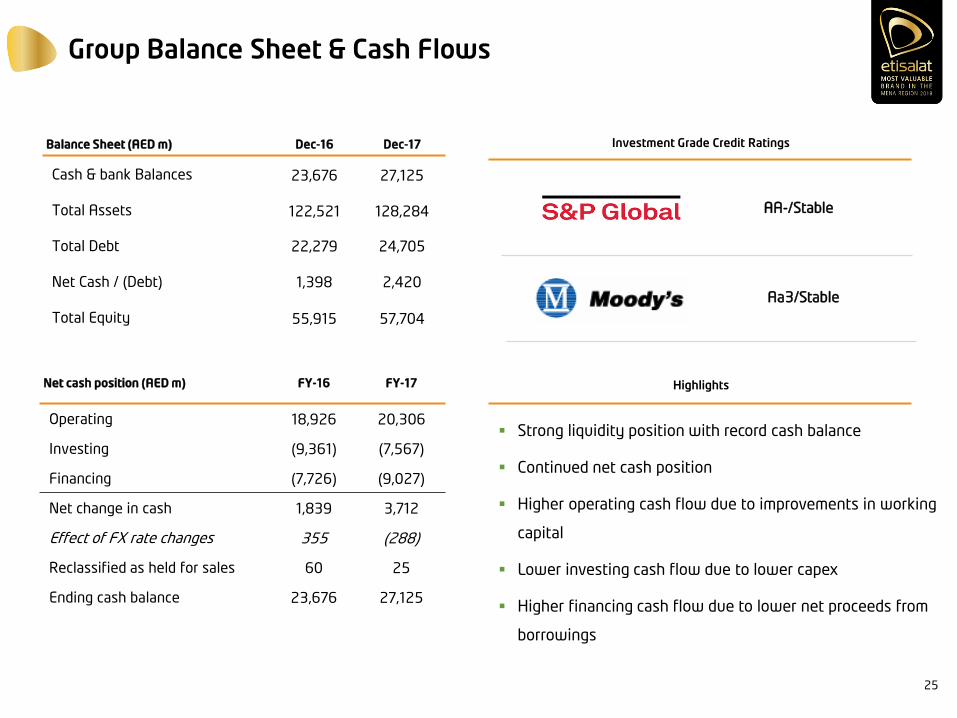
Group Balance Sheet & Cash Flows
Net cash position (AED m) FY-16 FY-17
Operating 18,926 20,306
Investing (9,361) (7,567)
Financing (7,726) (9,027)
Net change in cash 1,839 3,712
Effect of FX rate changes 355 (288)
Reclassified as held for sales 60 25
Ending cash balance 23,676 27,125
Balance Sheet (AED m) Dec-16 Dec-17
Cash & bank Balances 23,676 27,125
Total Assets 122,521 128,284
Total Debt 22,279 24,705
Net Cash / (Debt) 1,398 2,420
Total Equity 55,915 57,704
Investment Grade Credit Ratings
Strong liquidity position with record cash balance
Continued net cash position
Higher operating cash flow due to improvements in working
capital
Lower investing cash flow due to lower capex
Higher financing cash flow due to lower net proceeds from
borrowings
AA-/Stable
Aa3/Stable
Highlights
25
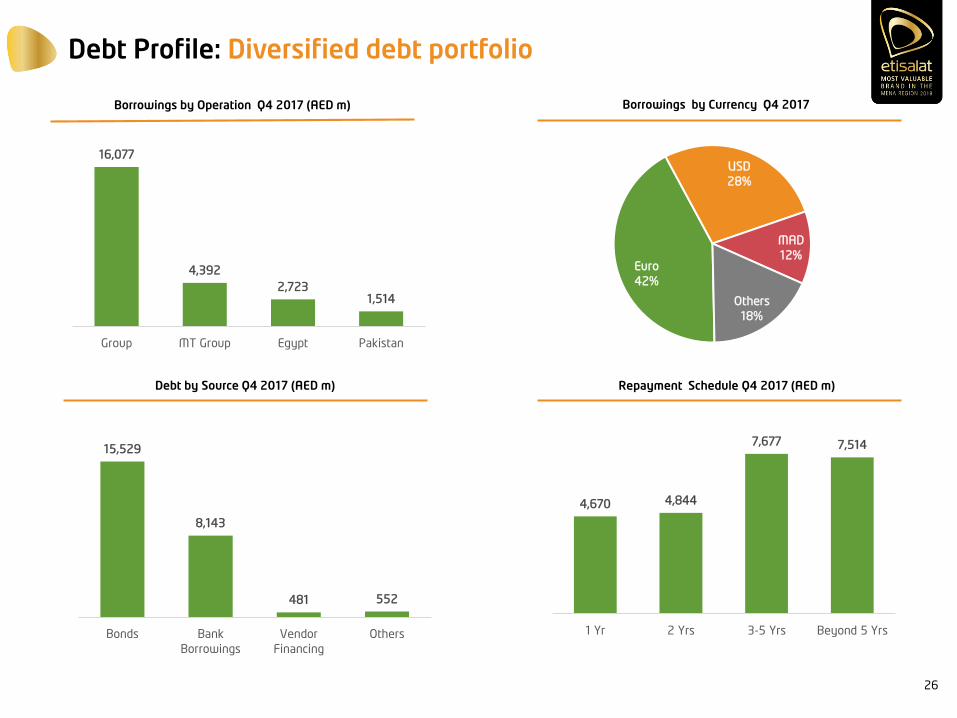
Debt Profile: Diversified debt portfolio
Borrowings by Currency Q4 2017
Debt by Source Q4 2017 (AED m)
Borrowings by Operation Q4 2017 (AED m)
Repayment Schedule Q4 2017 (AED m)
16,077
4,392
2,7231,514
Group MT Group Egypt Pakistan
15,529
8,143
481 552
Bonds Bank
Borrowings
Vendor
Financing
Others
4,670 4,844
7,677 7,514
1 Yr 2 Yrs 3-5 Yrs Beyond 5 Yrs
Euro
42%
USD
28%
MAD
12%
Others
18%
26
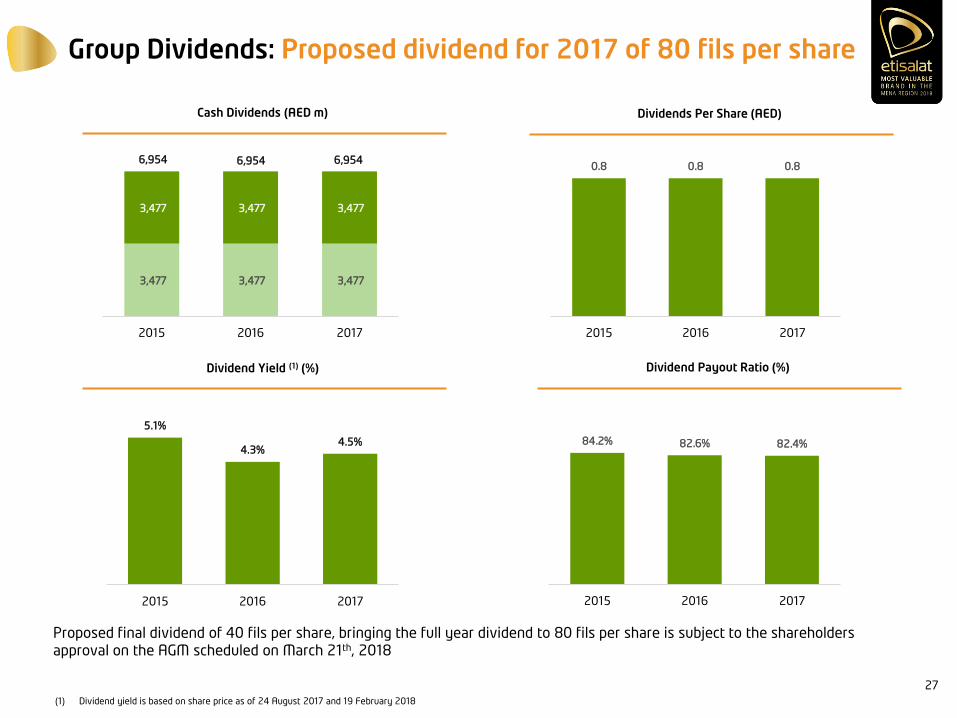
Group Dividends: Proposed dividend for 2017 of 80 fils per share
3,477 3,477 3,477
3,477 3,477 3,477
2015 2016 2017
(1) Dividend yield is based on share price as of 24 August 2017 and 19 February 2018
Proposed final dividend of 40 fils per share, bringing the full year dividend to 80 fils per share is subject to the shareholders
approval on the AGM scheduled on March 21th, 2018
6,9546,9546,9540.8 0.8 0.8
2015 2016 2017
5.1%
4.3%4.5%
2015 2016 2017
84.2% 82.6% 82.4%
2015 2016 2017
Dividend Payout Ratio (%)Dividend Yield (1) (%)
Cash Dividends (AED m) Dividends Per Share (AED)
27

Country by Country Financial Review
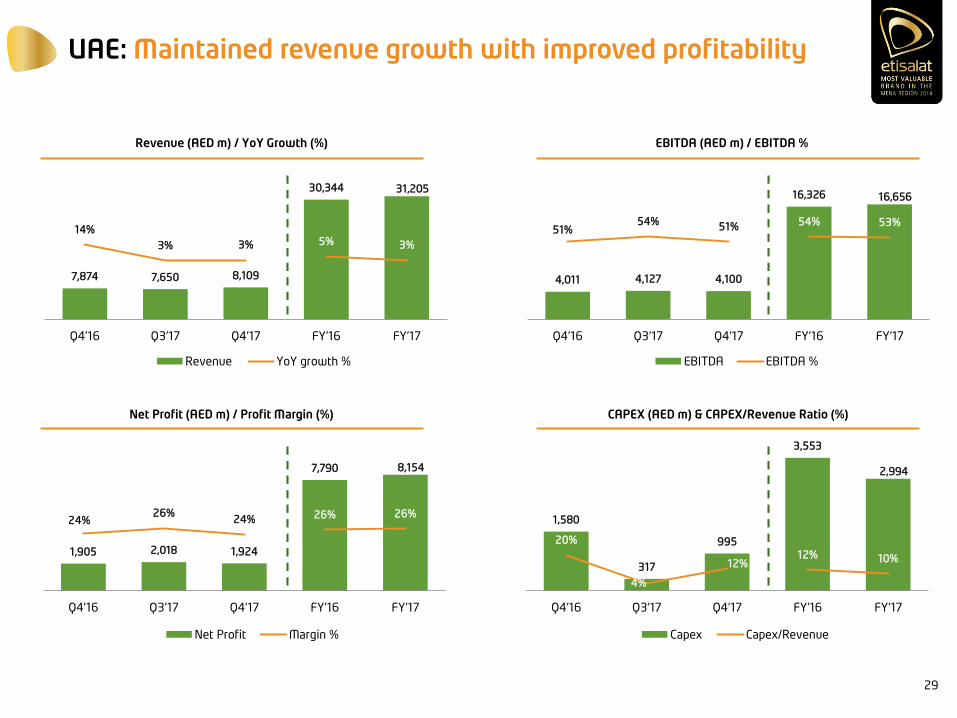
UAE: Maintained revenue growth with improved profitability
EBITDA (AED m) / EBITDA %Revenue (AED m) / YoY Growth (%)
CAPEX (AED m) & CAPEX/Revenue Ratio (%)Net Profit (AED m) / Profit Margin (%)
8%%
7,874 7,650 8,109
30,344 31,205
5% 3%
14%
3% 3%
Q4'16 Q3'17 Q4'17 FY'16 FY'17
Revenue YoY growth %
1,905 2,018 1,924
7,790 8,154
26% 26%24%
26%24%
Q4'16 Q3'17 Q4'17 FY'16 FY'17
Net Profit Margin %
4,011 4,127 4,100
16,326 16,656
54% 53%51%
54%51%
Q4'16 Q3'17 Q4'17 FY'16 FY'17
EBITDA EBITDA %
1,580
317
995
3,553
2,994
12% 10%
20%
4%
12%
Q4'16 Q3'17 Q4'17 FY'16 FY'17
Capex Capex/Revenue
29
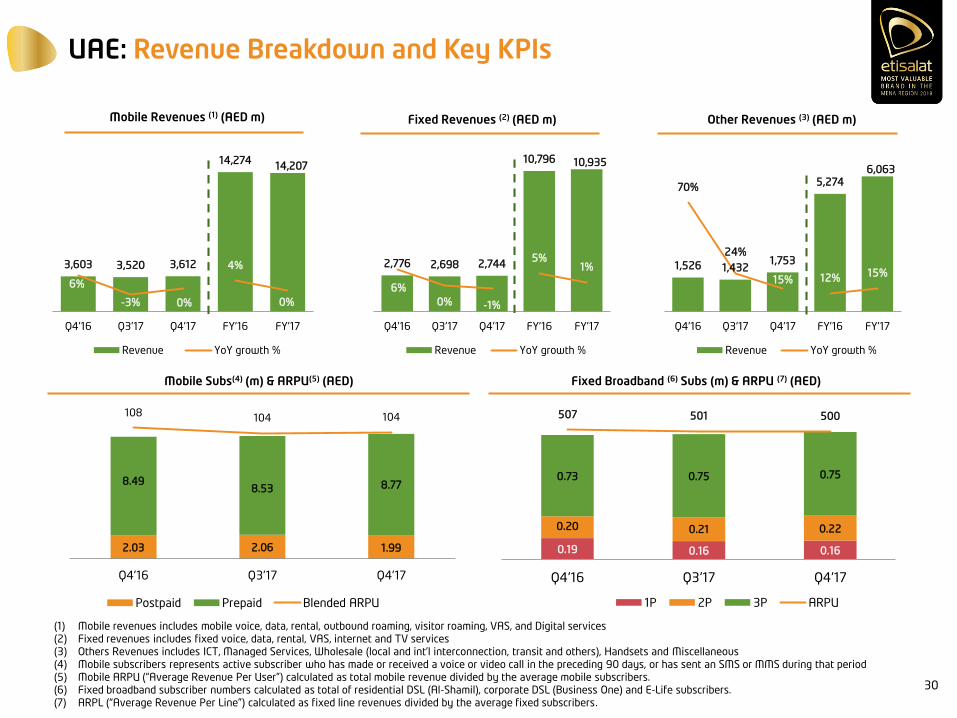
UAE: Revenue Breakdown and Key KPIs
2.03 2.06 1.99
8.498.53 8.77
108104 104
Q4'16 Q3'17 Q4'17
Postpaid Prepaid Blended ARPU
Mobile Revenues (1) (AED m)
Fixed Broadband (6) Subs (m) & ARPU (7) (AED)Mobile Subs(4) (m) & ARPU(5) (AED)
Fixed Revenues (2) (AED m) Other Revenues (3) (AED m)
0.19 0.16 0.16
0.20 0.21 0.22
0.73 0.75 0.75
507 501 500
Q4'16 Q3'17 Q4'17
1P 2P 3P ARPU
3,603 3,520 3,612
14,27414,207
4%
0%
6%
-3% 0%
Q4'16 Q3'17 Q4'17 FY'16 FY'17
Revenue YoY growth %
2,776 2,698 2,744
10,796 10,935
5%1%
6%
0% -1%
Q4'16 Q3'17 Q4'17 FY'16 FY'17
Revenue YoY growth %
1,526 1,4321,753
5,2746,063
12% 15%
70%
24%
15%
Q4'16 Q3'17 Q4'17 FY'16 FY'17
Revenue YoY growth %
(1) Mobile revenues includes mobile voice, data, rental, outbound roaming, visitor roaming, VAS, and Digital services (2) Fixed revenues includes fixed voice, data, rental, VAS, internet and TV services (3) Others Revenues includes ICT, Managed Services, Wholesale (local and int’l interconnection, transit and others), Handsets and Miscellaneous (4) Mobile subscribers represents active subscriber who has made or received a voice or video call in the preceding 90 days, or has sent an SMS or MMS during that period(5) Mobile ARPU (“Average Revenue Per User”) calculated as total mobile revenue divided by the average mobile subscribers.(6) Fixed broadband subscriber numbers calculated as total of residential DSL (Al-Shamil), corporate DSL (Business One) and E-Life subscribers.(7) ARPL (“Average Revenue Per Line”) calculated as fixed line revenues divided by the average fixed subscribers.
30
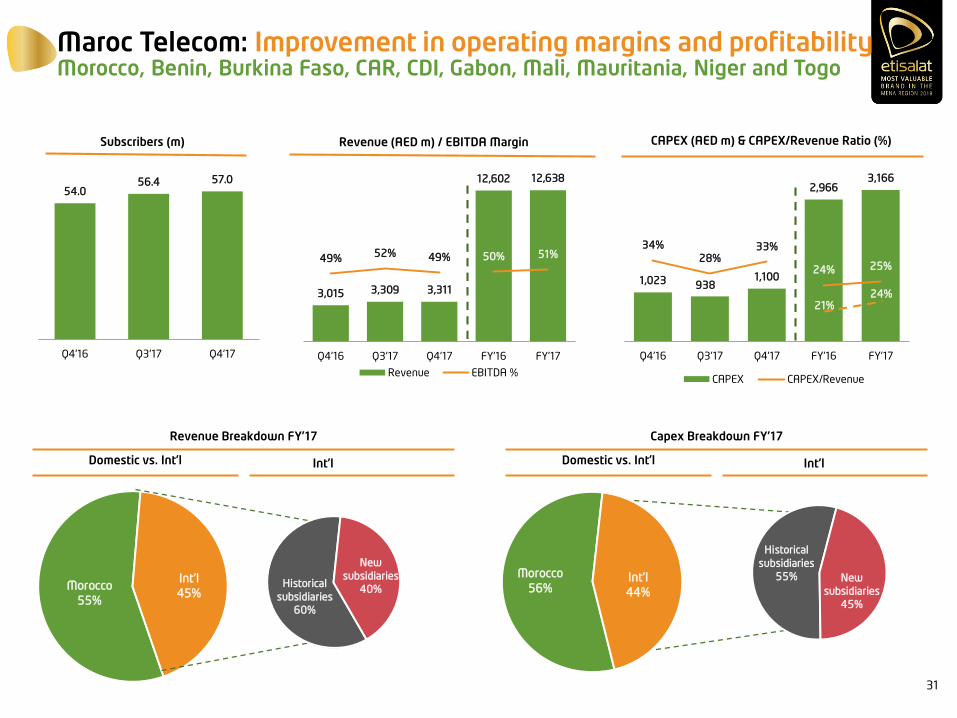
Maroc Telecom: Improvement in operating margins and profitabilityMorocco, Benin, Burkina Faso, CAR, CDI, Gabon, Mali, Mauritania, Niger and Togo
Morocco
55%
Int'l
45%
3,015 3,309 3,311
12,602 12,638
50% 51%49% 52% 49%
Q4'16 Q3'17 Q4'17 FY'16 FY'17
Revenue EBITDA %
Subscribers (m) Revenue (AED m) / EBITDA Margin CAPEX (AED m) & CAPEX/Revenue Ratio (%)
54.0 56.4 57.0
Q4'16 Q3'17 Q4'17
Domestic vs. Int’l
Revenue Breakdown FY’17
Int’l
1,023 938 1,100
2,966 3,166
24% 25%
34%
28%33%
Q4'16 Q3'17 Q4'17 FY'16 FY'17
CAPEX CAPEX/Revenue
Domestic vs. Int’l
Capex Breakdown FY’17
Int’l
Historical
subsidiaries
60%
New
subsidiaries
40%
Historical
subsidiaries
55% New
subsidiaries
45%
Morocco
56%Int'l
44%
21%24%
31
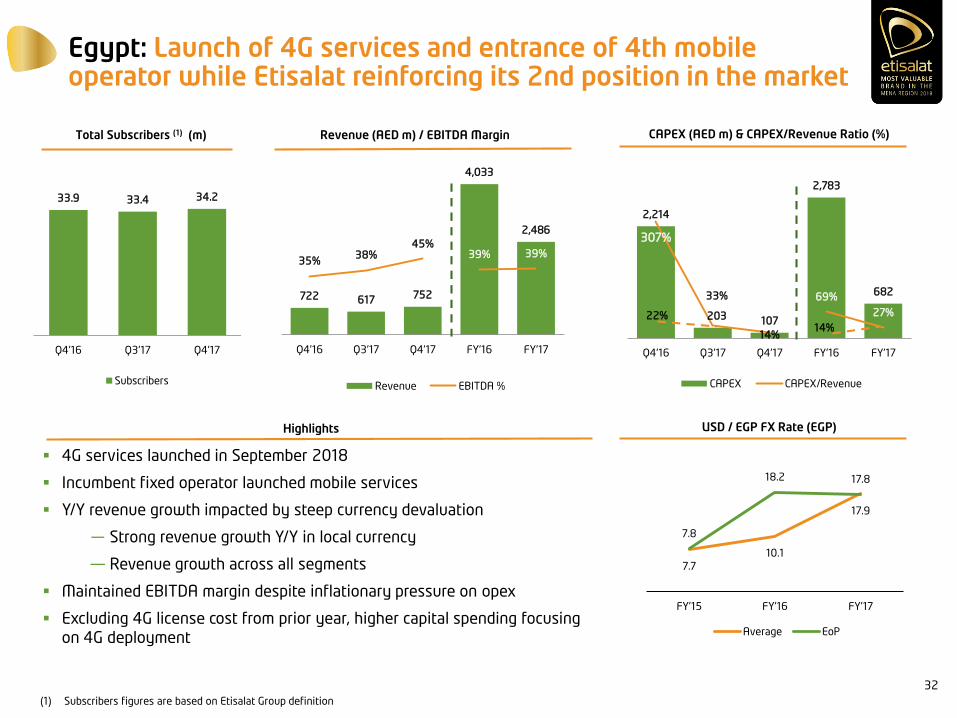
Egypt: Launch of 4G services and entrance of 4th mobile operator while Etisalat reinforcing its 2nd position in the market
2,214
203 107
2,783
682 69%
27%
307%
33%
14%
Q4'16 Q3'17 Q4'17 FY'16 FY'17
CAPEX CAPEX/Revenue
Total Subscribers (1) (m) Revenue (AED m) / EBITDA Margin CAPEX (AED m) & CAPEX/Revenue Ratio (%)
722 617 752
4,033
2,486
39% 39%35%
38%45%
Q4'16 Q3'17 Q4'17 FY'16 FY'17
Revenue EBITDA %
4G services launched in September 2018
Incumbent fixed operator launched mobile services
Y/Y revenue growth impacted by steep currency devaluation
― Strong revenue growth Y/Y in local currency
— Revenue growth across all segments
Maintained EBITDA margin despite inflationary pressure on opex
Excluding 4G license cost from prior year, higher capital spending focusing
on 4G deployment
Highlights
33.9 33.4 34.2
Q4'16 Q3'17 Q4'17
Subscribers
(1) Subscribers figures are based on Etisalat Group definition
USD / EGP FX Rate (EGP)
14%22%
7.7
10.1
17.9
7.8
18.2 17.8
FY'15 FY'16 FY'17
Average EoP
32
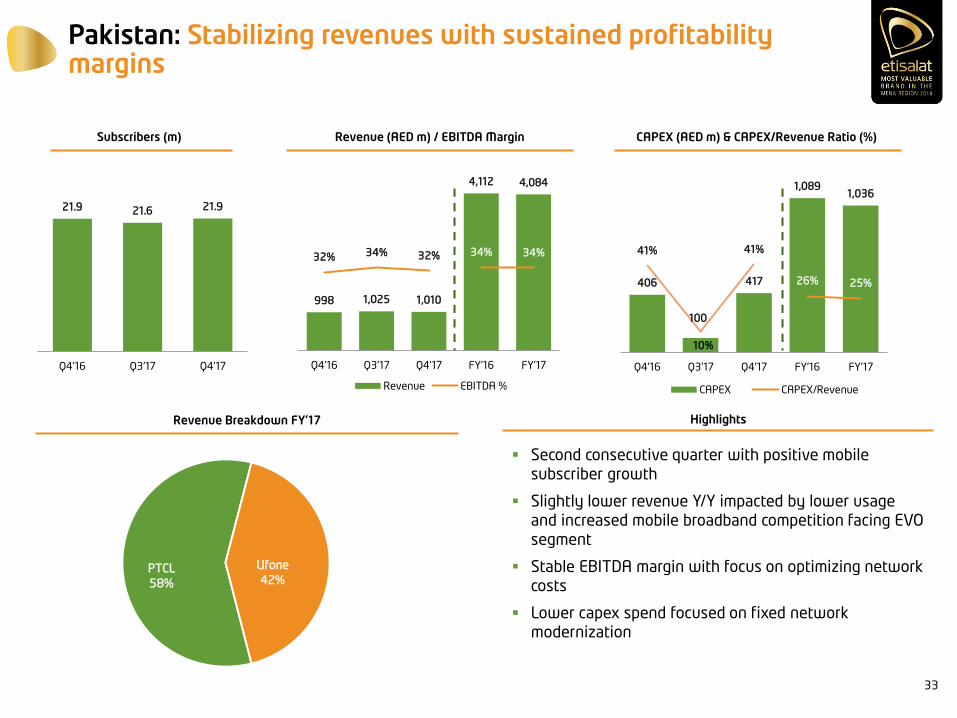
Pakistan: Stabilizing revenues with sustained profitability margins
21.9 21.6 21.9
Q4'16 Q3'17 Q4'17
998 1,025 1,010
4,112 4,084
34% 34%32% 34% 32%
Q4'16 Q3'17 Q4'17 FY'16 FY'17
Revenue EBITDA %
406
100
417
1,089 1,036
26% 25%
41%
10%
41%
Q4'16 Q3'17 Q4'17 FY'16 FY'17
CAPEX CAPEX/Revenue
Subscribers (m) Revenue (AED m) / EBITDA Margin CAPEX (AED m) & CAPEX/Revenue Ratio (%)
HighlightsRevenue Breakdown FY’17
Second consecutive quarter with positive mobile
subscriber growth
Slightly lower revenue Y/Y impacted by lower usage
and increased mobile broadband competition facing EVO
segment
Stable EBITDA margin with focus on optimizing network
costs
Lower capex spend focused on fixed network
modernization
PTCL
58%
Ufone
42%
33
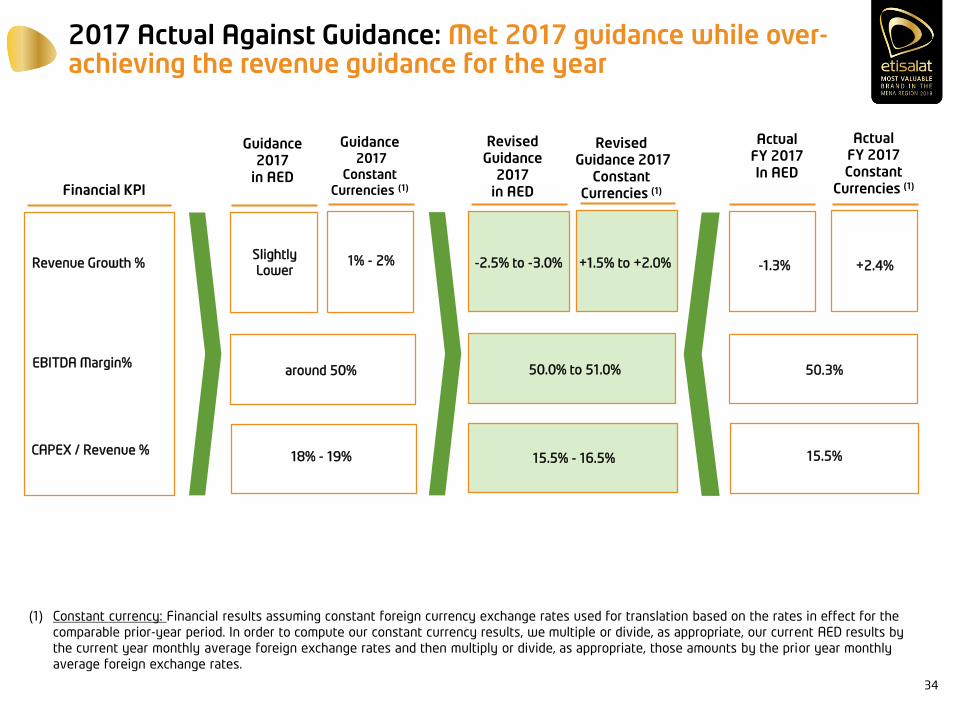
2017 Actual Against Guidance: Met 2017 guidance while over-achieving the revenue guidance for the year
Revenue Growth %
EBITDA Margin%
CAPEX / Revenue %
Slightly
Lower
around 50%
Financial KPI
Guidance 2017
in AED
1% - 2%
18% - 19%
Guidance2017
Constant Currencies (1)
(1) Constant currency: Financial results assuming constant foreign currency exchange rates used for translation based on the rates in effect for the
comparable prior-year period. In order to compute our constant currency results, we multiple or divide, as appropriate, our current AED results by
the current year monthly average foreign exchange rates and then multiply or divide, as appropriate, those amounts by the prior year monthly
average foreign exchange rates.
-2.5% to -3.0%
50.0% to 51.0%
Revised Guidance
2017in AED
+1.5% to +2.0%
15.5% - 16.5%
RevisedGuidance 2017
Constant Currencies (1)
-1.3%
50.3%
ActualFY 2017In AED
+2.4%
15.5%
Actual FY 2017Constant
Currencies (1)
34
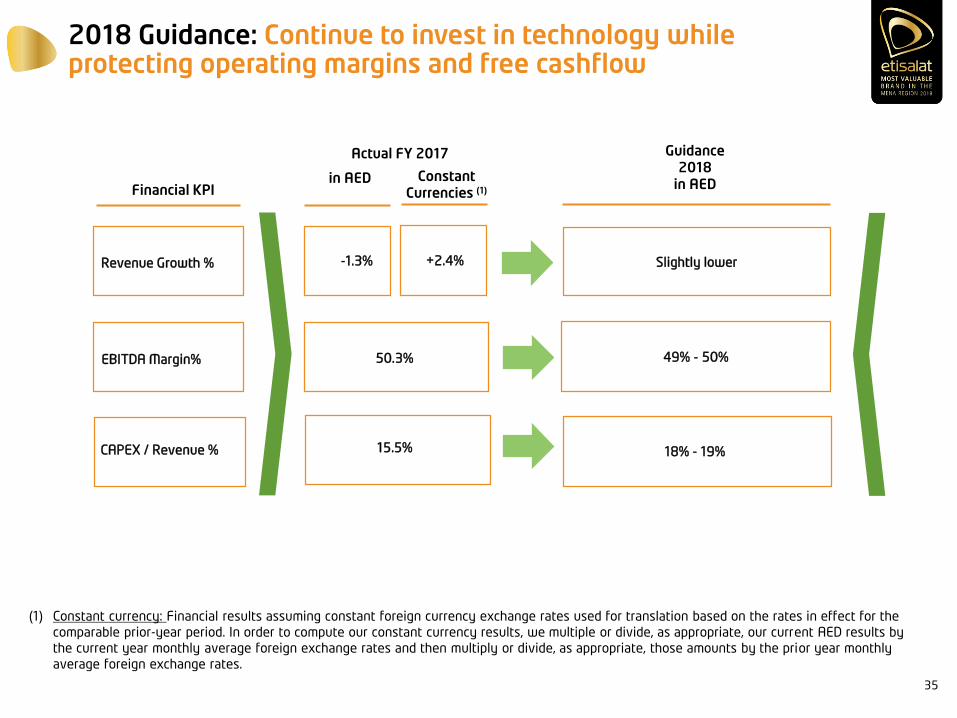
2018 Guidance: Continue to invest in technology while protecting operating margins and free cashflow
Revenue Growth %
EBITDA Margin%
CAPEX / Revenue %
50.3%
Financial KPI
Actual FY 2017
+2.4%
15.5%
(1) Constant currency: Financial results assuming constant foreign currency exchange rates used for translation based on the rates in effect for the
comparable prior-year period. In order to compute our constant currency results, we multiple or divide, as appropriate, our current AED results by
the current year monthly average foreign exchange rates and then multiply or divide, as appropriate, those amounts by the prior year monthly
average foreign exchange rates.
Slightly lower
49% - 50%
18% - 19%
-1.3%
in AED Constant Currencies (1)
Guidance 2018
in AED
35

THANK YOU
Q&A
Etisalat GroupCapital Markets Day 2018
Etisalat InternationalBusiness Overview
Hatem Dowidar
Chief Executive Officer – Etisalat International
Etisalat Group
Etisalat Group International Footprint – Key Developments
38
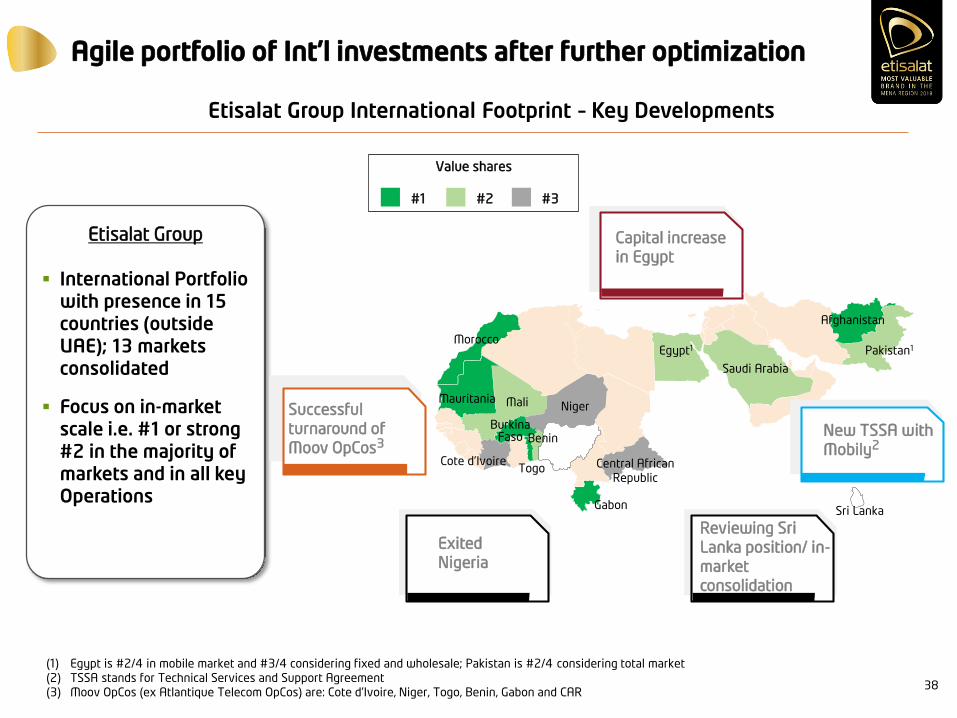
Agile portfolio of Int’l investments after further optimization
International Portfolio with presence in 15 countries (outside UAE); 13 markets consolidated
Focus on in-market scale i.e. #1 or strong #2 in the majority of markets and in all key Operations
(1) Egypt is #2/4 in mobile market and #3/4 considering fixed and wholesale; Pakistan is #2/4 considering total market
(2) TSSA stands for Technical Services and Support Agreement
(3) Moov OpCos (ex Atlantique Telecom OpCos) are: Cote d’Ivoire, Niger, Togo, Benin, Gabon and CAR
#1 #2 #3
Value shares
Reviewing Sri
Lanka position/ in-
market
consolidation
Successful
turnaround of
Moov OpCos3
Niger
Central African
Republic
Gabon
TogoCote d’Ivoire
Benin
Saudi Arabia
Pakistan1
Afghanistan
Morocco
Mauritania Mali
Burkina Faso
Egypt1
Sri Lanka
Capital increase
in Egypt
New TSSA with
Mobily2
Exited
Nigeria

International investments are a solid platform for profitable and cash generating growth…
39
Revenues (2) (AED bn) EBITDA (2) (AED bn, %)
Etisalat
International
Consolidated
+4%
2017
10.3
2016
+5%
9.8
2015
9.5
OFCF Proxy (2),(3) (AED bn, %)
(1) Including Mobily (KSA), which is an associate but excluding Etisalat Nigeria, Zantel, Canar and Sri Lanka from 2015 onwards
(2) The evolution of financial KPIs is made with constant FX, using 2015 rates
(3) OFCF proxy defined as EBITDA – CapEx; CapEx excluding the cost of license acquisition
4.5
2016
4.3
+4%
2017
+5%
2015
4.2
Etisalat
International
aggregated
perspective1
+12%+1%
2017
13.9
2016
13.8
2015
12.3
2017
+43% +14%
5.9
2016
5.2
2015
3.6
2015
22.621.9
+3%+3%
2017
23.3
2016
2017
-1%-3%
34.5
2016
36.0
2015
34.9

Revenues: 11.4 bn SAR
(-9.7% YoY)
EBITDA: 3.6 bn SAR (-10.4%
YoY), 32.1% margin
Net Losses: -0.7 bn SAR, -6.2% margin
Revenues: 117.0 bn PKR
(-0.1% YoY)
EBITDA: 39.4 bn PRK (-0.7% YoY),
33.7% margin
Net Profit: 4.3 bn PKR (+167% YoY),
3.7% margin
Strong challenger, turnaround in progress
Incumbent, profitable integrated player
… laid on Etisalat operations in 4 sizable markets
40
Saudi Arabia Pakistan
MT Egypt
Revenues: 35.0 bn MAD (-0.8% YoY)
EBITDA: 17.2 bn MAD (+1.5% YoY),
49.1% margin
Net Profit: 5.7 bn MAD (+4.4%
YoY), 16.8% margin
2017 ACHIEVEMENTS
Revenues: 12.1 bn EGP (+16.7% YoY)
EBITDA: 4.7 bn EGP (+19.8% YoY),
39.2% margin
Net Profit: 1.0 bn EGP (Net losses
in 2016), 8.0% margin
(1) Egypt is #2/4 in mobile market and #3/4 considering fixed and wholesale; Pakistan is #2/4 considering total market
#1-2 in 7 out
10 markets
#2/41 (value)
#2/3 (value) #2/41 (value)
Leadership position Profitable challenger
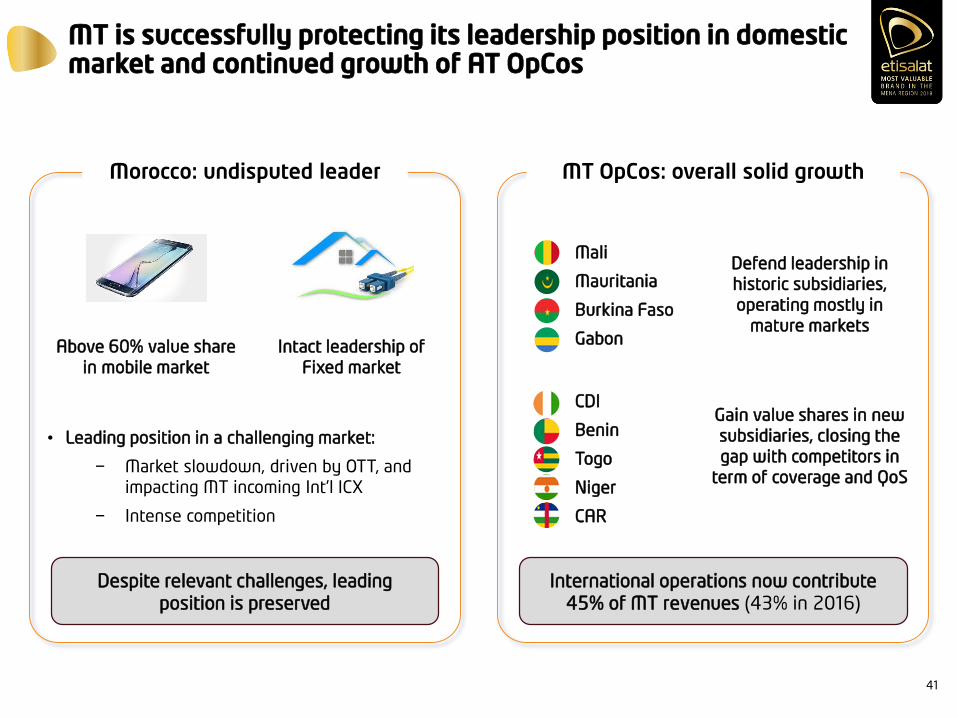
MT is successfully protecting its leadership position in domestic market and continued growth of AT OpCos
41
Morocco: undisputed leader
• Leading position in a challenging market:
− Market slowdown, driven by OTT, and
impacting MT incoming Int’l ICX
− Intense competition
MT OpCos: overall solid growth
Above 60% value share
in mobile market
Intact leadership of
Fixed market
Despite relevant challenges, leading
position is preserved
International operations now contribute
45% of MT revenues (43% in 2016)
Defend leadership in
historic subsidiaries,
operating mostly in
mature markets
• Mali
• Mauritania
• Burkina Faso
• Gabon
Gain value shares in new
subsidiaries, closing the
gap with competitors in
term of coverage and QoS
• CDI
• Benin
• Togo
• Niger
• CAR
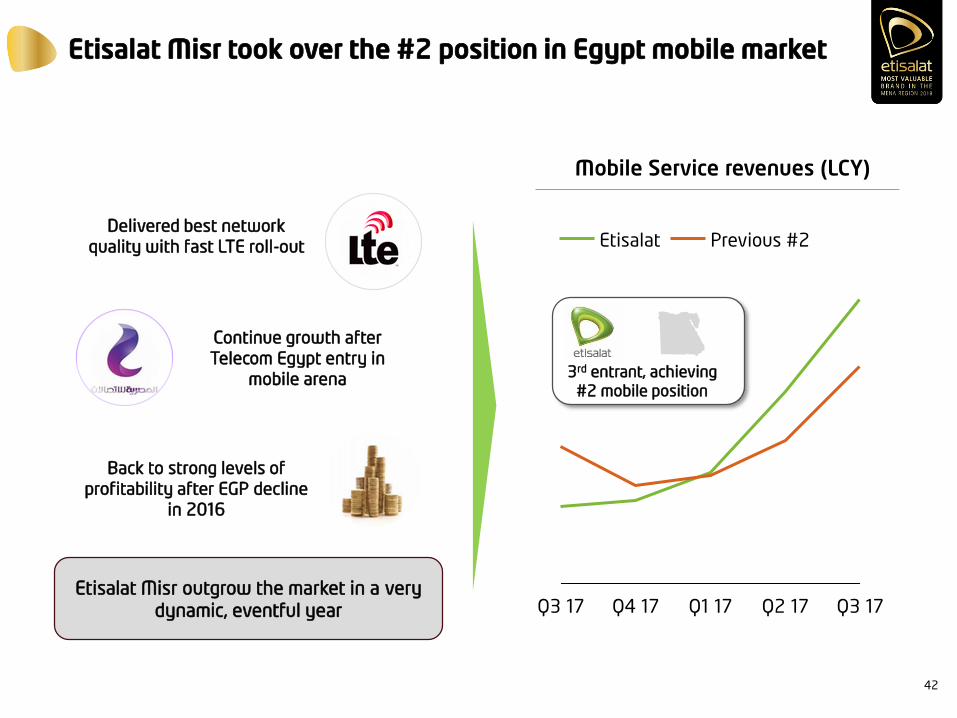
Etisalat Misr took over the #2 position in Egypt mobile market
42
Mobile Service revenues (LCY)
Q3 17 Q4 17 Q1 17 Q2 17 Q3 17
Etisalat Previous #2Delivered best network
quality with fast LTE roll-out
Continue growth after
Telecom Egypt entry in
mobile arena
Back to strong levels of
profitability after EGP decline
in 2016
Etisalat Misr outgrow the market in a very
dynamic, eventful year
3rd entrant, achieving
#2 mobile position
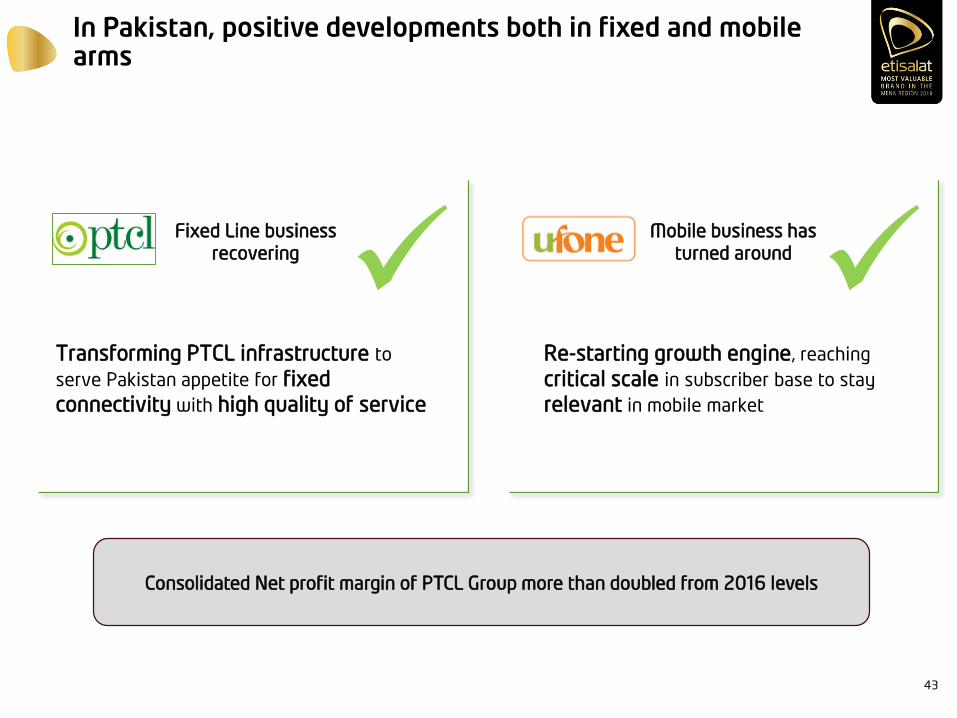
In Pakistan, positive developments both in fixed and mobile arms
43
Fixed Line business
recovering
Mobile business has
turned around
Transforming PTCL infrastructure to
serve Pakistan appetite for fixed
connectivity with high quality of service
Consolidated Net profit margin of PTCL Group more than doubled from 2016 levels
Re-starting growth engine, reaching
critical scale in subscriber base to stay
relevant in mobile market
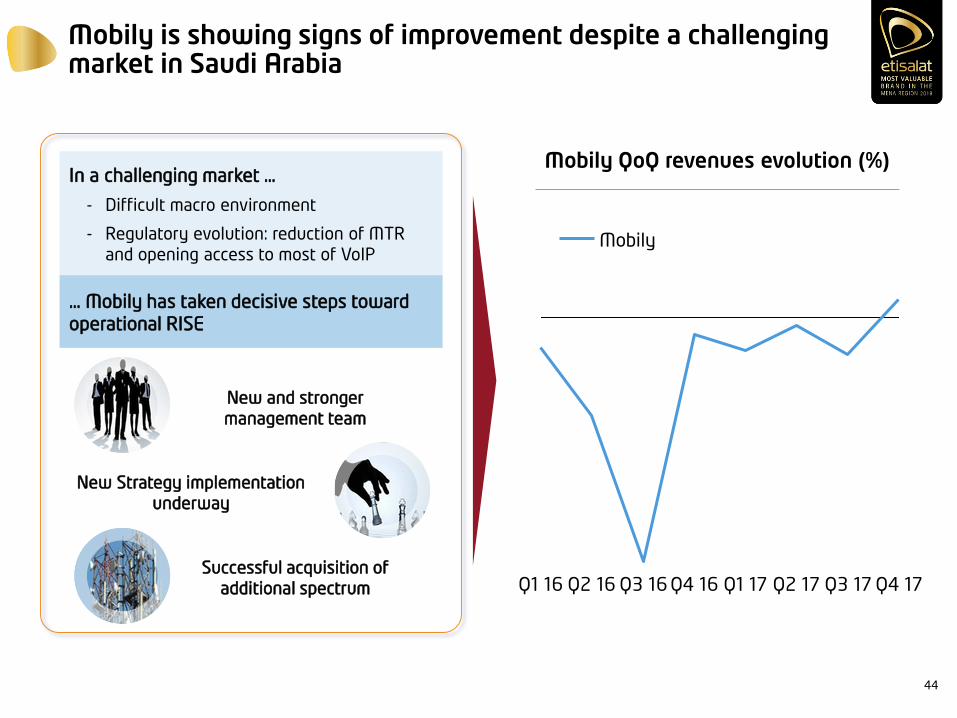
Mobily is showing signs of improvement despite a challenging market in Saudi Arabia
44
Mobily QoQ revenues evolution (%)
Q1 17Q2 16Q1 16 Q4 16Q3 16 Q3 17 Q4 17Q2 17
Mobily
New and stronger
management team
New Strategy implementation
underway
Successful acquisition of
additional spectrum
In a challenging market …
- Difficult macro environment
- Regulatory evolution: reduction of MTR
and opening access to most of VoIP
… Mobily has taken decisive steps toward
operational RISE
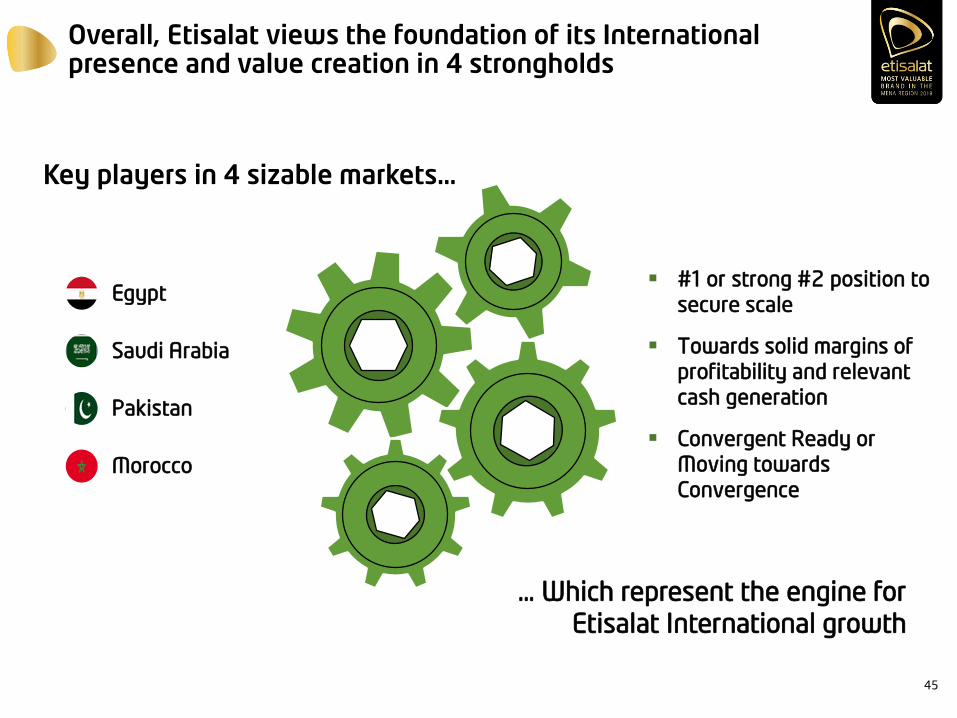
Overall, Etisalat views the foundation of its International presence and value creation in 4 strongholds
45
Key players in 4 sizable markets…
… Which represent the engine for
Etisalat International growth
• Egypt
• Saudi Arabia
• Pakistan
• Morocco
#1 or strong #2 position to
secure scale
Towards solid margins of
profitability and relevant
cash generation
Convergent Ready or
Moving towards
Convergence
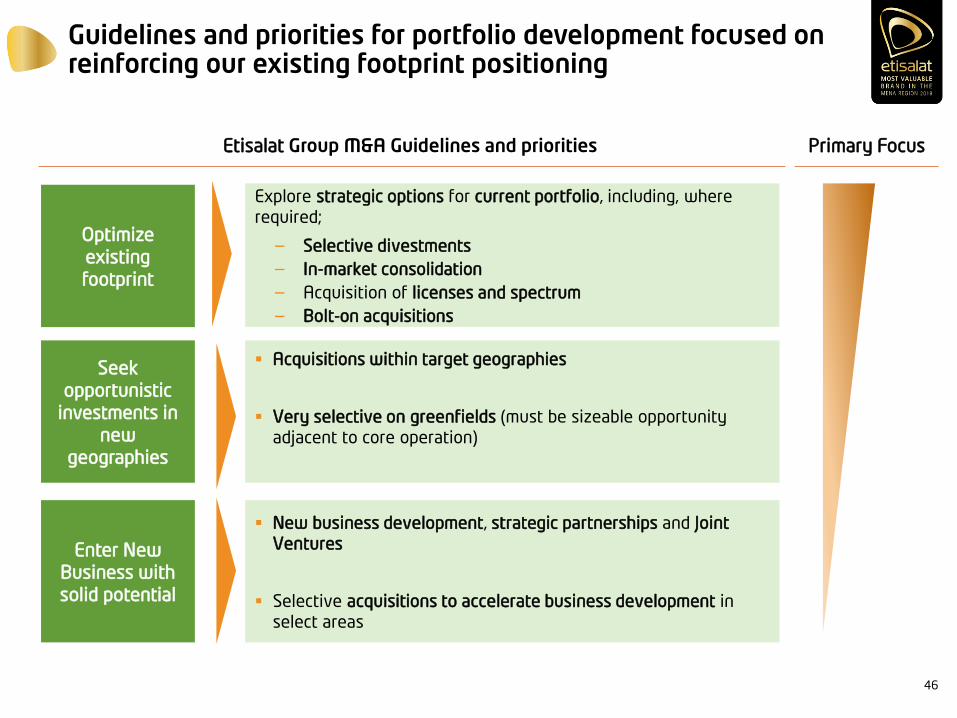
Guidelines and priorities for portfolio development focused on reinforcing our existing footprint positioning
Optimize
existing
footprint
Enter New
Business with
solid potential
Seek
opportunistic
investments in
new
geographies
Etisalat Group M&A Guidelines and priorities Primary Focus
Explore strategic options for current portfolio, including, where
required;
− Selective divestments
− In-market consolidation
− Acquisition of licenses and spectrum
− Bolt-on acquisitions
Acquisitions within target geographies
Very selective on greenfields (must be sizeable opportunity
adjacent to core operation)
New business development, strategic partnerships and Joint
Ventures
Selective acquisitions to accelerate business development in
select areas
46
Way forward / Key messages
47
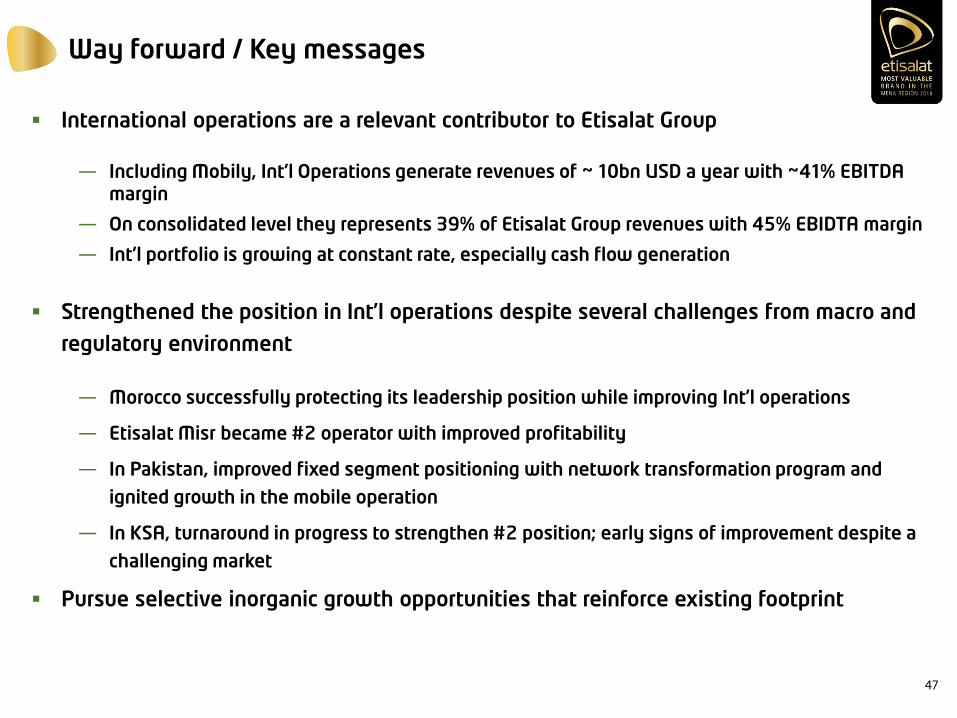
International operations are a relevant contributor to Etisalat Group
— Including Mobily, Int’l Operations generate revenues of ~ 10bn USD a year with ~41% EBITDA margin
— On consolidated level they represents 39% of Etisalat Group revenues with 45% EBIDTA margin
— Int’l portfolio is growing at constant rate, especially cash flow generation
Strengthened the position in Int’l operations despite several challenges from macro and
regulatory environment
— Morocco successfully protecting its leadership position while improving Int’l operations
— Etisalat Misr became #2 operator with improved profitability
— In Pakistan, improved fixed segment positioning with network transformation program and
ignited growth in the mobile operation
— In KSA, turnaround in progress to strengthen #2 position; early signs of improvement despite a
challenging market
Pursue selective inorganic growth opportunities that reinforce existing footprint

THANK YOU
Q&A
Etisalat GroupCapital Markets Day 2018
Introducing the New Vision and Strategy for Etisalat Group
Khalifa Alshamsi
Chief Strategy & Governance Officer – Etisalat Group
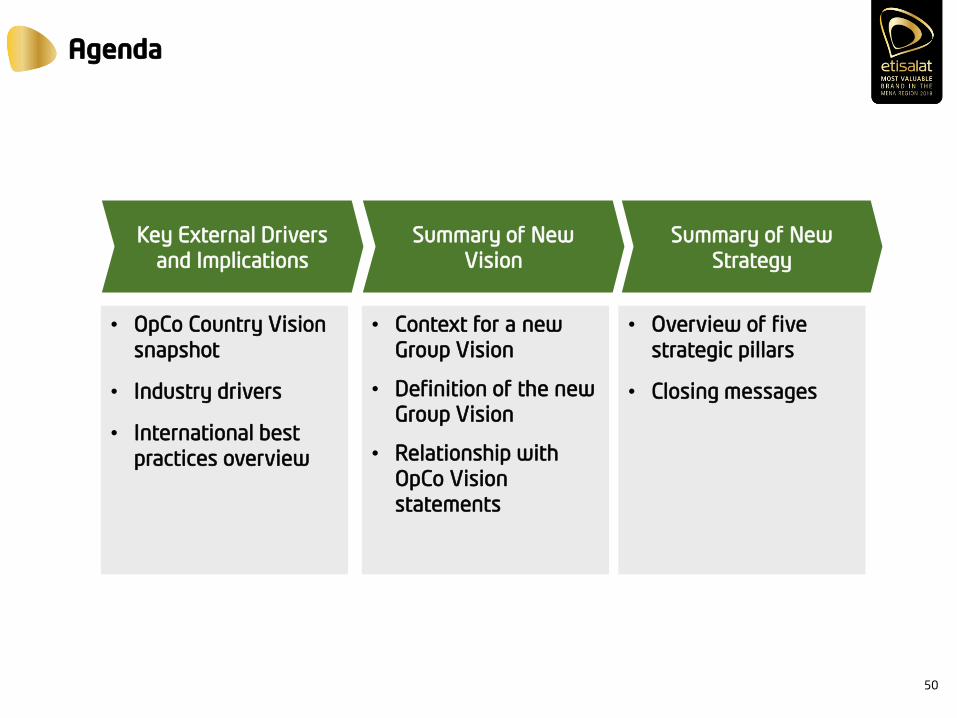
Agenda
• Overview of five
strategic pillars
• Closing messages
• OpCo Country Vision
snapshot
• Industry drivers
• International best
practices overview
Key External Drivers
and Implications
Summary of New
Vision
Summary of New
Strategy
• Context for a new
Group Vision
• Definition of the new
Group Vision
• Relationship with
OpCo Vision
statements
50
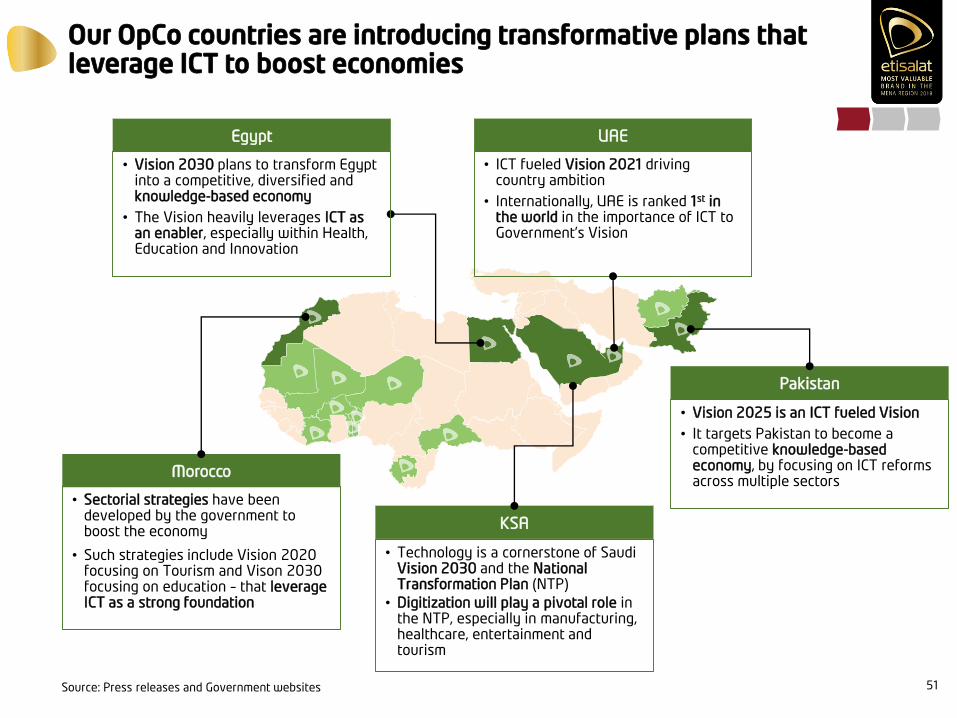
Our OpCo countries are introducing transformative plans that leverage ICT to boost economies
51Source: Press releases and Government websites
Egypt UAE
Pakistan
Morocco
KSA
• Vision 2030 plans to transform Egypt into a competitive, diversified and knowledge-based economy
• The Vision heavily leverages ICT as an enabler, especially within Health, Education and Innovation
• ICT fueled Vision 2021 driving country ambition
• Internationally, UAE is ranked 1st in the world in the importance of ICT to Government’s Vision
• Vision 2025 is an ICT fueled Vision
• It targets Pakistan to become a competitive knowledge-based economy, by focusing on ICT reforms across multiple sectors
• Sectorial strategies have been developed by the government to boost the economy
• Such strategies include Vision 2020 focusing on Tourism and Vison 2030 focusing on education – that leverage ICT as a strong foundation
• Technology is a cornerstone of Saudi Vision 2030 and the National Transformation Plan (NTP)
• Digitization will play a pivotal role in the NTP, especially in manufacturing, healthcare, entertainment and tourism
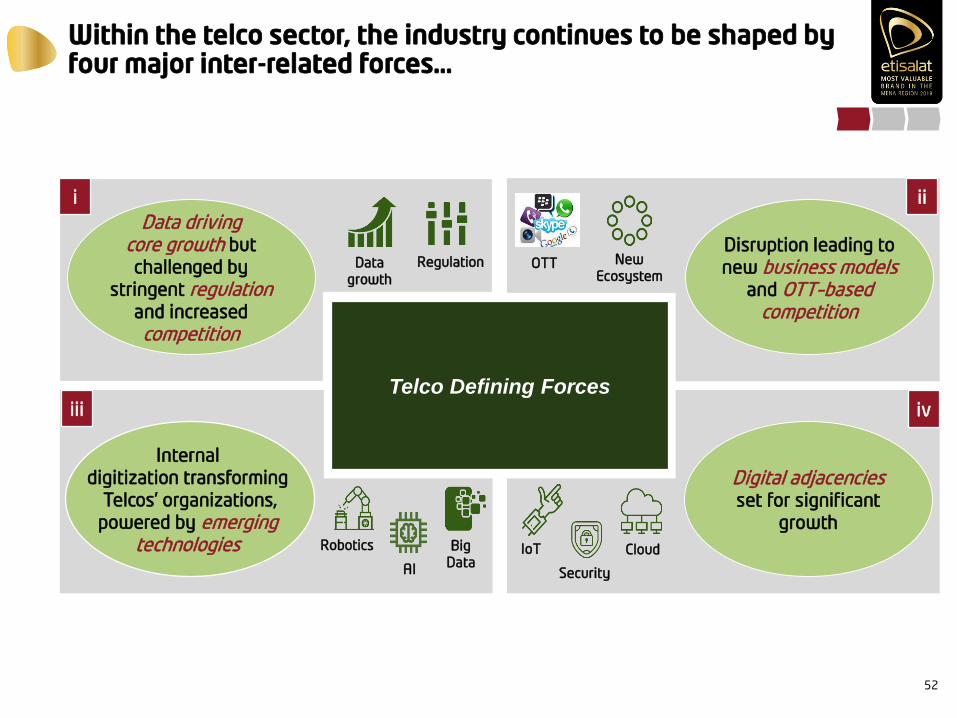
Within the telco sector, the industry continues to be shaped by four major inter-related forces…
52
Telco Defining Forces
Data drivingcore growth but
challenged by
stringent regulationand increased
competition
Disruption leading to
new business models and OTT–based
competition
Internal
digitization transforming
Telcos’ organizations,
powered by emergingtechnologies
Digital adjacencies set for significant
growth
i
iii
ii
iv
IoT Cloud
Security
Robotics BigData
AI
OTT NewEcosystem
RegulationDatagrowth
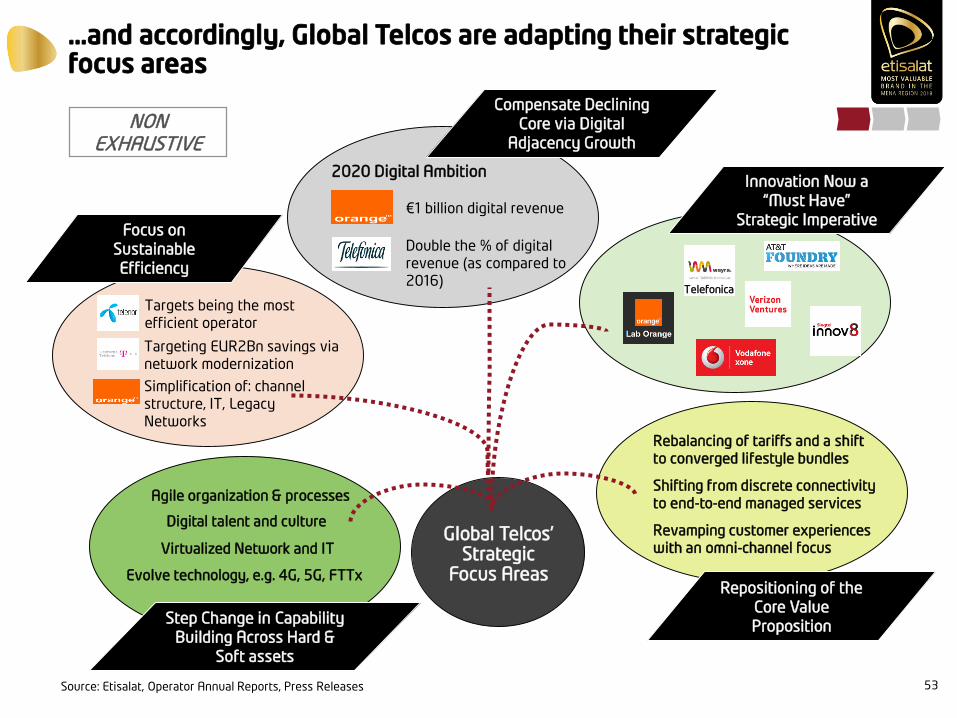
…and accordingly, Global Telcos are adapting their strategic focus areas
53Source: Etisalat, Operator Annual Reports, Press Releases
Global Telcos’Strategic
Focus Areas
€1 billion digital revenue
Double the % of digital
revenue (as compared to
2016)
2020 Digital AmbitionInnovation Now a
“Must Have”
Strategic Imperative
Repositioning of the
Core Value
PropositionStep Change in Capability
Building Across Hard &
Soft assets
Agile organization & processes
Compensate Declining
Core via Digital
Adjacency Growth
Focus on
Sustainable
Efficiency
Digital talent and culture
Virtualized Network and IT
Evolve technology, e.g. 4G, 5G, FTTx
Rebalancing of tariffs and a shift
to converged lifestyle bundles
Shifting from discrete connectivity to end-to-end managed services
Revamping customer experiences
with an omni-channel focus
NON EXHAUSTIVE
Telefonica
• Targets being the most
efficient operator
• Targeting EUR2Bn savings via
network modernization
• Simplification of: channel
structure, IT, Legacy
Networks
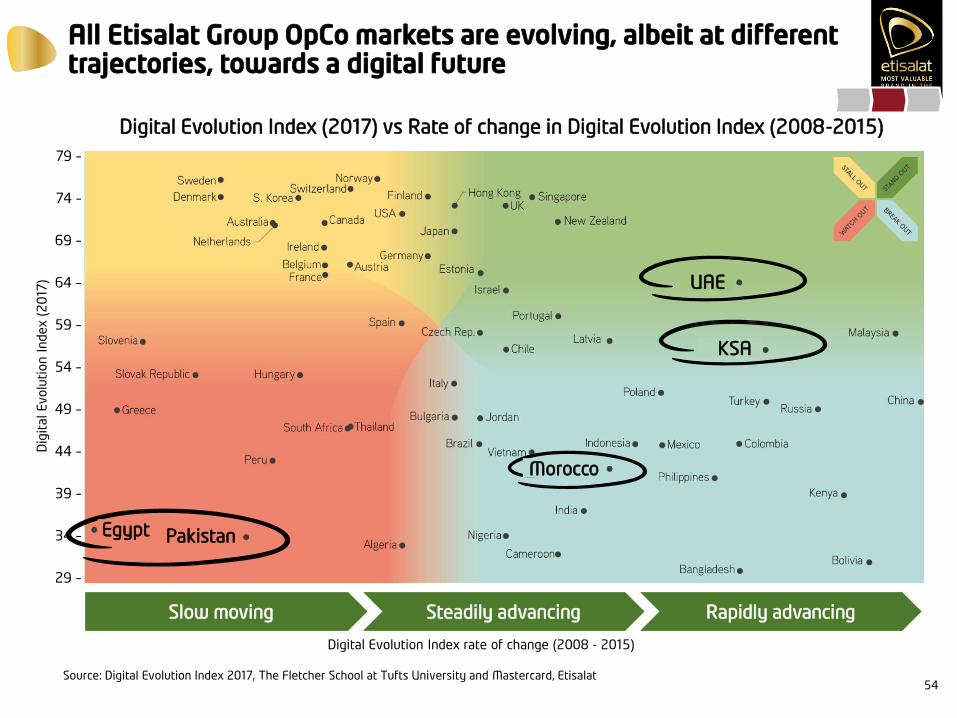
All Etisalat Group OpCo markets are evolving, albeit at different trajectories, towards a digital future
54
29 –
34 –
39 –
44 –
49 –
54 –
59 –
64 –
69 –
74 –
79 –
Dig
ital E
volu
tion
In
dex (
20
17)
Digital Evolution Index rate of change (2008 - 2015)
Digital Evolution Index (2017) vs Rate of change in Digital Evolution Index (2008-2015)
Rapidly advancingSteadily advancingSlow moving
UAE
KSA
Morocco
PakistanEgypt
Source: Digital Evolution Index 2017, The Fletcher School at Tufts University and Mastercard, Etisalat
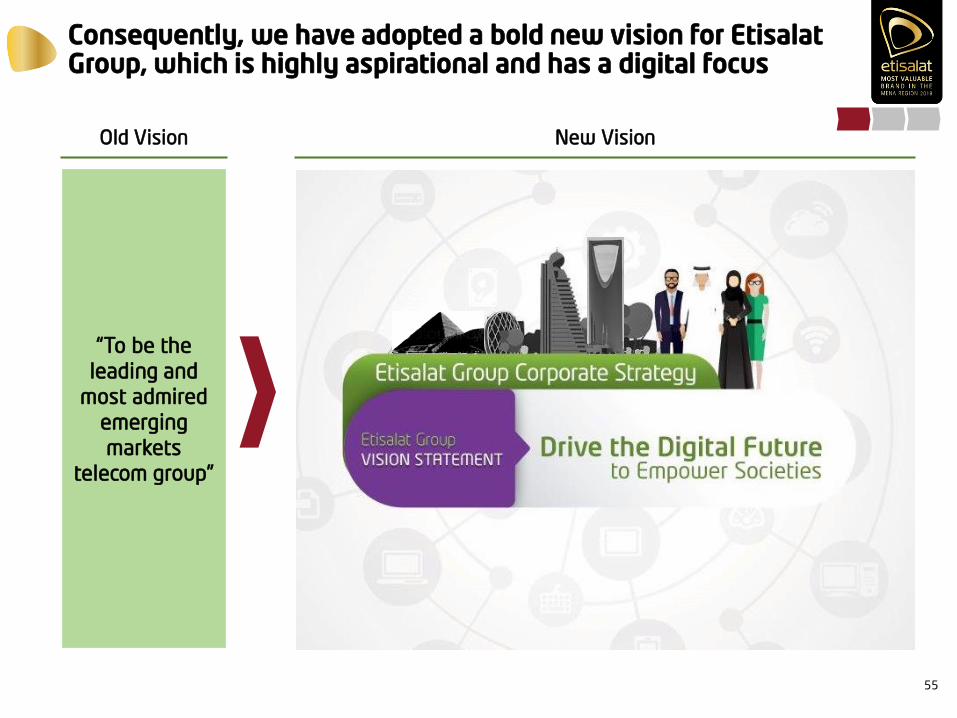
Consequently, we have adopted a bold new vision for Etisalat Group, which is highly aspirational and has a digital focus
55
Old Vision New Vision
“To be the
leading and
most admired
emerging
markets
telecom group”
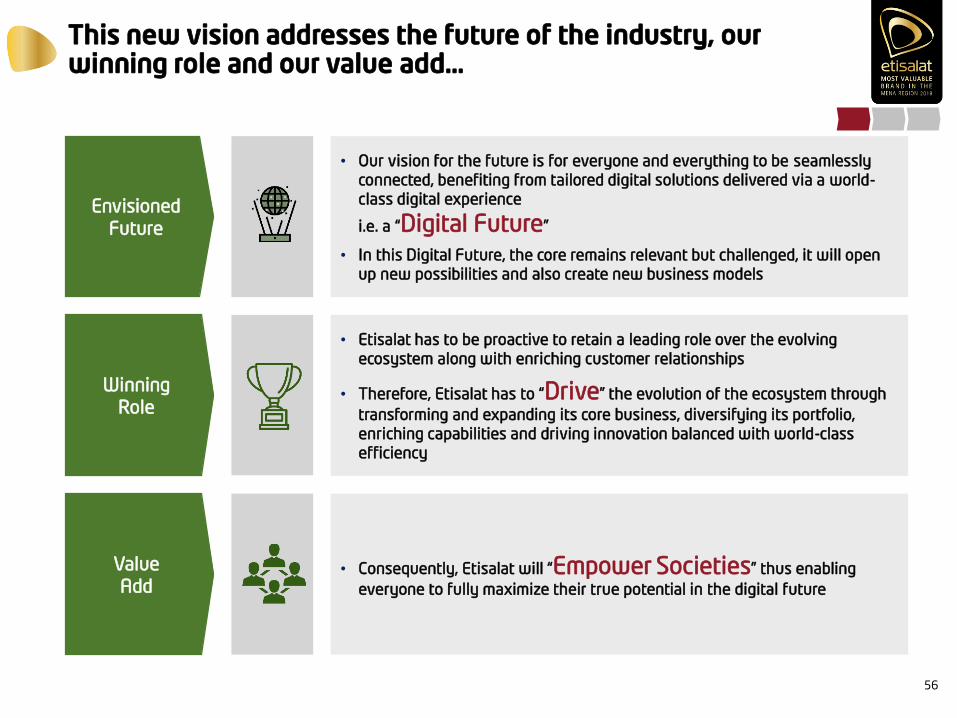
This new vision addresses the future of the industry, our winning role and our value add…
56
• Our vision for the future is for everyone and everything to be seamlessly
connected, benefiting from tailored digital solutions delivered via a world-
class digital experience
i.e. a “Digital Future”
• In this Digital Future, the core remains relevant but challenged, it will open
up new possibilities and also create new business models
• Etisalat has to be proactive to retain a leading role over the evolving
ecosystem along with enriching customer relationships
• Therefore, Etisalat has to “Drive” the evolution of the ecosystem through
transforming and expanding its core business, diversifying its portfolio,
enriching capabilities and driving innovation balanced with world-class
efficiency
• Consequently, Etisalat will “Empower Societies” thus enabling
everyone to fully maximize their true potential in the digital future
Envisioned
Future
Winning
Role
Value
Add
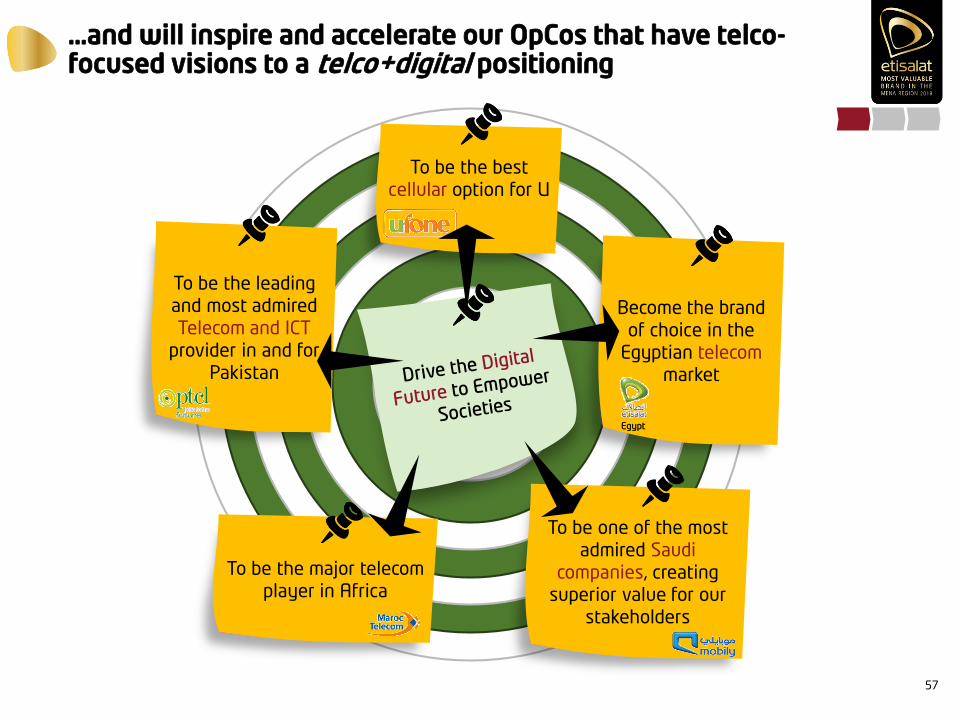
…and will inspire and accelerate our OpCos that have telco-focused visions to a telco+digital positioning
57
To be the leading
and most admired
Telecom and ICT
provider in and for
Pakistan
To be the best
cellular option for U
Become the brand
of choice in the
Egyptian telecom
market
To be one of the most
admired Saudi
companies, creating
superior value for our
stakeholders
Egypt
To be the major telecom
player in Africa
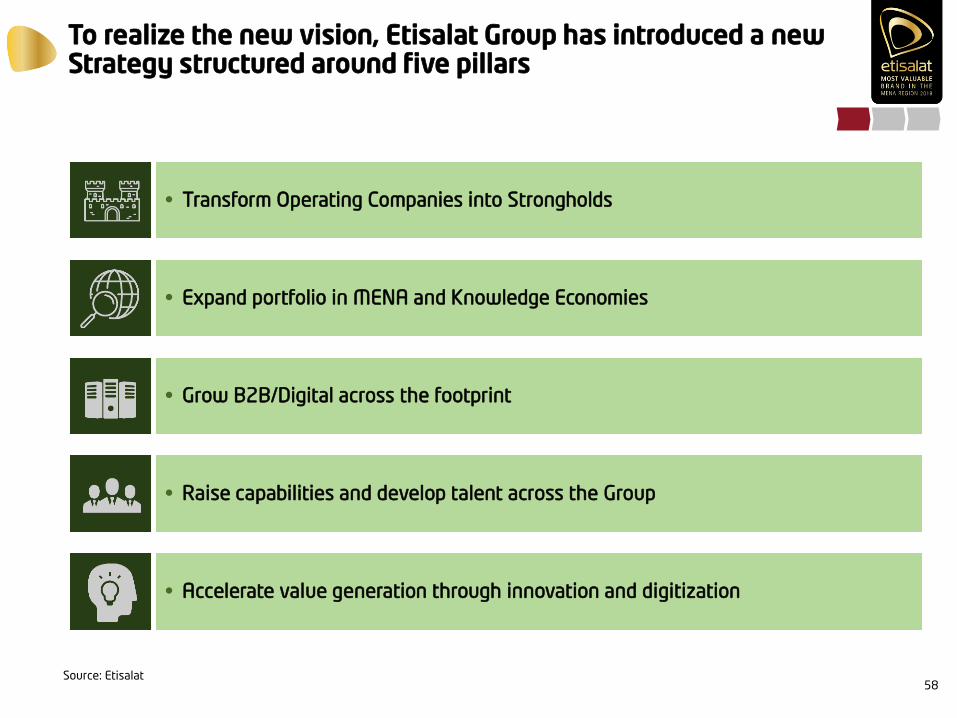
To realize the new vision, Etisalat Group has introduced a new Strategy structured around five pillars
58
• Transform Operating Companies into Strongholds
• Expand portfolio in MENA and Knowledge Economies
• Grow B2B/Digital across the footprint
• Raise capabilities and develop talent across the Group
• Accelerate value generation through innovation and digitization
Source: Etisalat
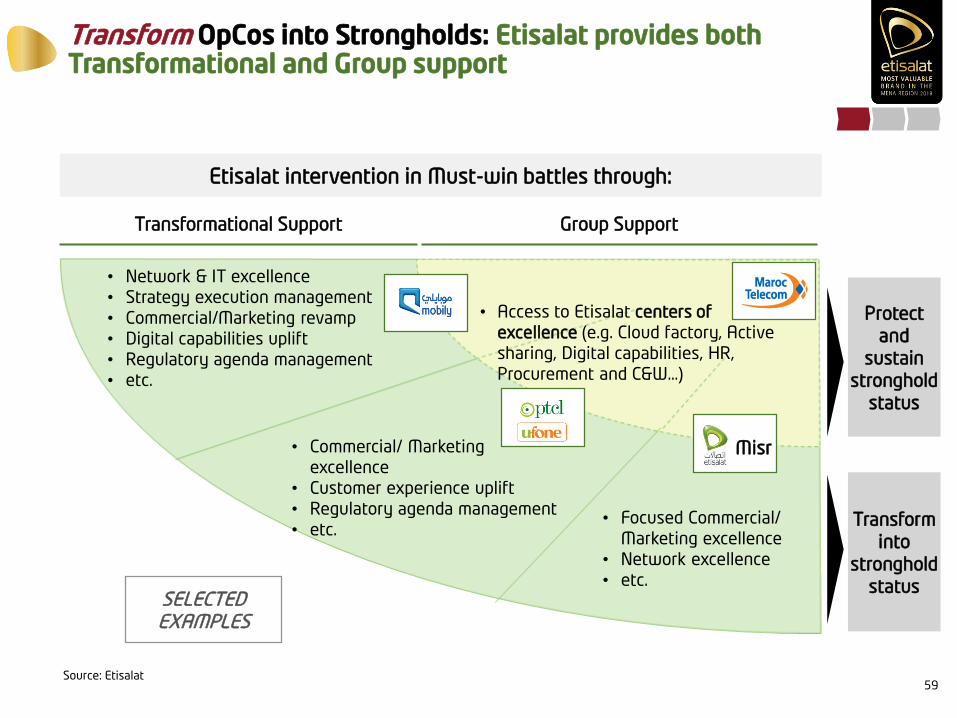
Transform OpCos into Strongholds: Etisalat provides both Transformational and Group support
59
Transformational Support Group Support
Etisalat intervention in Must-win battles through:
Misr
Transform
into
stronghold
status
Protect
and
sustain
stronghold
status
• Network & IT excellence
• Strategy execution management
• Commercial/Marketing revamp
• Digital capabilities uplift
• Regulatory agenda management
• etc.
• Commercial/ Marketing
excellence
• Customer experience uplift
• Regulatory agenda management
• etc.• Focused Commercial/
Marketing excellence
• Network excellence
• etc.
• Access to Etisalat centers of
excellence (e.g. Cloud factory, Active
sharing, Digital capabilities, HR,
Procurement and C&W…)
SELECTED EXAMPLES
Source: Etisalat
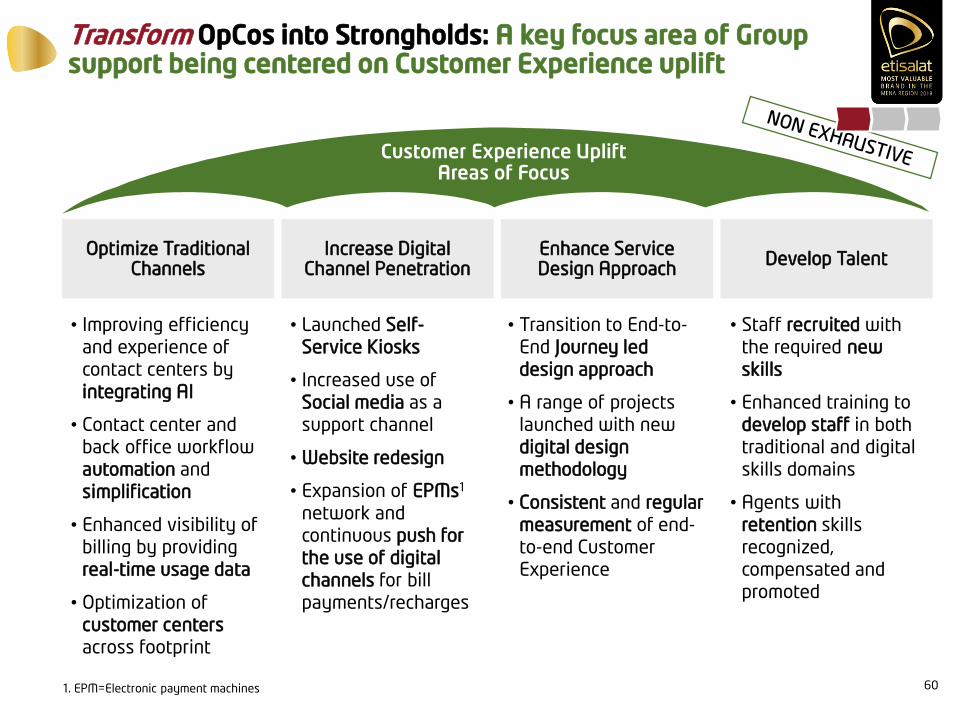
Transform OpCos into Strongholds: A key focus area of Group support being centered on Customer Experience uplift
601. EPM=Electronic payment machines
Optimize Traditional Channels
Develop TalentEnhance Service Design Approach
Increase Digital Channel Penetration
• Improving efficiency
and experience of
contact centers by
integrating AI
• Contact center and
back office workflow
automation and
simplification
• Enhanced visibility of
billing by providing
real-time usage data
• Optimization of
customer centers
across footprint
• Staff recruited with
the required new
skills
• Enhanced training to
develop staff in both
traditional and digital
skills domains
• Agents with
retention skills
recognized,
compensated and
promoted
• Transition to End-to-
End Journey led
design approach
• A range of projects
launched with new
digital design
methodology
• Consistent and regular
measurement of end-
to-end Customer
Experience
• Launched Self-
Service Kiosks
• Increased use of
Social media as a
support channel
• Website redesign
• Expansion of EPMs1
network and
continuous push for
the use of digital
channels for bill
payments/recharges
Customer Experience UpliftAreas of Focus
61
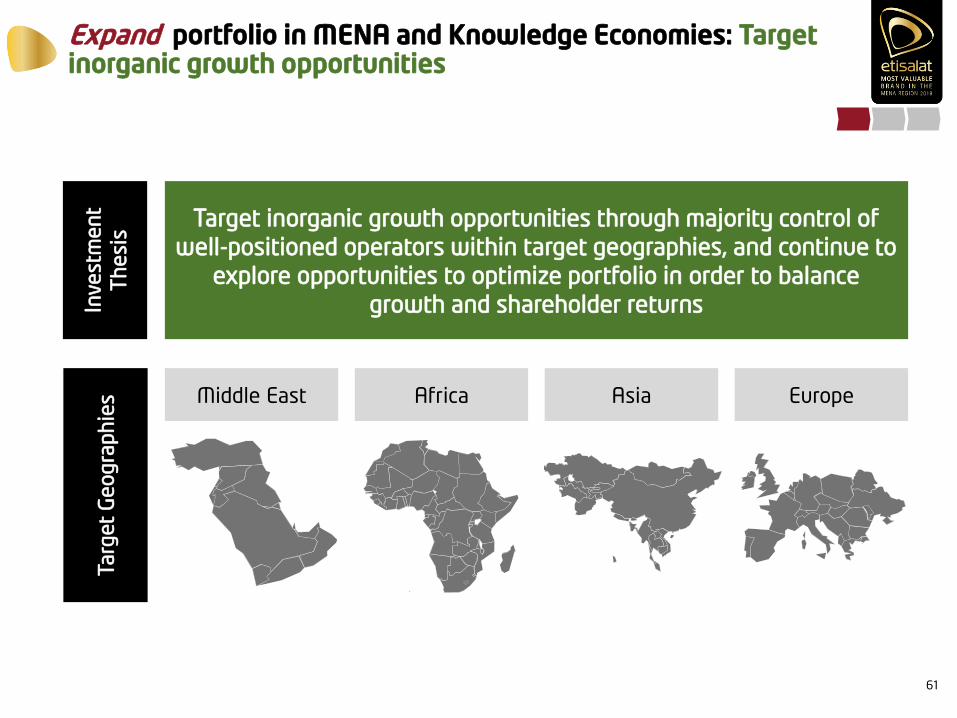
Expand portfolio in MENA and Knowledge Economies: Target inorganic growth opportunities
Target inorganic growth opportunities through majority control of
well-positioned operators within target geographies, and continue to
explore opportunities to optimize portfolio in order to balance
growth and shareholder returnsInve
stm
en
t
Th
esi
sTarg
et
Ge
og
raph
ies Middle East Africa Asia Europe
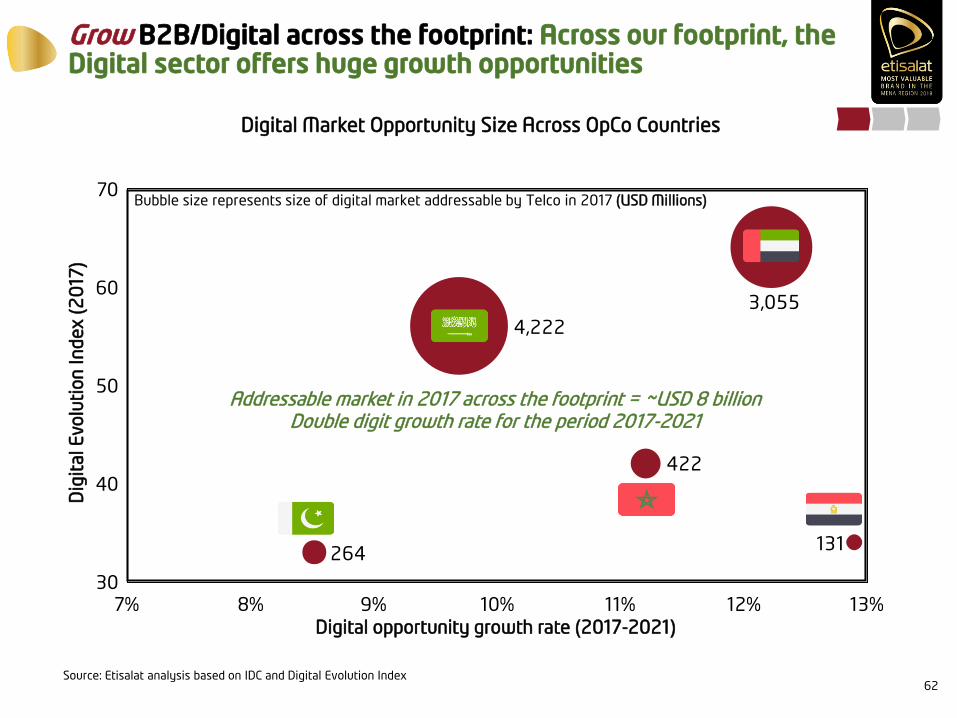
Grow B2B/Digital across the footprint: Across our footprint, the Digital sector offers huge growth opportunities
62
Digital Market Opportunity Size Across OpCo Countries
Bubble size represents size of digital market addressable by Telco in 2017 (USD Millions)
422
131264
3,055
4,222
60
70
50
40
10%9% 11% 12% 13%30
8%7%
3,055
Addressable market in 2017 across the footprint = ~USD 8 billionDouble digit growth rate for the period 2017-2021
Dig
ital E
volu
tion
In
dex (
20
17)
Digital opportunity growth rate (2017-2021)
Source: Etisalat analysis based on IDC and Digital Evolution Index
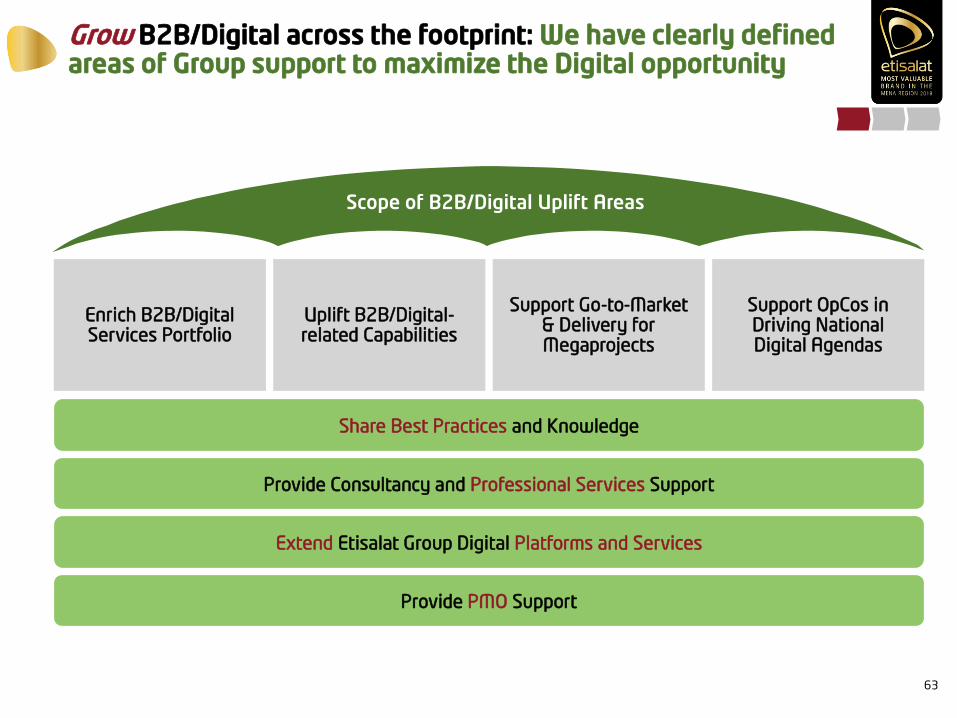
Grow B2B/Digital across the footprint: We have clearly defined areas of Group support to maximize the Digital opportunity
63
Enrich B2B/Digital Services Portfolio
Support OpCos in Driving National Digital Agendas
Support Go-to-Market & Delivery for Megaprojects
Uplift B2B/Digital-related Capabilities
Scope of B2B/Digital Uplift Areas
Share Best Practices and Knowledge
Provide Consultancy and Professional Services Support
Extend Etisalat Group Digital Platforms and Services
Provide PMO Support
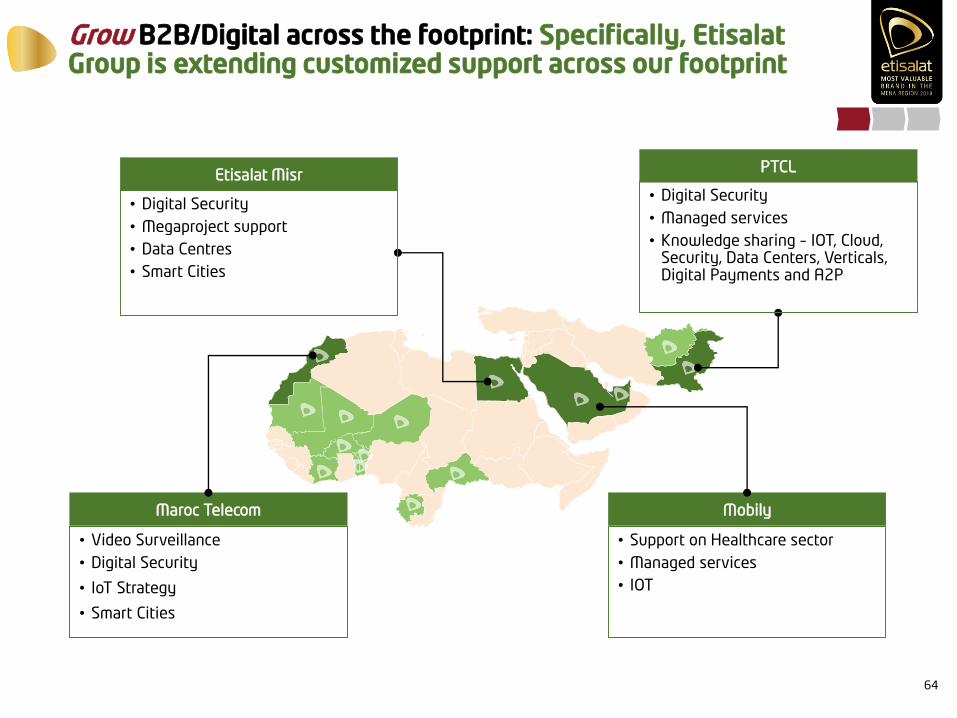
Grow B2B/Digital across the footprint: Specifically, Etisalat Group is extending customized support across our footprint
64
Etisalat MisrPTCL
Maroc Telecom Mobily
• Digital Security
• Megaproject support
• Data Centres
• Smart Cities
• Digital Security
• Managed services
• Knowledge sharing – IOT, Cloud, Security, Data Centers, Verticals, Digital Payments and A2P
• Video Surveillance
• Digital Security
• IoT Strategy
• Smart Cities
• Support on Healthcare sector
• Managed services
• IOT
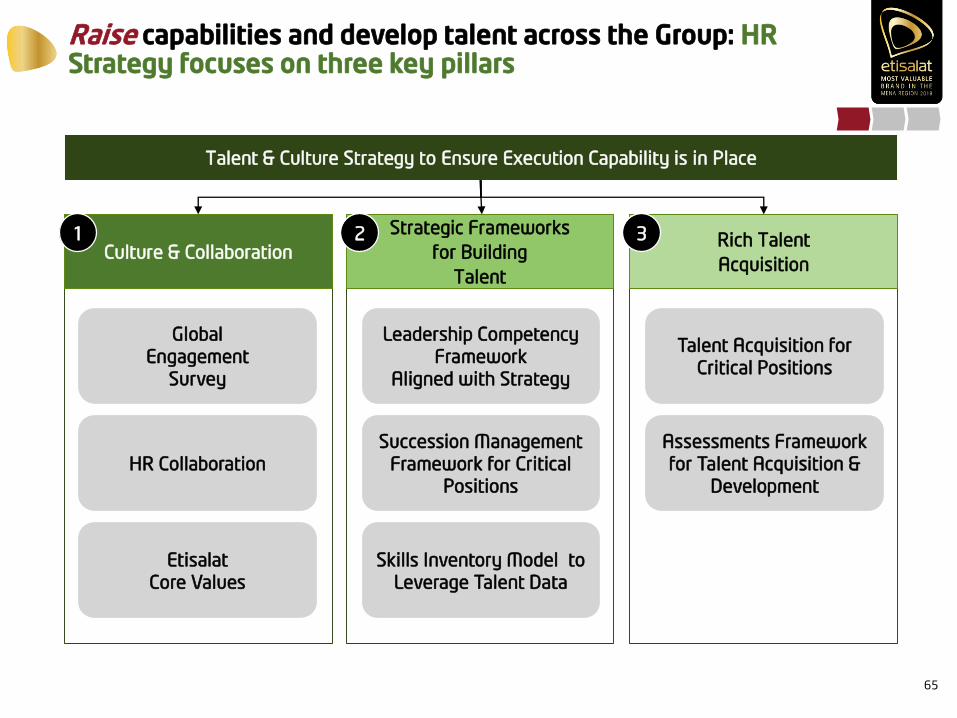
Raise capabilities and develop talent across the Group: HR Strategy focuses on three key pillars
65
Talent & Culture Strategy to Ensure Execution Capability is in Place
Culture & Collaboration
Global
Engagement
Survey
HR Collaboration
Etisalat
Core Values
1 Strategic Frameworks
for Building
Talent
Leadership Competency
Framework
Aligned with Strategy
Succession Management
Framework for Critical
Positions
Skills Inventory Model to
Leverage Talent Data
2 Rich Talent
Acquisition
Talent Acquisition for
Critical Positions
Assessments Framework
for Talent Acquisition &
Development
3
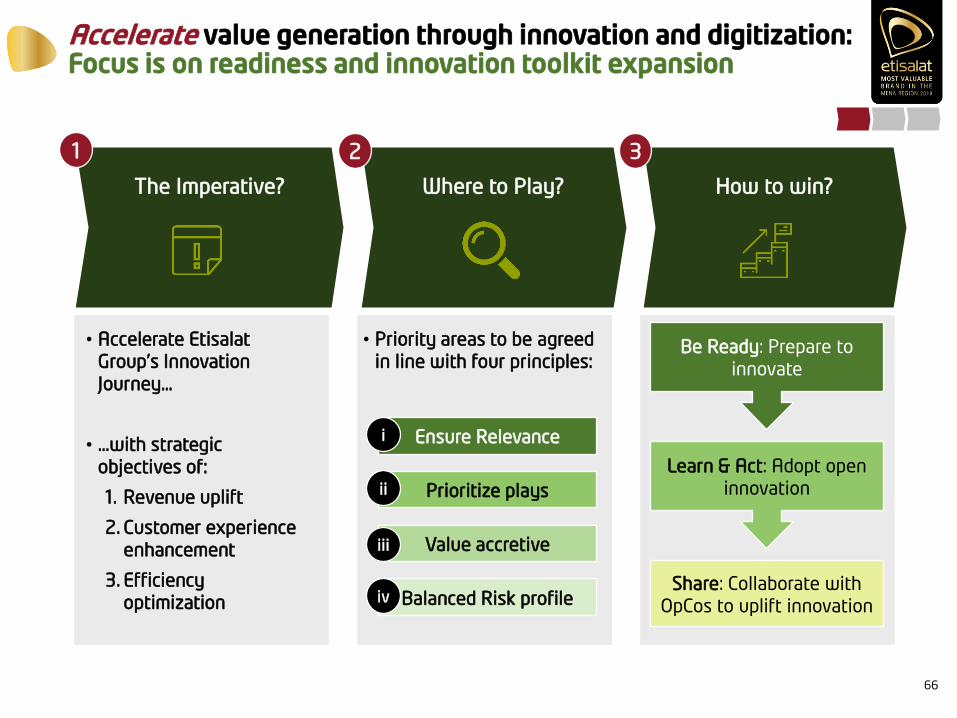
Accelerate value generation through innovation and digitization: Focus is on readiness and innovation toolkit expansion
66
Where to Play? How to win?The Imperative?
• Accelerate Etisalat
Group’s Innovation
Journey…
• …with strategic
objectives of:
1. Revenue uplift
2. Customer experience
enhancement
3. Efficiency
optimization
• Priority areas to be agreed
in line with four principles:
Ensure Relevance
Prioritize plays
Value accretive
Balanced Risk profile
i
ii
iii
iv
1 2 3
Be Ready: Prepare to
innovate
Learn & Act: Adopt open
innovation
Share: Collaborate with
OpCos to uplift innovation
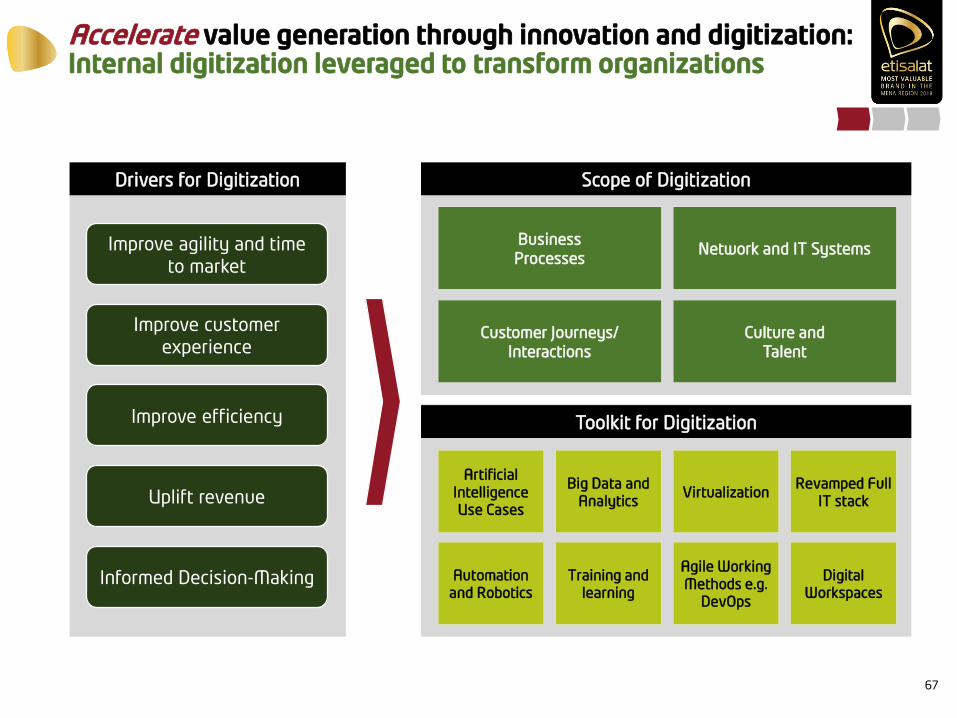
Accelerate value generation through innovation and digitization: Internal digitization leveraged to transform organizations
67
Drivers for Digitization Scope of Digitization
Toolkit for Digitization
Business
ProcessesNetwork and IT Systems
Customer Journeys/
Interactions
Culture and
Talent
Artificial
Intelligence
Use Cases
Big Data and
Analytics
Automation
and Robotics
Training and
learning
VirtualizationRevamped Full
IT stack
Agile Working
Methods e.g.
DevOps
Digital
Workspaces
Improve agility and time
to market
Improve customer
experience
Improve efficiency
Uplift revenue
Informed Decision-Making

Accelerate value generation through innovation and digitization: With specific internal digitization initiatives underway
68
NON EXHAUSTIVE
Network Modernization: Continued roll-out of our NFV and SDN plans
Big Data : Multiple use cases centered on e.g. real time applications (location based, event
based campaigns) and analytics (e.g. fraud detection, cost optimization, segmentation)
AI: Multiple use cases centered on e.g. Consumer Cognitive Automation (Chatbot) and
Business Cognitive Automation
Robotics Process Automation: Focus on processes across multiple domains, including:
contact center, network, B2B and sales
Future Networks: Preparation for 5G (three main use cases: eMBB, mMTC and URLLC),
focused roll-out of NB-IOT, video delivery optimization etc.
Digital Talent: Focus on both development and acquisition of digital talent in key areas
e.g. Big Data, AI, service design, virtualization etc.
Source: Etisalat; eMBB = enhanced Mobile Broadband, mMTC = massive Machine Type Communications, URLLC Ultra-Reliable and Low Latency Communications)
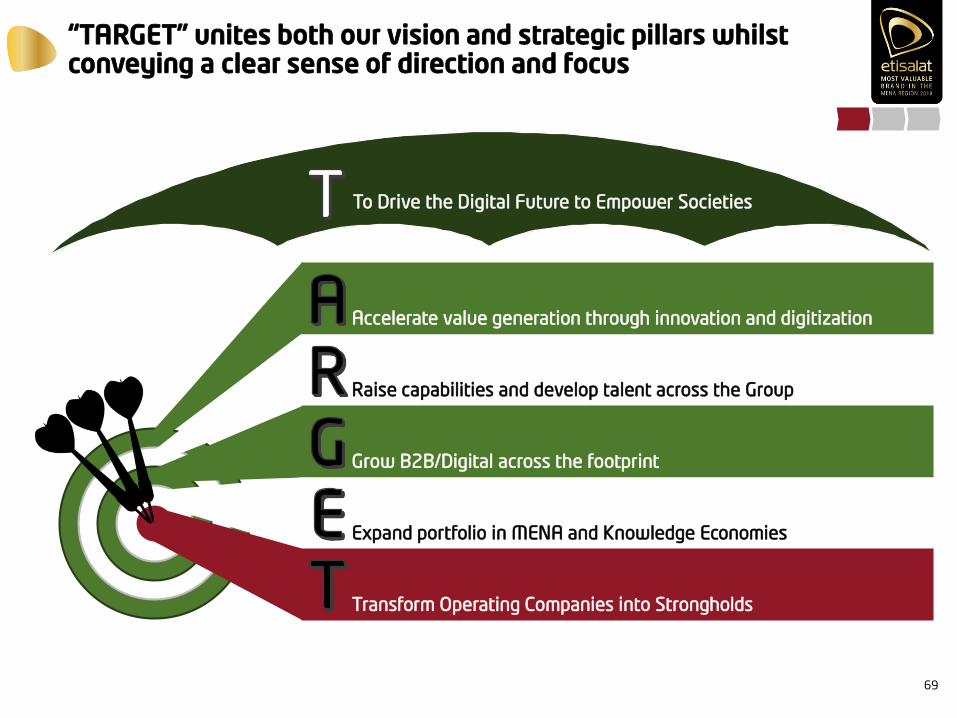
“TARGET” unites both our vision and strategic pillars whilst conveying a clear sense of direction and focus
69
Accelerate value generation through innovation and digitization
Raise capabilities and develop talent across the Group
Grow B2B/Digital across the footprint
Expand portfolio in MENA and Knowledge Economies
Transform Operating Companies into Strongholds
To Drive the Digital Future to Empower Societies
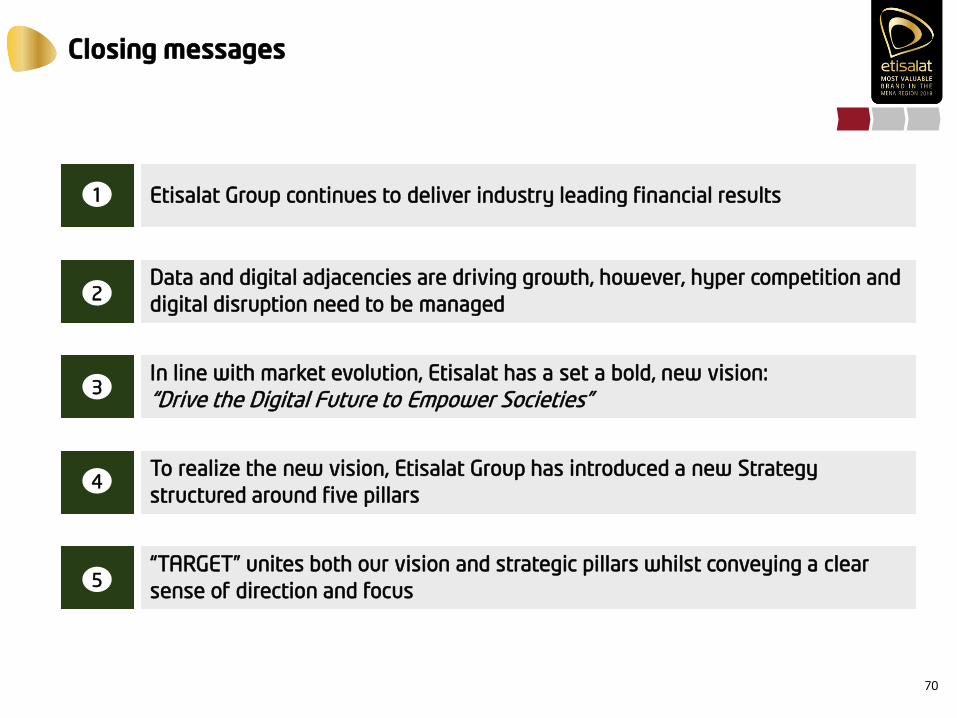
Closing messages
70
Etisalat Group continues to deliver industry leading financial results1
Data and digital adjacencies are driving growth, however, hyper competition and
digital disruption need to be managed2
In line with market evolution, Etisalat has a set a bold, new vision:
“Drive the Digital Future to Empower Societies”3
To realize the new vision, Etisalat Group has introduced a new Strategy
structured around five pillars 4
“TARGET” unites both our vision and strategic pillars whilst conveying a clear
sense of direction and focus5
THANK YOU
Q&A
Etisalat GroupCapital Markets Day 2018
Etisalat UAE Consumer Overview
Khaled Elkhouly
Chief Consumer Officer – Etisalat UAE
Key Highlights FY2017
Source: xxx
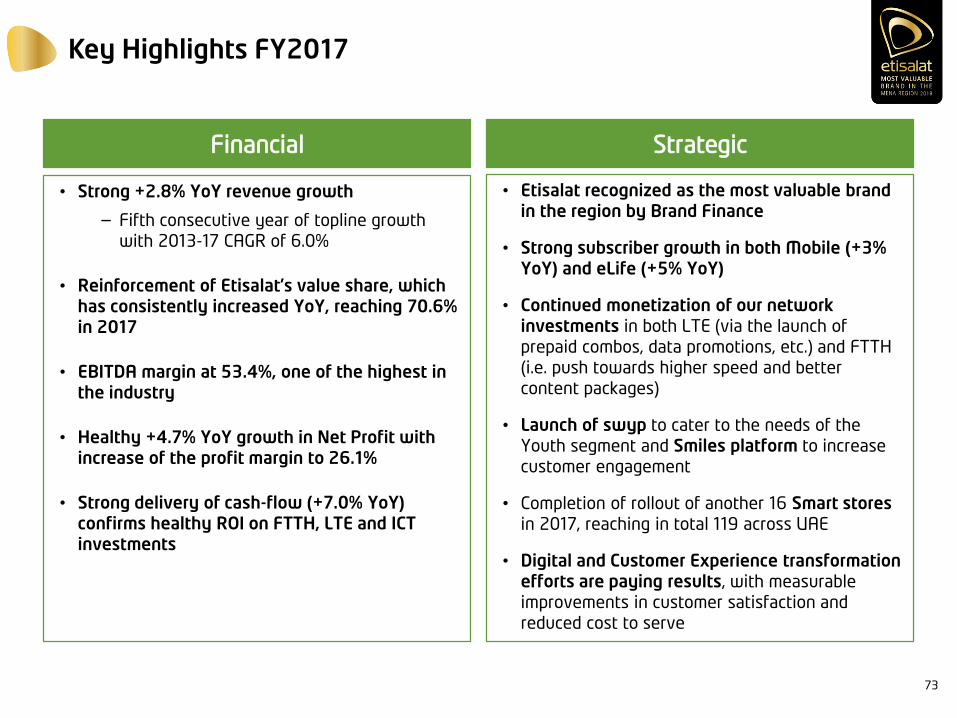
• Strong +2.8% YoY revenue growth
– Fifth consecutive year of topline growth
with 2013-17 CAGR of 6.0%
• Reinforcement of Etisalat’s value share, which has consistently increased YoY, reaching 70.6% in 2017
• EBITDA margin at 53.4%, one of the highest in the industry
• Healthy +4.7% YoY growth in Net Profit with increase of the profit margin to 26.1%
• Strong delivery of cash-flow (+7.0% YoY) confirms healthy ROI on FTTH, LTE and ICT investments
• Etisalat recognized as the most valuable brand in the region by Brand Finance
• Strong subscriber growth in both Mobile (+3% YoY) and eLife (+5% YoY)
• Continued monetization of our network investments in both LTE (via the launch of
prepaid combos, data promotions, etc.) and FTTH
(i.e. push towards higher speed and better
content packages)
• Launch of swyp to cater to the needs of the
Youth segment and Smiles platform to increase
customer engagement
• Completion of rollout of another 16 Smart stores in 2017, reaching in total 119 across UAE
• Digital and Customer Experience transformation efforts are paying results, with measurable
improvements in customer satisfaction and
reduced cost to serve
Financial Strategic
73
Business Review – Financial Overview
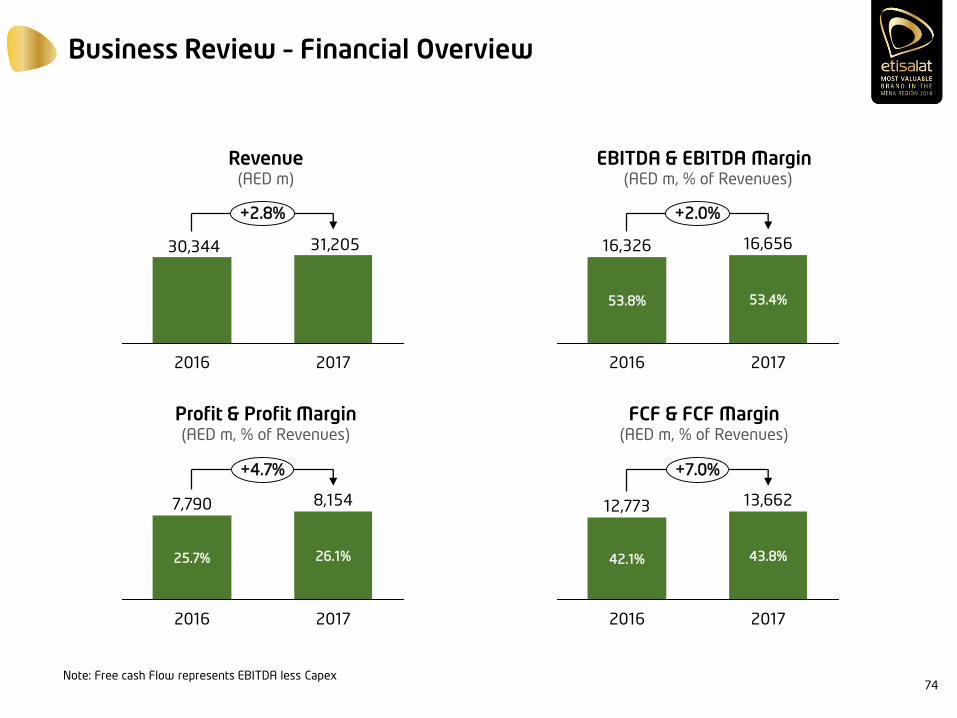
Revenue(AED m)
EBITDA & EBITDA Margin(AED m, % of Revenues)
FCF & FCF Margin(AED m, % of Revenues)
Profit & Profit Margin(AED m, % of Revenues)
74
+2.0%
2017
16,656
53.4%
2016
16,326
53.8%
7,790
25.7%
+4.7%
2017
8,154
26.1%
2016
31,20530,344
+2.8%
20172016
12,773
42.1%
+7.0%
2017
13,662
43.8%
2016
Note: Free cash Flow represents EBITDA less Capex
Despite the challenging macroeconomic context, our topline grew by 2.8% and we continued to strengthen our value share
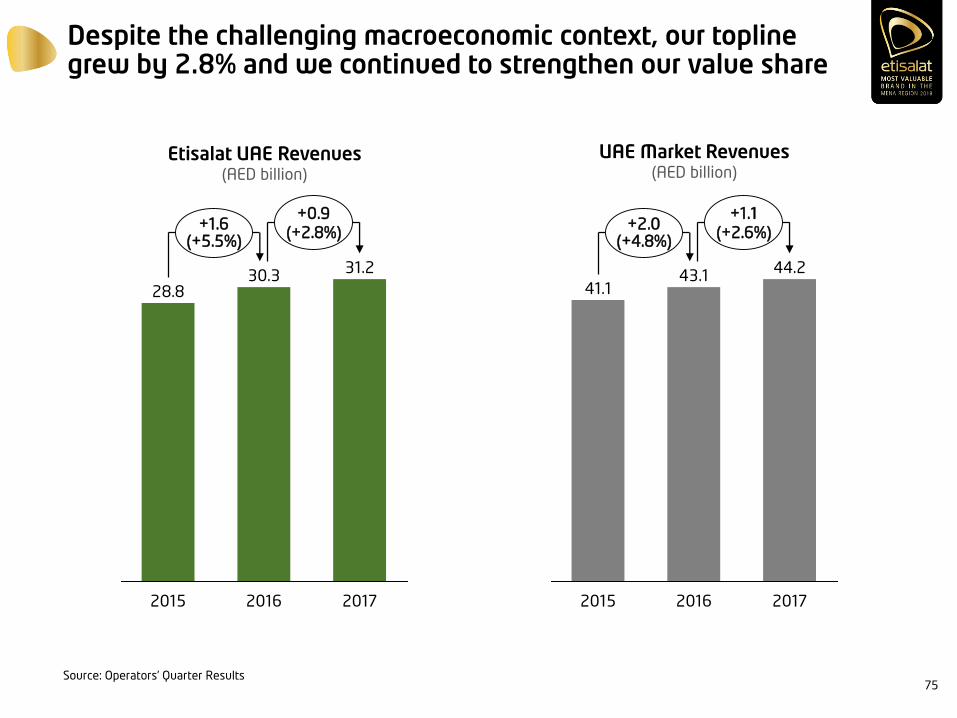
Source: Operators’ Quarter Results
2016
31.2
+1.6(+5.5%)
+0.9
(+2.8%)
2017
30.3
2015
28.8
44.2
+1.1
(+2.6%)+2.0
(+4.8%)
20172016
43.1
2015
41.1
UAE Market Revenues (AED billion)
Etisalat UAE Revenues (AED billion)
75
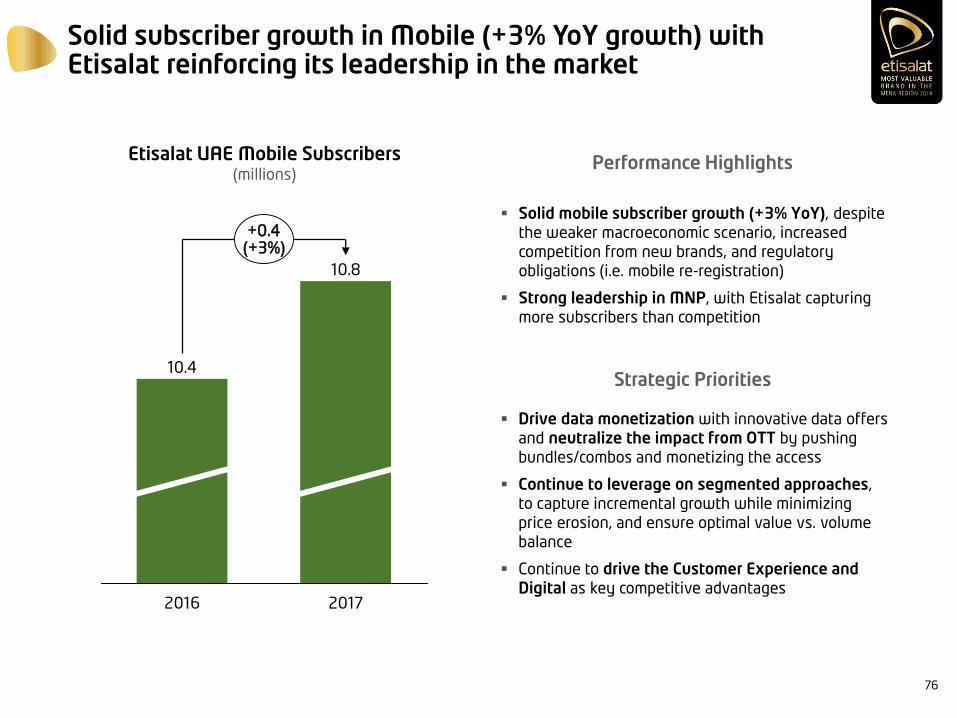
Solid subscriber growth in Mobile (+3% YoY growth) with Etisalat reinforcing its leadership in the market
Etisalat UAE Mobile Subscribers (millions)
2017
10.8
+0.4(+3%)
2016
10.4
Solid mobile subscriber growth (+3% YoY), despite
the weaker macroeconomic scenario, increased
competition from new brands, and regulatory
obligations (i.e. mobile re-registration)
Strong leadership in MNP, with Etisalat capturing
more subscribers than competition
Performance Highlights
Strategic Priorities
Drive data monetization with innovative data offers
and neutralize the impact from OTT by pushing
bundles/combos and monetizing the access
Continue to leverage on segmented approaches,
to capture incremental growth while minimizing
price erosion, and ensure optimal value vs. volume
balance
Continue to drive the Customer Experience and Digital as key competitive advantages
76
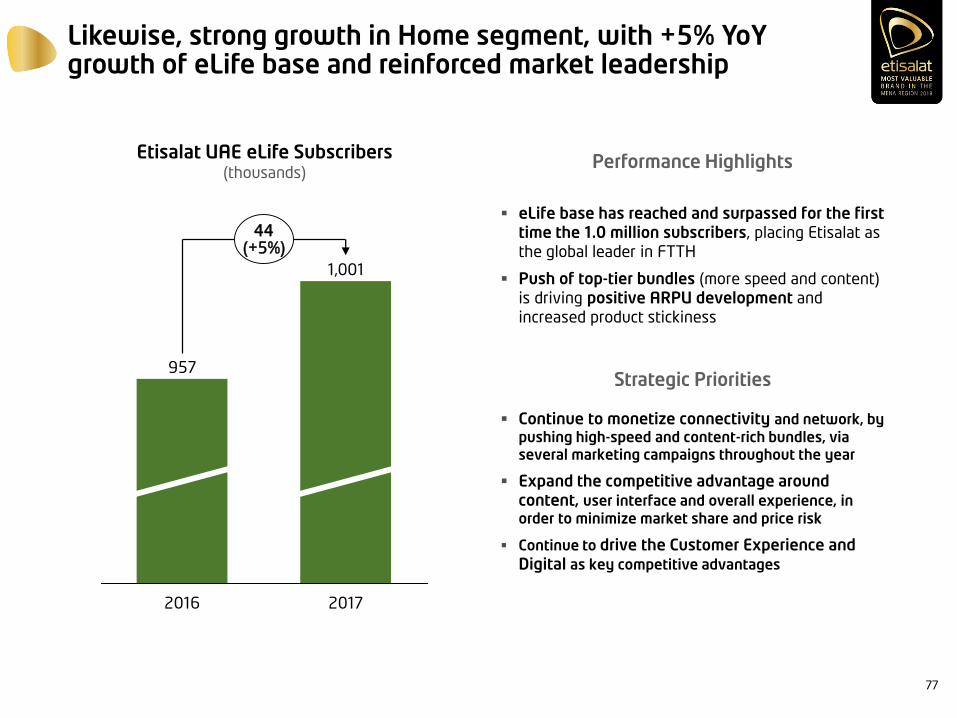
Likewise, strong growth in Home segment, with +5% YoY growth of eLife base and reinforced market leadership
Etisalat UAE eLife Subscribers (thousands)
44(+5%)
2017
1,001
2016
957
eLife base has reached and surpassed for the first time the 1.0 million subscribers, placing Etisalat as
the global leader in FTTH
Push of top-tier bundles (more speed and content)
is driving positive ARPU development and
increased product stickiness
Performance Highlights
Strategic Priorities
Continue to monetize connectivity and network, by
pushing high-speed and content-rich bundles, via several marketing campaigns throughout the year
Expand the competitive advantage around content, user interface and overall experience, in
order to minimize market share and price risk
Continue to drive the Customer Experience and Digital as key competitive advantages
77
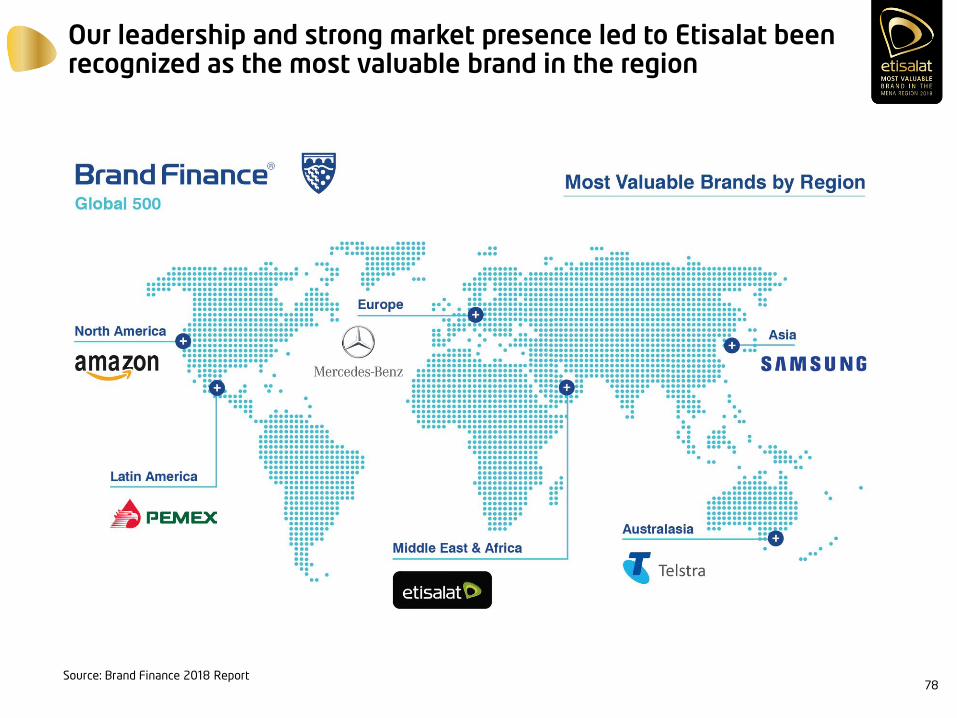
Our leadership and strong market presence led to Etisalat been recognized as the most valuable brand in the region
Source: Brand Finance 2018 Report78

In line with our segmented market approach and Digital strategy, we’ve launched swyp, a digital-first proposition
Highlights
swyp is our new brand to
target exclusively 15-29 year olds
swyp is a digital-first proposition, co-designed
with the target segment
As a result, we have a data rich proposition (mobile data
bundles and free Wi-Fi), that
also includes non-telecom benefits and perks for a
greater differentiation vs.
competition
Being restricted to 15-29
year olds, the experience and communication is mostly digital, fitting the
target audience
79
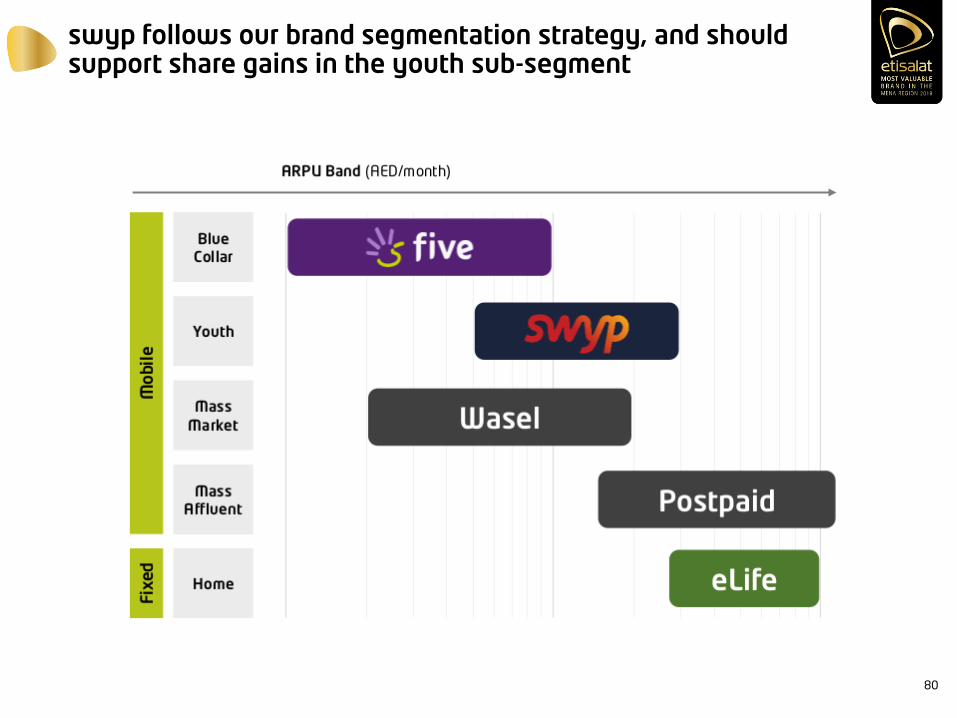
swyp follows our brand segmentation strategy, and should support share gains in the youth sub-segment
80
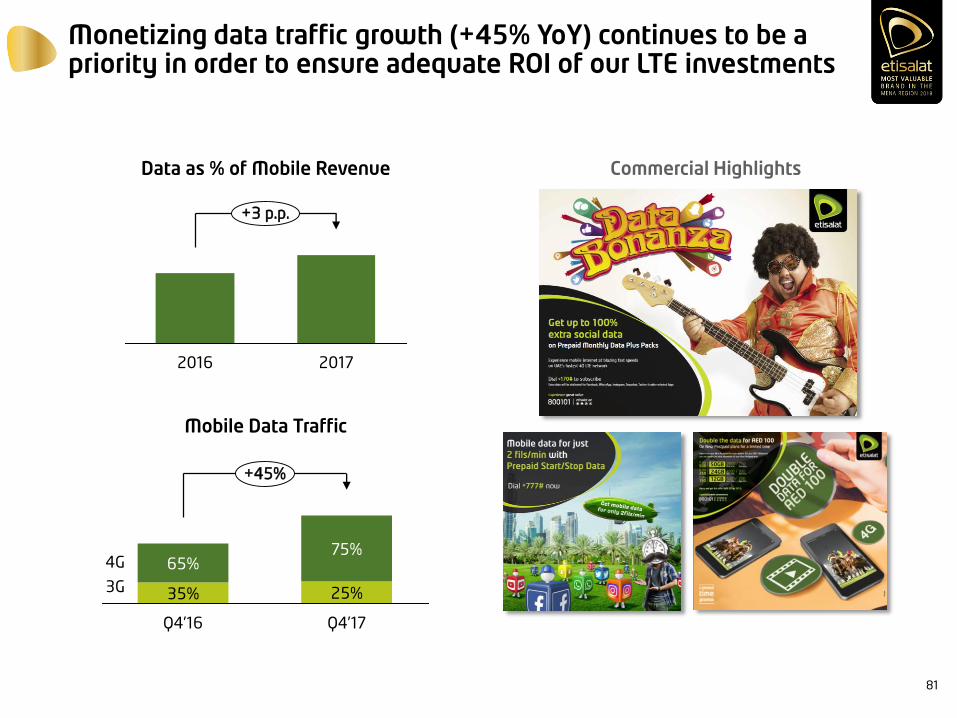
Monetizing data traffic growth (+45% YoY) continues to be a priority in order to ensure adequate ROI of our LTE investments
Data as % of Mobile Revenue
Mobile Data Traffic
+3 p.p.
20172016
35%3G
+45%
4G
25%
65%
Q4’16 Q4’17
75%
Commercial Highlights
81

Similar efforts on FTTH monetization, with strong focus on monetizing higher speeds and TV content
% of High-End 3P Bundles (% of Gross Adds)
% of customers with ≥10 Mbps (% of customers)
+7 p.p.
20172016
+9 p.p.
20172016
Commercial Highlights
82
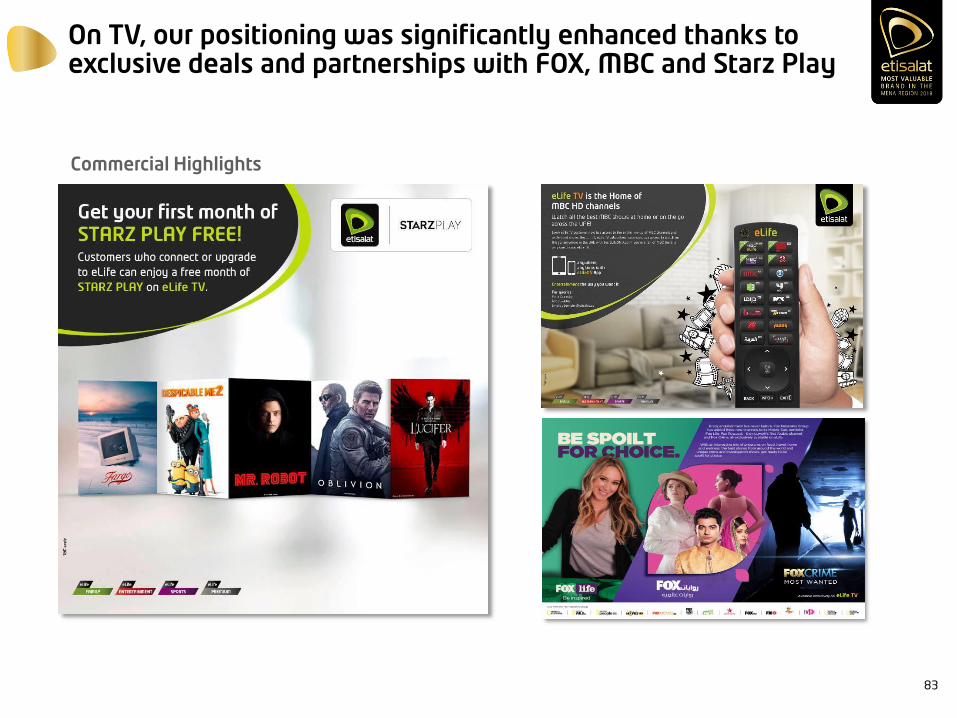
On TV, our positioning was significantly enhanced thanks to exclusive deals and partnerships with FOX, MBC and Starz Play
Commercial Highlights
83
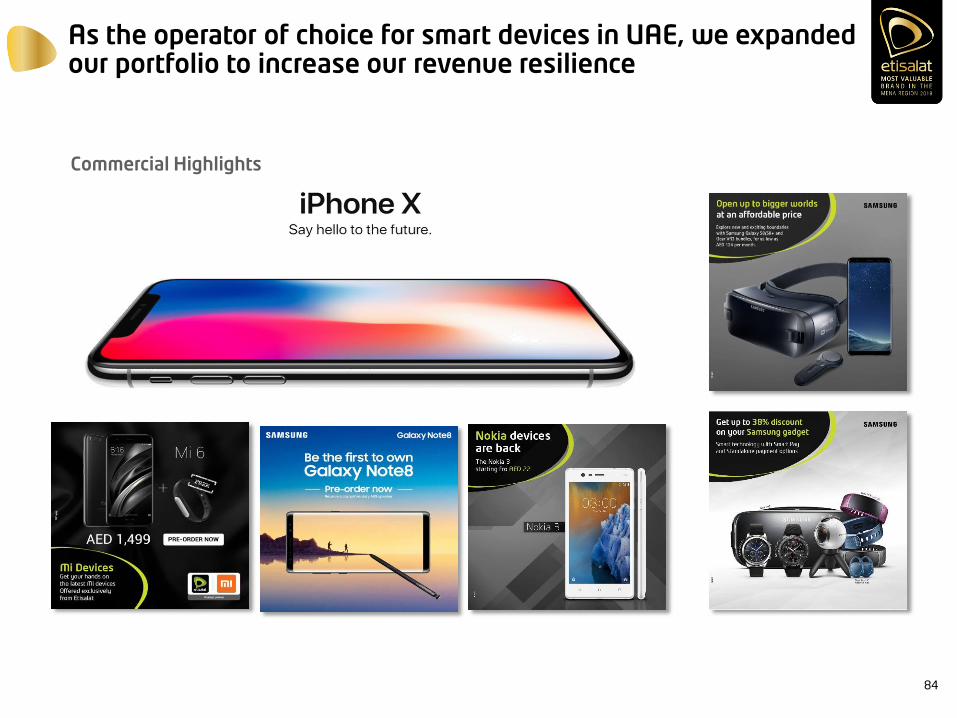
As the operator of choice for smart devices in UAE, we expanded our portfolio to increase our revenue resilience
Commercial Highlights
84
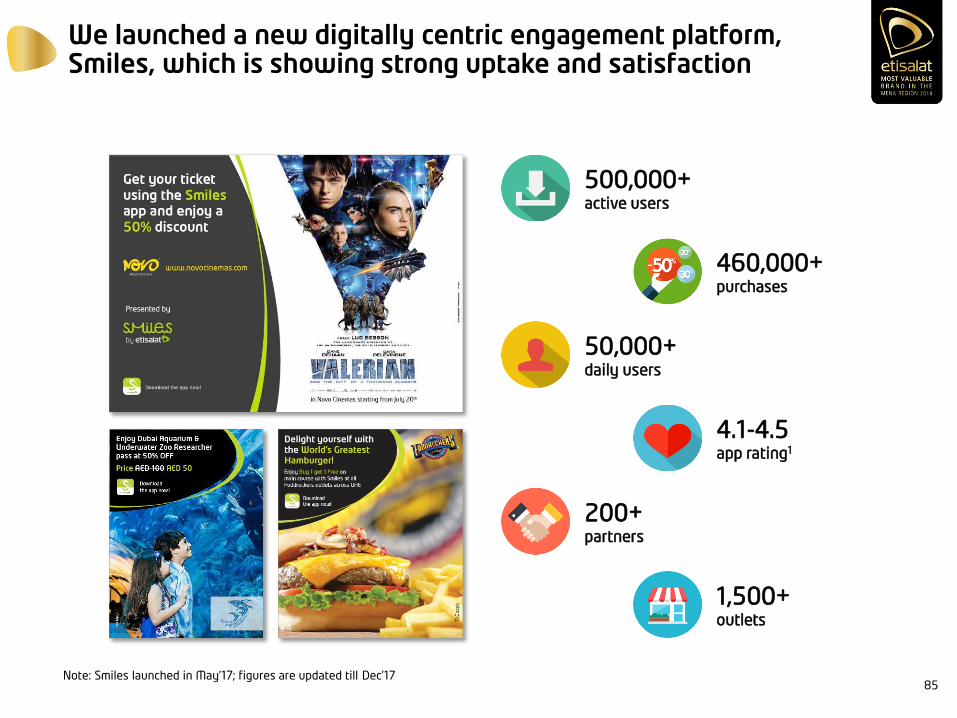
We launched a new digitally centric engagement platform, Smiles, which is showing strong uptake and satisfaction
Note: Smiles launched in May’17; figures are updated till Dec’17
500,000+active users
4.1-4.5app rating1
460,000+purchases
200+partners
50,000+daily users
1,500+outlets
85
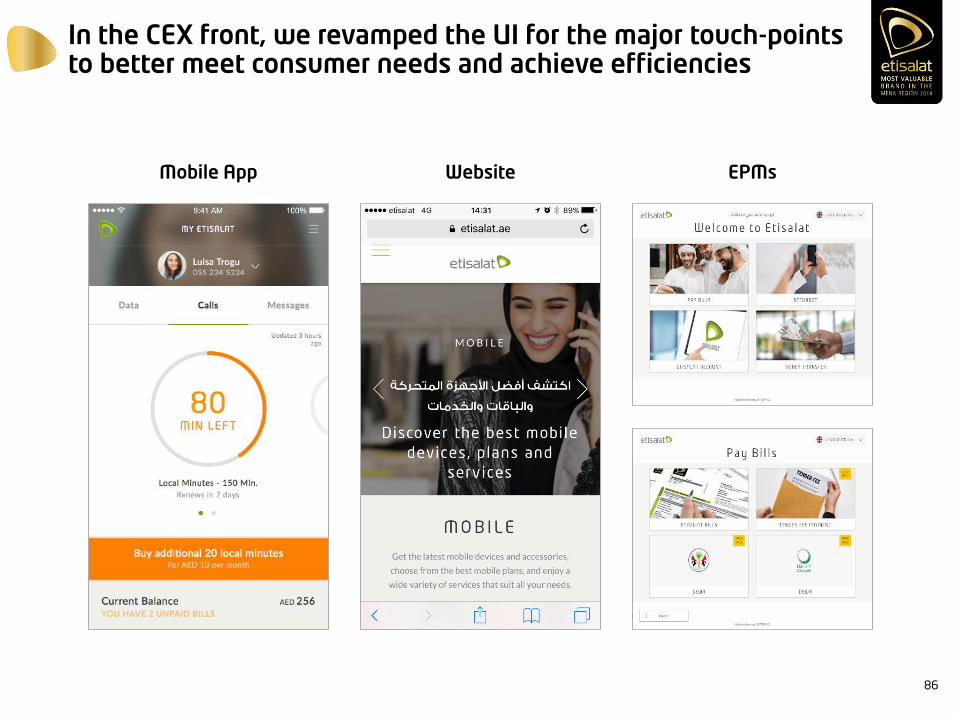
In the CEX front, we revamped the UI for the major touch-points to better meet consumer needs and achieve efficiencies
Mobile App Website EPMs
86
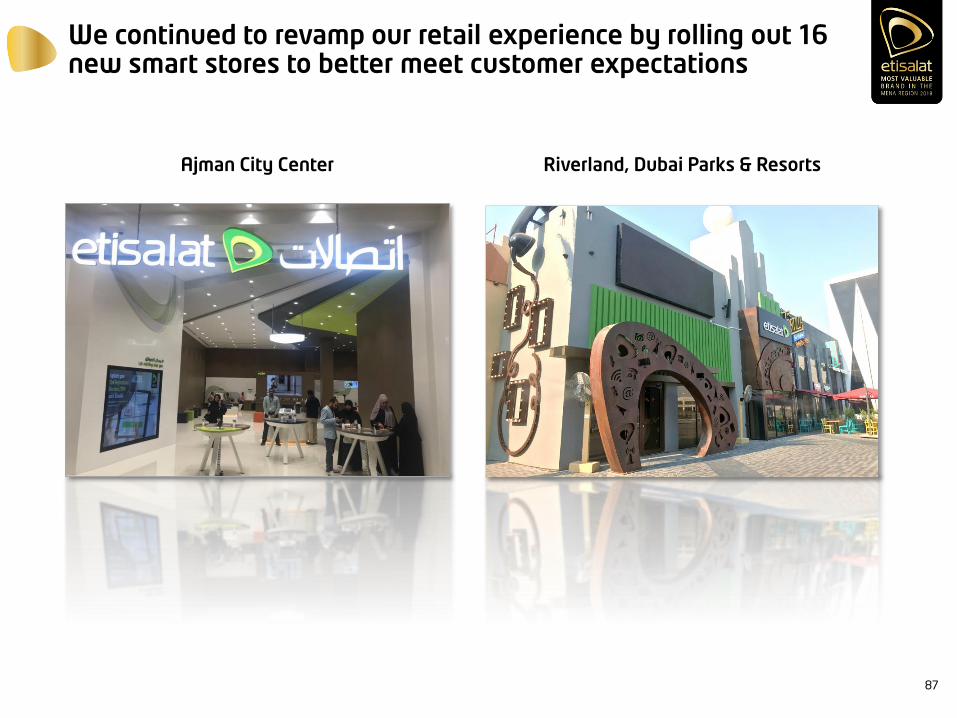
We continued to revamp our retail experience by rolling out 16 new smart stores to better meet customer expectations
Ajman City Center Riverland, Dubai Parks & Resorts
87
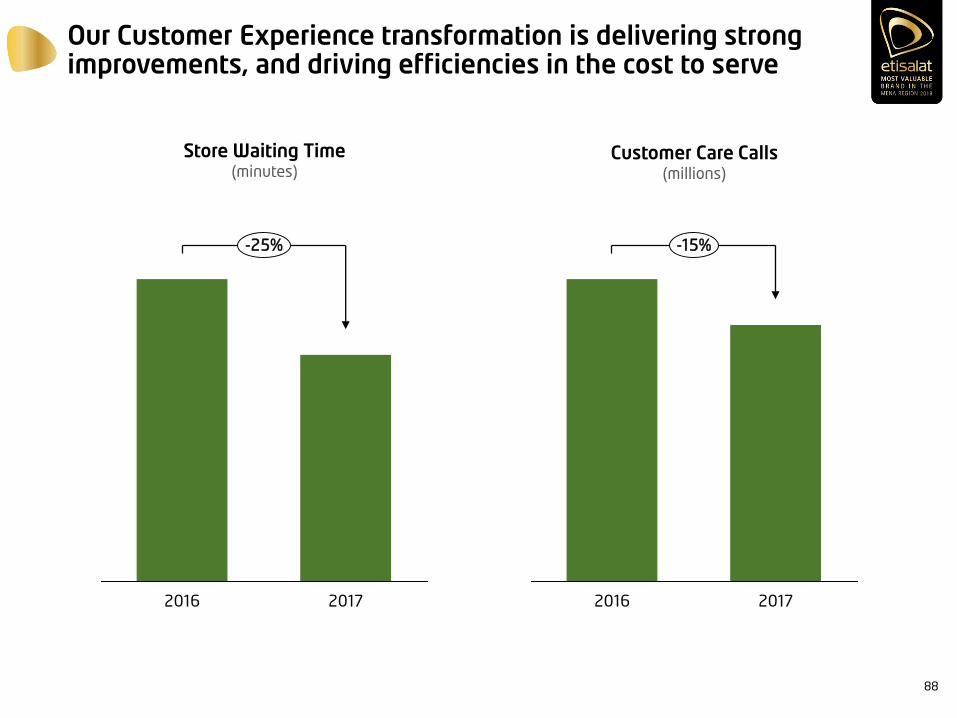
Our Customer Experience transformation is delivering strong improvements, and driving efficiencies in the cost to serve
Customer Care Calls (millions)
Store Waiting Time (minutes)
-25%
20172016
-15%
2016 2017
88
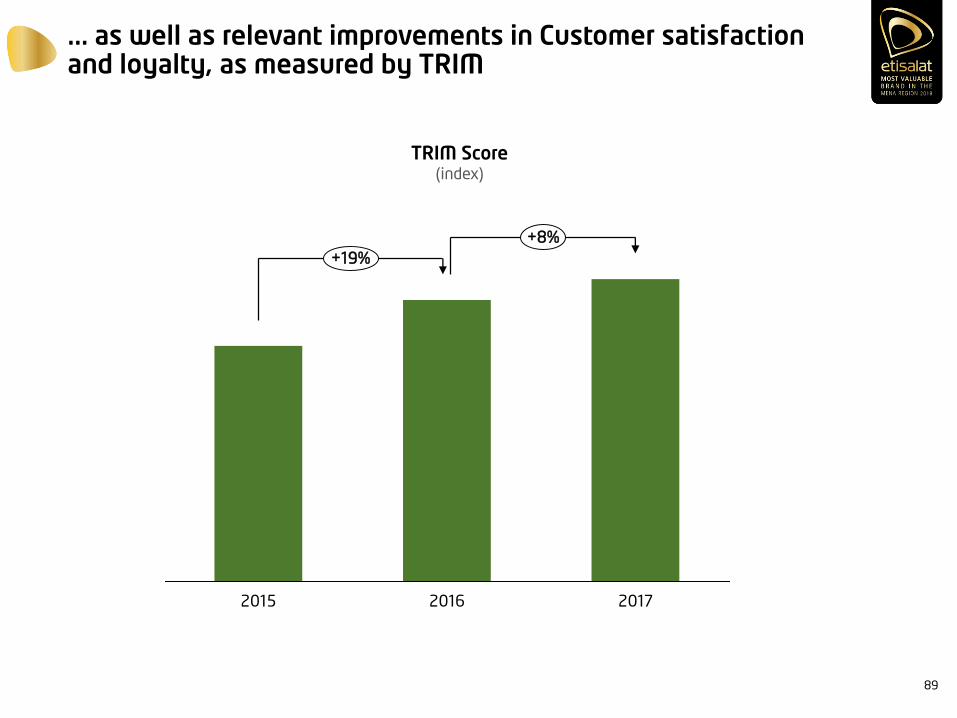
... as well as relevant improvements in Customer satisfaction and loyalty, as measured by TRIM
TRIM Score (index)
2015
+8%
+19%
2016 2017
89
In summary…
• Positive +2.8% YoY top-line growth of Net Revenues, resulting in the 5th consecutive year of growth in our turnaround story
• Etisalat was recently recognized as the most valuable brand in the region, continuing to expand its customer based (+3% YoY on mobile, +5% YoY on eLife) and reinforcing its market share
• Data monetization efforts continue to deliver good results in both mobile and fixed, ensuring an adequate ROI for the investments on LTE and FTTH
• Following the strategy to better segment our market and rise customer engagement, we have launched swyp (a “digital first” brand to cater for the needs and wants of the youth segment) and Smiles, a new digitally centric engagement platform, which is showing strong uptake and satisfaction
• Digital and Customer Experience transformation continues to deliver measurable impact, with improvements on the cost to serve, and most importantly on the Customer satisfaction and loyalty ratings
90

THANK YOU
Q&A

Etisalat GroupCapital Markets Day 2018
Etisalat UAE Business Overview
Salvador Anglada
Chief Business Officer – Etisalat UAE
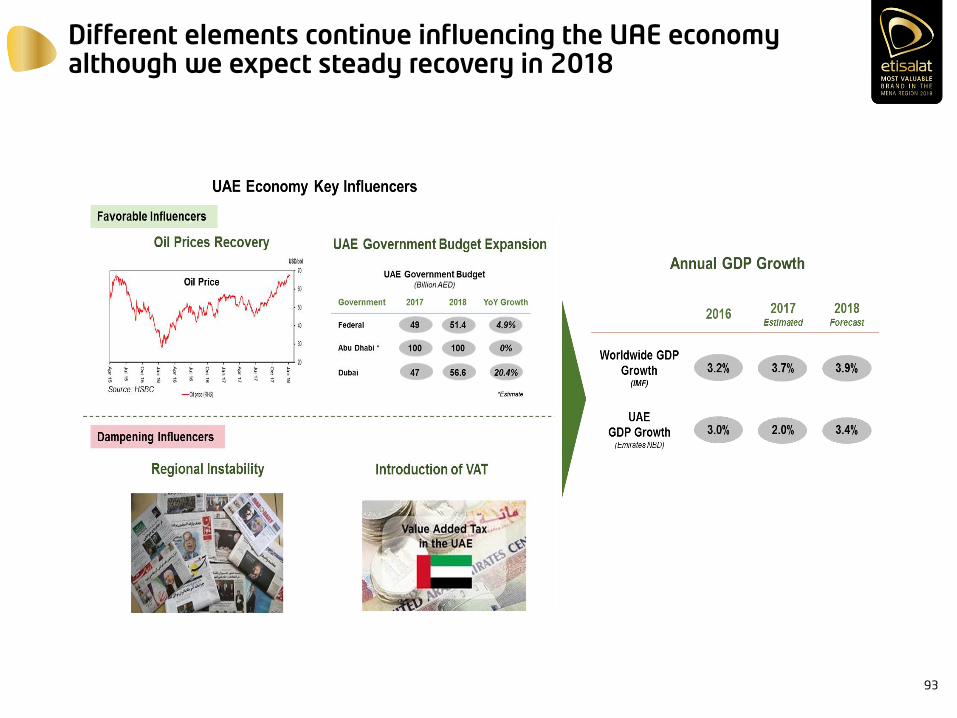
Different elements continue influencing the UAE economy although we expect steady recovery in 2018
93
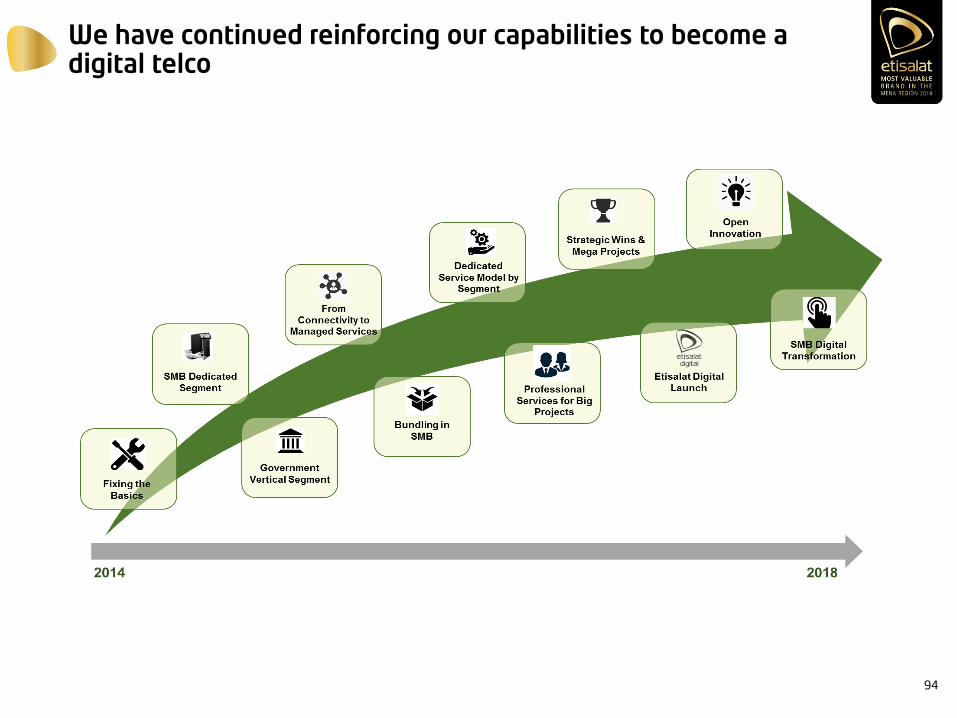
We have continued reinforcing our capabilities to become a digital telco
94
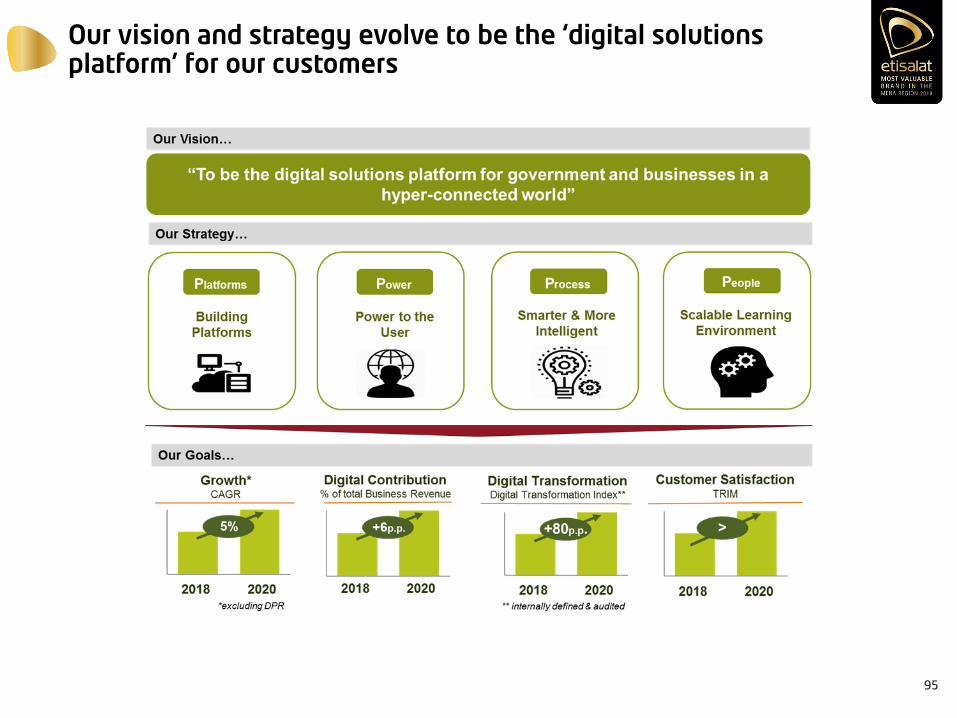
Our vision and strategy evolve to be the ‘digital solutions platform’ for our customers
95
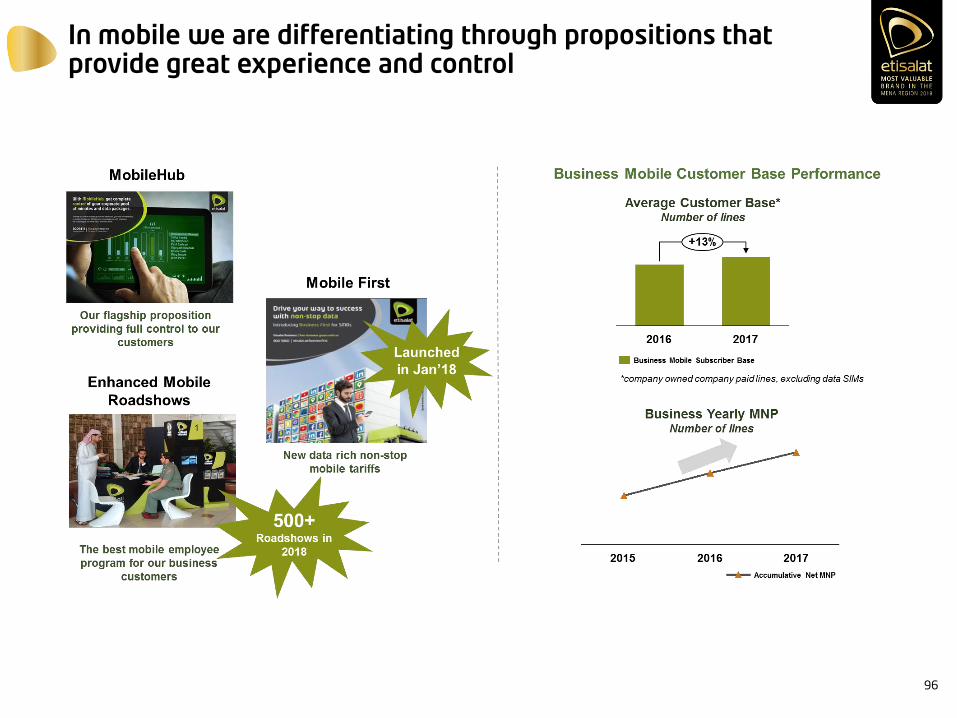
In mobile we are differentiating through propositions that provide great experience and control
96
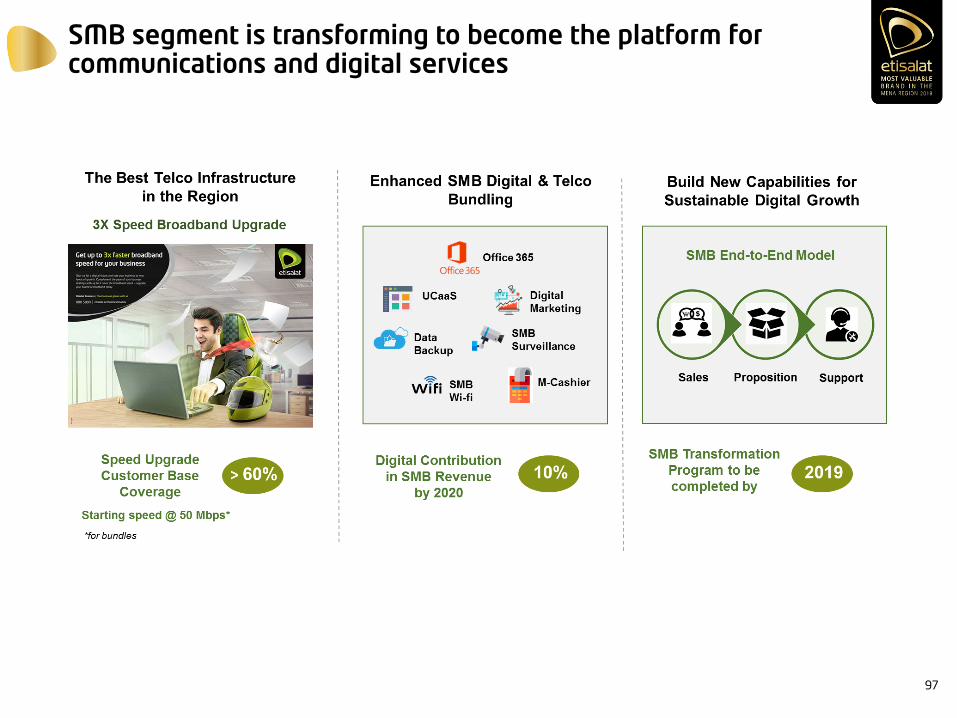
SMB segment is transforming to become the platform for communications and digital services
97
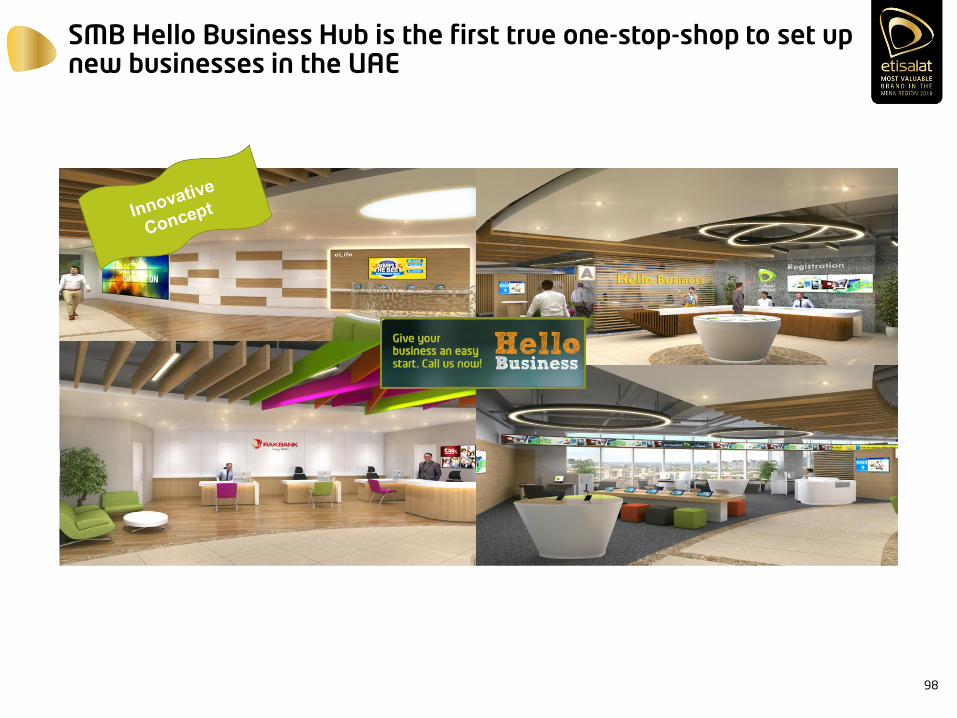
SMB Hello Business Hub is the first true one-stop-shop to set up new businesses in the UAE
98
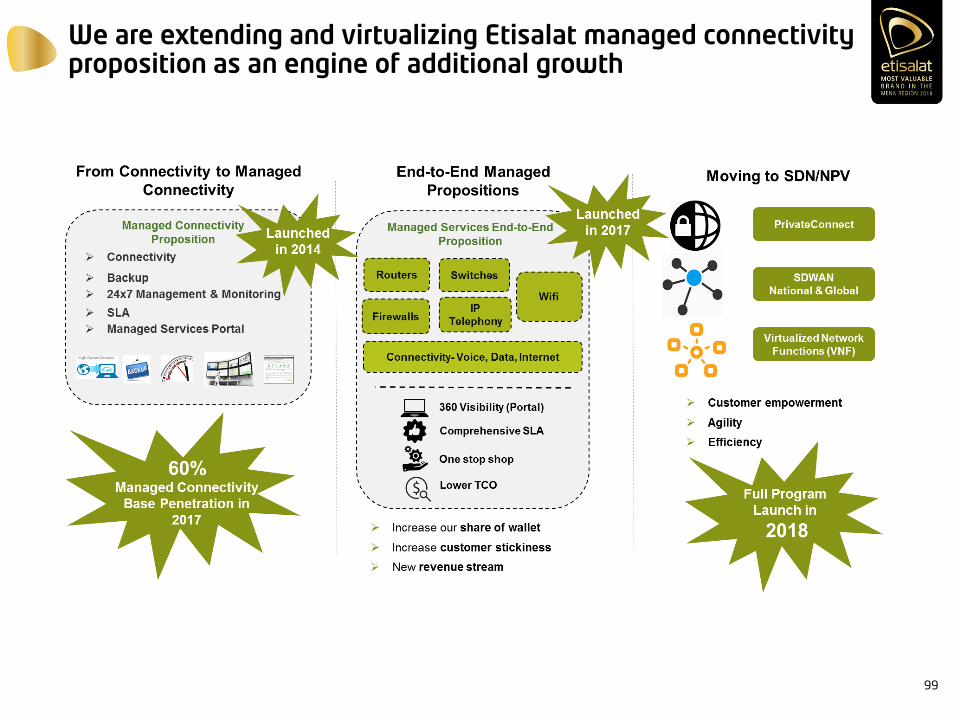
We are extending and virtualizing Etisalat managed connectivity proposition as an engine of additional growth
99
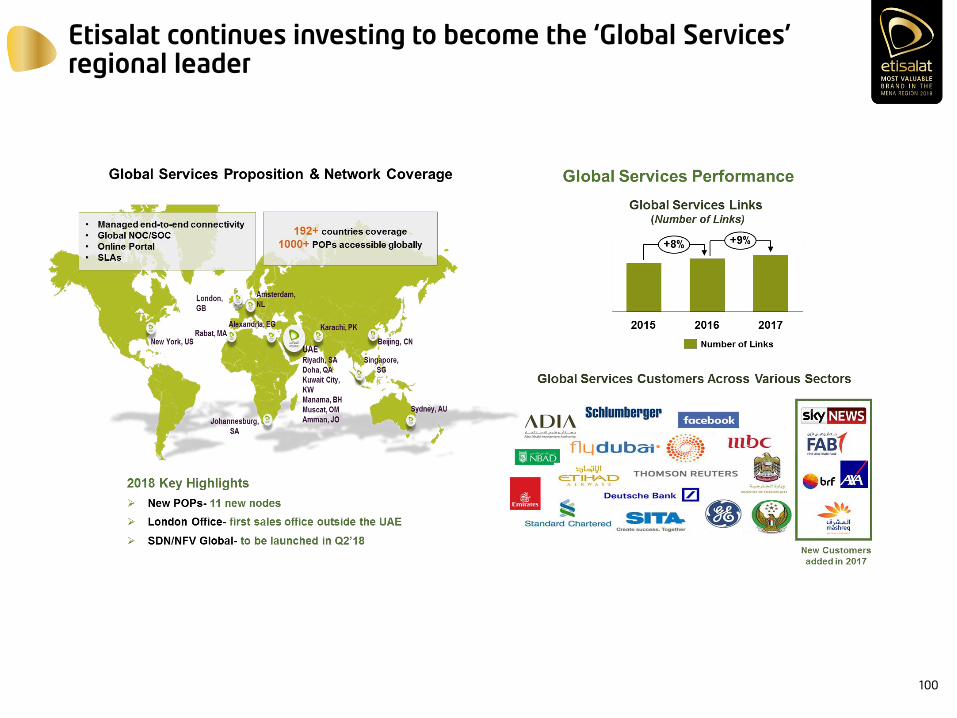
Etisalat continues investing to become the ‘Global Services’ regional leader
100
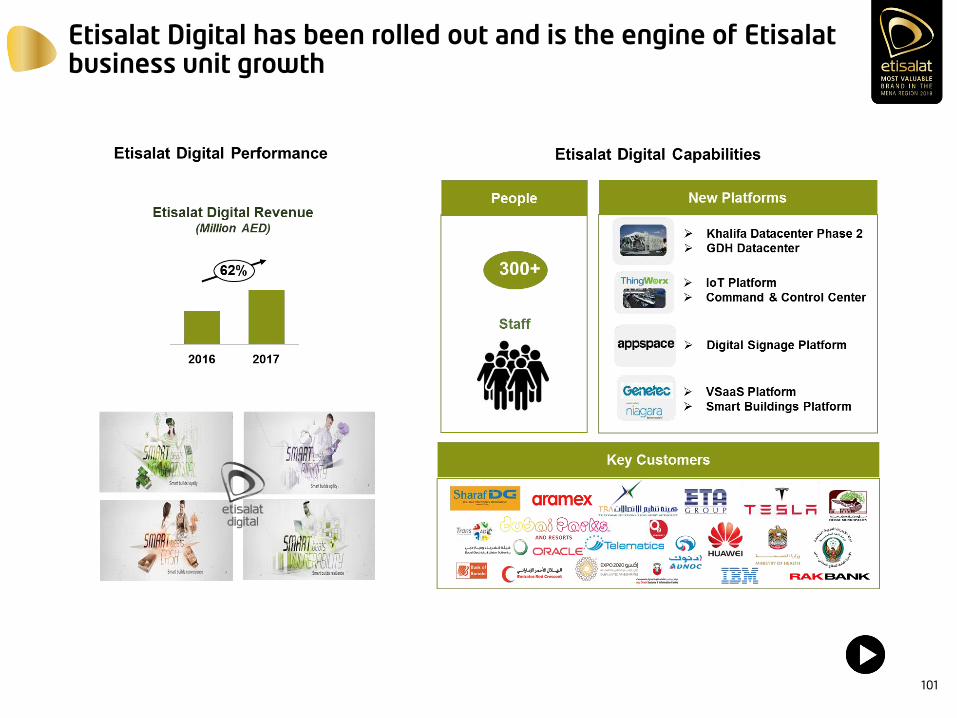
Etisalat Digital has been rolled out and is the engine of Etisalat business unit growth
101
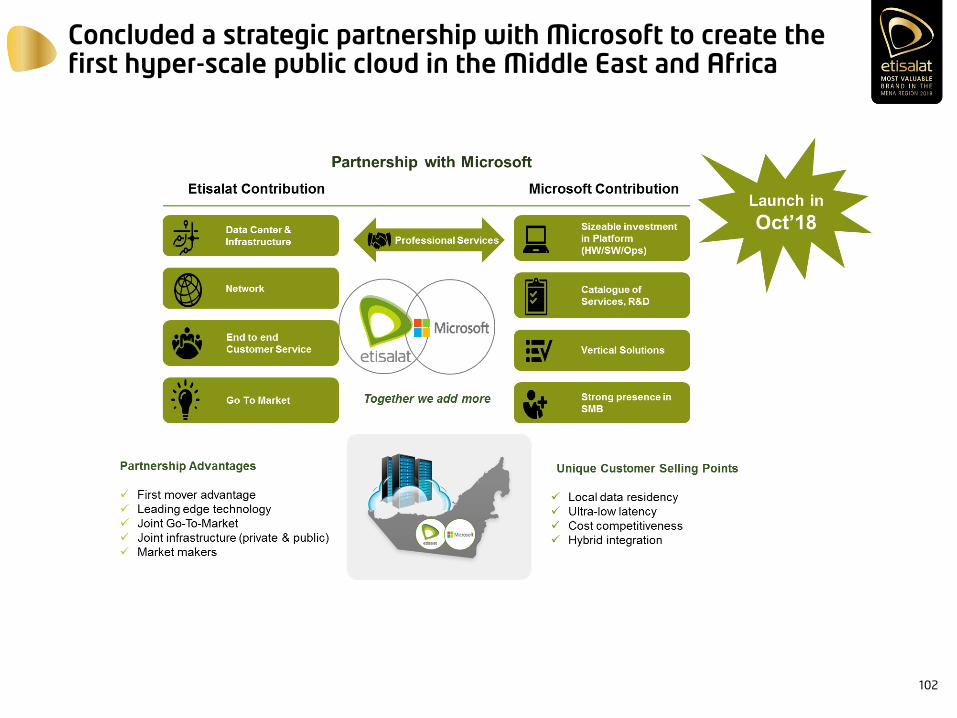
Concluded a strategic partnership with Microsoft to create the first hyper-scale public cloud in the Middle East and Africa
102
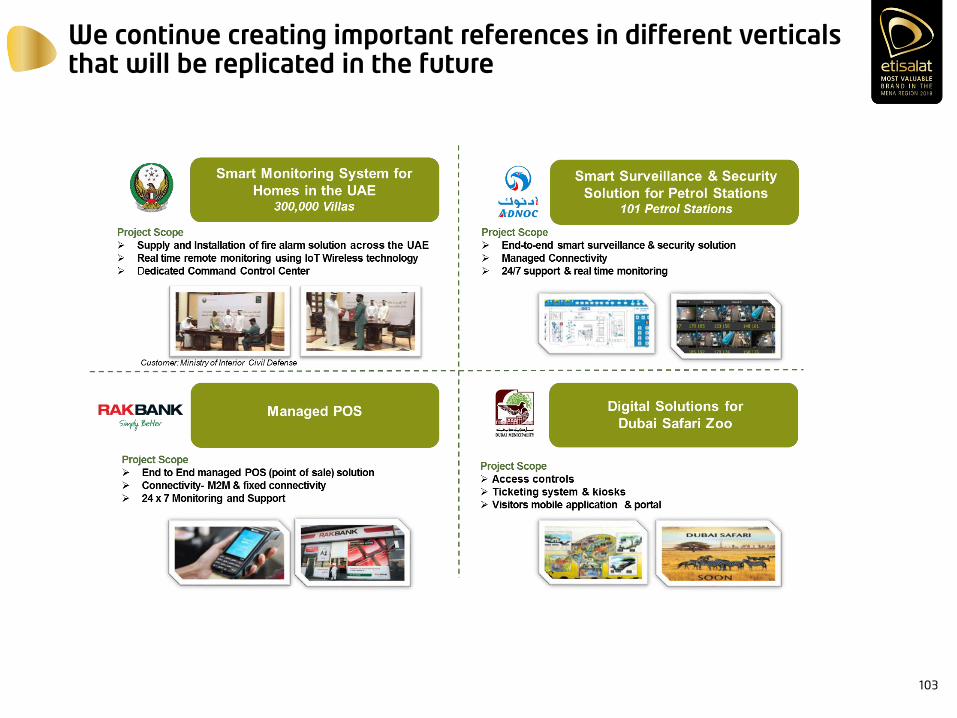
We continue creating important references in different verticals that will be replicated in the future
103
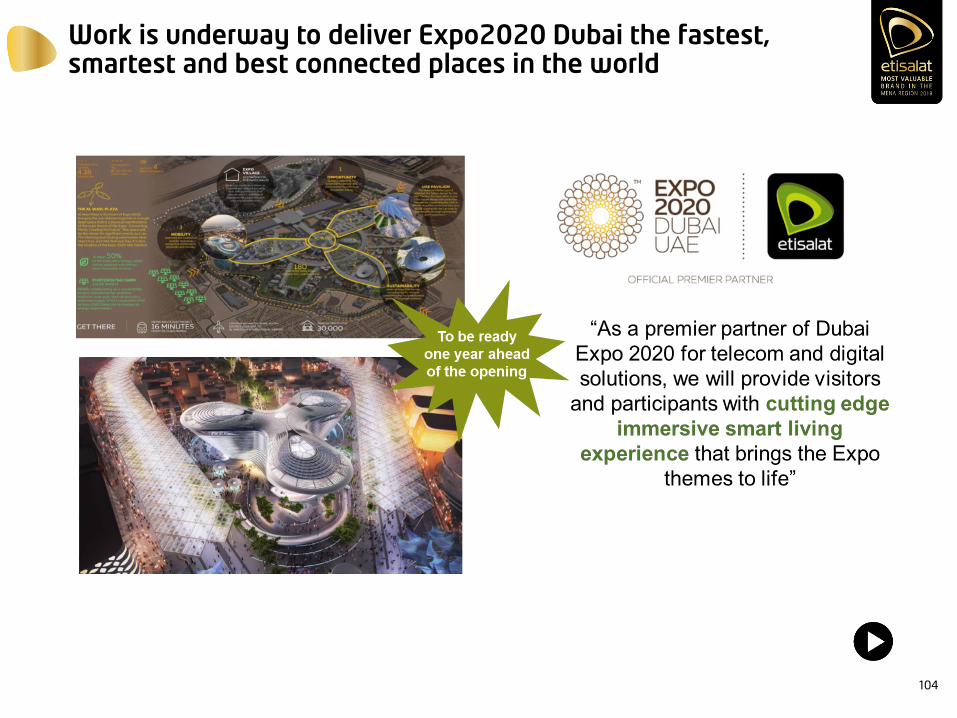
Work is underway to deliver Expo2020 Dubai the fastest, smartest and best connected places in the world
104
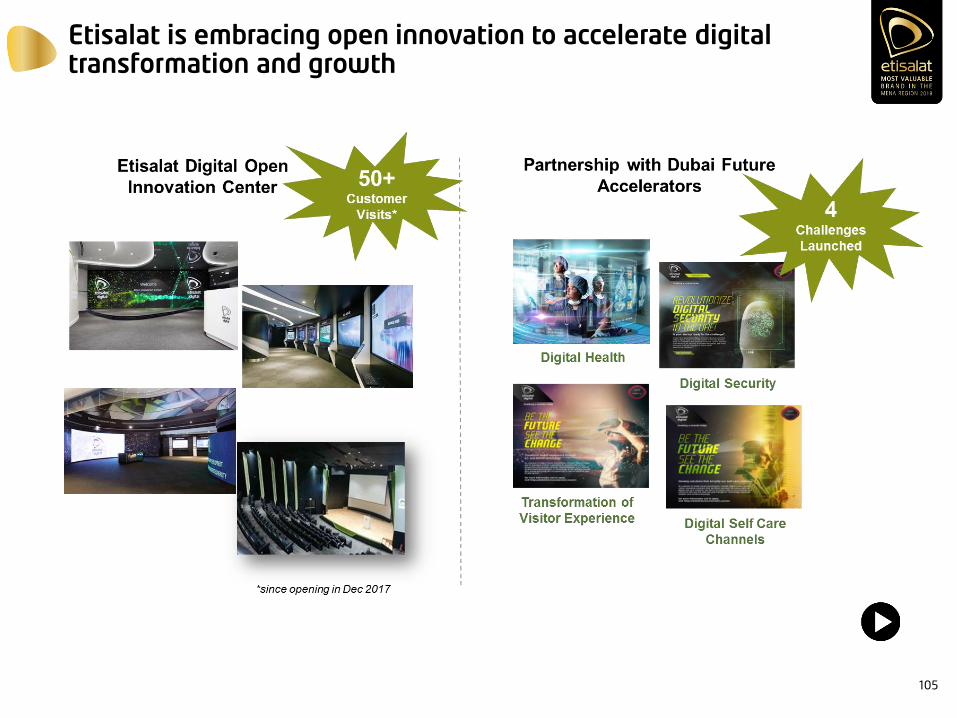
Etisalat is embracing open innovation to accelerate digital transformation and growth
105
Conclusions
We will continue in our transformation towards a digital telco
Our core business will further expand through innovative mobile
propositions and end-to-end managed services
SMB segment has the potential to grow through bundling of telecom
services and digital solutions
Etisalat Digital will remain to be the source of growth with potential to
expand outside the UAE
Open innovation will allow us to accelerate the launch of new services
and solutions
106

THANK YOU
Q&A

Etisalat GroupCapital Markets Day 2018
PTCL Group Operations
Dr. Daniel Ritz
Chief Executive Officer – PTCL Group
www.ptcl.com.pk 1
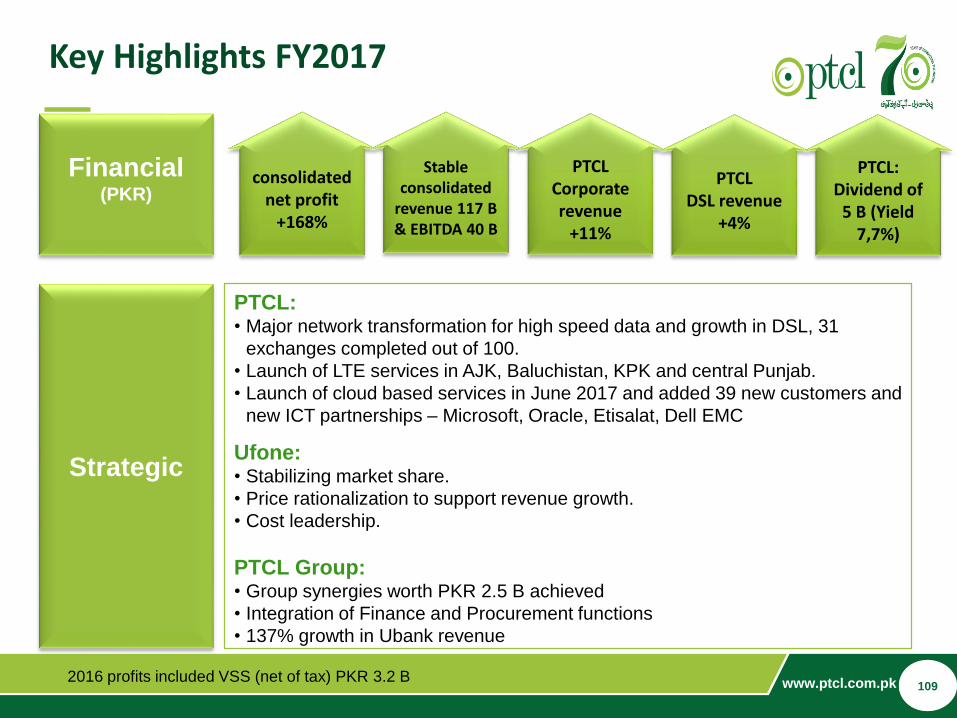
Key Highlights FY2017
Financial(PKR)
Strategic
PTCL: • Major network transformation for high speed data and growth in DSL, 31
exchanges completed out of 100.
• Launch of LTE services in AJK, Baluchistan, KPK and central Punjab.
• Launch of cloud based services in June 2017 and added 39 new customers and
new ICT partnerships – Microsoft, Oracle, Etisalat, Dell EMC
Ufone: • Stabilizing market share.
• Price rationalization to support revenue growth.
• Cost leadership.
PTCL Group: • Group synergies worth PKR 2.5 B achieved
• Integration of Finance and Procurement functions
• 137% growth in Ubank revenue
consolidated net profit
+168%
Stable consolidated
revenue 117 B & EBITDA 40 B
PTCL Corporate revenue
+11%
PTCL: Dividend of
5 B (Yield 7,7%)
2016 profits included VSS (net of tax) PKR 3.2 B
PTCL DSL revenue
+4%
109
www.ptcl.com.pk 2
Presentation Overview
2
1 Overview of the Operating Environment
Key operational and financial highlights of 2017
3 Management focus during 2017 / Key developments
4 Strategic priorities/Way forward
110
www.ptcl.com.pk 3
Country highlights
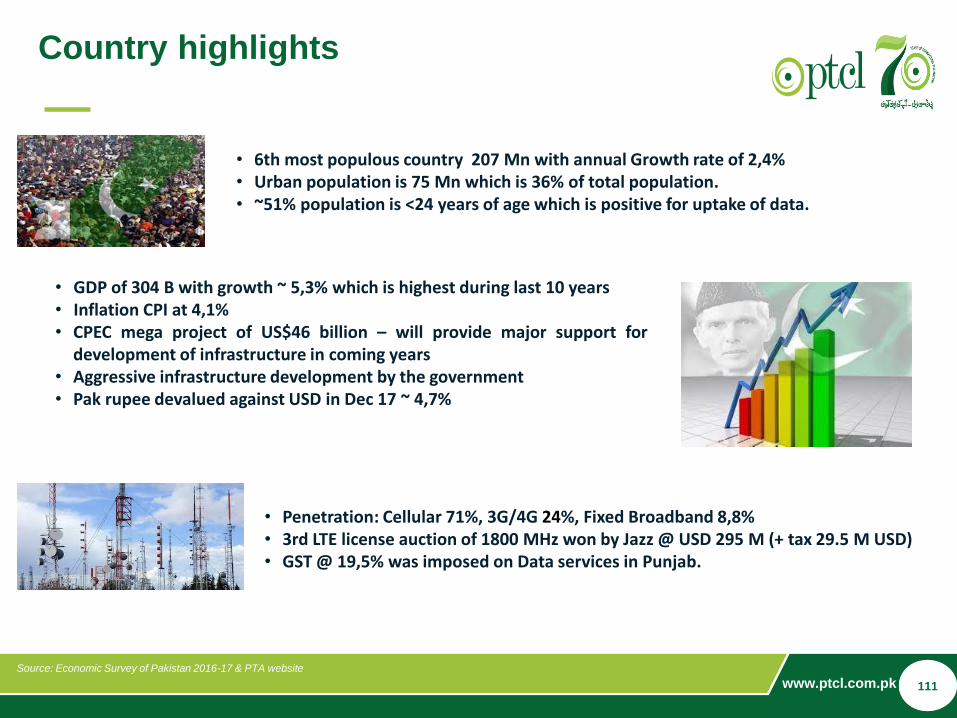
• GDP of 304 B with growth ~ 5,3% which is highest during last 10 years • Inflation CPI at 4,1% • CPEC mega project of US$46 billion – will provide major support for
development of infrastructure in coming years• Aggressive infrastructure development by the government• Pak rupee devalued against USD in Dec 17 ~ 4,7%
• 6th most populous country 207 Mn with annual Growth rate of 2,4%• Urban population is 75 Mn which is 36% of total population.• ~51% population is <24 years of age which is positive for uptake of data.
• Penetration: Cellular 71%, 3G/4G 24%, Fixed Broadband 8,8%• 3rd LTE license auction of 1800 MHz won by Jazz @ USD 295 M (+ tax 29.5 M USD)• GST @ 19,5% was imposed on Data services in Punjab.
Source: Economic Survey of Pakistan 2016-17 & PTA website
111
www.ptcl.com.pk 4
Telco market overview
Source: PTA, Financial statements, Management Estimates
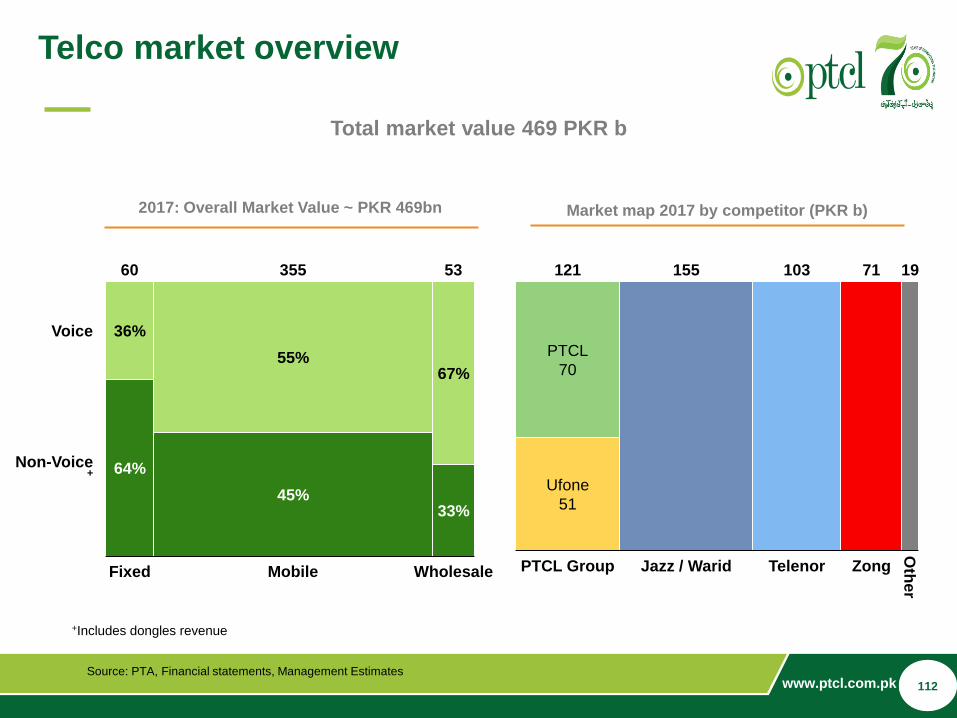
Total market value 469 PKR b
Market map 2017 by competitor (PKR b)
121
Jazz / Warid Zong
155
Ufone
51
PTCL
70
1971
Oth
er
103
TelenorPTCL Group
53
Non-Voice+
33%
Wholesale
67%
Mobile
355
Voice
64%
36%
55%
60
45%
Fixed
2017: Overall Market Value ~ PKR 469bn
+Includes dongles revenue
112

www.ptcl.com.pk 5
PTCL Group - a strong full service provider
• Strong # 2 by revenue
• #1 in Fixed
• #4 in Mobile
• Only player with Fixed and Mobile
Market
Positioning
Fixed• Largest fiber footprint in Pakistan > 38,000 KM of Fiber
• Market leader with 89% value share in fixed broadband
• Broadband customers:1,9 Mn
• Market leader in Corporate & C&WS
Mobile• 18,5 Mn cellular subscribers
• More than 8,000 mobile towers
• 2nd in TRI*M results.
Microfinance
Bank
• Enables the mobile financial services business of the group
• Profitable and well positioned to tap into the nascent E-Commerce market
• 33% increase in number of branches during the year (Total branches are 100)
• 91 % increase in advances to customers.
113
www.ptcl.com.pk 6
Presentation Overview
2
1 Overview of the Operating Environment
Key operational and financial highlights of 2017
3 Management focus during 2017 / Key developments
4 Strategic priorities/Way forward
114
www.ptcl.com.pk 7
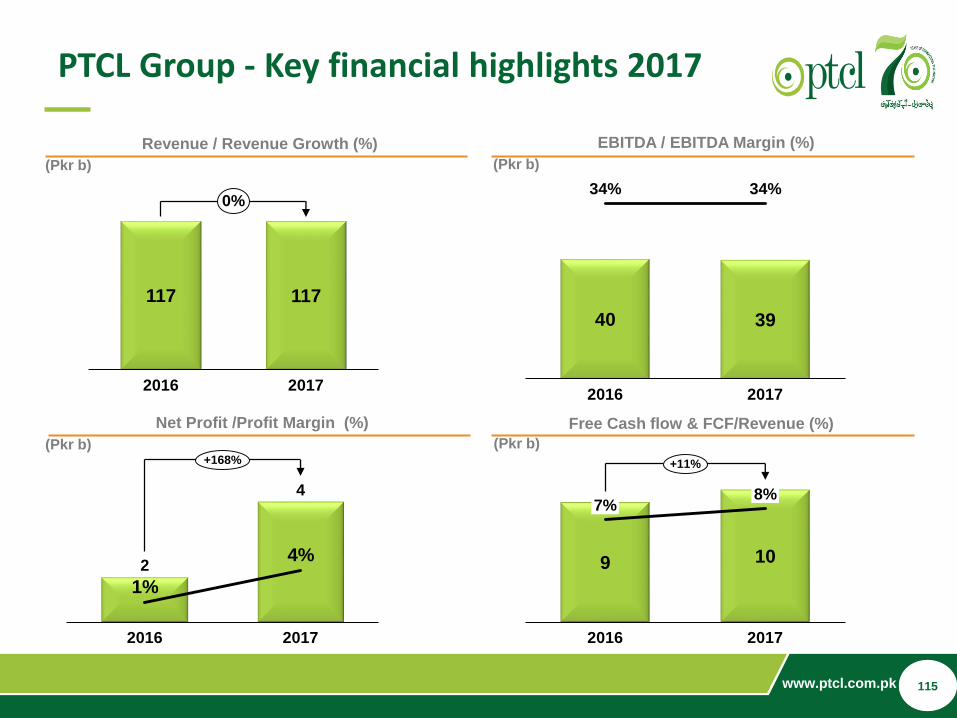
PTCL Group - Key financial highlights 2017
Revenue / Revenue Growth (%) EBITDA / EBITDA Margin (%)
Net Profit /Profit Margin (%)
(Pkr b) (Pkr b)
(Pkr b) (Pkr b)
117 117
20172016
0%
40 39
2016
34% 34%
2017
2
4
1%
2016
4%
2017
+168%
Free Cash flow & FCF/Revenue (%)
9 10
2017
7%
2016
8%
+11%
115
www.ptcl.com.pk 8
Revenue / Revenue Growth (%) EBITDA / EBITDA Margin (%)
Net Profit /Profit Margin (%)
(Pkr b) (Pkr b)
(Pkr b) (Pkr b)
Source: Consolidated accounts
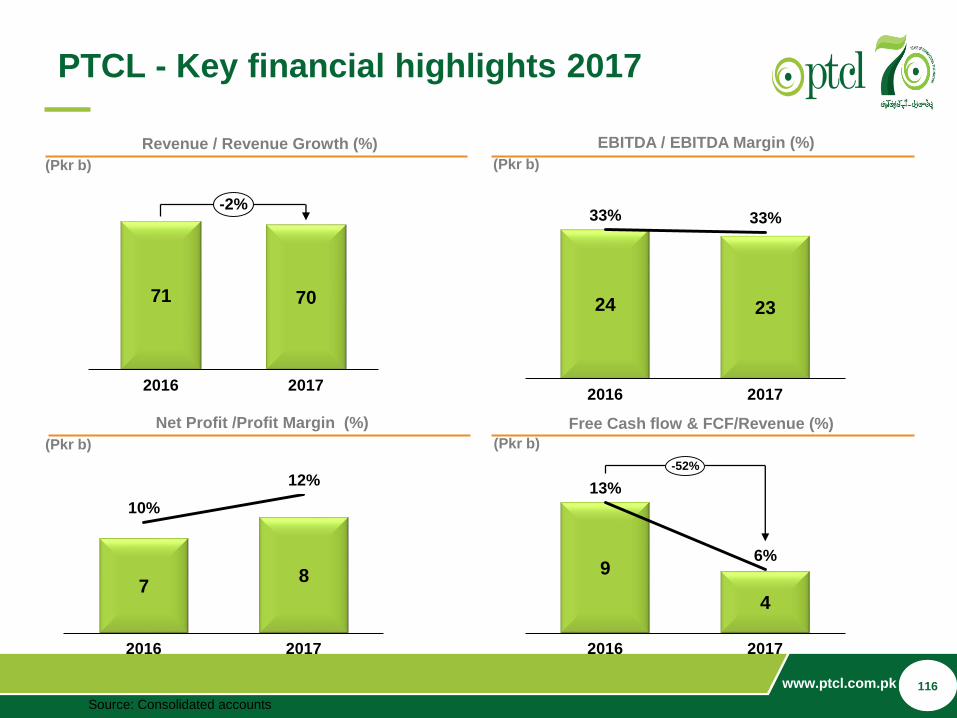
71 70
2016 2017
-2%
24 23
33%
2016
33%
2017
PTCL - Key financial highlights 2017
78
10%
2016
12%
2017
Free Cash flow & FCF/Revenue (%)
9
4
13%
6%
2016 2017
-52%
116
www.ptcl.com.pk 9
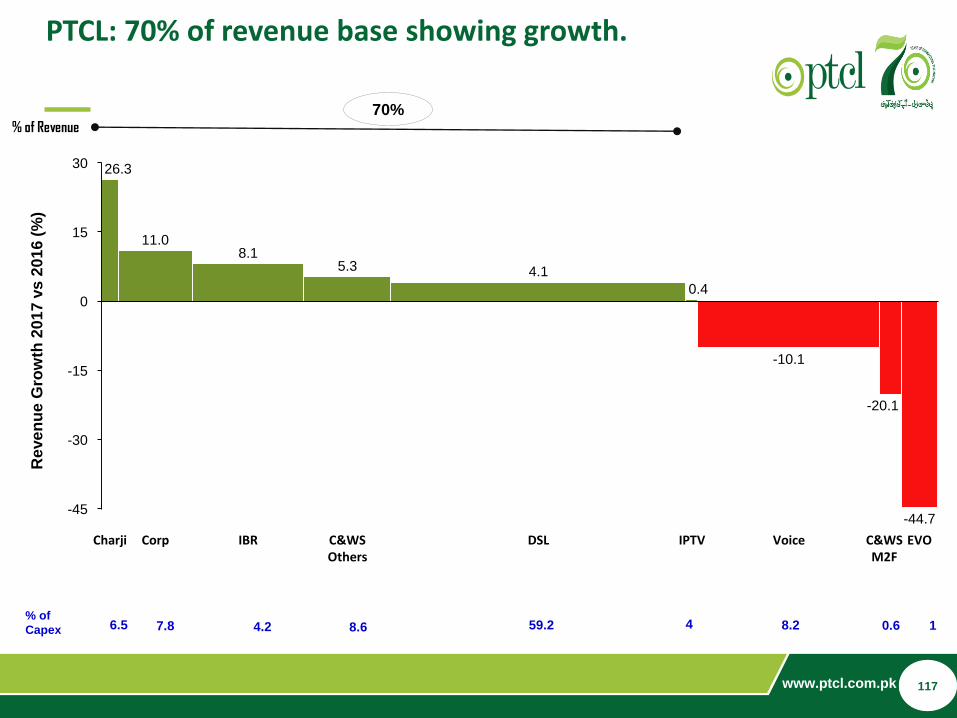
PTCL: 70% of revenue base showing growth.
15
0
-30
-45
30
-15
Corp IPTVIBR
5.3
EVODSL
4.1
-20.1
C&WSOthers
Charji Voice
-44.7
C&WSM2F
26.3
11.08.1
0.4
-10.1
Reve
nu
e G
row
th 2
01
7 v
s 2
01
6 (
%)
% of
Capex 6.5 7.8 4.2 8.6 59.2 4 8.2 10.6
% of Revenue70%
117
www.ptcl.com.pk 10
Subs – DSL (K) ARPU – DSL (PKR)
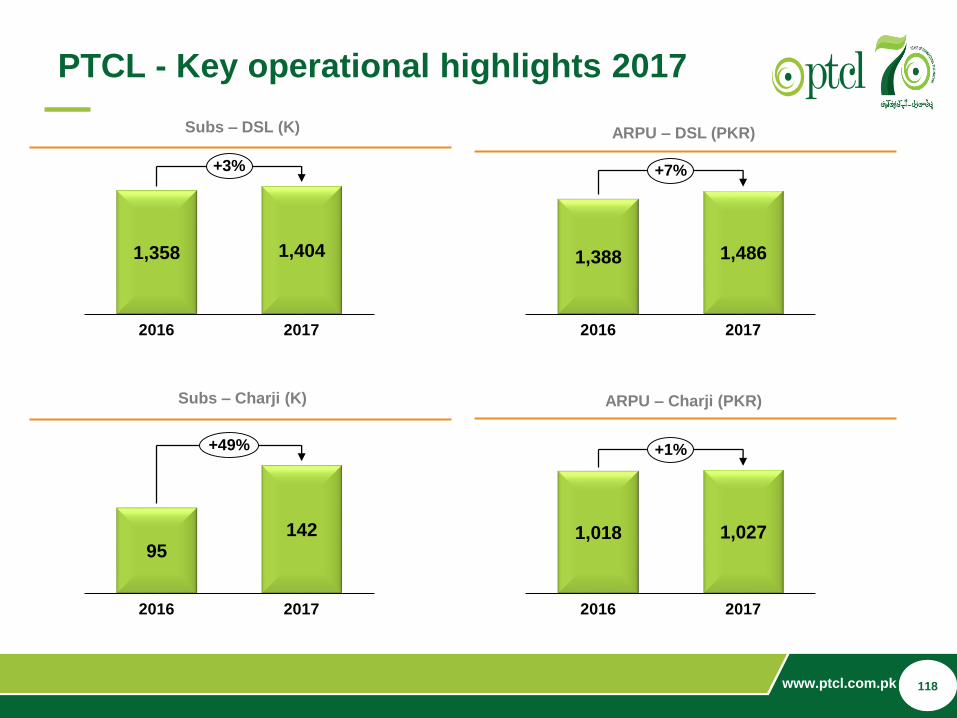
PTCL - Key operational highlights 2017
1,358 1,404
20172016
+3%
1,388 1,486
20172016
+7%
Subs – Charji (K) ARPU – Charji (PKR)
95142
2016 2017
+49%
1,018 1,027
2016 2017
+1%
118
www.ptcl.com.pk 11
Revenue / Revenue Growth (%) EBITDA / EBITDA Margin (%)
Net Profit /Profit Margin (%)
(Pkr b) (Pkr b)
(Pkr b) (Pkr b)
Source: Consolidated accounts
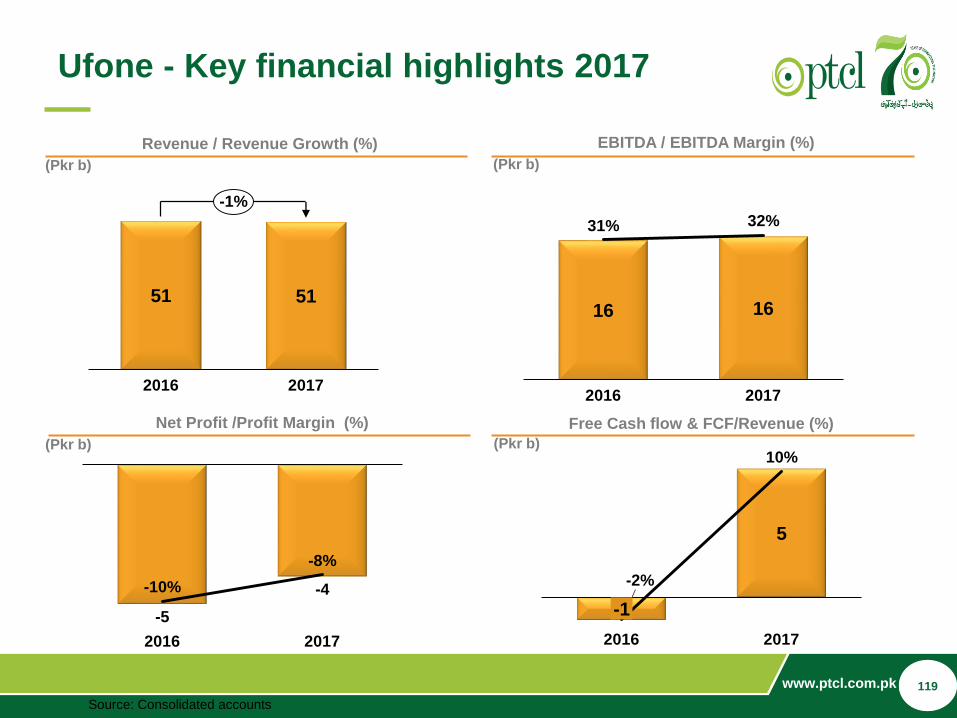
51 51
2016 2017
-1%
16 16
32%31%
2016 2017
Ufone - Key financial highlights 2017
-5
-4
2016
-10%
-8%
2017
Free Cash flow & FCF/Revenue (%)
5
2017
-2%
2016
10%
-1
119
www.ptcl.com.pk 12
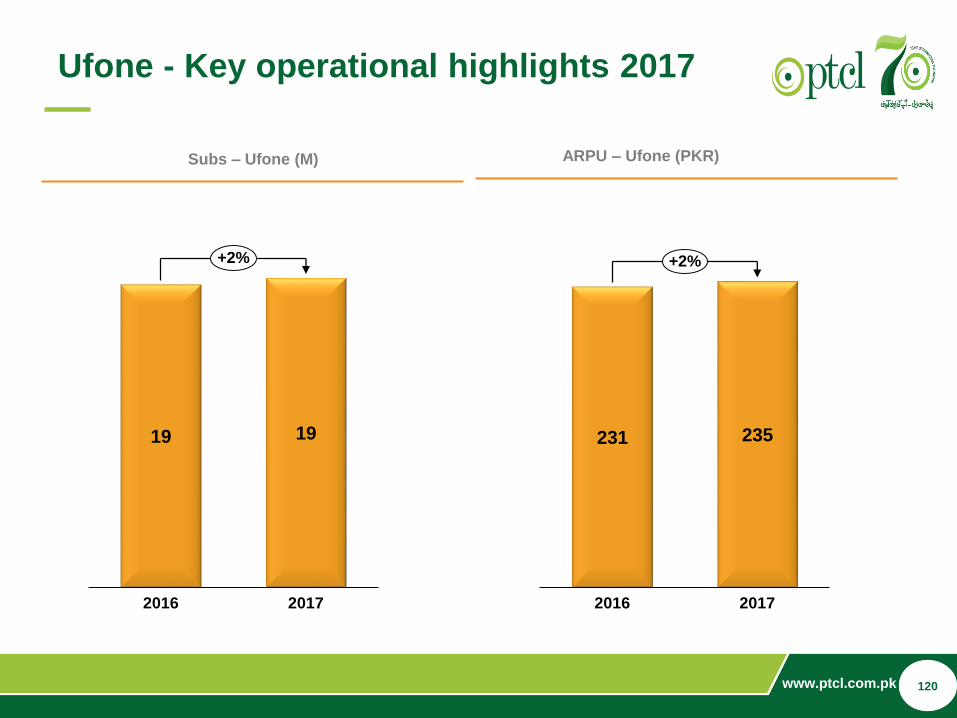
Subs – Ufone (M) ARPU – Ufone (PKR)
19 19
2016 2017
+2%
Ufone - Key operational highlights 2017
231 235
2016 2017
+2%
120
www.ptcl.com.pk 13
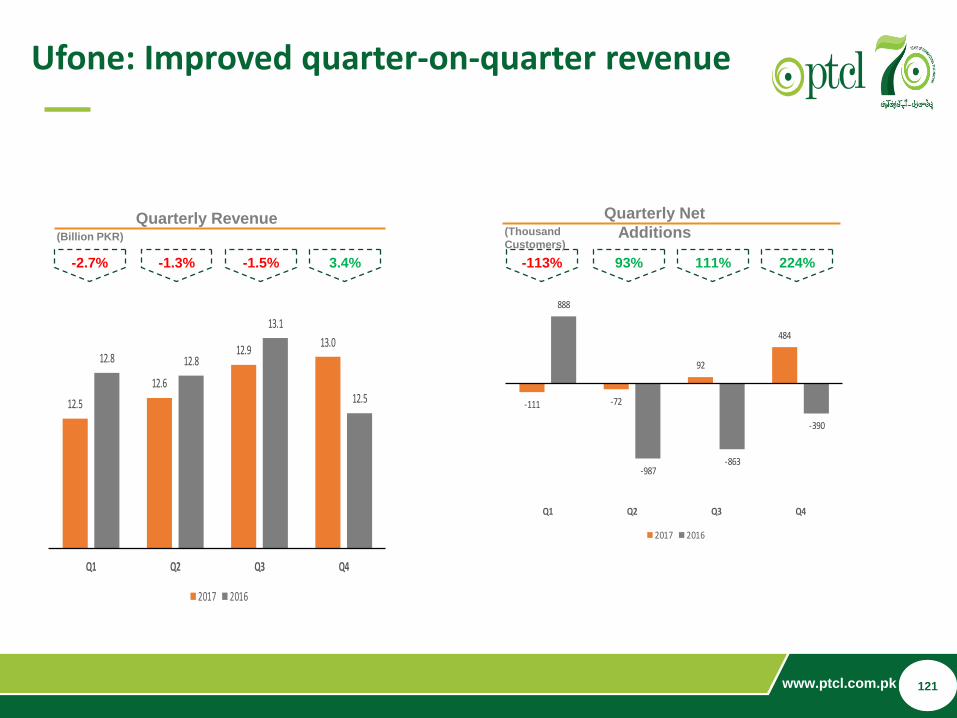
Quarterly Revenue(Billion PKR)
12.5
12.6
12.913.0
12.8 12.8
13.1
12.5
Q1 Q2 Q3 Q4
2017 2016
-2.7% -1.3% -1.5% 3.4%
Ufone: Improved quarter-on-quarter revenue
-111 -72
92
484
888
-987-863
-390
Q1 Q2 Q3 Q4
2017 2016
-113% 93% 111% 224%
Quarterly Net
Additions(Thousand
Customers)
121

www.ptcl.com.pk 14
Presentation Overview
2
1 Overview of the Operating Environment
Key operational and financial highlights of 2017
3 Management focus during 2017 / Key developments
4 Strategic priorities/Way forward
122
www.ptcl.com.pk 15
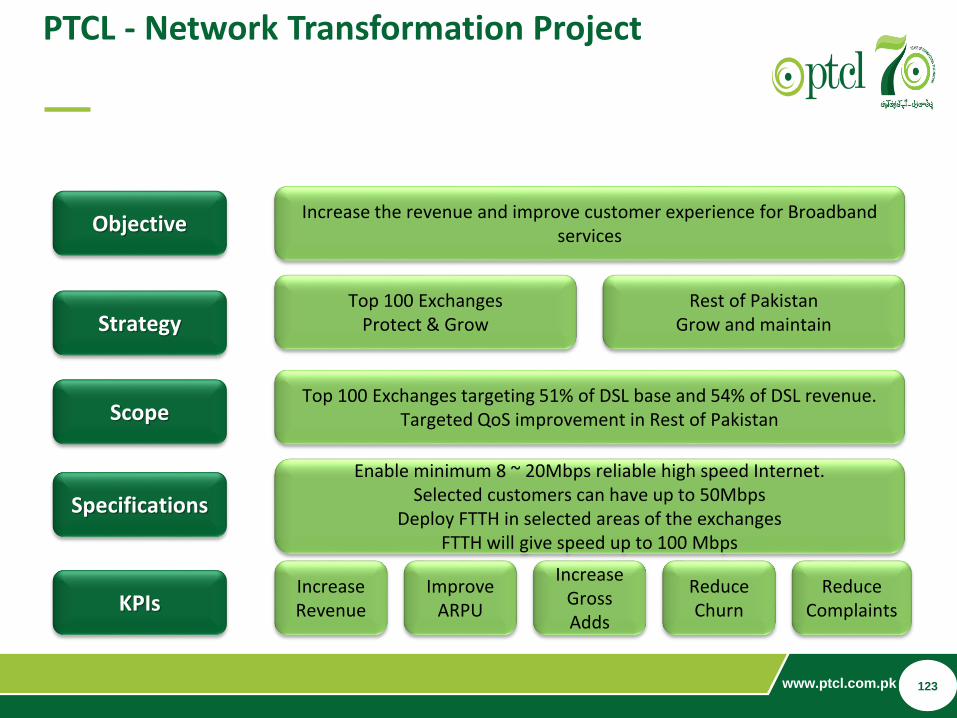
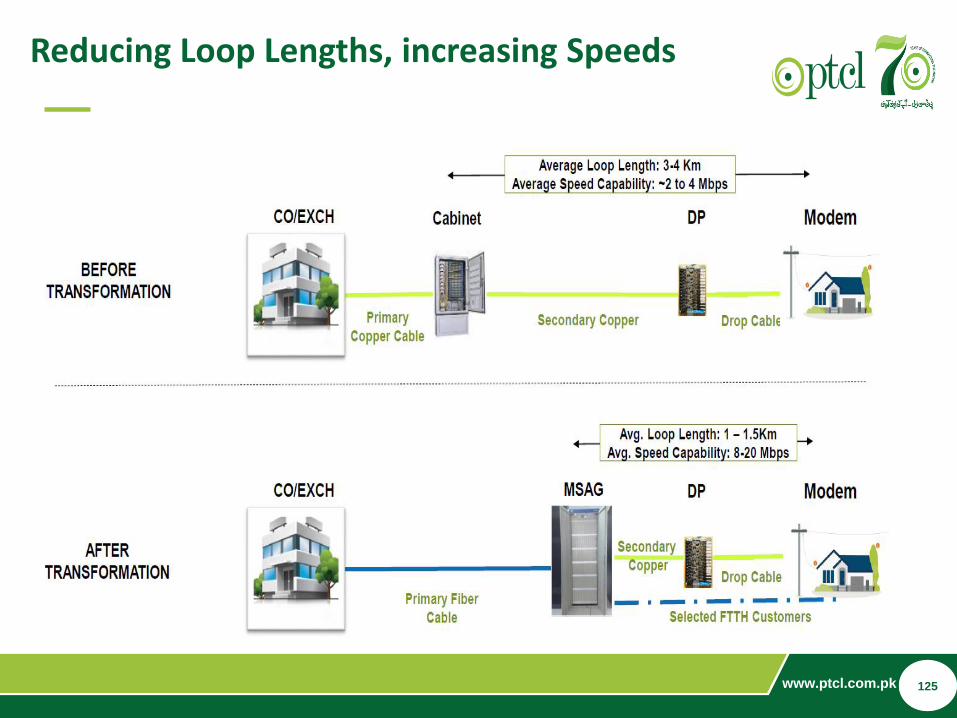
PTCL - Network Transformation Project
Increase the revenue and improve customer experience for Broadband services
Enable minimum 8 ~ 20Mbps reliable high speed Internet. Selected customers can have up to 50Mbps
Deploy FTTH in selected areas of the exchangesFTTH will give speed up to 100 Mbps
KPIs IncreaseRevenue
ImproveARPU
ReduceComplaints
Increase Gross Adds
Reduce Churn
ScopeTop 100 Exchanges targeting 51% of DSL base and 54% of DSL revenue.
Targeted QoS improvement in Rest of Pakistan
Top 100 ExchangesProtect & GrowStrategy
Objective
Rest of PakistanGrow and maintain
Specifications
123
www.ptcl.com.pk 16
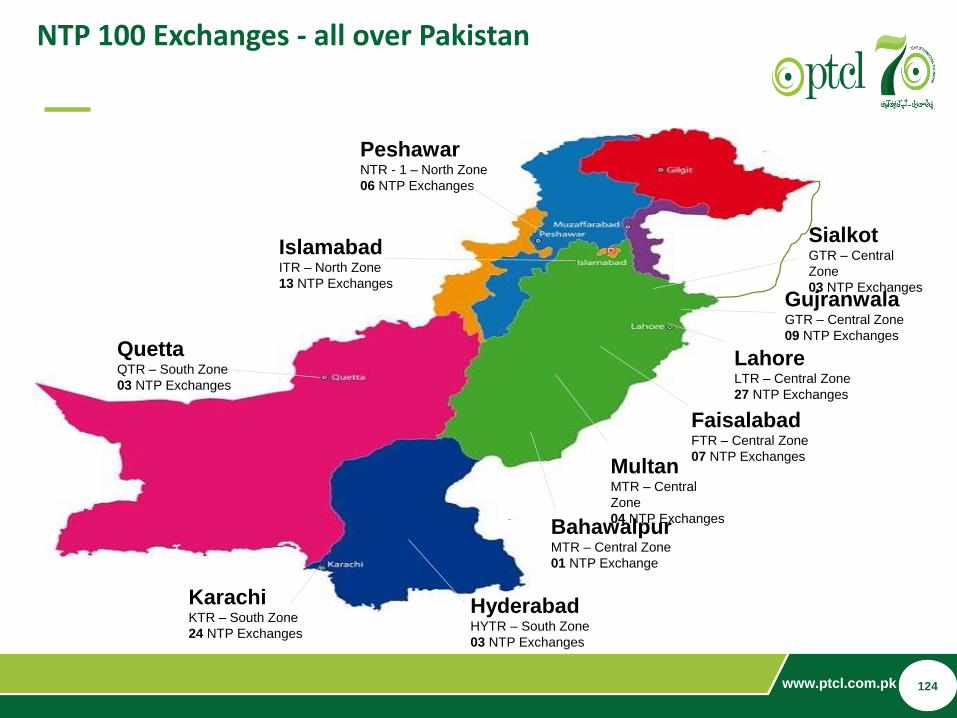
LahoreLTR – Central Zone
27 NTP Exchanges
KarachiKTR – South Zone
24 NTP Exchanges
QuettaQTR – South Zone
03 NTP Exchanges
FaisalabadFTR – Central Zone
07 NTP Exchanges
PeshawarNTR - 1 – North Zone
06 NTP Exchanges
HyderabadHYTR – South Zone
03 NTP Exchanges
SialkotGTR – Central
Zone
03 NTP Exchanges
IslamabadITR – North Zone
13 NTP Exchanges
BahawalpurMTR – Central Zone
01 NTP Exchange
GujranwalaGTR – Central Zone
09 NTP Exchanges
MultanMTR – Central
Zone
04 NTP Exchanges
NTP 100 Exchanges - all over Pakistan
124
www.ptcl.com.pk 17
Reducing Loop Lengths, increasing Speeds
125
www.ptcl.com.pk 18
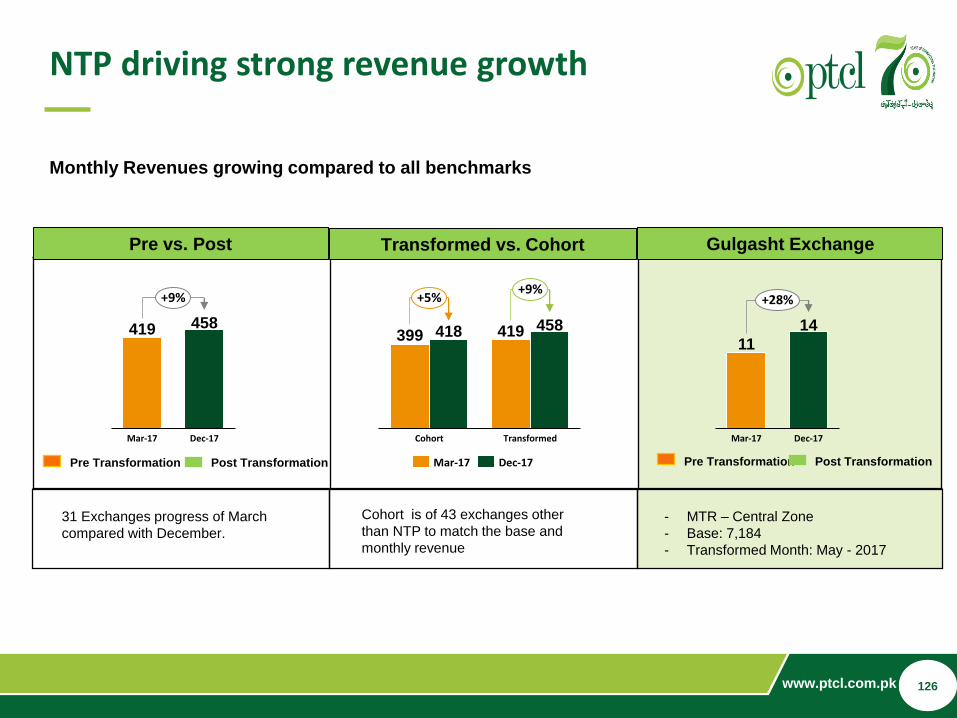
NTP driving strong revenue growth
Monthly Revenues growing compared to all benchmarks
Pre vs. Post Transformed vs. Cohort Gulgasht Exchange
Cohort is of 43 exchanges other
than NTP to match the base and
monthly revenue
- MTR – Central Zone
- Base: 7,184
- Transformed Month: May - 2017
31 Exchanges progress of March
compared with December.
Pre Transformation Post Transformation Pre Transformation Post Transformation
419 458
Mar-17 Dec-17
+9%
399 419418 458
TransformedCohort
+5%+9%
Mar-17 Dec-17
11
14
Mar-17 Dec-17
+28%
126

www.ptcl.com.pk 19
Key Highlights of Ufone Turnaround 2017
Strengthening of
network via U900 in
major metros; increasing
3G footprint by ~29%
422 new coverage sites(164 for HVC, 90 for 3G
coverage in high revenue
areas, 168 in USF area)
Largest recipient of USF
funds, for under served
areas; winning 64% bids
worth ~USD 72 ‘Mn
Smart price ups helped
improve the ARPU
slightly: Super Card,
PAYG packages
Simplification of product
portfolio: closure of 32
products
Building on brand
communication of
‘Convenience’
Infrastructure Distribution Commercial
BVS footprint increased
by 28%
Relationship
strengthening with ‘high
footfall’ retailers
~66% higher sales in
Q4’17 vs Q4’16
~28% increase in High
Value Sales in Q4’17 vs
Q4’16
Opex saving of ~USD 13.5 achieved during the year
127
www.ptcl.com.pk 20
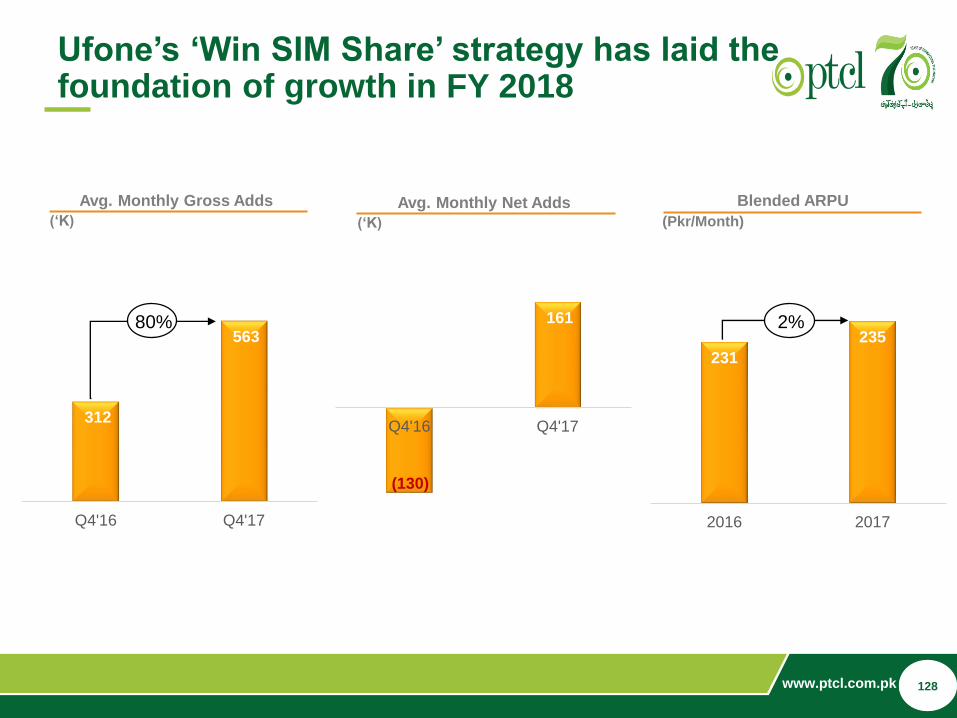
312
563
Q4'16 Q4'17
231
235
2016 2017
Ufone’s ‘Win SIM Share’ strategy has laid the foundation of growth in FY 2018
Avg. Monthly Gross Adds Blended ARPU
(Pkr/Month) (‘K)
(130)
161
Q4'16 Q4'17
Avg. Monthly Net Adds
(‘K)
2%80%
128
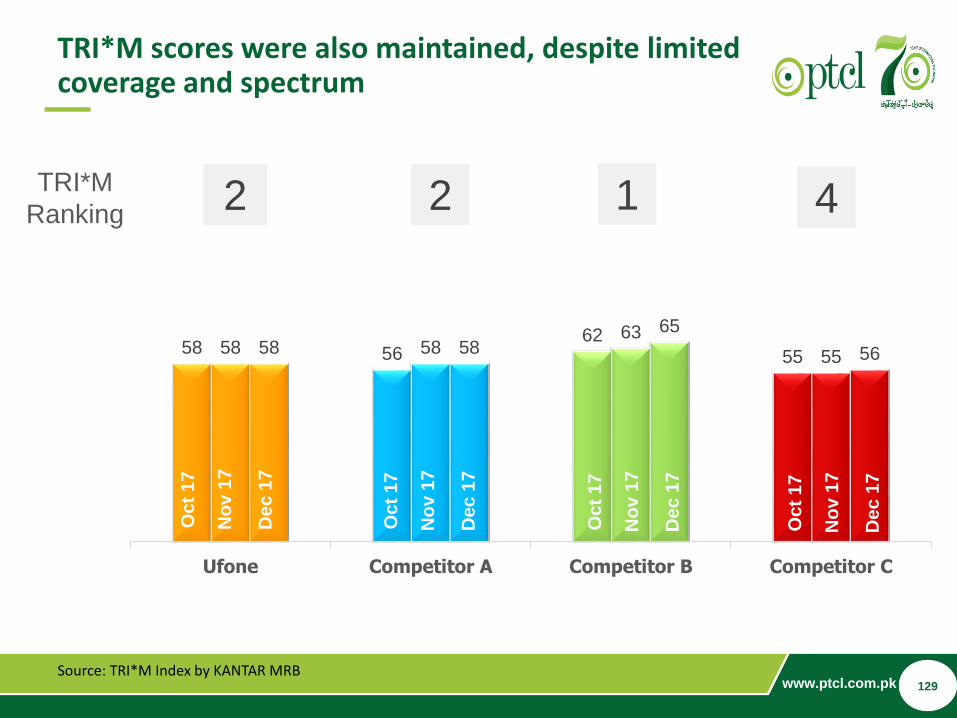
www.ptcl.com.pk 21
TRI*M scores were also maintained, despite limited coverage and spectrum
58 5662
5558 58
63
5558 58
65
56
Ufone Competitor A Competitor B Competitor C
Oct
17
No
v 1
7
De
c 1
7
Oc
t 1
7
No
v 1
7
De
c 1
7
Oc
t 1
7
No
v 1
7
De
c 1
7
Oct
17
No
v 1
7
De
c 1
7
2 2 1 4TRI*M
Ranking
Source: TRI*M Index by KANTAR MRB129
www.ptcl.com.pk 22
Presentation Overview
2
1 Overview of the Operating Environment
Key operational and financial highlights of 2017
3 Management focus during 2017 / Key developments
4 Strategic priorities/Way forward
130
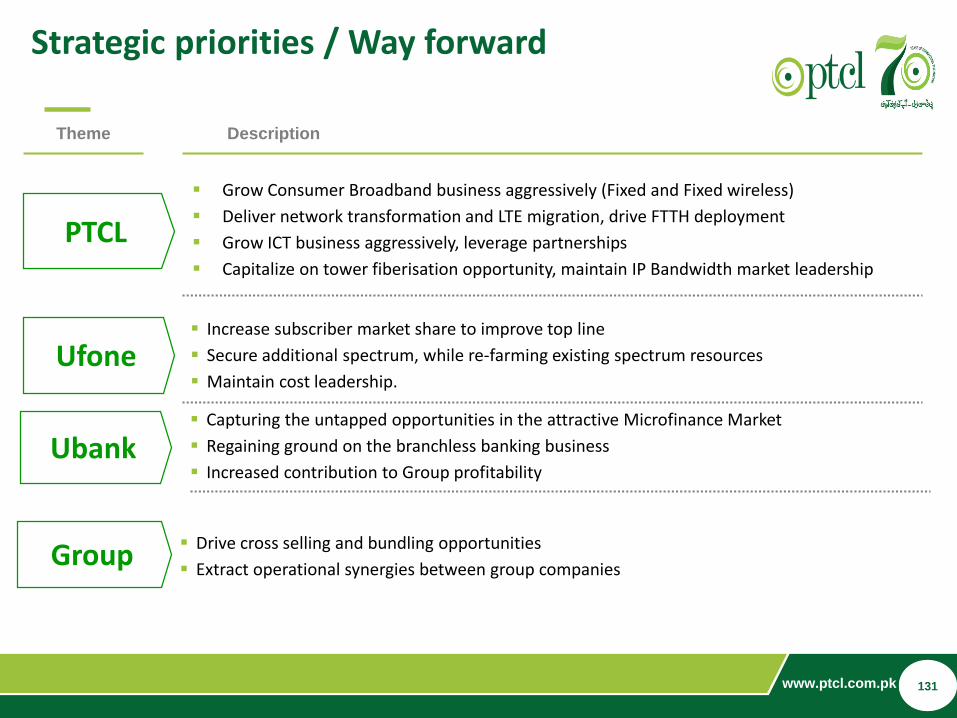
www.ptcl.com.pk 23
Strategic priorities / Way forward
Description
PTCL
Theme
Grow Consumer Broadband business aggressively (Fixed and Fixed wireless)
Deliver network transformation and LTE migration, drive FTTH deployment
Grow ICT business aggressively, leverage partnerships
Capitalize on tower fiberisation opportunity, maintain IP Bandwidth market leadership
Ufone Increase subscriber market share to improve top line
Secure additional spectrum, while re-farming existing spectrum resources
Maintain cost leadership.
Ubank Capturing the untapped opportunities in the attractive Microfinance Market
Regaining ground on the branchless banking business
Increased contribution to Group profitability
Group Drive cross selling and bundling opportunities
Extract operational synergies between group companies
131

THANK YOU
Q&A
Etisalat GroupCapital Markets Day 2018
Mobily Operations
Ahmed A. Aboudoma
Chief Executive Officer - Etihad Etisalat (Mobily)
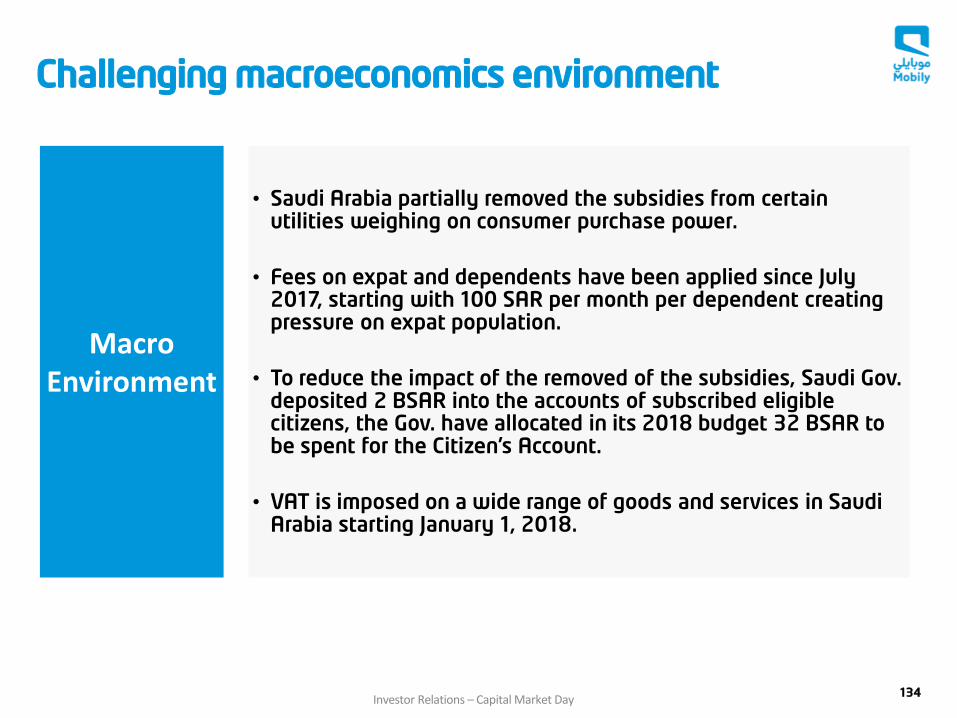
MacroEnvironment
• Saudi Arabia partially removed the subsidies from certain utilities weighing on consumer purchase power.
• Fees on expat and dependents have been applied since July 2017, starting with 100 SAR per month per dependent creating pressure on expat population.
• To reduce the impact of the removed of the subsidies, Saudi Gov. deposited 2 BSAR into the accounts of subscribed eligible citizens, the Gov. have allocated in its 2018 budget 32 BSAR to be spent for the Citizen’s Account.
• VAT is imposed on a wide range of goods and services in Saudi Arabia starting January 1, 2018.
Challenging macroeconomics environment
Investor Relations – Capital Market Day134
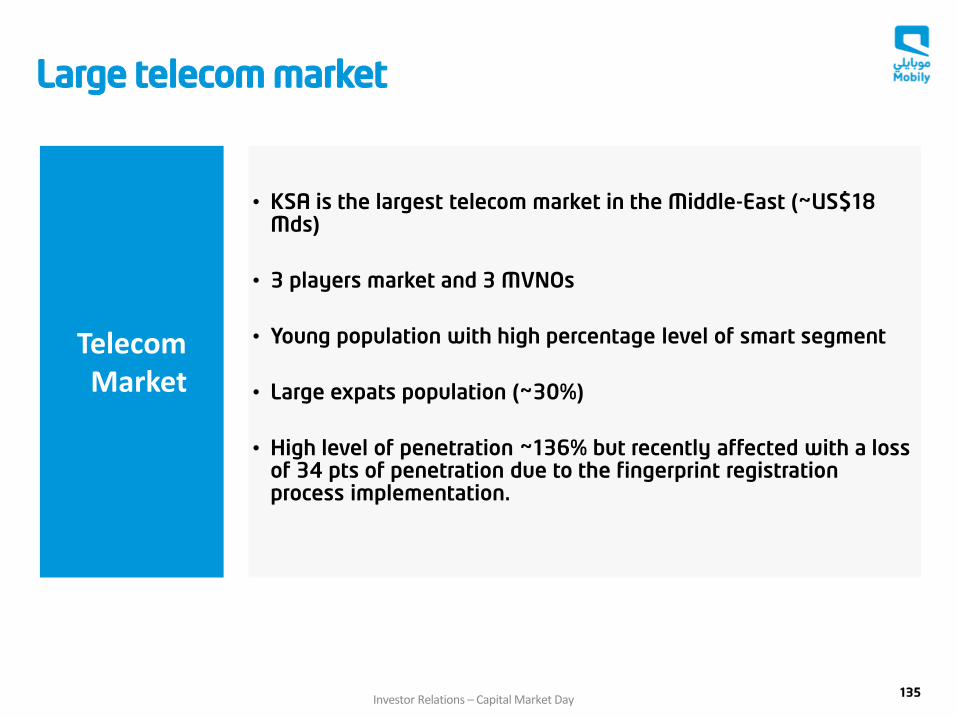
Telecom Market
• KSA is the largest telecom market in the Middle-East (~US$18 Mds)
• 3 players market and 3 MVNOs
• Young population with high percentage level of smart segment
• Large expats population (~30%)
• High level of penetration ~136% but recently affected with a loss of 34 pts of penetration due to the fingerprint registration process implementation.
Large telecom market
Investor Relations – Capital Market Day135
• Focus in 2017 was to rebuild Mobily foundations: • Analyzing legacy issues • The approach was to fix root causes rather than scratching the
surface• Starting to devise a new strategy fitting the company abilities• Rolling out the implementation of the new strategy
• Keeping an eye on the operational performance while fixing the basics…• Commercial performance improvement • Financial stabilization and early signs of growth
• …and even over performing the market• Top line growth • Revenues share
• Within a very challenging regulatory environment
136Investor Relations – Capital Market Day
2017 in Mobily

2017 at glance: fixing the root cause rather than scratching the surface…
137
SELECTION
Strategy
Investor Relations – Capital Market Day
• New vision & brand positioning
• Launched CEX & digital transformation program
• Built new capabilities (analytic & research)
HR
Commercial
• IT transformation
• Network modernization under-way and successful spectrum acquisition
• Defined new organization and governance (incl. leadership assessment)
• Refining the HR framework (retain and attract talent)
• Enhance quality of execution and culture mindset • Revamp product portfolio
• Refocus on BU
• Developed a new sales operating model
• Improved the customer care support
• Refinancing
• Cost optimization
Technology
Finance

… Meanwhile not loosing focus on operational performance…
Investor Relations – Capital Market Day138
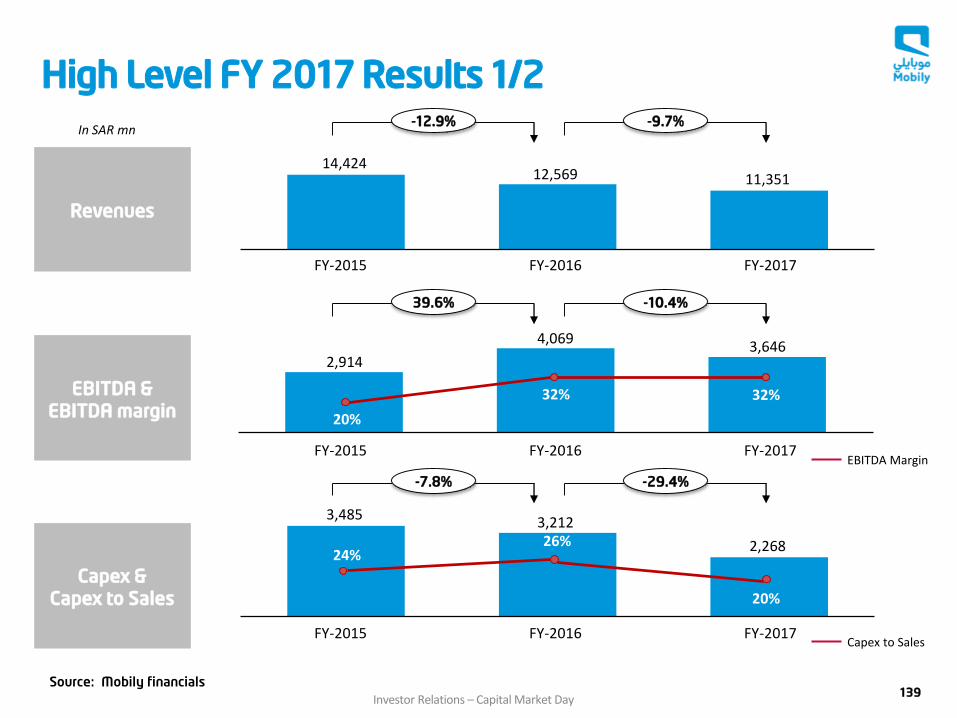
Revenues
EBITDA &EBITDA margin
Capex & Capex to Sales
Source: Mobily financials
High Level FY 2017 Results 1/2
11,351
FY-2017FY-2016FY-2015
14,42412,569
2,914
3,485
4,069
3,212
3,646
2,268
-9.7%-12.9%
-10.4%39.6%
-29.4%-7.8%
EBITDA Margin
20%
32% 32%
FY-2017FY-2016FY-2015
FY-2017FY-2016FY-2015
24%26%
20%
Capex to Sales
Investor Relations – Capital Market Day139
In SAR mn
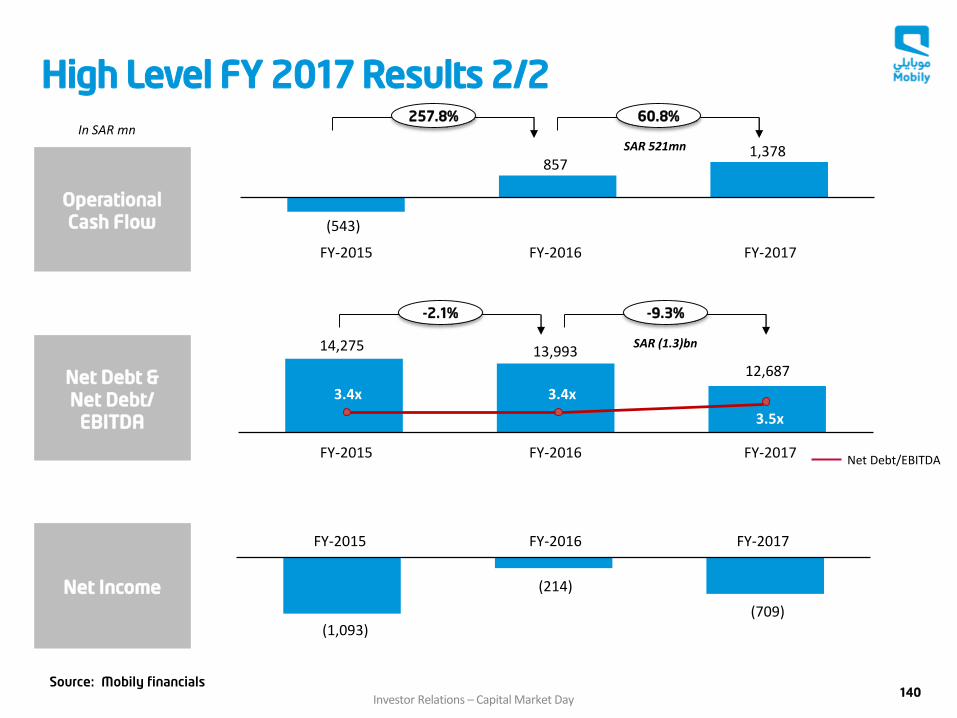
OperationalCash Flow
Net Debt & Net Debt/
EBITDA
Net Income
Source: Mobily financials
High Level FY 2017 Results 2/2
1,378
FY-2017FY-2016FY-2015
(543)
857
13,99314,275
12,687
(709)
(214)
(1,093)
60.8%257.8%
-9.3%-2.1%
3.4x 3.4x
3.5x
FY-2017FY-2016FY-2015
FY-2017FY-2016FY-2015
Net Debt/EBITDA
SAR (1.3)bn
SAR 521mn
Investor Relations – Capital Market Day140
In SAR mn
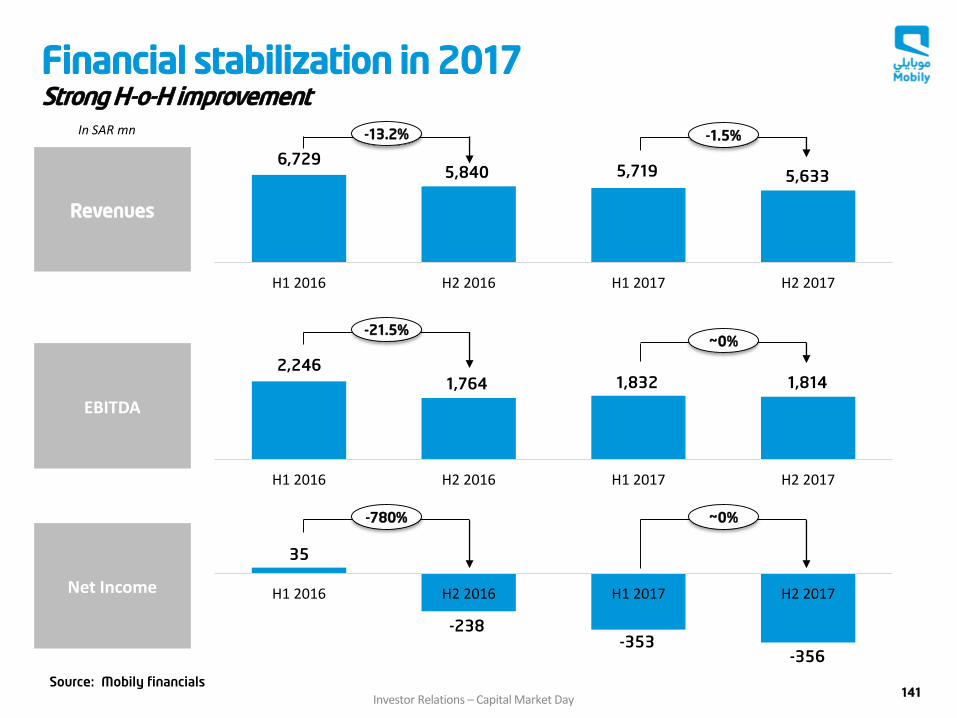
H1 2016 H2 2016 H1 2017 H2 2017
Revenues
EBITDA
H1 2016 H2 2016 H1 2017 H2 2017
Net Income H1 2016 H2 2016 H1 2017 H2 2017
6,7295,840 5,719 5,633
2,2461,764 1,832 1,814
35
-238-353
-356
-13.2% -1.5%
-21.5%~0%
-780% ~0%
Financial stabilization in 2017 Strong H-o-H improvement
Source: Mobily financials 141
In SAR mn
Investor Relations – Capital Market Day
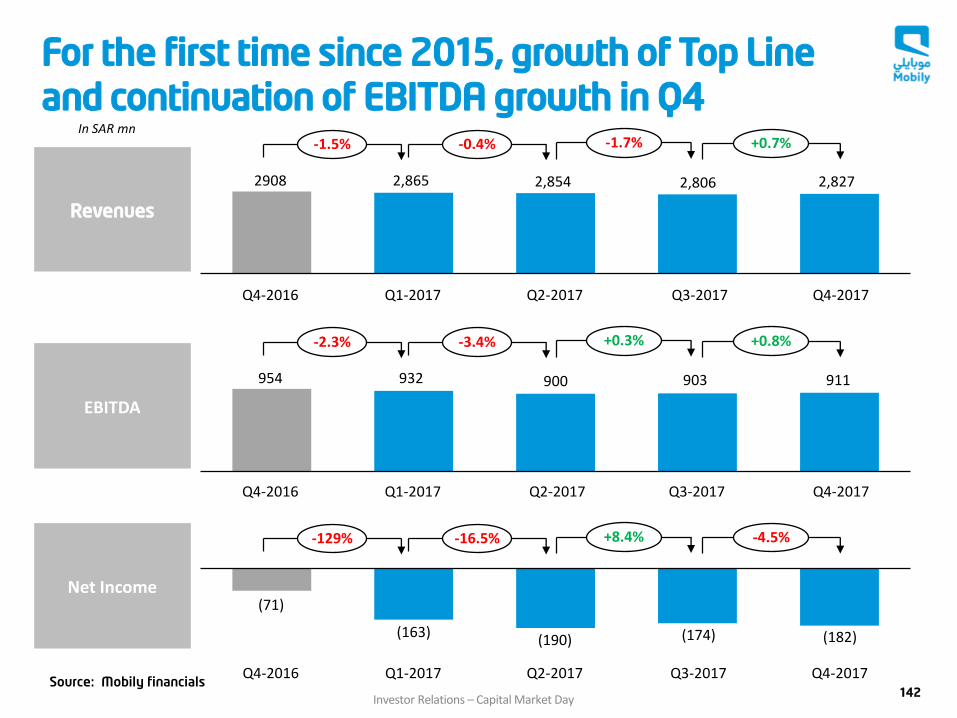
Revenues
EBITDA
Net Income
Source: Mobily financials
For the first time since 2015, growth of Top Line and continuation of EBITDA growth in Q4
2,854
Q4-2017
2,827
Q3-2017
2,806
Q2-2017Q1-2017
2,865
Q3-2017
903
Q1-2017
+0.8%+0.3%
Q4-2017
911
-3.4%
Q2-2017
900932
(190)
Q3-2017
(174)
Q1-2017 Q4-2017
(182)
Q2-2017
(163)
Q4-2016
2908
Q4-2016
954
Q4-2016
(71)
-2.3%
-4.5%+8.4%-16.5%-129%
+0.7%-1.7%-0.4%-1.5%
142
In SAR mn
Investor Relations – Capital Market Day
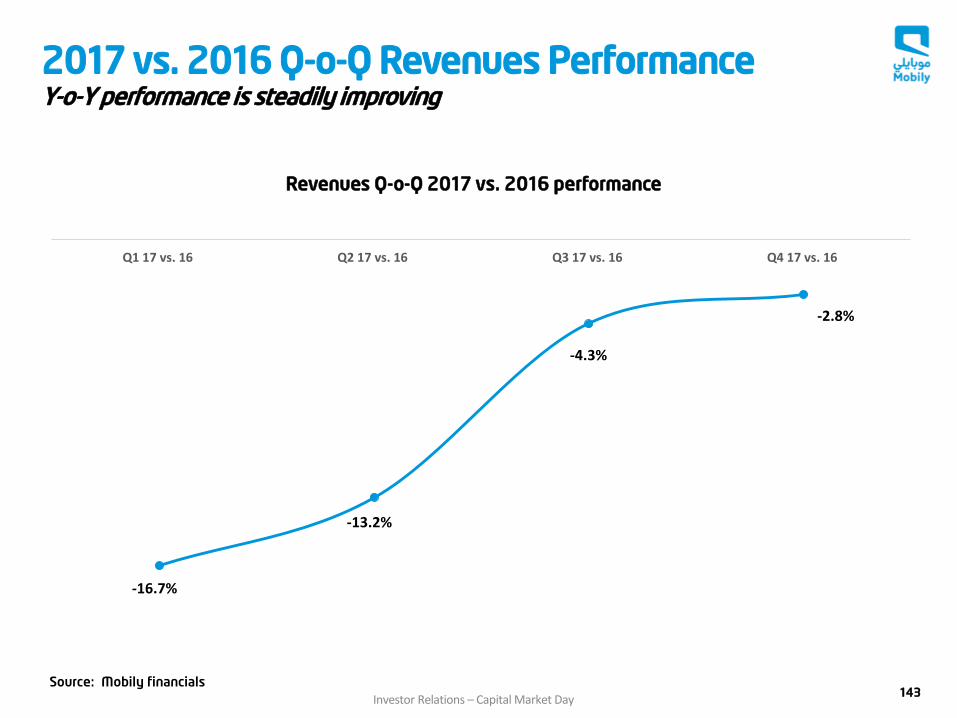
Source: Mobily financials
2017 vs. 2016 Q-o-Q Revenues PerformanceY-o-Y performance is steadily improving
-16.7%
-13.2%
-4.3%
-2.8%
-18.0%
-16.0%
-14.0%
-12.0%
-10.0%
-8.0%
-6.0%
-4.0%
-2.0%
0.0%Q1 17 vs. 16 Q2 17 vs. 16 Q3 17 vs. 16 Q4 17 vs. 16
Revenues Q-o-Q 2017 vs. 2016 performance
143Investor Relations – Capital Market Day
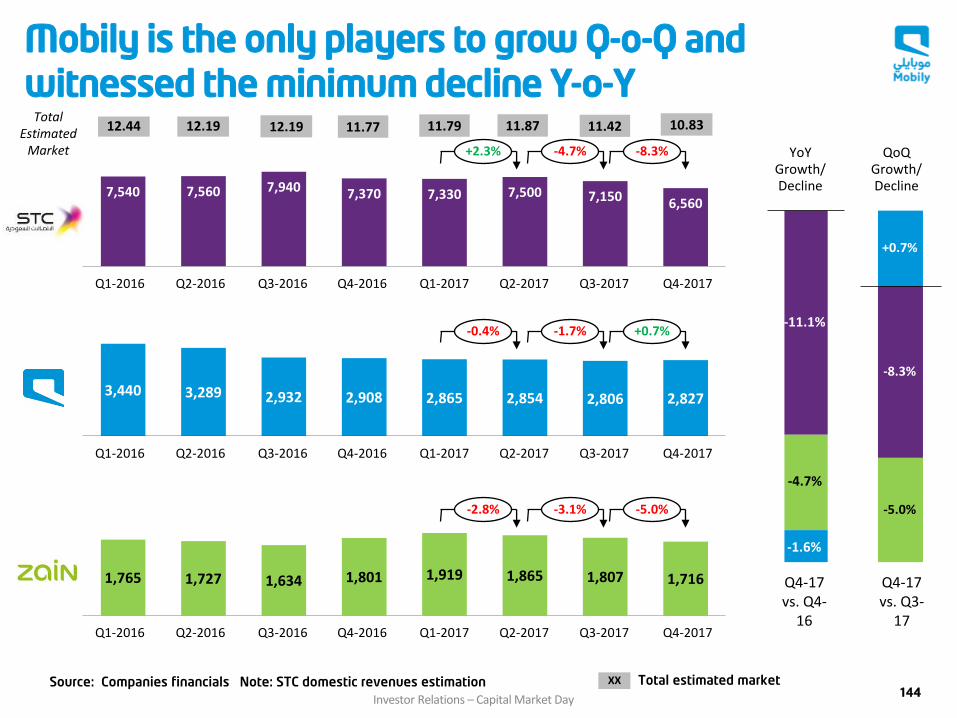
Source: Companies financials Note: STC domestic revenues estimation
Mobily is the only players to grow Q-o-Q and witnessed the minimum decline Y-o-Y
7,540 7,560 7,940 7,370 7,330 7,500 7,150 6,560
Q4-2017Q1-2017Q1-2016 Q4-2016Q3-2016 Q2-2017 Q3-2017Q2-2016
Q4-17 vs. Q4-
16
-1.6%
-4.7%
-11.1%
Q4-17 vs. Q3-
17
-5.0%
+0.7%
-8.3%
YoYGrowth/Decline
QoQGrowth/Decline
3,440 3,289 2,932 2,908 2,865 2,854 2,806 2,827
Q4-2017Q1-2017Q1-2016 Q4-2016Q3-2016 Q2-2017 Q3-2017Q2-2016
1,765 1,727 1,634 1,801 1,919 1,865 1,807 1,716
Q4-2017Q1-2017Q1-2016 Q4-2016Q3-2016 Q2-2017 Q3-2017Q2-2016
Total Estimated
Market
-0.4% -1.7% +0.7%
-2.8% -3.1% -5.0%
+2.3% -4.7% -8.3%
11.7712.19 12.19 11.79 11.4212.44 11.87 10.83
XX Total estimated market 144
Investor Relations – Capital Market Day
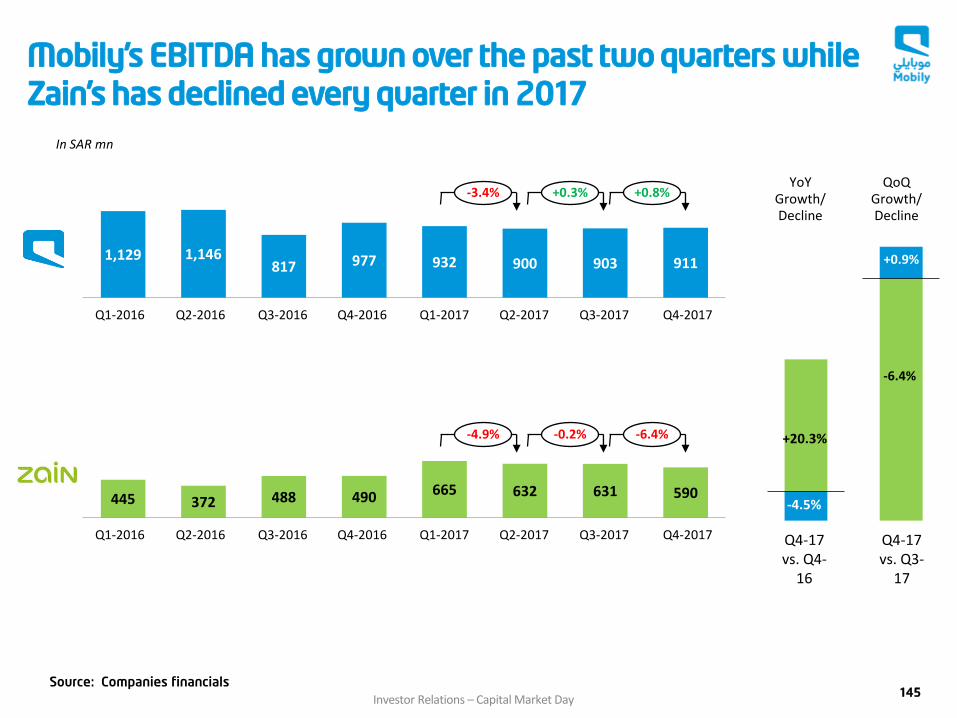
Source: Companies financials
Q4-17 vs. Q4-
16
-4.5%
+20.3%
Q4-17 vs. Q3-
17
-6.4%
YoYGrowth/Decline
QoQGrowth/Decline
1,129 1,146817 977 932 900 903 911
Q4-2017Q1-2017Q1-2016 Q4-2016Q3-2016 Q2-2017 Q3-2017Q2-2016
445 372 488 490 665 632 631 590
Q4-2017Q1-2017Q1-2016 Q4-2016Q3-2016 Q2-2017 Q3-2017Q2-2016
In SAR mn
-3.4% +0.3% +0.8%
-4.9% -0.2% -6.4%
Mobily’s EBITDA has grown over the past two quarters while Zain’s has declined every quarter in 2017
145Investor Relations – Capital Market Day
+0.9%
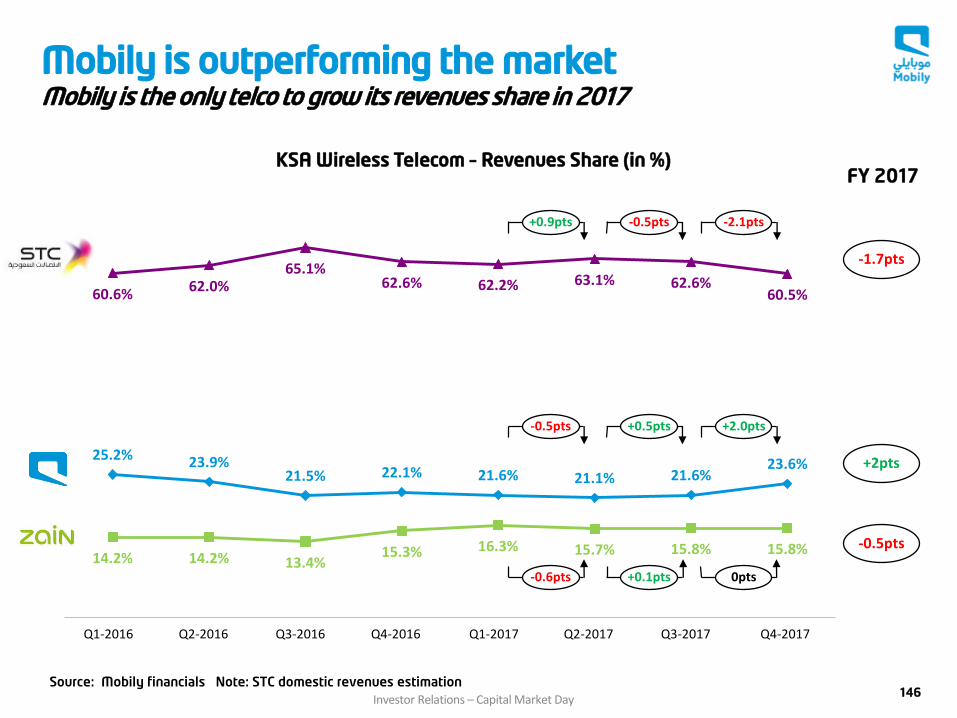
Mobily is outperforming the marketMobily is the only telco to grow its revenues share in 2017
FY 2017KSA Wireless Telecom – Revenues Share (in %)
Source: Mobily financials Note: STC domestic revenues estimation
60.6% 62.0%65.1%
62.6% 62.2% 63.1% 62.6%60.5%
25.2% 23.9%21.5% 22.1% 21.6% 21.1% 21.6%
23.6%
14.2% 14.2% 13.4%15.3% 16.3% 15.7% 15.8% 15.8%
-2.1pts
Q4-2017Q1-2017Q1-2016 Q4-2016Q3-2016 Q2-2017 Q3-2017Q2-2016
-0.5pts+0.9pts
+2.0pts+0.5pts-0.5pts
0pts+0.1pts-0.6pts
-1.7pts
+2pts
-0.5pts
146Investor Relations – Capital Market Day
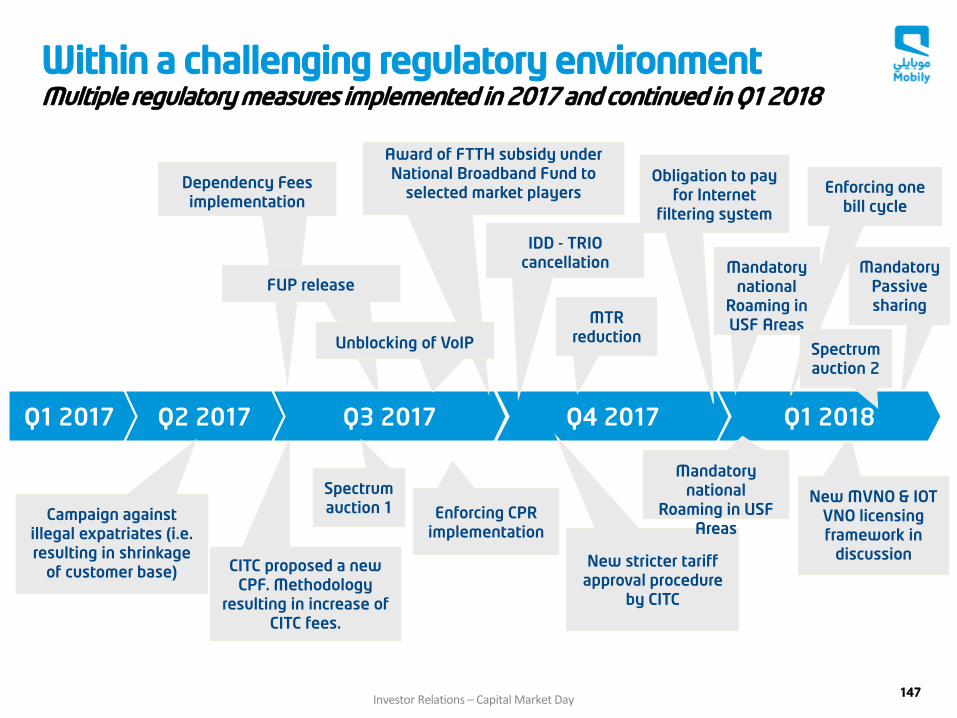
Mandatory Passive sharing
New MVNO & IOT VNO licensing framework in
discussion
Dependency Fees implementation
FUP release
CITC proposed a new CPF. Methodology
resulting in increase of CITC fees.
Q1 2017 Q2 2017 Q3 2017 Q4 2017
Enforcing CPR implementation
IDD - TRIO cancellation
Within a challenging regulatory environmentMultiple regulatory measures implemented in 2017 and continued in Q1 2018
Campaign against illegal expatriates (i.e. resulting in shrinkage
of customer base)New stricter tariff
approval procedure by CITC
Award of FTTH subsidy under National Broadband Fund to
selected market players
MTR reductionUnblocking of VoIP
Spectrum auction 1
Q1 2018
Obligation to pay for Internet
filtering system
Mandatory national
Roaming in USF Areas
Mandatory national
Roaming in USF Areas
Enforcing one bill cycle
Spectrum auction 2
147Investor Relations – Capital Market Day
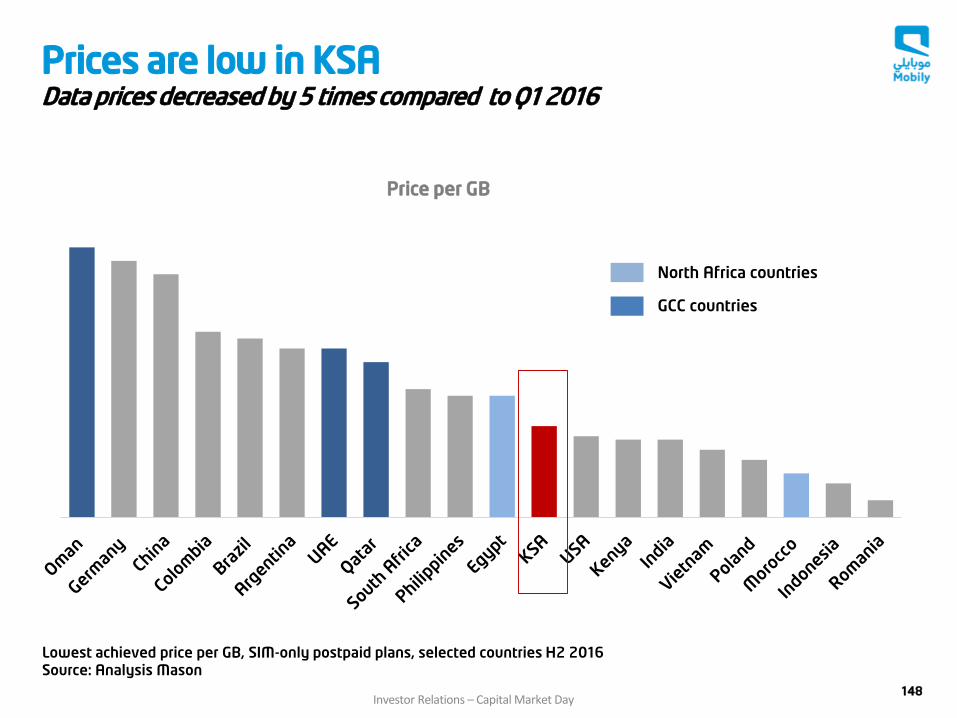
148
Prices are low in KSA Data prices decreased by 5 times compared to Q1 2016
Lowest achieved price per GB, SIM-only postpaid plans, selected countries H2 2016Source: Analysis Mason
Price per GB
North Africa countries
GCC countries
Investor Relations – Capital Market Day
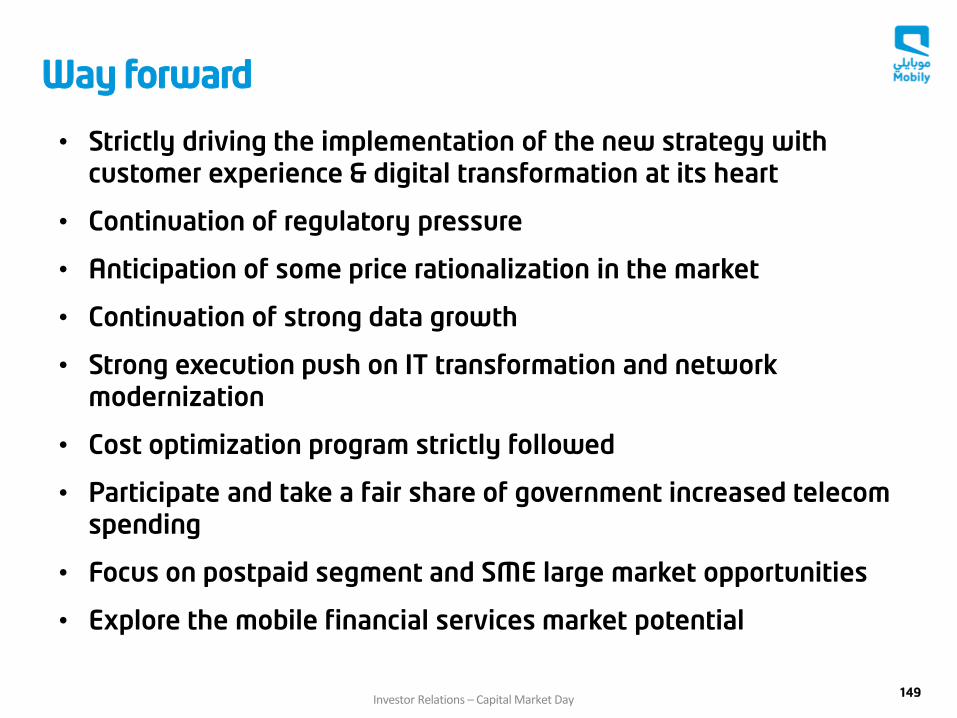
Way forward
149
• Strictly driving the implementation of the new strategy with customer experience & digital transformation at its heart
• Continuation of regulatory pressure
• Anticipation of some price rationalization in the market
• Continuation of strong data growth
• Strong execution push on IT transformation and network modernization
• Cost optimization program strictly followed
• Participate and take a fair share of government increased telecom spending
• Focus on postpaid segment and SME large market opportunities
• Explore the mobile financial services market potential
Investor Relations – Capital Market Day

THANK YOU
Q&A
Etisalat GroupCapital Markets Day 2018
Etisalat Misr Operations
Hazem Metwally
Chief Executive Officer – Etisalat Misr
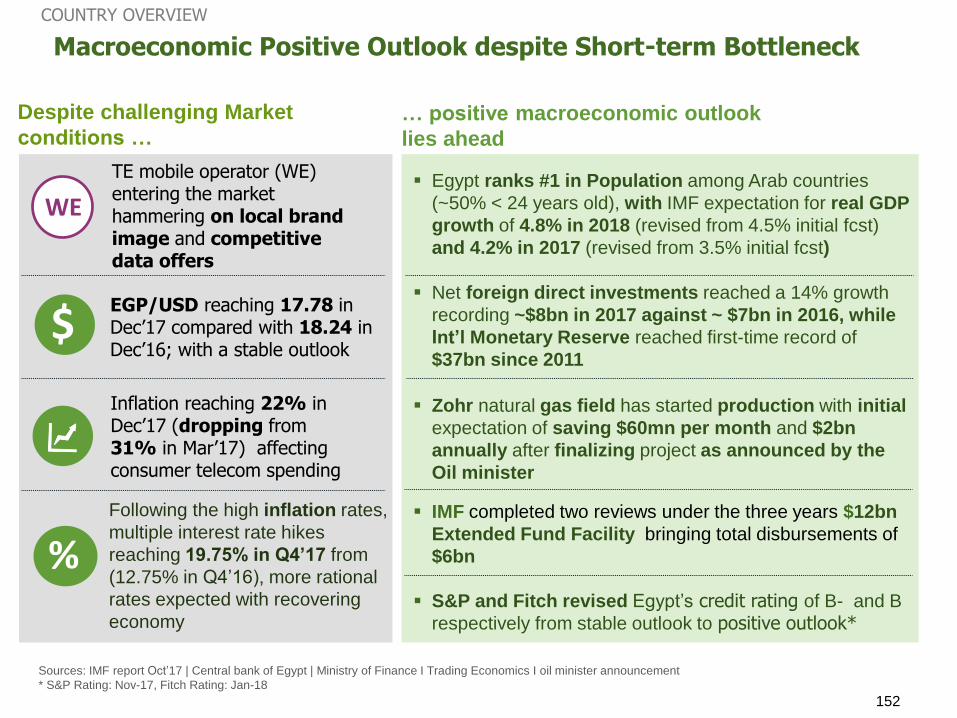
152
COUNTRY OVERVIEW
… positive macroeconomic outlook
lies ahead
Despite challenging Market
conditions …
TE mobile operator (WE) entering the market hammering on local brand image and competitive data offers
EGP/USD reaching 17.78 in Dec’17 compared with 18.24 in Dec’16; with a stable outlook
S&P and Fitch revised Egypt’s credit rating of B- and B
respectively from stable outlook to positive outlook*
IMF completed two reviews under the three years $12bn
Extended Fund Facility bringing total disbursements of
$6bn
Inflation reaching 22% in Dec’17 (dropping from 31% in Mar’17) affecting consumer telecom spending
Macroeconomic Positive Outlook despite Short-term Bottleneck
Following the high inflation rates,
multiple interest rate hikes
reaching 19.75% in Q4’17 from
(12.75% in Q4’16), more rational
rates expected with recovering
economy
%
$
Sources: IMF report Oct’17 | Central bank of Egypt | Ministry of Finance I Trading Economics I oil minister announcement
* S&P Rating: Nov-17, Fitch Rating: Jan-18
Egypt ranks #1 in Population among Arab countries
(~50% < 24 years old), with IMF expectation for real GDP
growth of 4.8% in 2018 (revised from 4.5% initial fcst)
and 4.2% in 2017 (revised from 3.5% initial fcst)
WE
Net foreign direct investments reached a 14% growth
recording ~$8bn in 2017 against ~ $7bn in 2016, while
Int’l Monetary Reserve reached first-time record of
$37bn since 2011
Zohr natural gas field has started production with initial
expectation of saving $60mn per month and $2bn
annually after finalizing project as announced by the
Oil minister
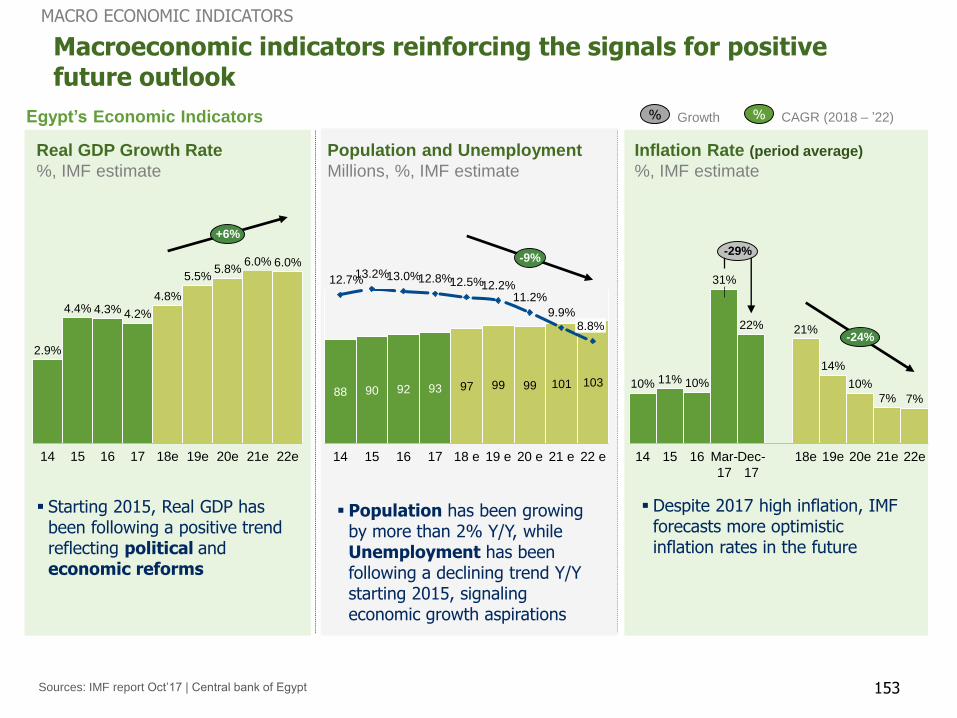
153
Egypt’s Economic Indicators % CAGR (2018 – ’22)
Inflation Rate (period average)
%, IMF estimate
Starting 2015, Real GDP has been following a positive trend reflecting political andeconomic reforms
Despite 2017 high inflation, IMF forecasts more optimistic inflation rates in the future
2.9%
4.4% 4.3% 4.2%
4.8%
5.5%5.8%
6.0% 6.0%
1714 15 16 19e18e 20e 21e 22e
+6%
12.7%13.2%13.0%12.8%12.5%12.2%
11.2%
9.9%
92
15
103
14
88
17
9390
16 19 e
97
18 e
99 99
20 e
101
21 e
8.8%
22 e
-9%
Sources: IMF report Oct’17 | Central bank of Egypt
31%
18e14 Dec-
17
16 21e15 20eMar-
17
19e 22e
21%
10%
7%
11% 10%
22%
14%
10%
7%
-29%
-24%
MACRO ECONOMIC INDICATORS
Macroeconomic indicators reinforcing the signals for positive future outlook
Population has been growing by more than 2% Y/Y, while Unemployment has been following a declining trend Y/Y starting 2015, signaling economic growth aspirations
Population and Unemployment
Millions, %, IMF estimate
Real GDP Growth Rate
%, IMF estimate
% Growth
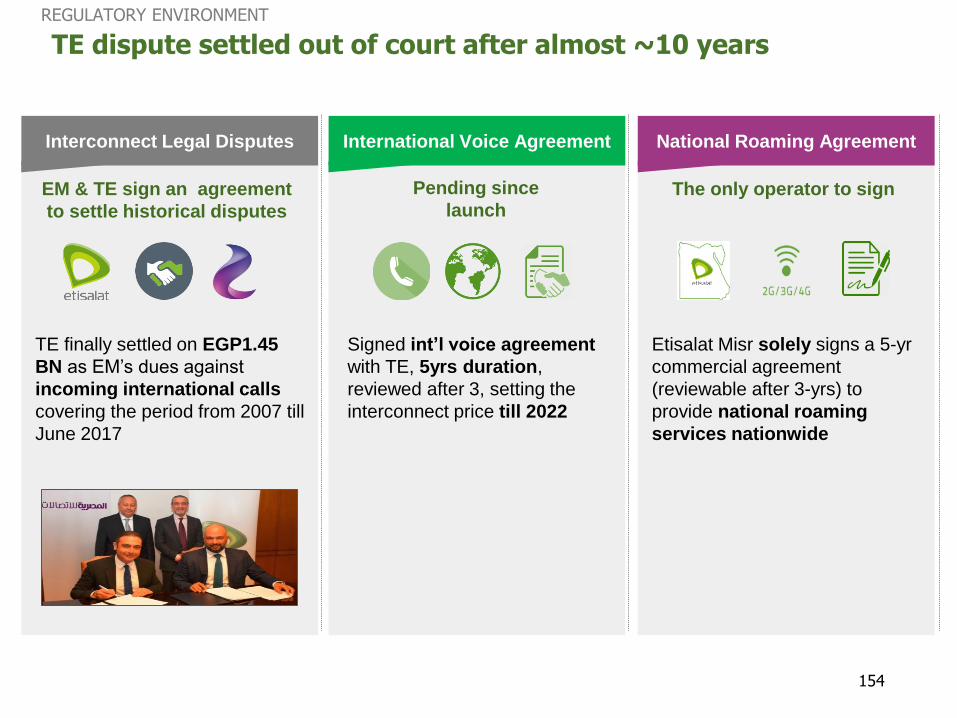
154
TE dispute settled out of court after almost ~10 years
REGULATORY ENVIRONMENT
Interconnect Legal Disputes
TE finally settled on EGP1.45
BN as EM’s dues against
incoming international calls
covering the period from 2007 till
June 2017
EM & TE sign an agreement
to settle historical disputes
International Voice Agreement
Signed int’l voice agreement
with TE, 5yrs duration,
reviewed after 3, setting the
interconnect price till 2022
Pending since
launch
National Roaming Agreement
Etisalat Misr solely signs a 5-yr
commercial agreement
(reviewable after 3-yrs) to
provide national roaming
services nationwide
The only operator to sign
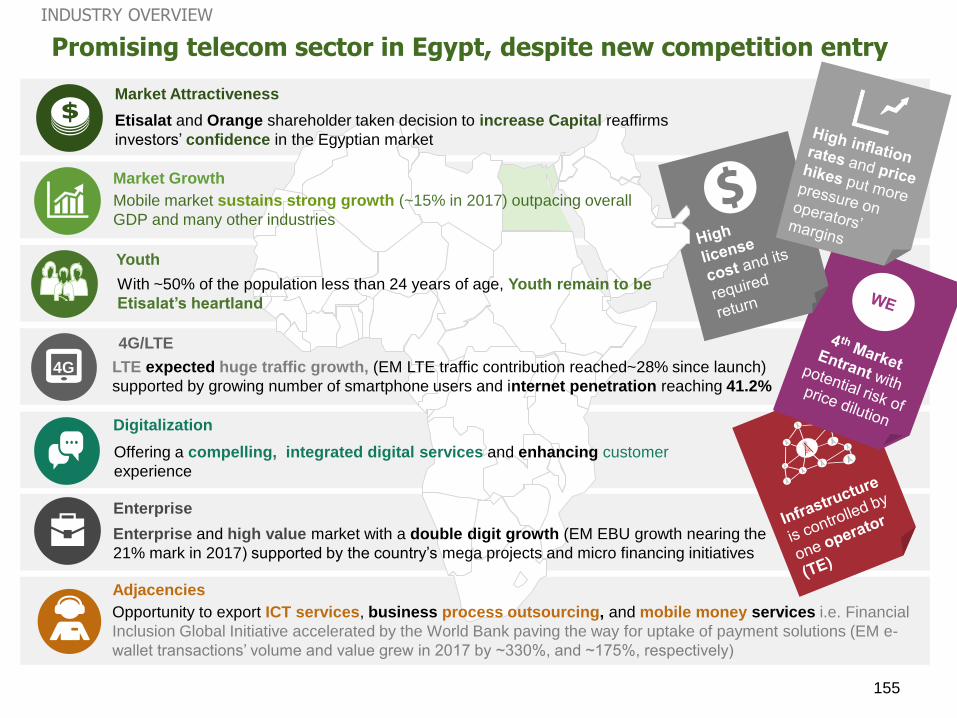
155
INDUSTRY OVERVIEW
Promising telecom sector in Egypt, despite new competition entry
4G
Adjacencies
Market Growth
Mobile market sustains strong growth (~15% in 2017) outpacing overall
GDP and many other industries
Youth
With ~50% of the population less than 24 years of age, Youth remain to be
Etisalat’s heartland
4G/LTE
LTE expected huge traffic growth, (EM LTE traffic contribution reached~28% since launch)
supported by growing number of smartphone users and internet penetration reaching 41.2%
Enterprise
Enterprise and high value market with a double digit growth (EM EBU growth nearing the
21% mark in 2017) supported by the country’s mega projects and micro financing initiatives
Digitalization
Offering a compelling, integrated digital services and enhancing customer
experience
Opportunity to export ICT services, business process outsourcing, and mobile money services i.e. Financial
Inclusion Global Initiative accelerated by the World Bank paving the way for uptake of payment solutions (EM e-
wallet transactions’ volume and value grew in 2017 by ~330%, and ~175%, respectively)
Market Attractiveness
Etisalat and Orange shareholder taken decision to increase Capital reaffirms
investors’ confidence in the Egyptian market

156
Focus on high value and
data segments, adopting
more-for-more
proposition approach
Capitalizing on Capital
increase, and
rebranding to retrieve
its market position
orange vodafone
EM remarkably became 2nd market player across all KPIs
COMPETITION LANDSCAPE
Focus on Data, Youth,
and Enterprise
segments supported by
resources optimization
and Capital increase
Value
Share
Market
share
27.7%
28.4%
39%
39.2%
32%
31%
20
16
20
17
EBITDA
Margin
30%
27%
30%
28%
31%
29%
43%
44%
44%
45%
37%
38%
Sources: EM 2017 Financials | Vodafone release |TE investors presentation | Estimate for (We & Orange)
Revenue Growth
6% Revenue Growth19%Revenue
Growth18%
WE
-
0.2%
-
NA
-
2%
Hammers on 1st
national brand, 1st
integrated operator,
and lowest mobile
internet prices
Revenue Growth-
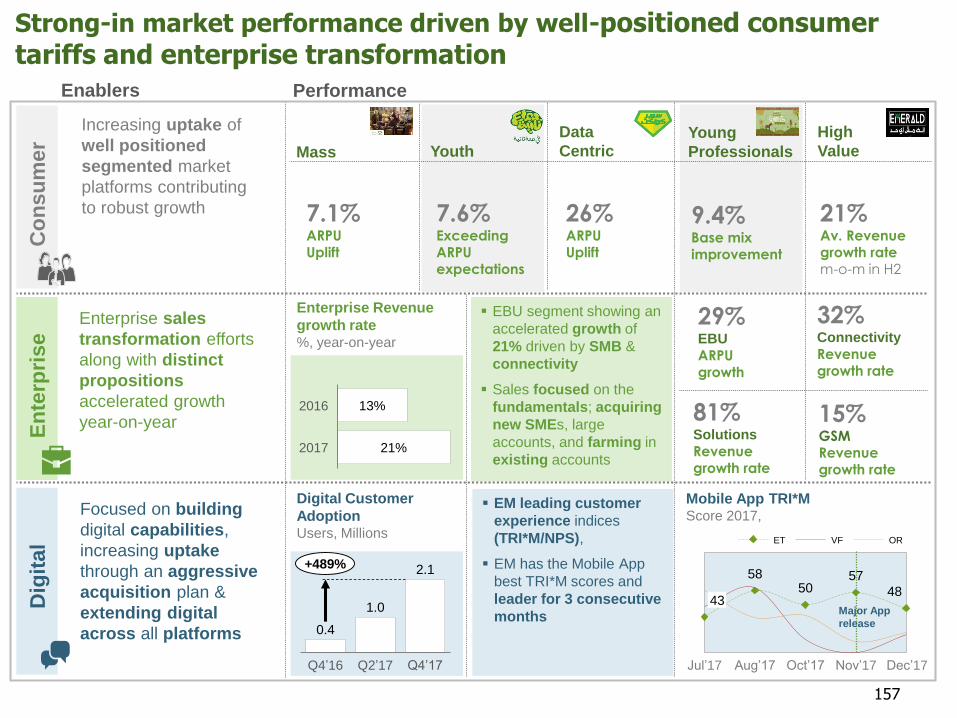
Increasing uptake of
well positioned
segmented market
platforms contributing
to robust growth
Enablers
Strong-in market performance driven by well-positioned consumer tariffs and enterprise transformation
Ec
on
om
ic
157
Co
nsu
mer
7.1%ARPU Uplift
7.6%Exceeding ARPU expectations
26%ARPU Uplift
9.4%Base mix improvement
21%Av. Revenue growth rate m-o-m in H2
Mass Youth
Data
CentricYoung
Professionals
High
Value
Enterprise sales
transformation efforts
along with distinct
propositions
accelerated growth
year-on-yearEc
on
om
icE
nte
rpri
se
Enterprise Revenue
growth rate%, year-on-year
29%EBU
ARPU growth
81%Solutions
Revenue growth rate
32%Connectivity
Revenue growth rate
15%GSMRevenue growth rate
13%
21%2017
2016
EBU segment showing an
accelerated growth of
21% driven by SMB &
connectivity
Sales focused on the
fundamentals; acquiring
new SMEs, large
accounts, and farming in
existing accounts
Focused on building
digital capabilities,
increasing uptake
through an aggressive
acquisition plan &
extending digital
across all platforms
Ec
on
om
icD
igit
al
Digital Customer
AdoptionUsers, Millions
EM leading customer
experience indices
(TRI*M/NPS),
EM has the Mobile App
best TRI*M scores and
leader for 3 consecutive
months
Performance
0.4
1.0
2.1
Q4’17Q4’16 Q2’17
+489%58
5057
48
Aug’17Jul’17 Nov’17 Dec’17Oct’17
43
ET VF OR
Mobile App TRI*MScore 2017,
Major App
release
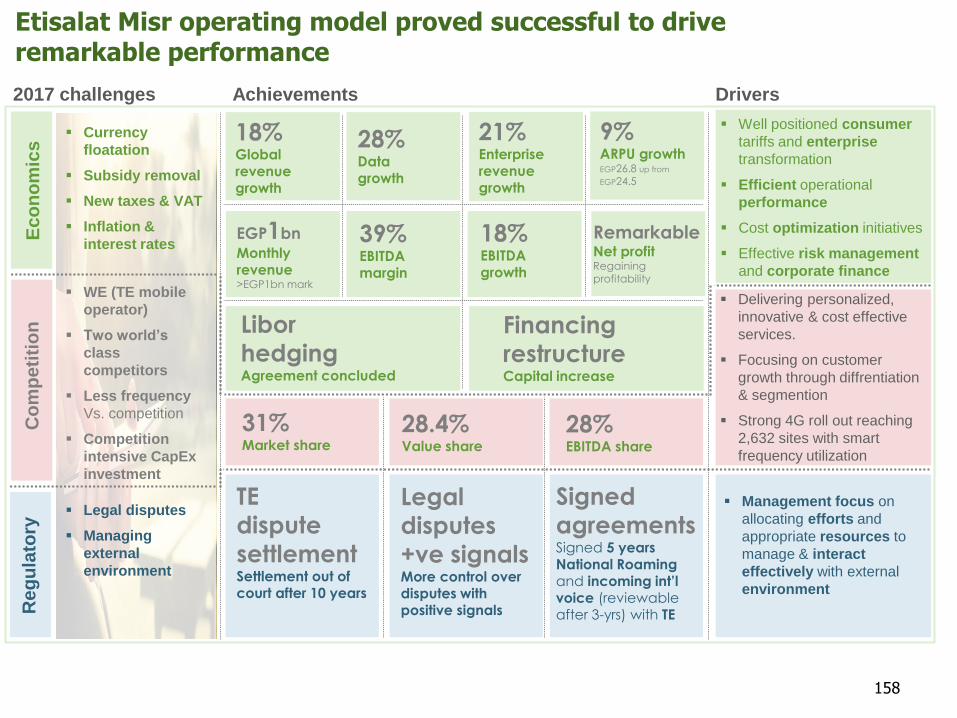
Currency
floatation
Subsidy removal
New taxes & VAT
Inflation &
interest rates
Legal disputes
Managing
external
environment
Achievements
Well positioned consumer
tariffs and enterprise
transformation
Efficient operational
performance
Cost optimization initiatives
Effective risk management
and corporate finance
Drivers 2017 challenges
Etisalat Misr operating model proved successful to drive remarkable performance
WE (TE mobile
operator)
Two world’s
class
competitors
Less frequency
Vs. competition
Competition
intensive CapEx
investment
Delivering personalized,
innovative & cost effective
services.
Focusing on customer
growth through diffrentiation
& segmention
Strong 4G roll out reaching
2,632 sites with smart
frequency utilization
Ec
on
om
ic
18%Global revenue growth
28%Data growth
21%Enterprise revenue growth
39%EBITDA margin
18%EBITDA growth
EGP1bnMonthly revenue>EGP1bn mark
9%ARPU growthEGP26.8 up from
EGP24.5
Libor
hedgingAgreement concluded
Financing
restructureCapital increase
31%Market share
28.4%Value share
28%EBITDA share
TE
dispute
settlementSettlement out of court after 10 years
Legal
disputes
+ve signals More control over disputes with positive signals
Signed
agreements Signed 5 years National Roaming and incoming int’l voice (reviewable after 3-yrs) with TE
158
Ec
on
om
ics
Co
mp
eti
tio
nR
eg
ula
tory
Management focus on
allocating efforts and
appropriate resources to
manage & interact
effectively with external
environment
RemarkableNet profitRegaining profitability
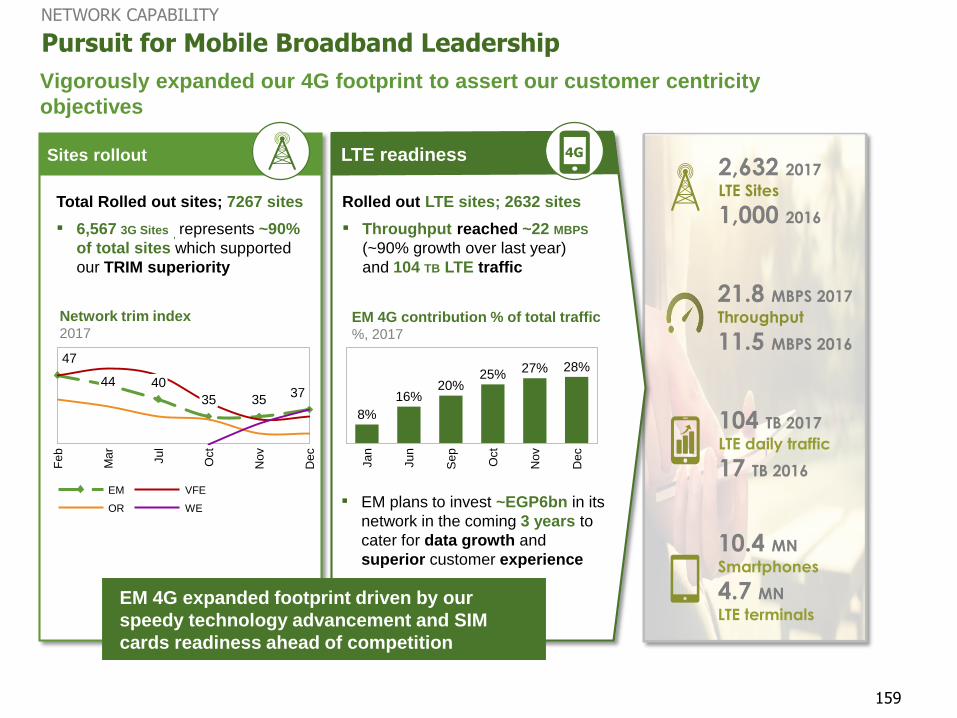
LTE readiness
159
47
3537
Nov
Oct
Ju
l
44
Fe
b
Dec
Ma
r
35
40
Pursuit for Mobile Broadband Leadership
NETWORK CAPABILITY
Vigorously expanded our 4G footprint to assert our customer centricity
objectives
8%
16%20%
25%27% 28%
Ju
n
Nov
Se
p
Ja
n
Oct
Dec
Network trim index 2017
EM VFE
OR WE
EM 4G contribution % of total traffic %, 2017
Total Rolled out sites; 7267 sites
▪ 6,567 3G Sites , represents ~90%
of total sites which supported
our TRIM superiority
Rolled out LTE sites; 2632 sites
▪ Throughput reached ~22 MBPS
(~90% growth over last year)
and 104 TB LTE traffic
Sites rollout
▪ EM plans to invest ~EGP6bn in its
network in the coming 3 years to
cater for data growth and
superior customer experience
EM 4G expanded footprint driven by our
speedy technology advancement and SIM
cards readiness ahead of competition
2,632 2017
LTE Sites
1,000 2016
104 TB 2017
LTE daily traffic
17 TB 2016
21.8 MBPS 2017
Throughput
11.5 MBPS 2016
10.4 MN
Smartphones
4.7 MN
LTE terminals
4G

2018 and beyond
MOVING FORWARD
Customer
Environment
Value
Conversion
Digitalization
4G
1
2
3
4
5
6
Emphasis on fundamental execution and deliver value to shareholders through a double digit growth & healthy cash flow
Continue building a superior network offering best 4G performance, optimizing CapEx for revenue yield
Continue enhancing customer experince inline with our digital journey & direct sales expansion
Offer fully integrated fixed & mobile services
Focus on customer revenue growth through differentiated& segmented offerings
Managing competitive landscape to avoid price war & shredding market value via a robust mitigation plan from technology & commercial perspective
Enhancing adjacent revenue streams through outsourcing business & mobile money services7Adjacencies
160

THANK YOU
Q&A
Etisalat GroupCapital Markets Day 2018
Closing Remarks
Saleh Al-Abdooli
Group Chief Executive Officer


![Coverage Countries & Networks DGM SIM: Voice, SMS & DATA...EGYPT ETISALAT MOBILE - ETISALAT MISR - Egitto [EGYEM] EGYPT MOBILE - (ECMS-MobiNil) [EGYAR] EGYPT VODAFONE MOBILE - Vodafone](https://img.pdfslide.net/doc/110x75/5f02b9077e708231d405b005/coverage-countries-networks-dgm-sim-voice-sms-data-egypt-etisalat.jpg)


![[XLS]static.api.telapi.comstatic.api.telapi.com/carrier_lookup/TelAPI_Carrier... · Web viewtelapi_archive_prd Areeba Afghanistan AF Etisalat Afghanistan US AMC AL Eagle Mobile Plus](https://img.pdfslide.net/doc/110x75/5ad9b29e7f8b9add658baaa2/xls-viewtelapiarchiveprd-areeba-afghanistan-af-etisalat-afghanistan-us-amc-al.jpg)