Embed Size (px)
Citation preview

E*TRADE FINANCIALINVESTOR PRESENTATION
July 2020
© 2020 E*TRADE Financial Corporation. All rights reserved.
2
Notice to investors
This presentation contains certain forward-looking statements regarding E*TRADE Financial Corporation’s (the “Company”) future plans, objectives, outlook, strategies, expectations
and intentions relating to its business and future financial and operating results and the assumptions that underlie these matters, including its outlook on the brokerage industry and
the broader economic environment, the Company’s strategic business initiatives, including bolstering customer acquisition and retention, the Company’s capital plan, the Company’s
balance sheet plans and expected costs, the Company's ability to generate capital and pay additional dividends in the future, the Company’s ability to continue to grow and deliver
value for its shareholders, including in various interest rate environments, the consummation of the proposed transaction with Morgan Stanley and the anticipated benefits thereof,
and the extent to which the coronavirus pandemic (COVID-19), and measures taken in response thereto, has had, and could have, an adverse effect on our business, results of
operations and financial condition will depend on future developments, which are highly uncertain and cannot be predicted, including the scope and duration of the outbreak and
actions taken by governmental authorities to contain the financial and economic impact of the outbreak. E*TRADE claims the protection of the safe harbor contained in the Private
Securities Litigation Reform Act of 1995 for all forward-looking statements. Such statements are not guarantees of future performance and are subject to risk, uncertainties and
assumptions which are difficult to predict and outside of the Company’s control. Various factors, including risks and uncertainties referred to in the Company’s most recently filed Form
10-K and subsequent reports on Forms 10-Q and 8-K that the Company files with the U.S. Securities and Exchange Commission (SEC) and that are available for free by visiting
EDGAR on the SEC website at www.sec.gov, could cause the Company’s actual results to differ materially from those indicated by management’s projections or other forward-looking
statements.
Safe Harbor Statement
In addition to financial results prepared in accordance with Generally Accepted Accounting Principles, or GAAP, this presentation also contains certain non-GAAP financial measures.
Management believes that adjusting GAAP measures by excluding or including certain items is helpful to investors and analysts who may wish to use some or all of this information to
analyze the Company’s current performance, prospects, and valuation. Management uses this non-GAAP information internally to evaluate operating performance and in formulating
the budget for future periods. Management believes that the non-GAAP measures discussed below are appropriate for evaluating the operating and liquidity performance of the
Company. It is important to note these non-GAAP measures involve judgment by management and should be considered in addition to, not as a substitute for, the most directly
comparable measures calculated and prepared in accordance with GAAP. Investors and potential investors are encouraged to review the reconciliation of non-GAAP financial
measures with their most direct comparable GAAP financial measures included as an appendix to this presentation.
Non-GAAP financial measures
E*TRADE, E*TRADE Financial, E*TRADE Bank, E*TRADE Savings Bank, E*TRADE Corporate Services, E*TRADE Advisor Network, E*TRADE Advisor Services, the E*TRADE
logo, OptionsHouse, Equity Edge Online, Trust Company of America, Liberty, and Gradifi by E*TRADE are trademarks of E*TRADE Financial Corporation in the United States and in
other countries. All other trademarks are the property of their respective owners. All mentions of the bank and the Company’s bank are in reference to E*TRADE Bank and E*TRADE
Savings Bank, where applicable. All mentions of the parent are in reference to E*TRADE Financial Corporation.
This presentation presents data as of June 30, 2020, unless otherwise indicated. The Company disclaims any obligation to update this presentation or the information contained
herein, except as required by law.
Important notices

3
58%
12%
26%
4%
Company overview
E*TRADE is a leading financial services company and pioneer in the online brokerage industry. Having executed the first-ever online trade by an individual
investor more than 30 years ago, the Company has long been at the forefront of the digital revolution, focused on delivering complete and easy-to-use solutions
for traders, investors, stock plan participants, and registered investment advisors. Founded on the principle of innovation, E*TRADE aims to enhance the
financial independence of traders and investors through a powerful digital offering and professional guidance—over the phone at two national branches and in
person at 30 E*TRADE branches across the United States. E*TRADE operates a bank with the primary purpose of maximizing the value of retail deposits and
providing transactional banking services.
On February 20, 2020, Morgan Stanley agreed to acquire E*TRADE in an all-stock transaction, through which E*TRADE stockholders will receive 1.0432 Morgan
Stanley shares for each E*TRADE share at deal close. The deal received E*TRADE shareholder approval on July 17, 2020 and is expected to close in Q4 2020.
View press release for more information.
Retail channel Institutional channels Performance highlights
All performance and financial metrics presented on a trailing 12-month basis.
Financial
strength
• 39% adjusted operating margin2
• $3.46 diluted EPS
• 13% ROE3
• Net revenue ($ in MMs): $2,869
▪ Net interest income: 1,658
▪ Commissions: 338
▪ Fees & service charges: 752
▪ Other non-interest income: 121
• $0.14 quarterly dividend
Financial
highlights
Trading—platforms for the beginner to
the active derivatives trader
Investing—digitally led capabilities and
managed products
Banking—range of transaction-based
and cash management solutions
E*TRADE Corporate Services is the industry-leading stock plan administrator for plan sponsors and participants globally1
E*TRADE Advisor Services is a seamless integration of powerful technology and specialized support, built to help registered investment advisors (RIAs) realize their full potential
2MM
Corporate Services
accounts
$365.0B
Corporate Services
assets
141K
Advisor Services
accounts
$18.2B
Advisor Services
assets
566K
DARTs
162K
Derivative DARTs
$398.6B
Retail assets
6MM
Retail accounts
Branches: 30
National branches: 2
Employees: ~4,100

4
Q2 in review: Record trading volume and elevated growth
Delivered unparalleled customer activity metrics, capitalizing on the resurgence in equity
markets and stay-at-home working conditions that continued to drive extremely robust
levels of customer engagement.
• Executed more than a million DARTs, up more than 50% over last quarter’s record volume.
• Executed record derivative DARTs, up over 35% sequentially, driven by wider adoption of
E*TRADE’s best-in-class trading tools.
• Generated the second-strongest quarter of net new retail accounts, following Q1’20.
• Generated second-strongest quarter for net new retail assets; April, May, and June
represented three of our five best months on record.
• Improved Corporate Services proceeds retention rate to 24% (12 months post exercise), up
from 15% in 2019, strongest retention ratio in Company history.
• Customer cash grew by $8 billion, as strong net new asset flows and our highest quarter ever
for Corporate Services domestic stock plan proceeds offset a record period of customer net buy
activity.
• Platform utilization is up significantly, with customers logging in over 200 million times during
the period, up over 100% from the year-ago quarter.
Pre-tax income of $264 million increased $8 million sequentially, as higher trading-
related revenue offset pressure from the lower interest rate environment and higher
expenses associated with marketing and increased trading volume.
6571,010
187253
20
70
120
170
220
270
0
200
400
600
800
1000
1200
2016 2017 2018 2019 Q1'20 Q2'20
Total DARTs | Derivative DARTs (000s)4
Net new retail accounts annual growth rate6
25.4% 23.8%
0%
5%
10%
15%
20%
25%
30%
2016 2017 2018 2019 Q1'20 Q2'20
Net new retail assets annual growth rate5
20.2% 16.9%
0%
5%
10%
15%
20%
25%
2016 2017 2018 2019 Q1'20 Q2'20
$7.3 $9.4
2016 2017 2018 2019 Q1'20 Q2'20
End of period customer margin balances ($B)
$84.6 $92.2
2016 2017 2018 2019 Q1'20 Q2'20
Total customer cash and deposits ($B)

5
Deep history of innovation and disruption
1982 1983 1986 1989 1992
1993 1996 1997 1998 2000 2002
2003 2005 2008 2009 2010 2012
2015 2016 2017 2018
E*TRADE GROUP
incorporated in
Palo Alto, CA
E*TRADE founder
Bill Porter processes
the first online trade
Develops groundbreaking quick ticket
system to enable customers
to obtain quotes in 15 seconds
McGraw Hill begins offering its news
services online through E*TRADE
(then called TradePlus)
Launches the first IVR service,
allowing customers to automatically
place trades over the phone
First E*TRADE branch
opens on Long Island,
with two trading terminals
E*TRADE IPO Launches pioneering
online mutual fund
center
First financial services site
to earn CPA WebTrust
Seal of Assurance
Launches first
portal solution
for mobile devices
Professional-grade
active trading software
E*TRADE Pro launches
Launches real-time
transfers between
bank and brokerage
accounts
Two-factor authentication
offered—among the first
of its kind for retail
investors
Launches first ever
mobile app for the
digital brokerage
industry, via Blackberry
▪ First iPhone® app
launches
▪ Online Advisor launches
▪ Equity Edge Online®
launches
▪ First to launch iPad®
& Android apps
▪ CNBC live streaming
offered on Pro
▪ First to launch Windows
Phone app
▪ First to offer mobile check
deposit and voice
recognition on iPhone
20192014▪ iOS8 app launch with
biometric logon
▪ First-ever browser-
based trading app
First AppleWatch® app
with account detail
▪ Launches Core Portfolios
robo-advisor as part of the
managed account suite
▪ Acquires OptionsHouse
and its #1-rated options
platform
Launches Power
E*TRADE—combining
advanced tools,
discounted pricing, and
dedicated service for
experienced traders
Acquires TCA—leading
provider of technology
solutions and custody
services for RIAs
▪ Launches Google Assistant
voice commands
▪ Acquires Gradifi—
pioneering student loan
benefit provider

6
Proven leader in retail and institutional channels
E*TRADE
recognized with a
top score of 100%
two years in a row
January 2020
E*TRADE named one
of the Best Places to
Work in 2020
December 2019
August 2019
E*TRADE named #1
Online Broker and
Best for Mutual
Fund Investors
E*TRADE recognized
as finalist for
Excellence in
Diversity & Inclusion
August 2019
Equity Edge Online
rated #1 in Loyalty
and Overall
Satisfaction for eight
consecutive years
September 2019
Platform and technology
Workplace and culture
February 2020 January 2020
E*TRADE earned a
rating of 4.5 out of 5
stars overall
E*TRADE earned a
rating of 4.5 out of 5
stars overall
E*TRADE Core
Portfolios named
one of the Best
Robo-Advisors for
Beginners
September 2019
E*TRADE earned a
rating of 4.2 out of 5
stars overall
March 2020

7
Strategy
LEVERAGE ICONIC BRAND, HYBRID SUPPORT MODEL, AND TECH FOR SCALE AND GROWTH
• Strong and scalable infrastructure serves peak volumes with capacity for growth
• Unrivaled and tech-forward brand drives outsized awareness and consideration
• Digitally led experiences, complemented by professional advice and support
CAPITALIZE ON SYMBIOTIC INSTITUTIONAL CHANNELS
• Grow RIA custody channel utilizing brand, digital ethos, and customer base
• Expand on leading position in stock plans via intuitive platform and expert support1
• Connect customers in need of higher touch services to top-tier advisors
EMPOWER CUSTOMERS VIA POWERFUL DIGITAL OFFERING AND PROFESSIONAL GUIDANCE
• Connect investors with a range of easy-to-use wealth management solutions
• Maintain leading position among active and derivatives traders
• Advance digital banking capabilities to increase engagement with customers
MAXIMIZE SHAREHOLDER VALUE BY HARNESSING FULL VALUE OF CUSTOMER RELATIONSHIPS• Deliver superior return on customer assets
• Generate resilient NIM, funded by low cost of liabilities
• Harness customer cash growth through powerful deposit dynamics

8
Unrivaled and tech-forward brand drives outsized awareness and consideration
LEVERAGE ICONIC BRAND, HYBRID SUPPORT MODEL, AND TECH FOR SCALE AND GROWTH
• Shaking up the
establishment and
challenging
conventions are in the
brand’s DNA
• Rich history of iconic,
famous advertising…
• …Results in strong
and consistent overall
brand awareness
performance
• One of the highest
brand awareness
scores in the category
Heritage ExpressionCustomer advocacy
Executed the first-ever
electronic trade by an
individual more than 30 years
ago
Commands attention like
no other brand in the
category
Democratized investing and
created a new category by
advocating on behalf of
individual investors
Trust and credibility of established brand,
while preserving the spirit of disruption and advocacy at its core

9
Digitally led experiences, complemented by professional advice and support
LEVERAGE ICONIC BRAND, HYBRID SUPPORT MODEL, AND TECH FOR SCALE AND GROWTH
Sophisticated trading tools, advanced portfolio and market tracking, with idea generation and analysis
#1 online broker offering an extremely easy-to-use site for customers and the primary channel to interact with prospects7
Web
Industry leader in mobile applications
Integrations with leading mobile AI assistants
Mobile
Active derivatives trading platform
Equity Edge Online#1 platform in the stock plan administration industry offering unrivaled automation and flexibility1
Liberty
Intuitive technology built for registered investment advisors that simplifies how RIAs invest and manage client assets
24/7 availability via phone, email, or chat from industry licensed representatives
White glove service for highest-tiered customers
Customer Service
~430 FCs available by phone or at branches to provide one-on-one investing advice
Financial Consultants
Active Trader Services
Specialized support for sophisticated high-tier customers with advanced knowledge and skills
Platforms for retail channel Platforms for institutional channels
Professional advice and support across all channels
Corporate Services
Personalized service on a global scale driven by a one-to-one client focus with dedicated relationship and service managers backed by comprehensive training and education
Advisor Services
Dedicated relationship manager acts as a single point of contact offering specialized support
Gradifi
Scalable and streamlined platform for student loan and college savings benefits
10
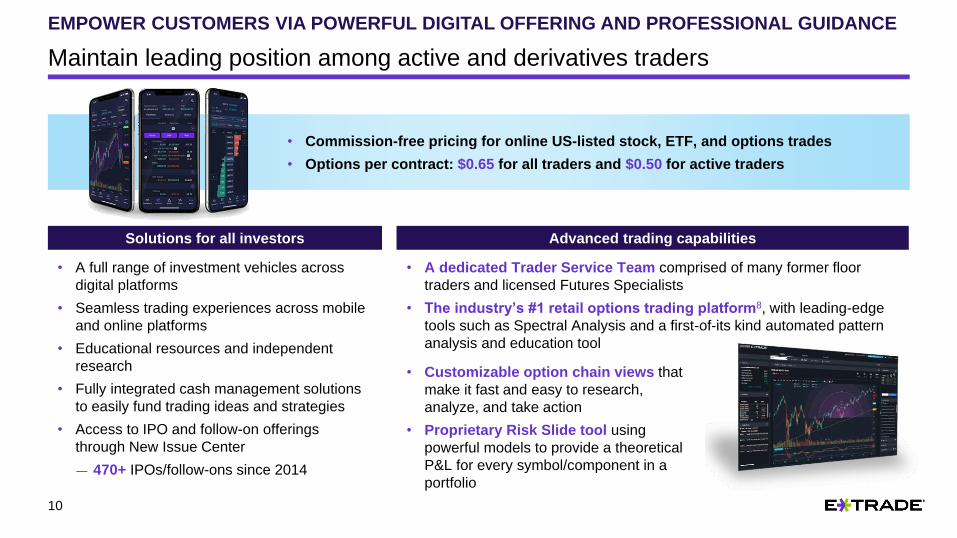
• A full range of investment vehicles across
digital platforms
• Seamless trading experiences across mobile
and online platforms
• Educational resources and independent
research
• Fully integrated cash management solutions
to easily fund trading ideas and strategies
• Access to IPO and follow-on offerings
through New Issue Center
― 470+ IPOs/follow-ons since 2014
Maintain leading position among active and derivatives traders
EMPOWER CUSTOMERS VIA POWERFUL DIGITAL OFFERING AND PROFESSIONAL GUIDANCE
• A dedicated Trader Service Team comprised of many former floor
traders and licensed Futures Specialists
• The industry’s #1 retail options trading platform8, with leading-edge
tools such as Spectral Analysis and a first-of-its kind automated pattern
analysis and education tool
Solutions for all investors Advanced trading capabilities
• Customizable option chain views that
make it fast and easy to research,
analyze, and take action
• Proprietary Risk Slide tool using
powerful models to provide a theoretical
P&L for every symbol/component in a
portfolio
• Commission-free pricing for online US-listed stock, ETF, and options trades
• Options per contract: $0.65 for all traders and $0.50 for active traders

11
42
6692 98
220
27% 31% 33% 34%26%
22%
32%
42%
52%
62%
72%
82%
92%
0
50
100
150
200
250
2016 2017 2018 2019 H1'20
Derivatives DARTs % of total DARTs
Maintain leading position among active and derivatives traders
EMPOWER CUSTOMERS VIA POWERFUL DIGITAL OFFERING AND PROFESSIONAL GUIDANCE
Daily average revenue trades (DARTs)4
000s000s
$B
Average customer margin balancesCustomer net buying (selling) activity
$B
11%14%
17%20%
23%
$6.6$7.7
$10.4 $9.9$8.7
0
2
4
6
8
10
12
2016 2017 2018 2019 H1'20
160209
275 291
835
17% 20%25% 28% 31%
0%
10%
20%
30%
40%
50%
60%
70%
80%
90%
100%
0
100
200
300
400
500
600
700
800
2016 2017 2018 2019 H1'20
Total DARTs Mobile DARTs
($0.6)
$9.2
$13.6
$1.4
$8.2
2016 2017 2018 2019 H1'20
12
Easy-to-use digital
platformsEducation and insights
Professional guidance
and support
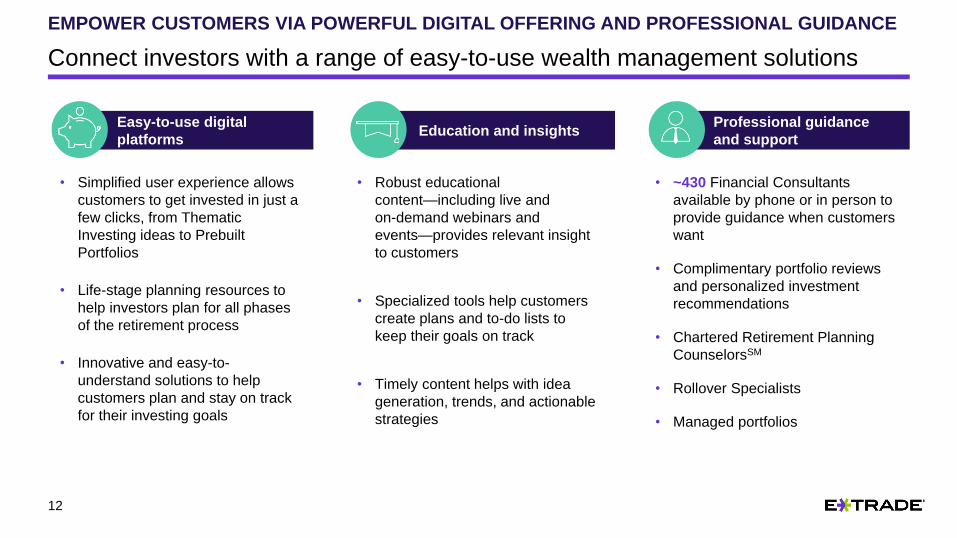
Connect investors with a range of easy-to-use wealth management solutions
EMPOWER CUSTOMERS VIA POWERFUL DIGITAL OFFERING AND PROFESSIONAL GUIDANCE
• Simplified user experience allows
customers to get invested in just a
few clicks, from Thematic
Investing ideas to Prebuilt
Portfolios
• Life-stage planning resources to
help investors plan for all phases
of the retirement process
• Innovative and easy-to-
understand solutions to help
customers plan and stay on track
for their investing goals
• ~430 Financial Consultants
available by phone or in person to
provide guidance when customers
want
• Complimentary portfolio reviews
and personalized investment
recommendations
• Chartered Retirement Planning
CounselorsSM
• Rollover Specialists
• Managed portfolios
• Robust educational
content—including live and
on-demand webinars and
events—provides relevant insight
to customers
• Specialized tools help customers
create plans and to-do lists to
keep their goals on track
• Timely content helps with idea
generation, trends, and actionable
strategies

13
Total retail and advisor services accounts
Connect investors with a range of easy-to-use wealth management solutions
EMPOWER CUSTOMERS VIA POWERFUL DIGITAL OFFERING AND PROFESSIONAL GUIDANCE
• Opportunity to increase engagement with existing
customer base by expanding relationships beyond
trading-based accounts to retirement- and investing-
related assets
• 21% of retail and advisor services accounts are
retirement accounts
• 15% of vested customer assets are in retirement
accounts
Fee-based retail assets10
$B
Total retail and advisor services accounts9Retirement and investing
Retirement accounts
906 952 1,206 1,220 1,262
2016 2017 2018 2019 Q2'20
5,318
3,8993,744
5,159
000s
$B
Total retail and advisor services assets
$B
$232
$280 $302
Total retail and advisor services assets Retirement assets
$382
$54 $66 $68 $86 $89
2016 2017 2018 2019 Q2'20
$B$B
$3.9 $5.4 $5.7 $7.8 $7.7
$18.9 $23.3 $23.3
$30.7 $29.0
$6.6
2016 2017 2018 2019 Q2'20
$23.1
$29.4
$35.6$38.5
Managed product Commission-free ETFsMutual funds
5,966
$417
$36.7

14
Connect investors with a range of easy-to-use wealth management solutions
EMPOWER CUSTOMERS VIA POWERFUL DIGITAL OFFERING AND PROFESSIONAL GUIDANCE
• Bond portfolio built to customer specifications by professional portfolio managers
• Dedicated FC creates a fully customized portfolio based on customer’s needs
• FC guides customers to one of seven investment profiles
• Reviews progress quarterly
• Deliver a diversified, self-directed portfolio free of commissions in just a few clicks
• Automated investing with access to a dedicated team of specialists12
• Diversified, online managed portfolio of ETFs • No proprietary products
• ~9,100 mutual funds• +4,500 no-load, NTF
mutual funds• ~2,300 ETFs
Blend Portfolios
Dedicated Portfolios
Core PortfoliosScreeners and All-Star lists
Min: $500Flat annual fee: 0.30% of assets
Min: $150,000
Min: $25,000 Blended annual fee: 0.90% to 0.65% of assets
Full range of investing solutions—from the self-directed to the fully managed
Fixed Income Portfolios
Min: $250,000
Blended annual fee: 1.25% to 0.95% of assets
Blended annual fee: 0.75% to 0.35% of assets
Prebuilt Portfolios
Standard commissions and fees for mutual funds11
Min: $2,500 (ETFs)$500 (MFs)
Digital FC-drivenHybrid

15
Advance digital banking capabilities to increase engagement with customers
EMPOWER CUSTOMERS VIA POWERFUL DIGITAL OFFERING AND PROFESSIONAL GUIDANCE
Banking with E*TRADE Range of banking solutions
• Suite of digital banking
products that fully
integrates with brokerage
accounts allowing
customers to interact with
their money
• Seamless transfers
between brokerage and
banking accounts allow
customers to manage a
wide range of financial
needs at E*TRADE
• Convenient, secure, low-
fee banking accounts
backed by FDIC insurance
• Premium Savings Account offers an integrated
cash management solution
• Convenient banking solutions
― Free online Bill Pay services
― Unlimited ATM fee refunds
― Mobile check deposit
― Fully supported by Apple Pay®
• E*TRADE Line of Credit is a securities-based
lending solution allowing customers to borrow up to
50% against eligible assets in their E*TRADE
brokerage account
16
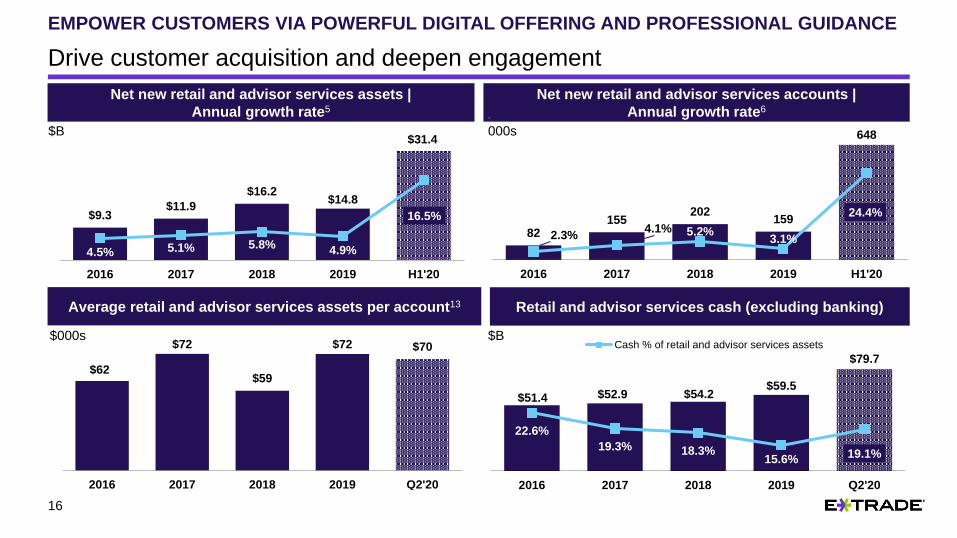
Drive customer acquisition and deepen engagement
EMPOWER CUSTOMERS VIA POWERFUL DIGITAL OFFERING AND PROFESSIONAL GUIDANCE
Net new retail and advisor services accounts |
Annual growth rate6
Net new retail and advisor services assets |
Annual growth rate5
Average retail and advisor services assets per account13
000s$B
Retail and advisor services cash (excluding banking)
$B
3.8%
5.0%
3.8%4.4% 4.4%
$000s
$62
$72
$59
$72 $70
$30
$35
$40
$45
$50
$55
$60
$65
$70
$75
2016 2017 2018 2019 Q2'20
$51.4 $52.9 $54.2$59.5
$79.7
22.6%
19.3% 18.3%15.6% 19.1%
$-
$10.0
$20.0
$30.0
$40.0
$50.0
$60.0
$70.0
$80.0
$90.0
2016 2017 2018 2019 Q2'20
Cash % of retail and advisor services assets
82155
202159
648
2.3%4.1% 5.2%
3.1%
24.4%
0
0
0
0
0
0
0
0
0
-
100
200
300
400
500
600
700
800
2016 2017 2018 2019 H1'20
$9.3$11.9
$16.2$14.8
$31.4
4.5% 5.1% 5.8%4.9%
16.5%
0
0
0
0
0
0
0
5
10
15
20
25
30
35
2016 2017 2018 2019 H1'20

17
• E*TRADE Corporate Services is the industry’s leading
provider of stock plan administration services for public and
private multinational companies
• 2 million stock plan participants and language line
translation in more than 140 languages
• $365.0 billion in assets
• Represents more than 20% of S&P 500® companies
― ~50% of publicly traded US technology companies
― More than 50% of publicly traded US healthcare
companies
― 834 total US publicly traded companies
CAPITALIZE ON SYMBIOTIC INSTITUTIONAL CHANNELS TO DRIVE GROWTH
Industry leading position Award-winning platform
• Equity Edge Online (EEO): #1 in Loyalty and Overall
Satisfaction by stock plan administrators eight years
running1; leading position is the result of more than 30
years of innovation
― Cloud-based platform offers sophisticated functionality
built exclusively for plan administration
• Dedicated implementation
manager for seamless
onboarding and one-to-one
client focus with a dedicated
Relationship Manager and
Service Manager
• Premium executive services delivers exemplary service
to the most senior plan participants including restricted
stock sales support and SEC filing assistance
― First online automated 10b5-1 plan
• Comprehensive benefits capabilities that include
financial wellness and student loan solutions
Expand on leading position in stock plans via intuitive platform and expert support

18
B2B relationship… …to build long-term relationship…creates B2C opportunity…
• Engage, surprise, and delight:
― First-class user experience for
2 million stock plan accounts
― Easy, intuitive interface helps
participants manage, track, and
learn about their equity
compensation
― In-person interactions with FCs at
corporate offices
• Corporation selects E*TRADE
for plan administration
• Support for many equity
vehicles
• Plan participants moved onto
E*TRADE platform, stock plan
account opened
• Sale proceeds converted into E*TRADE
brokerage account:
― Currently retaining 24% of proceeds
12 months post exercise, up from
15% in 2019
― Historically, contribute approximately
1/3 of gross new retail accounts
― Leverage E*TRADE Advisor Network to
attract and retain high-net-worth clients
Expand on leading position in stock plans via intuitive platform and expert support
CAPITALIZE ON SYMBIOTIC INSTITUTIONAL CHANNELS TO DRIVE GROWTH
$B
$73 $94 $94$137
$174$49$65 $76
$111
$134
$30$38 $36
$48
$57
2016 2017 2018 2019 Q2'20
$296
$152
$197 $206
UnvestedVested equitiesVested options
+1/3 of customer cash is sourced from Corporate Services Corporate Services assets
36%
64%
Cash in accounts originallysourced from Corporate Services
Other cash
$365

19
$42$65 $79 $82$6
$23$24 $14
2017 2018 2019 TTM
$259
$439 $424$382 $365 $365
$82$14
$95 ($11)($15) ($42)
($17)
$150
$250
$350
$450
Q2'19 assets New grantsand purchases
Newimplementations
Market impact Cancellations andtransfers
Internationaloutflows
Domesticparticipantproceeds
Taxes Q2'20 assets
Steady growth in the franchise drives Corporate Services asset growth
CAPITALIZE ON SYMBIOTIC INSTITUTIONAL CHANNELS TO DRIVE GROWTH
$B
$0
Corporate Services asset activity over the trailing 12 months
Opportunity to
capture in Retail
and Advisor
Services
channels
Corporate Services inflows Corporate Services domestic participant proceeds
$24$26
$35$42
2017 2018 2019 TTM
$B $B
$48
$88
New grants New client implementations
$103 $96
20
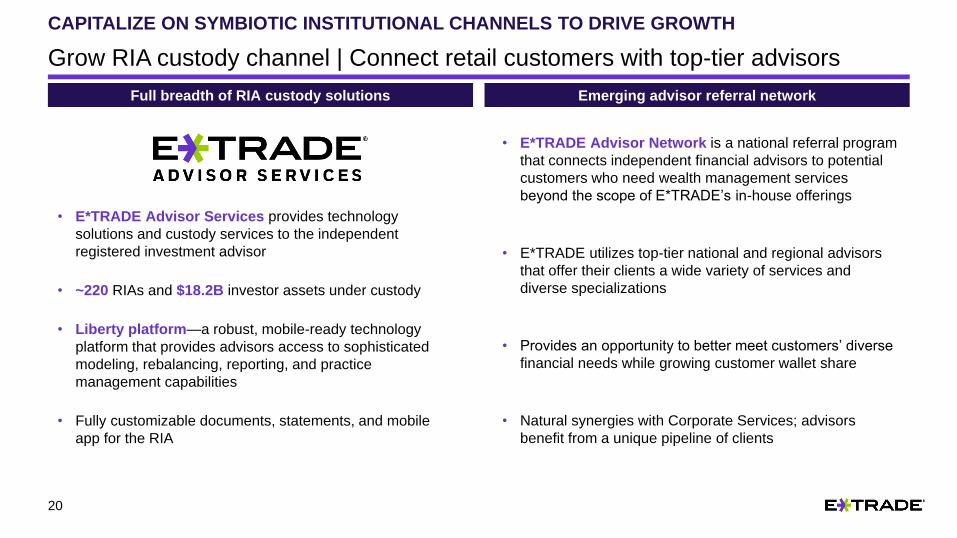
• E*TRADE Advisor Services provides technology
solutions and custody services to the independent
registered investment advisor
• ~220 RIAs and $18.2B investor assets under custody
• Liberty platform—a robust, mobile-ready technology
platform that provides advisors access to sophisticated
modeling, rebalancing, reporting, and practice
management capabilities
• Fully customizable documents, statements, and mobile
app for the RIA
Grow RIA custody channel | Connect retail customers with top-tier advisors
CAPITALIZE ON SYMBIOTIC INSTITUTIONAL CHANNELS TO DRIVE GROWTH
Full breadth of RIA custody solutions Emerging advisor referral network
• E*TRADE Advisor Network is a national referral program
that connects independent financial advisors to potential
customers who need wealth management services
beyond the scope of E*TRADE’s in-house offerings
• E*TRADE utilizes top-tier national and regional advisors
that offer their clients a wide variety of services and
diverse specializations
• Provides an opportunity to better meet customers’ diverse
financial needs while growing customer wallet share
• Natural synergies with Corporate Services; advisors
benefit from a unique pipeline of clients
21
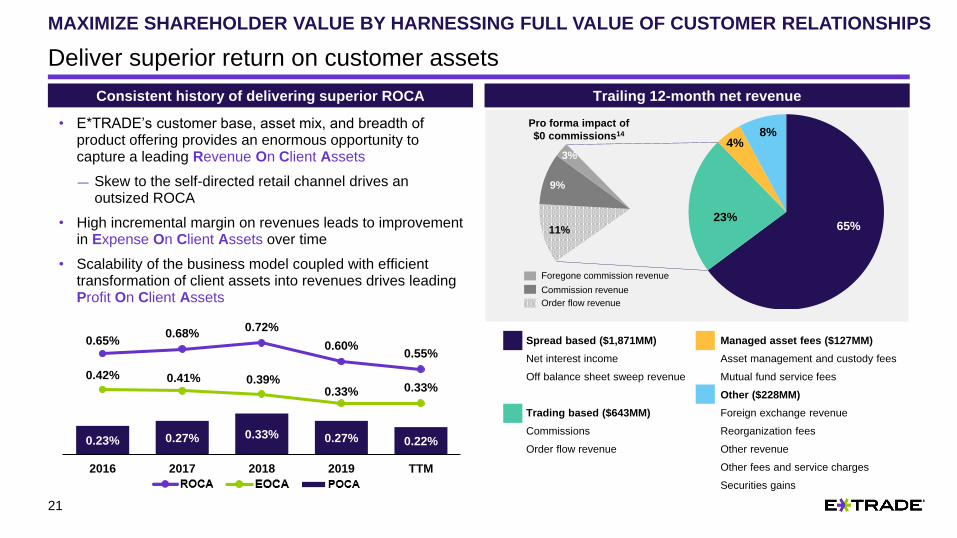
Deliver superior return on customer assets
Trailing 12-month net revenueConsistent history of delivering superior ROCA
Spread based ($1,871MM)
Net interest income
Off balance sheet sweep revenue
Trading based ($643MM)
Commissions
Order flow revenue
Managed asset fees ($127MM)
Asset management and custody fees
Mutual fund service fees
Other ($228MM)
Foreign exchange revenue
Reorganization fees
Other revenue
Other fees and service charges
Securities gains
• E*TRADE’s customer base, asset mix, and breadth of product offering provides an enormous opportunity to capture a leading Revenue On Client Assets
― Skew to the self-directed retail channel drives an outsized ROCA
• High incremental margin on revenues leads to improvement in Expense On Client Assets over time
• Scalability of the business model coupled with efficient transformation of client assets into revenues drives leading Profit On Client Assets
0.23% 0.27% 0.33% 0.27% 0.22%
0.65%0.68%
0.72%
0.60%0.55%
0.42% 0.41% 0.39%0.33% 0.33%
0.00%
0.20%
0.40%
0.60%
0.80%
1.00%
2016 2017 2018 2019 TTM
Pro forma impact of
$0 commissions14
11%
9%
3%
65%23%
4%8%
Order flow revenue
Commission revenue
Foregone commission revenue
MAXIMIZE SHAREHOLDER VALUE BY HARNESSING FULL VALUE OF CUSTOMER RELATIONSHIPS
22
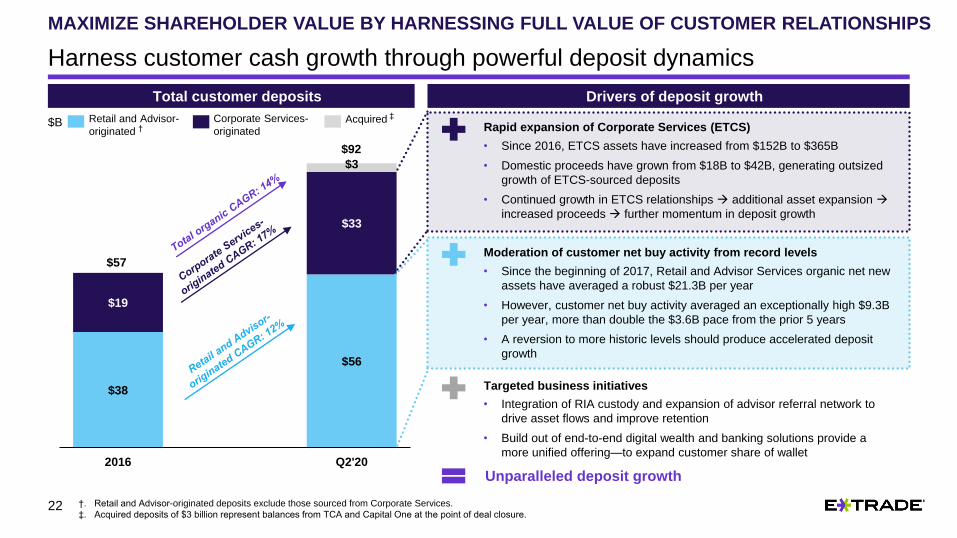
$38
$56
$19
$33
$3
2016 Q2'20
$92
$57
Harness customer cash growth through powerful deposit dynamics
†. Retail and Advisor-originated deposits exclude those sourced from Corporate Services.
‡. Acquired deposits of $3 billion represent balances from TCA and Capital One at the point of deal closure.
$B Corporate Services-
originatedAcquired ‡Retail and Advisor-
originated †
Total customer deposits Drivers of deposit growth
Rapid expansion of Corporate Services (ETCS)
• Since the beginning of 2017, Retail and Advisor Services organic net new
assets have averaged a robust $21.3B per year
• However, customer net buy activity averaged an exceptionally high $9.3B
per year, more than double the $3.6B pace from the prior 5 years
• A reversion to more historic levels should produce accelerated deposit
growth
• Since 2016, ETCS assets have increased from $152B to $365B
• Domestic proceeds have grown from $18B to $42B, generating outsized
growth of ETCS-sourced deposits
• Continued growth in ETCS relationships → additional asset expansion →
increased proceeds → further momentum in deposit growth
Moderation of customer net buy activity from record levels
• Integration of RIA custody and expansion of advisor referral network to
drive asset flows and improve retention
• Build out of end-to-end digital wealth and banking solutions provide a
more unified offering—to expand customer share of wallet
Targeted business initiatives
Unparalleled deposit growth
MAXIMIZE SHAREHOLDER VALUE BY HARNESSING FULL VALUE OF CUSTOMER RELATIONSHIPS

23
Generate resilient NIM, funded by low cost of liabilities
Investment securities+250bps
$57.2
$1.4 $1.0
$43.6 $8.0
$1.5 $7.5
Legacy loans+418bps
Margin receivables+340bps
Cash & equivalents and other+18bps
Deposits & customer payables-2bps
Corp. debt-387bps
Other-26bps
$B | yield (cost)
Asset yield
• Business generates stable, low-cost deposits
• On balance sheet investments primarily in agency securities—average duration of assets matched to liabilities at three to four years
• Company maintains control to grow balances on- or off-balance sheet, through third-party sweep program
• Net fees, after cost of deposits, of 34 bps for brokerage sweep deposits and 15 bps for bank sweep deposits in Q2’2015
Low-risk assets l Low-cost liabilitiesBalance sheet strategy
2bps 2bps 14bps33bps
2bps
-125
-75
-25
25
75
125
175
-40
-30
-20
-10
0
10
20
30
40
50
60
70
2016 2017 2018 2019 Q2'20
3rd-party sweep deposits On B/S deposits and customer payablesBlended deposit cost
Steady deposit growth with flexible 3rd-party arrangement
$56.7$57.9 $60.2 $71.0
$B | EOP
On
B/S
Off
B/S
Composition of Q2’20 NIM
Liability cost
180bps
45bps11bps
34bps
0
50
100
150
200
250
300
-14bps
+270bps
Legacy loans
Margin receivables
Cash & equivalents and other
Investment securities
NIM+256bps
MAXIMIZE SHAREHOLDER VALUE BY HARNESSING FULL VALUE OF CUSTOMER RELATIONSHIPS
Assets Liabilities
$92.2

24
Key takeaways
Leading retail offering, emerging wealth solutions, and institutional channels that offer
significant synergies provide strong foundation for growth
Strong digital ethos and world-class product and service capabilities, optimally positioned for
secular shift to digital
Strong revenue yield on client assets coupled with scalable infrastructure and digitally led
model provides significant operating leverage and allows for robust cash flow
E*TRADE is well positioned to deliver value for its customers, employees, and shareholders

25
APPENDIX

26
Corporate debt and preferred stock
APPENDIX
2009 2010 2011 2012 2013 2014 2015 2016 2017 2018 2019 2020
Moody's: Baa2 | Positive WatchS&P: BBB | Positive Watch
Credit ratings over time
9.2
16.4
7.5
12.5
7.3
2016 2017 2018 2019 Q2'20
Security:
Senior Notes
due 2022
Senior Notes
due 2027
Senior Notes
due 2028
Non-Cumulative
Perpetual Preferred
Stock16
Non-Cumulative
Perpetual Preferred
Stock17
Amount outstanding $600MM $400MM $420MM $400MM $300MM
Coupon 2.95% 3.80% 4.50% 5.875% 5.30%
Interest / dividend
payable
Feb. 24 &
Aug. 24
Feb. 24 &
Aug. 24
Dec. 20 &
Jun. 20
Mar. 15 &
Sep. 15
Mar. 15 &
Sep. 15
Issued Aug. 24, 2017 Aug. 24, 2017 Jun. 20, 2018 Aug. 16, 2016 Nov. 27, 2017
Maturity Aug. 24, 2022 Aug. 24, 2027 Jun. 20, 2028 N/A N/A
Debt service coverage
AA-
A
BBB+
BBB-
BB
B+
B-
CCC
CC
Investment grade
Aa3
A2
Baa1
Baa3
Ba2
B1
B3
Caa2
Ca
Moody’s S&PYears

27
Disciplined and strategic acquisitions Diverse capital deployment
452362
1,139 1,085
838
36 135
128
82%61%
116%
133%123%
2016 2017 2018 2019 TTM
452
1,220
RepurchasesPayout Ratio Dividend
$MM
1,175
• Repurchased $3.1B of stock since Q4’15Repurchases
• $0.14 quarterly dividend to common shareholdersDividend
Options
House
Strategic acquisitionsSeptember 2016 – $725MM18
• ~150,000 accounts6
• $3.7B assets5
• Leading options platform
April 2018 – $275MM18
• ~150,000 accounts6
• $1.2B sweep deposits and $18.4B in assets5
• State-of-the-art RIA custody platform
November 2018 – $109MM18
• ~1 million accounts6
• $1.6B sweep deposits and $15.1B in assets5
Trust
Company of
America
Capital One
Brokerage
Accounts
December 2019 – $30MM18
• ~800 corporate clients
• Pioneering student loan benefit providerGradifi
APPENDIX
Acquisitions and shareholder distribution
362
966

28
1. Equity Edge Online was rated #1 in Loyalty and Overall Satisfaction for the eighth-consecutive year in the Group Five Stock Plan Administration Study Industry Report.
Group Five, Inc. is not affiliated with E*TRADE Financial Corporate Services, Inc. or its affiliates.
2. Operating margin is the percentage of net revenue that results in income before income taxes. The percentage is calculated by dividing income before income taxes by total
net revenue. The following table presents a reconciliation of GAAP operating margin percentage to non-GAAP adjusted operating margin percentage (dollars in millions):
3. Return on common equity is calculated by dividing net income available to common shareholders by average common shareholders' equity, which excludes preferred stock.
The following table provides a reconciliation of GAAP return on common equity percentage to non-GAAP adjusted return on common equity percentage (dollars in millions):
Appendix
AmountOperating
Margin %Amount
Operating
Margin %Amount
Operating
Margin %Amount
Operating
Margin %Amount
Operating
Margin %
Income before income tax expense and operating margin $ 1,152 40% $ 1,319 46% $ 1,418 49% $ 1,064 45% $ 838 43%
Add back impact of pre-tax items:
Provision (benefit) for credit losses (26) (51) (86) (168) (149)
Losses on early extinguishment of debt - - 4 58 -
Subtotal (26) (51) (82) (110) (149)
Adjusted income before income tax expense and adjusted operating margin $ 1,126 39% $ 1,268 44% $ 1,336 47% $ 954 40% $ 689 35%
December 31, 2019 December 31, 2018 December 31, 2017
Twelve months ended, Year ended
December 31, 2016June 30, 2020
Year ended Year ended Year ended
Net income available to common shareholders and return on common equity 783$ 915$ 1,016$ 589$ 552$
Add back impact of the follow ing items:
Provision (benefit) for credit losses (26) (51) (86) (168) (149)
Losses on early extinguishment of debt - - 4 58 -
Subtotal (26) (51) (82) (110) (149)
Income tax impact of the items above 7 14 21 43 58
Net of tax (19) (37) (61) (67) (91)
Adjusted net income available to common shareholders and return on common equity 764$ 878$ 955$ 522$ 461$
13%
13% 15%
10%
8%
17%
16% 9%
Year ended
December 31, 2016
Twelve months ended, Year ended Year endedYear ended
December 31, 2018 December 31, 2017December 31, 2019
10%
June 30, 2020
16%

29
4. Beginning in November 2019, the definition of DARTs was updated to reflect all customer-directed trades. This includes trades associated with no-transaction-fee mutual
funds, options trades through the Dime Buyback Program, and all exchange-traded funds transactions (including those formerly classified as commission-free). This update
did not result in a significant impact to the presentation of DARTs, derivative DARTs, and derivative DARTs %. These measures have not been restated to conform with
current period presentation for periods prior to 2017. Mobile DARTs % has not been restated for periods prior to 2018.
5. The net new retail and advisor services assets metrics treat asset flows between E*TRADE entities in the same manner as unrelated third-party accounts. Net new retail
assets exclude $3.7 billion of assets from the OptionsHouse acquisition in the third quarter of 2016 and $15.1 billion of assets from the Capital One acquisition in the fourth
quarter of 2018. Net new advisor services assets exclude $18.4 billion of assets from the TCA acquisition in the second quarter of 2018.
6. Net new retail accounts and end of period retail accounts exclude the addition of 147,761 accounts from the OptionsHouse acquisition in the third quarter of 2016 and the
addition of 912,065 accounts from the acquisition of Capital One in the fourth quarter of 2018. Net new advisor services accounts and end of period advisor services
accounts exclude the addition of 145,891 accounts from the acquisition of TCA in the second quarter of 2018.
7. In Kiplinger's annual Best Online Brokers Review of 10 firms across seven categories, E*TRADE was awarded first place with an overall score of 82.9 out of 100 and “Best
for Mutual Fund Investors.” E*TRADE’s ratings for all category rankings include: Overall (#1), User Experience (#2), Investment Choices (#2), Advisory Services (#3), Mobile
(#3), Research (#4), Commissions and Fees (#6), and Tools (#7). Read the full "Best Online Brokers, 2019".
8. In Investopedia’s 2020 Best Online Brokers Awards, E*TRADE earned a rating of 4.2 out of 5.0 stars overall. E*TRADE also earned “Best for Ease of Trading” and “Best for
Beginning Options Traders”.
In StockBrokers.com's 2020 Online Broker Review of 15 firms across 236 different variables, E*TRADE was awarded the #1 Mobile Trading, #1 Options Trading, and #1
Web Based Platform Awards. In addition, E*TRADE received 9 Best in Class distinctions: Overall, Mobile Trading, Options Trading, Education, Research, Beginners, IRA
Accounts, Futures Trading, and Active Trading. E*TRADE's star ratings for all category rankings out of 5: Overall (4.5 stars), Mobile Trading (5 stars), Commissions & Fees
(4.5 stars), Offering of Investments (4.5 stars), Platforms & Tools (4.5 stars), Research (4.5 stars), Customer Service (4.5 stars), Ease of Use (4.5 stars), and Education (4.0
stars). Read the 2020 Online Broker Review.
In Barron’s Best Online Brokers of 2020 review of 10 firms, E*TRADE received 4.5 out of 5 stars overall. E*TRADE also earned “Best for Mobile Traders” (5.0 stars) and
“Best for Investment-Oriented Traders” (4.5 stars) distinctions.
9. Retail and advisor services accounts includes the following banking accounts:
Appendix
2016 2017 2018 2019 Q2’20
Banking accounts 281,039 264,313 262,244 295,596 308,997

30
Appendix
10. Excludes assets held in custody with E*TRADE Advisor Services.
11. To discourage short-term trading, E*TRADE Securities may charge a short-term trading fee on sales of participating ETFs held less than 30 days, and an early redemption
fee on redemptions or exchanges of no-load, no-transaction-fee funds that are held for less than 90 days.
12. For Core Portfolios clients, interaction with E*TRADE Capital Management will generally be limited to the web-based interface. A Core Portfolios client does not have an
individual Financial Consultant or portfolio manager assigned to the account. E*TRADE Capital Management, through its Investment Policy Committee and with support of
Investment Strategists, selects, removes, and adds portfolio holdings and determines the program's rebalancing methodology.
For more information on professionally managed portfolios offered by E*TRADE Capital Management (ETCM), please request a free copy of ETCM's Form ADV Part 2A,
which describes, among other things, affiliations, services offered, and fees charged.
13. Average retail and advisor services assets per account is calculated as the sum of retail and advisor services assets divided by end of period retail and advisor services
accounts.
14. Non-recurring commissions includes base retail commissions for online US listed stock, ETF, and options, and applies the average contract revenue to separate the non-
recurring base contract per trade from the recurring per contract portion.
15. The yield on third-party cash is based on the net interest earned on customer cash held by third parties inclusive of sweep deposit accounts.
16. Preferred stock is non-callable, fixed rate at 5.875% for 10 years. Thereafter, callable and floating rate at 3-month LIBOR + 4.435%. Redemption may be in whole or in part
on any dividend payment date on or after September 15, 2026, at a redemption price equal to $1,000 per share, plus any declared and unpaid dividends to, but excluding,
the date fixed for redemption, without accumulation of any undeclared dividends.
17. Preferred stock is non-callable, fixed rate at 5.30% for 5 years. Thereafter, callable and floating rate at 3-month LIBOR + 3.16%. Redemption may be in whole or in part on
any dividend payment date on or after March 15, 2023, at a redemption price equal to $1,000 per share, plus any declared and unpaid dividends to, but excluding, the date
fixed for redemption, without accumulation of any undeclared dividends.
18. Represents acquisition consideration but excludes working capital and other closing adjustments.
For additional information, contact E*TRADE Investor Relations at: [email protected] | 646-521-4406


![Trade Oracle FLEXCUBE Investor Servicing [April] [2012](https://img.pdfslide.net/doc/110x75/6259376afdc368250163145a/trade-oracle-flexcube-investor-servicing-april-2012-.jpg)