Embed Size (px)
Citation preview

Symposium Article
EU Membership, Mrs Thatcher’sReforms and Britain’s EconomicDecline
NAURO F CAMPOS1,2,3 & FABRIZIO CORICELLI4,5
1Brunel University London, London, UK.E-mail: [email protected], Zurich, Switzerland.3IZA, Bonn, Germany.4Paris School of Economics, Paris, France.E-mail: [email protected], London, UK.
This paper presents a dissonant view on post-war British economic performance. A
defining feature is the decline of the UK relative to the six founding members of the
European Union after 1945. However, this relative decline stopped. The conven-
tional view is that a turning point occurs in the mid-1980s when Mrs Thatcher
implements far-reaching structural reforms. This paper asks whether econometric
evidence supports this conventional view and finds it does not. We then examine an
alternative hypothesis: this turning point occurs around 1970 when the UK joined
the European Community. We find strong econometric support for this view. The
intuition we offer is that EU membership signalled the prominence of business
groups that chose to compete at the high-tech end of the common Europeanmarket
against those business groups that preferred comparative advantage-driven Com-
monwealth markets (mostly former colonies). Those pro-Europe business groups
later become the constituency that provides support for Mrs Thatcher’s reforms.
Without this vital support, we argue Mrs Thatcher’s structural reforms would not
have been nearly as effective, if proposed and implemented at all.
Comparative Economic Studies (2017) 59, 169–193. doi:10.1057/s41294-017-
0023-7; published online 28 April 2017
Keywords: European integration, UK relative economic performance, UKrelative decline, Thatcher’s reforms, EU membership
JEL Classifications: N14, O47
Comparative Economic Studies, 2017, 59, (169–193)� 2017 Association for Comparative Economic Studies. All rights reserved. 0888-7233/17
www.palgrave.com/journals
INTRODUCTION
The former British Prime Minister David Cameron was determined to changethe relationship between the United Kingdom (UK) and the European Union(EU). His Conservative Party’s outright and largely unexpected victory in theMay 2015 general election meant that one key manifesto pledge would have tobe implemented. The UK would embark on a renegotiation of the terms of its EUmembership and these new terms would then be submitted to a popular vote, a‘‘remain or leave’’ referendum. He also promised that voting would take placebefore the end of 2017 (Copsey and Haughton, 2014). This renegotiationconcluded in February 2016 with an agreed ‘‘new settlement’’, and thereferendum was set for June 23, 2016. The Leave campaign won with about52% of the votes. A new Prime Minister, Theresa May, took office twenty dayslater, pledging to make the UK the first country ever to leave the EU.
Why should economists pay attention to the British exit from the EU(‘‘Brexit’’)? Brexit is one of the multiple crises currently affecting the largestexperiment of voluntary economic integration in human history. TheEuropean integration project faces a financial crisis, a debt crisis, an economiccrisis, a Greek crisis, a populism crisis, a productivity crisis, a terrorism crisis,a refugee crisis and a democratic deficit crisis, to name a few. But the Brexitcrisis is an intrinsically different type of crisis. Brexit raises fundamentalquestions about the existence of the integration project. This was a one-wayprocess towards a well-defined goal, but that ‘‘new settlement’’ had alreadychanged the notion of ever closer union.
Brexit is different because it asks questions about the value of being in theunion, about the value of membership, about the value of being integratedand interconnected in the world, about the dynamics and distribution of thebenefits and costs of trying to do so and about the type of integration that cansustain (and hopefully increase) the substantial benefits we have seen sincethe start of the project in the 1950s (Eichengreen, 2008). These are existentialquestions, and they must be answered if the EU is to be after this crisis.
In this paper, we try to answer two main questions: did EU membershipsignificantly affect UK economic performance? And if so, how? We believethese are important questions. If EU membership turns out to have nodiscernible economic effect, the case for membership would be weaker.However, because of the chequered history of the UK–EU relation, if one canshow that European integration played a role there, it is likely it played asubstantial role everywhere else.
The online version of this article is available Open Access
N F Campos & F CoricelliEU Membership, Mrs Thatcher’s Reforms and Britain’s Economic Decline
170
Comparative Economic Studies
We first briefly discuss the historical context in which the Europeaneconomic integration project took-off to assess to what extent one can claimthat delayed membership was relatively costly to the UK and whether the UKjoining the EU was ultimately beneficial.
We argue that a fundamental yet relatively unappreciated feature of therelationship between Britain and the European Union is a turning point. Theratio of UK’s per capita GDP to the EU founding members’ declines steadily from1945 until around 1970 but has been relatively stable since. Such prominentstructural break (which, to the best of our knowledge, has not been previouslydetected and analysed) suggests substantial benefits from EU membershipespecially considering that, by sponsoring an overpowered integration model,Britain joined too late, at a bad moment in time and at an avoidably larger cost.
The conventional wisdom is that this turning point occurs in the mid-1980s when Mrs Thatcher implements her package of far-reaching structuralreforms (Walters, 1986; Minford, 2015). This view retains currency despiteeconomists’ detailed scrutiny (Bean and Symons, 1989; Broadberry andWagner, 1996; Layard and Nickell, 1989).1 In this paper, we ask whethereconometric evidence is supportive of such view. We find it is not. Weexamine an alternative hypothesis: the turning point occurs when the UKjoined the European Union. Structural break tests provide substantialeconometric support for this alternative view.
If EU membership has made a difference, the next question is how? Toaddress this issue, we discuss the key potential mechanisms through whichbenefits from membership took root (chiefly finance, foreign direct invest-ment and trade). The chosen mode of integration (deep instead of shallow)played a key role. While international trade may have been the mostimportant driver until the Single Market in the early 1990s, foreign investmentmay well have taken its place since.
Is it possible to reconcile or relate Mrs Thatcher’s reforms and EUmembership in terms of understanding the great British reversal? We believethese are somewhat complementary explanations. The intuition we provide isthat EU accession signals the prominence of business groups that wanted to
1 Card and Freeman note that ‘‘For much of the nineteenth and twentieth centuries, theBritish economy, which pioneered the Industrial Revolution, had a disappointing growth record,falling markedly from the top ranks in the league economic tables. In 1979, the United Kingdomwas twelfth in per capita gross domestic product (GDP) among advanced Organization forEconomic Cooperation and Development (OECD) member countries, well below Germany,France, and other European Union (EU) economies. In response to this weak economicperformance, successive U.K. governments adopted policies designed to move the economy backto ‘‘premiere league’’ status. Beginning with Margaret Thatcher and continuing under John Majorand Tony Blair, these reforms sought to increase the efficacy of labor and product markets andlimit government and institutional involvement in economic decision making’’ (2004, p. 9).
N F Campos & F CoricelliEU Membership, Mrs Thatcher’s Reforms and Britain’s Economic Decline
171
Comparative Economic Studies

compete at the high-tech end of the common European market against thosebusiness groups that preferred the comparative advantage-driven mostly formercolonies (Commonwealth) markets. These pro-Europe business groups laterbecome the constituency that supported Mrs Thatcher’s reforms. Without suchsupport, we argue those reforms would not have been nearly as effective.
This paper is organized as follows. Section ‘‘Why Did Britain Join the EU?’’discusses the British relative economic decline and investigates what may havebeen the main causes of its reversal. It presents structural breaks econometricevidence that favours EU membership instead of the Mrs Thatcher’s structuralreforms explanation. In Section ‘‘How and Why Did Britain Benefit from EUIntegration?’’, we examine various channels through which EU membership mayhave benefitted the UK economy (chiefly finance, FDI and trade). Section ‘‘APolitical Economy Explanation’’ presents a political economy story that links theUK’s EU membership to the design, implementation and (more importantly)effectiveness of Mrs. Thatcher’s reforms. Section ‘‘Conclusions’’ concludes.
WHY DID BRITAIN JOIN THE EU?
An examination of European economic history provides valuable insights intothe costs and benefits of UK’s eventual accession into the EU. One prominentarea of economic history scholarship is the study of ‘‘British relative economicdecline’’ (Bean and Crafts, 1996). Economic historians offer a carefuldiscussion of key turning points in British economic history since the early1800s. Yet, this long-term perspective fails to give WWII and Europeanintegration (including gains from liberalization and increased competition)due credit as important factors, albeit more contemporary, in the most recentdevelopments in this process, particularly to what we have here called thegreat British reversal (a notable exception is Crafts, 2012).
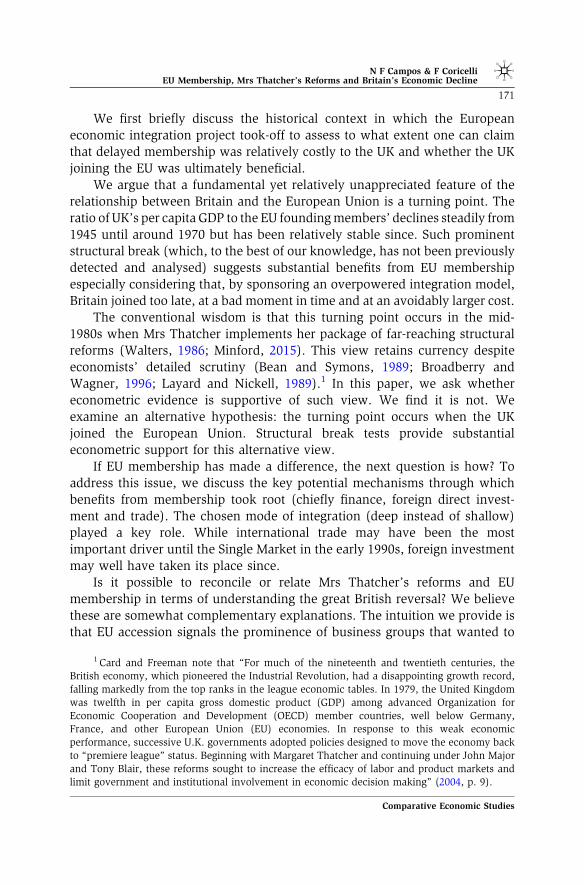
UK per capita GDP was one of the few in Europe to grow during WWII.Compared to the average of the six founding nations of what would becomethe European Union – France, West Germany, Italy, Belgium, the Netherlandsand Luxembourg (the EU6), the UK’s GDP per capita was roughly 90 percentlarger in 1945. Figure 1 displays per capita GDP levels in the UK and anaverage for the original EU6 less Luxembourg from 1850 to 2015 to highlightfour important issues.2 (1) The UK had a higher per capita income from 1850
2 For international comparisons, the Penn World Tables (PWT) is considered the superiordata source. However, it starts in 1950. Maddison and Bergeaud et al. (2016) data go back muchfurther. Note that the behaviour of the UK-EU6 ratio of per capita GDPs between 1950 and 2010 isunsurprisingly similar in these two data sources and that, differently from PWT, the Maddison andBergeaud et al. data sets do not include Luxembourg.
N F Campos & F CoricelliEU Membership, Mrs Thatcher’s Reforms and Britain’s Economic Decline
172
Comparative Economic Studies
until about 1970. (2) The per capita GDP gap between the UK and EUfounding members increased abnormally during WWI and probably evenmore so during WWII. (3) The reconstruction period after the WWII shock(or, in other words, the return to the pre-war steady-state path) seems to havealready been largely completed by 1950. (4) However, after WWII, trendgrowth in the UK and EU differs in that they are no longer ‘‘parallel’’ (as theyseem to have been until then). Using the 1945–1973 data (the last year of theWWII conflict and the year the UK joined the EU, respectively) to linearlyextrapolate (forecast) GDP per capita 30 years ahead, we find per capita GDPwould be have been about 18 percent lower by year 2000 in the UK vis-a-visthat in the EU founding members. This justifies the suspicion that somethingsignificant happened in the 1970s and invites a closer re-inspection of theperiod.
The unprecedented destruction of WWII resulted in a similarly unprece-dented recovery effort, which was largely completed by 1950. The period thatfollowed, until 1973, is commonly referred to by economic historians as theGolden Age of European Economic Growth. If reconstruction and catch-upwith pre-war levels were broadly completed by 1950, other factors were atplay. Temin (2003) convincingly argues that structural change (labour shiftsout of agriculture) was a leading factor.
The Marshall Plan was important in the immediate post-WWII period. Arequisite for Marshall Plan aid was economic coordination among recipientcountries. It was clear at the outset that there were many areas of agreementbut one of discord. The French favoured a customs union, the British a free
0
5000
10000
15000
20000
25000
30000
35000
40000
45000
1850
1854
1858
1862
1866
1870
1874
1878
1882
1886
1890
1894
1898
1902
1906
1910
1914
1918
1922
1926
1930
1934
1938
1942
1946
1950
1954
1958
1962
1966
1970
1974
1978
1982
1986
1990
1994
1998
2002
2006
2010
2014
GBR EU5
Figure 1: UK and EU Founding Members: GDP per capita from 1850 to 2015 (USD 2010 PPP; EU foundingmembers: Belgium, France, Germany, Italy and Netherlands). Data from Bergeaud et al. (2016)
N F Campos & F CoricelliEU Membership, Mrs Thatcher’s Reforms and Britain’s Economic Decline
173
Comparative Economic Studies
trade area. Of course, a customs union entails deeper integration, and itrequires a ‘‘huge political step’’ (Sapir, 2011). Also worth noting is that ‘‘theUnited States supported the idea of a customs union in 1947, and continue togive backing to French schemes for West European regional organizations’’(George, 1994, p. 18).
The UK decided not to participate in the European Coal and SteelCommunity (ECSC), which was a result of the proposed Schuman Plan in1950 (Dell 1995). The ECSC created a set of institutions to coordinate andintegrate coal and steel production among the participating nations (EU6): a‘‘High Authority to monitor compliance with the terms of the agreement, aCommon Assembly of parliamentarians to hold the High Authority account-able and a Community Court to adjudicate disputes between the HighAuthority and member states’’ (Eichengreen, 2008). With the EU6’s economicrecovery almost completed by 1950, per capita GDP in the UK was about 28percent above EU6 average.
By the time the Treaty of Rome was signed by the EU6 in 1957, thatfigure was reduced to about 15 percent. The integration efforts embodied inthese agreements had successes and failures. The primary failures were theproposed political and defence unions; the expansion of the ECSC to becomethe European Economic Community (EEC) and the creation of a Europeanatomic energy community (Euratom) in the Treaty of Rome are the majorsuccesses. The UK government was not a party to either of these agreementsand in 1960 proposed an alternative organization, the European Free TradeArea (EFTA).
The EFTA treaty was signed in Stockholm in 1960 by Austria, Denmark,Norway, Portugal, Sweden, Switzerland and the UK.3 Yet, and revealingly, theUK began negotiations to enter the EEC in 1961. At that point the per capitaGDP gap between the UK and the EU6 average had fallen to roughly 10percent. Nonetheless, French President De Gaulle vetoed the British applica-tion after drawn out negotiations in 1963.
Around this time the UK started to realize the long-term limitations of theeconomic viability of Commonwealth markets. It became apparent that theywere less competitive and demanding than the developed markets of WesternEurope. Indeed, it became more than apparent that the EEC was economicallysuperior to the EFTA (Aitken, 1973; Bayoumi and Eichengreen, 1997).Moreover, the decline over time was faster for the ratio of the UK to the EU6than for either Denmark (an EFTA member) or Ireland (not an EFTAmember), which were the two countries that joined the EU at the same time as
3 These were often referred to as the Outer Seven so as to contrast with the Communities’Inner Six.
N F Campos & F CoricelliEU Membership, Mrs Thatcher’s Reforms and Britain’s Economic Decline
174
Comparative Economic Studies

the UK in 1973. In 1964, Harold Wilson was elected prime minister in the UKand made another failed attempt to revive the Commonwealth-basedeconomy.4 Subsequently, Britain reapplied for EEC membership in 1967(Tatham, 2009). Again De Gaulle vetoes. By this time per capita GDP in the UKwas only 6 percent larger than the EU6 average.
Georges Pompidou succeeded Charles De Gaulle in 1969 and immediatelyencouraged Britain to reapply for a third time for EEC membership (Young,1998). Pompidou is also recognized as the creator of a system of individualcontributions to the Community budget. In 1969, when the UK officiallyapplies to join the European Community for the third time, its per capita GDPhad shrunk to 2 percent smaller than the average of the EU6.
Edward Heath succeeded Wilson in 1970. He was perhaps the staunchestEuropean federalist among all British prime ministers. When the UK joins theEEC in 1973, the EEC funding system operated by collecting revenues fromlevies on food imports and tariffs on industrial goods. Because the UK wasmore urbanized and imported more than continental Europe nations, thepolicy did not exactly suit British interests. Of course 1973 also opens avolatile period with the collapse of the Bretton Woods system and the first oilshock. At this point, the UK’s per capita GDP had fallen to a level 7 percentsmaller than the average of the EU6.
The special relationship with the USA, the Commonwealth and the beliefthat purely economic integration (FTA) would be superior to deeper, politico-economic alternatives, are often cited as the main reasons for the delay inBritish membership. Special relation or not, the US was a resolute supporter ofEuropean integration from the outset. With the independence of India, theSuez crisis and African decolonization, Commonwealth links taper (Darwin,2011; Garavini, 2012). Applying for EC membership one year after the creationof EFTA reveals which alternative was perceived as superior.
For the majority of European countries, structural change as identified byTemin (2003) may well be a satisfactory explanation for Golden Age growthand catch-up with the USA and perhaps even more so than EU membership.Yet, there seems to be a different and important turning point in the trajectoryof the per capita GDP ratio of Britain to the EU6. The steady decline in the ratioof the UK’s per capita GDP to the average of the EU6 from 1945 to around 1970and the relative stability of that ratio since suggest considerable benefits from
4 Euroscepticism was then influential in both the Conservative and Labour parties. Duringthe 1961 parliamentary debate, Harold Wilson is famously on record as saying: ‘‘if there has to be achoice we are not entitled to sell our friends and kinsmen down the river for a problematical andmarginal advantage in selling washing machines in Dusseldorf’’ (Gowland and Turner, 1999).Young (1998) argues that euroscepticism still resonates within the Conservative party, while forLabour it loses steam in the 1990s.
N F Campos & F CoricelliEU Membership, Mrs Thatcher’s Reforms and Britain’s Economic Decline
175
Comparative Economic Studies

membership in the EEC/EU. Furthermore, the overpowered integration modelemployed by Britain suggests the UK joined the EEC too late, in a bad periodof time, and at an unnecessarily high price. For these reasons, EU membershipis an explanation that deserves more careful scrutiny.
We further develop this hypothesis using a standard econometricapproach, namely we study whether there is evidence for structural breaksor turning points at specific points in time that are often identified as key tounderstand British relative economic decline. In particular, we like to seewhether breaks could be detected in the run-up to EU accession as well asduring the Mrs Thatcher government so as to draw comparisons betweenthem.
Using data from the Penn World Tables, version 8, we study the GDP,GDP per capita and total factor productivity series, by looking at both theindividual UK and EU6 countries series and at the ratios of UK to the averagefor the EU6 founding members.
We subject these data series to a whole range of structural break tests,that is to the Chow, Zivot–Andrews and Bai–Perron tests (Hansen, 2001provides a non-technical discussion). The classic Chow framework assumes apre-specified date for the break. The Zivot–Andrews test is able to detectmultiple breaks simultaneously but still requires that the econometricianknows the exact dates of the turning points. The current and most widely usedframework is that by Bai–Perron, which allows the identification of multiplestructural breaks and it does not require these to be chosen a priori. It allowsthe estimation of multiple unknown breakpoints.
The main message from the Bai–Perron results for the ratio between theUK and the EU6 in per capita GDP between 1950 and 2011 is that atconventional levels of statistical significance these results support a mainstructural break around year 1969.5 This is the year De Gaulle resigned andconsequently the year in which the UK successfully applied to join theEuropean Community. Unsurprisingly, we obtain similar results using boththe Chow and Zivot–Andrews tests. Moreover, within the Bai–Perronframework, this result also receives support from different approaches todetermining the number of breaks. For instance, the ‘‘sequential’’ resultobtains from performing tests from 1 to the maximum number until the nullhypothesis cannot be rejected anymore, while another chooses the largeststatistically significant number of breakpoints. Both multiple breakpoint testsindicate that there seem to be 5 breaks in the annual series of the ratio of theUK per capita GDP to the EU6 per capita GDP between 1950 and 2011. Theunweighted maximized statistic indicates one single break, while the
5 Further details are provided in the electronic supplementary material.
N F Campos & F CoricelliEU Membership, Mrs Thatcher’s Reforms and Britain’s Economic Decline
176
Comparative Economic Studies

weighted maximized statistic suggest at most three breakpoints. These latterstatistics warn against more than three breakpoints. These results are alsoinvariant to using original, scaled and weighted test statistics. In each of thesecases, the statistics considerably exceed the critical value thus supporting therejection of the null of no breaks. Overall, 1969 remains the main finding.
The Bai–Perron framework generates global optimizers for the break-points for each number of breaks (Hansen, 2001). It shows for example that ifset to detect one and only one break in the per capita GDP ratio series thatbreakpoint would correspond to year 1969. This means that there is indeed abreak in this series and it is most likely to be around year 1969 (and notaround 1979 when Thatcher comes to power nor around 1983 when she startsher second term in government and actually implements her far-reachingstructural reforms). If one allows only two structural breaks to be detected,the Bai–Perron test indicates that these would be 1960 and 1969, again givinglittle credence to conventional views that entrust 1979 or 1983 or even 1986which is when Mrs. Thatcher big-bang financial reforms are completed(Young, 1998). Moreover, 1960 is the year in which the EFTA Stockholmtreaty is signed and 1969 is when De Gaulle finally resigns and Pompidou, hissuccessor, invites the UK to apply for EU membership for a third time,indicating that third time around France would welcome and support the UKapplication. Interestingly, if one allows three breaks to be detected, 1990 isidentified as the third most important break (after 1969 and 1960, respec-tively), again not 1979 (start of Thatcher’s first term) or 1983 (start ofThatcher’s second term) or 1986 (big-bang reforms), which could be morenaturally associated with Mrs Thatcher effects especially given that 1990 is theyear Thatcher actually resigns. Keeping in mind the above caveat of notattaching too much weight to more than three detected breaks, it is only whenone allows for four breakpoints that one year within her time in office appearsas an important break and that is for year 1981.
These results are robust to various sensitivity checks. We analyse whetherresults were sensitive to the choice of different maximum number of breaks(the default value of 5 breaks is used below but we also generated resultsusing values above and below), to different levels of statistical significance fordetection of breakpoints (we here discuss the results using the conventional5% but using 1% or 10% generates similar conclusions), to allowing the errordistributions to differ across breaks (below we focus on results allowing forthis but relaxing it does not change our conclusions), to the trimmingparameter (the default value we used is 15% but we run results using valuesabove and below again without generating different conclusions) and to thechoice of sequential versus global set-up. We find that none of these affect ourmain conclusions: 1969 remains the year in which there is a key turning point.
N F Campos & F CoricelliEU Membership, Mrs Thatcher’s Reforms and Britain’s Economic Decline
177
Comparative Economic Studies

In summary, our results provide scant support for the notion that MrsThatcher and her structural reforms were the main reason for the reversal inthe trajectory of the British relative economic decline. Instead, focusing on thedynamics of per capita GDP they point to EU membership as a more powerfulexplanation.
The results discussed above for per capita GDP ratios are very much likethose we obtain for GDP ratios as well as for the series for the individualcountries. Yet these are imperfect measures of productivity, which is aconcern given the common expectation that the effects from deep integrationare mostly in productivity rather than in gross output terms (Campos et al.,2014). In this light, we try to complement the analysis above by replicating itfor a productivity measure.
Here we use the measure of total factor productivity (TFP) available fromthe Penn World Tables version 8, which is reported as a percentage of the USATFP level. Table 1 shows eight ‘‘snapshots’’ between 1950 and 2014 of thelevel of TFP in the UK and in each of the EU6 countries with respect to theUSA.
Table 1 highlights various interesting features. Chiefly among them is thatalthough it is well established that between the end of World War II and the1973 accession to the European Community, per capita GDP growth in the UKwas faster than that in the USA but slower than in France or Germany, thefigures from TFP reveal a much more nuanced picture. Productivity growth inthe UK before 1970 is flat and shows practically no signs of closing the gapwith the USA. Notice that this is not the case for any of the EU6 with Franceproductivity gains before 1970 deserving special attention (Adams, 1989).Overall, the leading European economies starting from 1950 until the mid-1990s were able to close their productivity gap with respect to the USA,although it can be seen how this gap has again opened up since.
Table 1 also shows that except for Luxemburg and the UK there is avisible acceleration of relative TFP gains between 1950 and 1980. This is
Table 1: Total factor productivity (USA = 1) for UK and EU6 between 1950 and 2014
1950 1960 1970 1980 1990 2000 2010 2014
Great Britain 0.68 0.69 0.71 0.89 0.86 0.92 0.74 0.73France 0.51 0.68 0.87 1.07 1.02 1.01 0.94 0.95Belgium 0.71 0.73 0.89 1.21 1.07 1.11 0.91 0.92Germany 0.41 0.56 0.62 0.81 0.81 0.88 0.82 0.82Italy 0.57 0.64 0.86 1.14 0.98 0.94 0.81 0.71Netherlands 0.67 0.72 0.84 1.07 0.95 1.02 0.83 0.81Luxembourg 0.97 0.99 1.02 1.12 1.12 1.11 0.79 0.78
Data source is PWT 8.
N F Campos & F CoricelliEU Membership, Mrs Thatcher’s Reforms and Britain’s Economic Decline
178
Comparative Economic Studies
followed by a flattening out of the gaps, with some countries registering levelsbelow their 1970 figures. In particular, for Germany and France the 2010 or2014 level is clearly above that for 1970, while for Belgium it is barely abovebut only for these three countries these positive gains were not fully reversedbetween 1970 and 2010. Moreover, the least productive economy by thismeasure in 2010 is the UK, which for 2014 is only beaten, barely, by Italy.
Given these developments in terms of TFP and the assumption that mostgains from deep integration are in productivity not in gross output terms, itwould be particularly valuable to investigate whether there are alsodetectable turning points or structural breaks in the TFP series. Moreover, itwould be useful to examine this issue focusing both on the individualcountries and on the ratios between UK and EU6. The latter of course indicateshow close, below or above, is the comparative performance of the UK vis-a-visthe EU6 countries.
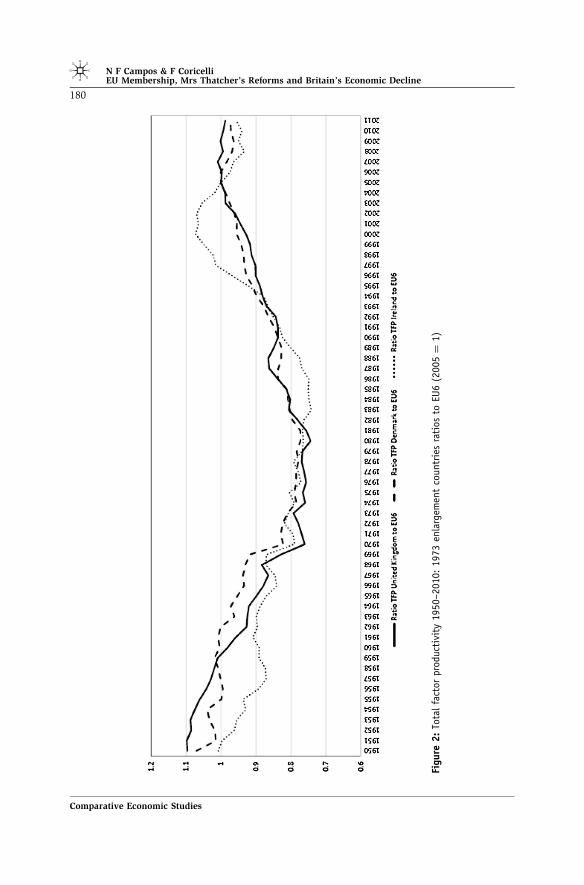
Figure 2 displays the ratios of TFP for the three countries that joined theEU in 1973 (UK, Denmark and Ireland) to the EU6 founding members between1950 and 2011. If one is searching for turning points, the contrast between theper capita GDP and TFP UK ratios to EU6 countries is extremely revealing. Themere existence of such structural breaks is clearer than in the case of percapita GDP. Although it seems that the turning point for productivity inIreland occurs basically with the Single Market, that for both the UK andDenmark seem to have taken place much earlier and coinciding with whenthey joined the EEC in 1973.
We have subjected these TFP ratios to the exactly same Bai–Perronstructural break estimation exercise as conducted above for per capita GDP.6 Ifanything, the conclusions emerging here are richer and even strongerregarding the prominence of the structural break in 1969 especially vis-a-visthe 1979, 1983 or 1986 alternatives (which represent various key moments ofThatcher’s administration). If the latter are so powerful and distinctive to somany analysts, we do not believe it would be unfair to expect these tests toreveal two or more dominant breaks during her years in power. For all thedata series we have examined, we find no evidence of such an outcome.
It is worth mentioning that differently from the case of per capita GDP, forTFP all of our estimates suggest the existence of five structural breaks butagain with 1969 being the dominant turning point. Another similarity with theper capita GDP results is that 1960 again appears as a significant break. Onceagain, the results for more than three breakpoints suggest that years 1986 or1985 also support a structural break but just as before these results are also
6 Further details are provided in the electronic supplementary material.
N F Campos & F CoricelliEU Membership, Mrs Thatcher’s Reforms and Britain’s Economic Decline
179
Comparative Economic Studies
Figu
re2:Totalfactorproductivity
1950–2010:1973enlargem
entcountriesratiosto
EU6(2005=
1)
N F Campos & F CoricelliEU Membership, Mrs Thatcher’s Reforms and Britain’s Economic Decline
180
Comparative Economic Studies

dominated by 1969. We have subjected these results to the same sensitivitychecks we applied to per capita GDP above.
In summary, the full set of results regarding per capita GDP and totalfactor productivity provide strong evidence supporting the notion that as faras the British relative economic decline is concerned the key date is 1969. Thisis the year when De Gaulle resigns and his resignation opens the way to theUK and other EFTA members to successfully apply for EEC membership(Tatham, 2009). If this is indeed the case, one has to ask why? Howsubstantial are the benefits to the UK from EU membership? What are thechannels or mechanisms at play? We turn to these questions next.
HOW AND WHY DID BRITAIN BENEFIT FROM EU INTEGRATION?
If membership in the EU has indeed made a substantial difference to Britisheconomic performance (perhaps even more than Mrs Thatcher’s reforms), thenext logical question is how. Even though the UK is not a founding member, itis one of the three largest economies in Europe, is a powerful military anddiplomatic force and has a history of being an awkward partner (George,1994). Thus, this is an important question because if one can convincinglyestablish how EU membership benefited the UK, it would strengthen the casethat EU membership can generate significant benefits elsewhere.
Campos et al. (2014) estimate that the net benefits of EU membership tothe UK are positive, but small until around 1986 when the Single Market wasintroduced. This estimate is derived from the econometric construction of ahypothetical UK that did not join the EU in 1973. Comparing the outcomesfrom the actual UK experience with the estimated outcomes from the syntheticcontrol model indicates whether EU membership (which is the specified, post-1973 treatment) generates positive or negative net benefits. These resultsallow considering whether membership paid off, whether these returns weretemporary or permanent and whether and how they changed over time.
Figure 3 shows that, when measured by per capita output, net benefitswere at their maximum in the early 1990s and have remained constant since.Conversely, productivity benefits (GDP per worker) increased continually onan annual basis over the same time period. The international evidence onproductivity suggests an upward trend break for the USA in the mid-1990sand, at around the same time, a downward break for the euro area (Bergeaudet al., 2016).
Table 2 shows the averages of these estimated benefits for the wholeperiod after accession, as well as for its first 5 and 10 years. For comparisonpurposes, it is advisable to focus on the latter. The results summarized in
N F Campos & F CoricelliEU Membership, Mrs Thatcher’s Reforms and Britain’s Economic Decline
181
Comparative Economic Studies

Figu
re3:UKnet
benefits
from
EUmem
bership:per
capitaGDPandlabourproductivity.Source:Camposet
al.(2014)
N F Campos & F CoricelliEU Membership, Mrs Thatcher’s Reforms and Britain’s Economic Decline
182
Comparative Economic Studies
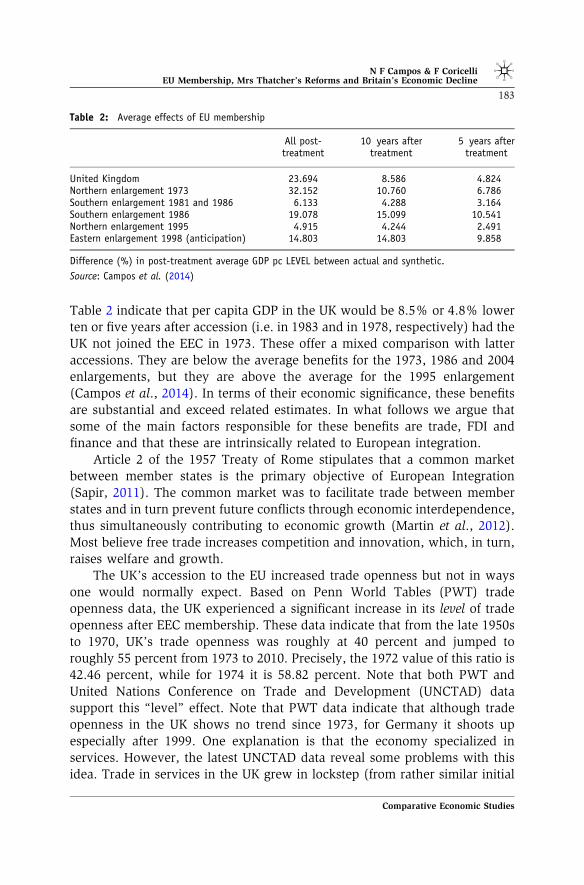
Table 2 indicate that per capita GDP in the UK would be 8.5% or 4.8% lowerten or five years after accession (i.e. in 1983 and in 1978, respectively) had theUK not joined the EEC in 1973. These offer a mixed comparison with latteraccessions. They are below the average benefits for the 1973, 1986 and 2004enlargements, but they are above the average for the 1995 enlargement(Campos et al., 2014). In terms of their economic significance, these benefitsare substantial and exceed related estimates. In what follows we argue thatsome of the main factors responsible for these benefits are trade, FDI andfinance and that these are intrinsically related to European integration.
Article 2 of the 1957 Treaty of Rome stipulates that a common marketbetween member states is the primary objective of European Integration(Sapir, 2011). The common market was to facilitate trade between memberstates and in turn prevent future conflicts through economic interdependence,thus simultaneously contributing to economic growth (Martin et al., 2012).Most believe free trade increases competition and innovation, which, in turn,raises welfare and growth.
The UK’s accession to the EU increased trade openness but not in waysone would normally expect. Based on Penn World Tables (PWT) tradeopenness data, the UK experienced a significant increase in its level of tradeopenness after EEC membership. These data indicate that from the late 1950sto 1970, UK’s trade openness was roughly at 40 percent and jumped toroughly 55 percent from 1973 to 2010. Precisely, the 1972 value of this ratio is42.46 percent, while for 1974 it is 58.82 percent. Note that both PWT andUnited Nations Conference on Trade and Development (UNCTAD) datasupport this ‘‘level’’ effect. Note that PWT data indicate that although tradeopenness in the UK shows no trend since 1973, for Germany it shoots upespecially after 1999. One explanation is that the economy specialized inservices. However, the latest UNCTAD data reveal some problems with thisidea. Trade in services in the UK grew in lockstep (from rather similar initial
Table 2: Average effects of EU membership
All post-treatment
10 years aftertreatment
5 years aftertreatment
United Kingdom 23.694 8.586 4.824Northern enlargement 1973 32.152 10.760 6.786Southern enlargement 1981 and 1986 6.133 4.288 3.164Southern enlargement 1986 19.078 15.099 10.541Northern enlargement 1995 4.915 4.244 2.491Eastern enlargement 1998 (anticipation) 14.803 14.803 9.858
Difference (%) in post-treatment average GDP pc LEVEL between actual and synthetic.
Source: Campos et al. (2014)
N F Campos & F CoricelliEU Membership, Mrs Thatcher’s Reforms and Britain’s Economic Decline
183
Comparative Economic Studies

levels) with Eurozone countries despite the noticeable differences in growth oftrade in goods.
The answer to the overall growth in trade openness for the UK may befound in intra-industry trade.7 Overall trade openness among the EU6 grew(from roughly 35 percent in 1958 to 50 percent in 1973) but intra-industrytrade increased substantially more. Over the same time period intra-industrytrade in Italy grew from 42 percent to 57 percent and in the Benelux countriesfrom 62 percent to 72 percent. Western Europe’s growth in this regard isimpressive despite the fact that intra-industry trade was growing globally. UKintra-industry trade saw massive growth after its accession in 1973. In the1960s, it was below 50 percent and grew to more than 70 percent in the late1970s and after (OECD, 1987).
The traditional argument is that trade is beneficial, but inter-industrytrade may be even more so. This point has been largely overlooked in the UKdebate about European integration, in general. Of course, trade with theCommonwealth adds to the UK’s GDP, but trade with the EU has the addedbenefit of increasing UK’s productivity. Trade with the Commonwealth isprimarily inter-industry, driven by comparative advantage (gains are derivedfrom specialization and scale), while trade with the EU is primarily intra-industry (gains are derived from competition and innovation). Therefore, theeffects of the latter on UK productivity growth are likely to be more extensiveand resilient.
Another important channel for these benefits from EU membership isforeign direct investment (FDI). Not only FDI contributes to the diffusion offrontier management practices, increases competition and shores up techno-logical innovation, but it does all this in a relatively more resilient andsustainable fashion (than for example portfolio investment).
The UK is one of the main FDI recipients in Europe. Net FDI inflows weresmall until the mid-1990s but exhibit two periods of rapid expansion, one inthe second half of the 1990s and the other before the financial crisis(Figure 4). Meanwhile, the share of FDI into services has increased. Despitethe obvious importance of the subject and the availability of evidencecontrasting the rationale of European and non-European intra-EU FDI (Basileet al., 2008), the literature focusing on potential reasons for foreign investorsto choose the UK vis-a-vis say Germany or Ireland remains scarce. Yet,
7 See Baldwin and Lopez-Gonzalez (2015), Brulhart (2009), Alfaro et al. (2015) andreferences therein. Note that Frankel and Rose (1998) argue the appropriate criteria for(endogenous) optimal currency area membership are intra-industry not bilateral trade (Fidrmuc,2004) offers supporting econometric evidence).
N F Campos & F CoricelliEU Membership, Mrs Thatcher’s Reforms and Britain’s Economic Decline
184
Comparative Economic Studies
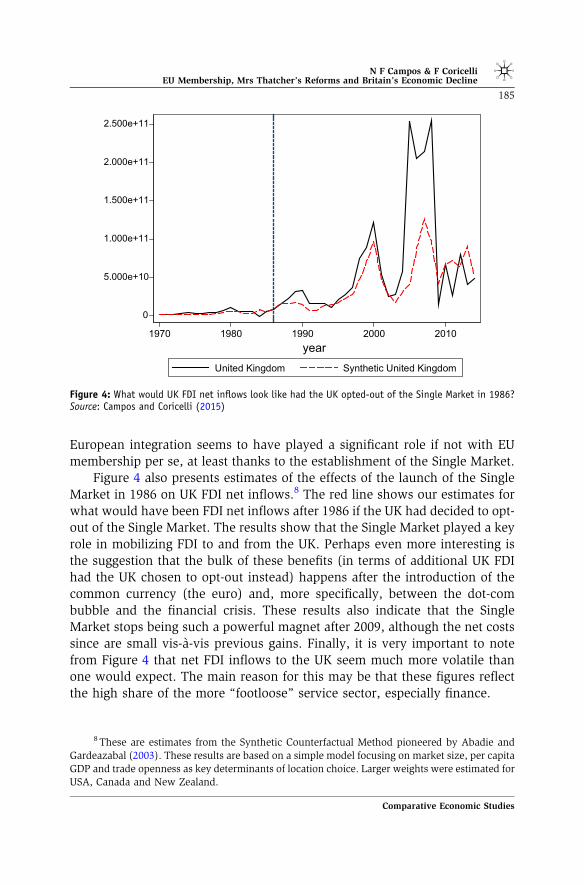
European integration seems to have played a significant role if not with EUmembership per se, at least thanks to the establishment of the Single Market.
Figure 4 also presents estimates of the effects of the launch of the SingleMarket in 1986 on UK FDI net inflows.8 The red line shows our estimates forwhat would have been FDI net inflows after 1986 if the UK had decided to opt-out of the Single Market. The results show that the Single Market played a keyrole in mobilizing FDI to and from the UK. Perhaps even more interesting isthe suggestion that the bulk of these benefits (in terms of additional UK FDIhad the UK chosen to opt-out instead) happens after the introduction of thecommon currency (the euro) and, more specifically, between the dot-combubble and the financial crisis. These results also indicate that the SingleMarket stops being such a powerful magnet after 2009, although the net costssince are small vis-a-vis previous gains. Finally, it is very important to notefrom Figure 4 that net FDI inflows to the UK seem much more volatile thanone would expect. The main reason for this may be that these figures reflectthe high share of the more ‘‘footloose’’ service sector, especially finance.
0
5.000e+10
1.000e+11
1.500e+11
2.000e+11
2.500e+11
1970 1980 1990 2000 2010year
United Kingdom Synthetic United Kingdom
Figure 4: What would UK FDI net inflows look like had the UK opted-out of the Single Market in 1986?Source: Campos and Coricelli (2015)
8 These are estimates from the Synthetic Counterfactual Method pioneered by Abadie andGardeazabal (2003). These results are based on a simple model focusing on market size, per capitaGDP and trade openness as key determinants of location choice. Larger weights were estimated forUSA, Canada and New Zealand.
N F Campos & F CoricelliEU Membership, Mrs Thatcher’s Reforms and Britain’s Economic Decline
185
Comparative Economic Studies

Let us now turn to finance because we believe this is also one of theimportant channels through which the positive effects of EU membership filterthrough the UK economy. One of the least discussed features of the financialsector in the UK is that its relative importance to the British economy hugelyoutdates the mid-1980s. As pointed out by Burgess (2011) and Haldane et al.(2010), the time period in which the growth of aggregate gross value added(GVA) in finance exceeds that of the aggregate economy the most is the periodbefore World War I. Haldane et al. (2010) calculate that this difference for1856–1913 is of 5 percentage points, with the average aggregate value at 2%.Conversely, between 1914 and 1970, the average annual growth rate ofaggregate GVA was 1.9%, while that of financial intermediation was 1.5%.Interestingly, between 1970 and 2008 finance GVA again grows faster thanthat of the overall economy (3.8% against 2.4%). The message that thesefigures tell is that finance has always been an important sector for the UKeconomy, it is one of its most dynamic, and when it grows faster it seem to beable to pull the rest of the economy. Schumpeter indeed may have been right,as these figures support the notion that the UK benefited from EU membershipthrough the positive impact of EU integration on the development of the UKfinancial sector. Access to the EU Single Market contributed to strengtheningthe position of the UK as leading international financial centre.
London has traditionally been the main centre for foreign exchangetransactions. However, since the beginning of the 1990s, the share of the UKin foreign exchange transactions has sharply increased, from 25 to more than40 percent of the world market.9 Note that foreign exchange, with dailytransactions of more than 6 trillion US$ in 2013, accounts for the largestamount of overall global financial transactions. Although the US dollar stilldominates, the Euro accounts for more than one-third of foreign exchangetransactions. BIS (2015) shows that the UK has gained shares in foreignexchange at the expense of the main Euro area members, Germany andFrance, but also of Switzerland. Technological factors may explain suchphenomenon, but the fact the UK is a EU member certainly played a role.
Clearly, access to the EU Single Market has been one main factor inconsolidating the role of the UK as an international financial centre. Thecomparative advantages of the UK financial sector (tradition, flexibleregulation, product diversification, human capital, language, time zone,etc.) help the UK to exploit the benefits of EU integration. It is worth notingthat, despite being outside the common currency, the UK remains by far thelargest player in euro-denominated transactions in the EU.
9 Lane and Milesi-Ferretti (2007) corroborate this point.
N F Campos & F CoricelliEU Membership, Mrs Thatcher’s Reforms and Britain’s Economic Decline
186
Comparative Economic Studies

One other last and final channel that has not received due attention in thecurrent debate on European Integration is monetary integration, in particularthe relation between the euro-ins and euro-outs. We think that one way to startlooking into this issue is business cycle synchronization. We want to make twoobservations. One is that synchronization has increased hugely after theintroduction of the euro even for those countries outside of the Eurozone. Thesecond, and related, point is that the effect of the Economic and Monetary Union(EMU) integration is to pull in the euro-outs, thus reducing the cost ofmembership (or conversely, increasing the cost of leaving).
The degree of synchronization of supply shocks indicates that the EU6plus Denmark constitutes the ‘‘core’’ of the EEC economies, whereas theremaining ‘‘periphery’’ countries display a lower degree of synchronization –as argued by Bayoumi and Eichengreen (1993). It should also be noted thatdemand shocks are lower in all countries, both in and outside of the core(Figure 5).
Although the European Monetary system removed individual monetarypolicies as a cause of demand shocks, fiscal policies remain independent andcontribute to differences between nations. Therefore, it may be valuable toupdate the famous Bayoumi and Eichengreen exercise by reassessing theextent to which the European Monetary Union has affected the core–peripherydichotomy identified by the data set, which ended in 1988, before theEuropean Monetary Union was implemented.
The results displayed in Figure 5 indicate that the European MonetaryUnion has mitigated the trend of core–periphery differences in supply anddemand (Campos and Macchiarelli 2016). The European Monetary Union
Figure 5: The dynamics of the correlation of supply and demand disturbances between pre-EMU(1963–1988) from Bayoumi-Eichengreen (1993) and post-EMU (Campos-Macchiarelli for 1991–2014).Source: Campos and Macchiarelli (2016)
N F Campos & F CoricelliEU Membership, Mrs Thatcher’s Reforms and Britain’s Economic Decline
187
Comparative Economic Studies

successfully further integrated the entirety of the European Union, includingthe UK. After the introduction of the Euro, UK business cycles became moresynchronized with the business cycle of the rest of the EU.
A POLITICAL ECONOMY EXPLANATION
Two of the most powerful myths about the relationship between the UK andthe European integration project are that the European Single Market (ESM)was a British idea and that Mrs Thatcher’s structural reforms caused therevival of the British economy. Our results above provide new evidencecontrary to these myths. We argue that a crucial factor in the British relativeeconomic revival was membership in the European Community such that,without EU membership, Mrs Thatcher’s reforms would perhaps have beenless effective.
The European Single Market (ESM) and Mrs Thatcher’s reforms areclosely related myths because they form the basis of the view (widespread inthe UK) that those reforms were not only good for the UK but also good forEurope. These supply-side structural reforms are widely seen as the utmostBritish contribution to the European project. The fact that the European SingleMarket is one of the clearly stated goals of the 1957 Treaty of Rome, which theUK of course refused to sign, should be suggestive in this case (Sapir, 2011).
Mrs Thatcher’s reforms were implemented in her second term in office.Her June 1983 general election victory was the most decisive since Labour’s in1945. Her first term was marked by the second oil shock and by the FalklandsWar. The main structural reforms that defined her second term wereprivatization, labour, financial and product markets liberalization, and greateropenness to foreign investment (Card and Freeman, 2004).
Our analysis combines the empirical identification of turning points(structural breaks) with an analysis of how and why the benefits from EUmembership changed over time using econometric counterfactuals.
One of the main empirical findings is that the turning point around 1969 issignificantly more powerful than the 1983 or 1986 turning points (whichcorrespond to the launch of the programme of structural reforms in the UK).The UK’s per capita GDP relative to the EU founding members’ declinedsteadily from 1945 to around 1970, but it became relatively stable onwards. IfBritain joined the EU in an attempt to stop its relative economic decline, itworked. Moreover, it laid the ground for future improvements in relativeeconomic performance (which come to fruition in the Single Market).
One possible explanation is that the success of Mrs Thatcher’s reformsrequired EU integration. These structural reforms could not have taken place
N F Campos & F CoricelliEU Membership, Mrs Thatcher’s Reforms and Britain’s Economic Decline
188
Comparative Economic Studies

without a large and powerful constituency. In this case, these were Britishentrepreneurs who would benefit from a much larger, more innovative andmore demanding market place (contrast the EU and the Commonwealth inthis respect). These entrepreneurs also realized that to be competitive theywould need to tap in deeper capital and labour markets and would need aclear set of common standards and regulations so as to guarantee a levelplaying field. Without the support of such powerful constituencies, MrsThatcher’s reforms would not have been proposed or fully implemented andclearly would not have been nearly as successful or influential.
This explanation draws parallels with the French experience in the post-World War II period (Adams, 1989). Between 1945 and 1957, there wasconflict of interest between powerful groups of entrepreneurs against and infavour of furthering European economic integration. Those against tended toexport mostly to the former French colonies. Yet these groups lost influence inthe run-up to the Treaty of Rome and found themselves locked-in theEuropean integration project even after regaining considerable politicalinfluence with De Gaulle appointment in 1958. At that point, they couldslow down but could not reverse the process.
Mrs Thatcher’s reforms were clearly important and together with theSingle Market have played an important role in buttressing British economicperformance. The results and the interpretation above basically challenge theexclusive prominence of this explanation for the reversal in the long-standingUK relative economic decline. This is because it makes little sense to arguethat Mrs Thatcher reforms were implemented in a vacuum, that is, withoutthe support of powerful constituencies that would benefit from them in thevery long term. EU membership in 1973 marks the undisputable arrival ofsuch constituencies to the centre stage of British politics and policy-making.
One further drawback of the dominance of the Mrs Thatcher and herreforms explanation is that it crowded out research on the emergence of suchconstituencies. For example, Bean and Crafts write in 1996 that ‘‘we alsoanticipate that much more will eventually be written on the implications forgrowth of the interplay between government and producer interests’’ (p. 162).Unfortunately, this crucial area of research remains to this day still to be fullydeveloped.
CONCLUSIONS
Why did Britain join the EU? For various reasons. Because De Gaulle left.Because the Commonwealth trade could not compete. Because Heath defeatedWilson. Because the free trade area integration model sunk. But above all,
N F Campos & F CoricelliEU Membership, Mrs Thatcher’s Reforms and Britain’s Economic Decline
189
Comparative Economic Studies

Britain joined because joining the European project was perceived to be a wayto stop its relative economic decline. In 1950, UK’s per capita GDP was almosta third larger than the EU6 average; in 1973, it was about 10 percent below; ithas been comparatively stable ever since. On this basis, joining the EUworked: it helped to halt Britain relative economic decline vis-a-vis the EU6.
UK economic performance is of course complex and driven by multiple(not a single) causes. Yet European integration has so far been broadlydismissed as a potential explanatory factor of the UK post-WW2 economicperformance rebound. We argue it should not and that showing that Europeanintegration played a key role in one of its most reluctant partners implies thatif it can work there, it can work elsewhere (and probably anywhere). Timemay be ripe to paraphrase Churchill: European may be the worst form ofintegration, except for all the others.
Our analysis of four major areas of the economy – trade, FDI, finance andEMU – indicates that the UK gained significantly from EU integration. A‘‘Brexit’’ will likely result in heavy losses (Ottaviano et al., 2014) and weexpect them to compound once the consequences on intra-industry trade, FDIand financial integration are accounted for. Losses may be even greater afterthe interactions among these are considered. We expect interaction effectsbetween these three relationships to be particularly substantial. FDI and tradewill be heavily affected because of the involvement of FDI in intra-industrytrade. Similarly, the credit-intensive nature of intra-industry trade is likely toaffect financial integration and trade (Giannetti et al., 2011). Finally, because asignificant amount of FDI in the UK focuses on the financial sector, therelationship between financial integration and FDI will be key. It is nocoincidence that the benefits for these sectors seem to have increased after theintroduction of the common currency. These areas urgently require greaterattention because current economic analysis on the potential effects of Brexitalmost exclusively focuses on the UK–EU import–export relationship andunderestimate the true cost of Brexit, due to the narrow scope of analysis.
The effects of Brexit would likely be strongest on the UK’s financial sector,which would, in turn, affect trade and FDI. Although there are already effortsin the EU to diversify away from London as the primary hub for Eurotransactions, exiting the EU would minimize the UK’s ability to influence suchefforts in the future. The UK’s legal victory in March 2015 against the ECBregarding the location of euro clearinghouses was undoubtedly influenced byits EU membership. The UK as non-EU member should not expect to holdsuch sway in similar matters.
N F Campos & F CoricelliEU Membership, Mrs Thatcher’s Reforms and Britain’s Economic Decline
190
Comparative Economic Studies
AcknowledgementsWe would like to thank Richard Baldwin, Nicholas Crafts, Paul De Grauwe,Peter Egger, Reuven Glick, Thorvaldur Gylfason, Corrado Macchiarelli,Tomislav Presecan, Jan Svejnar, Paul Wachtel (the editor), Karl Whelan, ananonymous referee and seminar participants at Brunel University London, the22nd Dubrovnik CNB Conference, DIW, ECB, NIESR and World Bank for theencouragement, valuable conversations and comments on previous versions.The usual disclaimer applies.
REFERENCES
Abadie, A and Gardeazabal, J. 2003: The economic costs of conflict: A case study of the Basquecountry. American Economic Review 93: 113–132.
Adams W. 1989: Restructuring the French economy: government and the rise of market competitionsince World War II. Brookings Institution Press: Washington DC.
Aitken N. 1973: The effect of the EEC and EFTA on European trade: A temporal cross-sectionanalysis. American Economic Review 63(5): 881–892.
Alfaro, L, Antras, P, Chor, D and Conconi P. 2015: Make or buy decisions over upstream anddownstream inputs: An investigation of firm boundaries along value chains. VoxEu 14November.
Baldwin, R and Lopez-Gonzalez, J. 2015: Supply-chain trade: A portrait of global patterns andseveral testable hypotheses. The World Economy 38(11): 1682–1721.
Basile, R, Castellani, D and Zanfei, A. 2008: Location choices of multinational firms in Europe: Therole of EU cohesion policy. Journal of International Economics 74(2): 328–340.
Bayoumi, T and Eichengreen, B. 1993: Shocking aspects of European Monetary Integration. In:Torres, F and Giavazzi, F. (eds.) Adjustment and growth in the European Monetary Union.Cambridge University Press.
Bayoumi, T and Eichengreen, B. 1997: Is regionalism simply a diversion? Evidence from theevolution of the EC and EFTA. In: Ito, T and Krueger A. (eds.) Regionalism vs. MultilateralArrangements. NBER/University of Chicago Press.
Bean, C and Crafts, N. 1996: British economic growth since 1945: Relative economic decline… andrenaissance? In: Crafts, N and Toniolo, G. (eds.) Economic Growth in Europe Since 1945.Cambridge University Press: Cambridge.
Bean, C and Symons, J. 1989: Ten Years of Mrs. T. NBER Macroeconomics Annual, Vol. 4,pp. 13–61.
Bergeaud, A, Cette, G and Lecat, R. 2016: Productivity Trends in Advanced Countries between1890 and 2012. Review of Income and Wealth 62(3): 420–444.
BIS. 2015: Triennial Central Bank Survey: 2013. Bank for International Settlements: Basel.Broadberry, SN and Wagner, K. 1996: Human capital and productivity in manufacturing during
the twentieth century: Britain, Germany, and the United States. In: van Ark, B and Crafts N.(eds.) Quantitative aspects of Post-war European Economic Growth. Cambridge UniversityPress: Cambridge.
Brulhart, M. 2009: An account of global intra-industry trade, 1962–2006. The World Economy32(3): 401–59.
Burgess, S. 2011: Measuring financial sector output and its contribution to UK GDP. Bank ofEngland Quarterly Bulletin 2011 Q3: 234–246.
N F Campos & F CoricelliEU Membership, Mrs Thatcher’s Reforms and Britain’s Economic Decline
191
Comparative Economic Studies

Card, D and Freeman, R. 2004: What have two decades of British Economic Reform Delivered? In:Card, D, Blundell, R and Freeman, R. (eds.) Seeking a premier economy: The economic effects ofBritish Economic reforms, 1980–2000. University of Chicago Press.
Campos, N and Coricelli, F. 2015: Some unpleasant Brexit econometrics. VoxEu, 11 December2015
Campos, N, Coricelli, F and Moretti, L. 2014: Economic Growth and Political Integration:Estimating the Benefits from Membership in the European Union Using the SyntheticCounterfactuals Method. CEPR Discussion Paper No. 9968, Center for Economic PolicyResearch: London.
Campos, N and Macchiarelli, C. 2016: Core and Periphery in the European Monetary Union:Bayoumi and Eichengreen 25 years later. Economics Letters 147(1): 127–130.
Copsey, N and Haughton, T. 2014: Farewell Britannia? ‘Issue Capture’ and the Politics of DavidCameron’s 2013 EU Referendum Pledge. Journal of Common Market Studies 52: 74–89.
Crafts, N. 2012: British relative economic decline revisited: The role of competition. Explorationsin Economic History 49(1): 17–29.
Darwin, J. 2011: The Empire Project: The Rise and Fall of the British World System 1830–1970.Cambridge University Press.
Dell, E. 1995: The Schuman Plan and the British Abdication of Leadership in Europe. ClarendonPress.
Eichengreen, B. 2008: European Integration. In: Wittman, D and Weingast B. (eds.) OxfordHandbook of Political Economy. Oxford University Press.
Fidrmuc, J. 2004: The Endogeneity of the optimum currency area criteria, intra-industry trade, andEMU enlargement. Contemporary Economic Policy 22(1): 1–12.
Frankel, J and Rose, A. 1998: The Endogeneity of the optimum currency area criteria. EconomicJournal 108(449): 1009–1025.
Garavini, G. 2012: After empires: European integration, decolonization, and the challenge from theglobal south 1957–1986. Oxford University Press.
Giannetti, M, Burkart, M and Elligsen, T. 2011: What You Sell Is What You Lend? Explaining TradeCredit Contracts. Review of Financial Studies 24(4): 1261–1298.
George, S. 1994: An Awkward Partner: Britain in the European Community. Oxford UniversityPress (2nd edition).
Gowland, D and Turner, A. 1999: Reluctant Europeans: Britain and European Integration 1945–1998. Routledge.
Haldane, S, Brennan, S and Madouros, V. 2010: What is the contribution of the financial sector:Miracle or mirage? In: Turner A. et al. (eds.) The Future of Finance: The LSE Report. LSE:London.
Hansen, B. 2001: The New Econometrics of Structural Change: Dating breaks in US laborproductivity. Journal of Economic Perspectives 15(4): 117–128.
Lane, P and Milesi-Ferretti, G. 2007: The External Wealth of Nations Mark II. Journal ofInternational Economics 73: 223–250.
Layard, R and Nickell, S. 1989: The Thatcher Miracle? American Economic Review 79(2): 215–219.Martin, P, Mayer, T and Thoenig, M. 2012: The geography of conflicts and fee trade agreements.
American Economic Journal: Macroeconomics 4(4):1–35Minford, P. 2015: What did Margaret Thatcher do for the UK economy? British Politics 10(1):
31–40.OECD. 1987: Structural Adjustment and Economic Performance. OECD: Paris.Ottaviano, G, Pessoa, J, Sampson, T and Van Reenen, J. 2014: Brexit or Fixit? The Trade and
Welfare Effects of Leaving the European Union. CEP/LSE, CEPPA016.Sapir, A. 2011: European Integration at the Crossroads: A Review Essay on the 50th Anniversary of
Bela Balassa’s Theory of Economic Integration. Journal of Economic Literature 49(4):1200–1229.
N F Campos & F CoricelliEU Membership, Mrs Thatcher’s Reforms and Britain’s Economic Decline
192
Comparative Economic Studies

Tatham, A. 2009: Enlargement of the European Union. Kluwer European Law Collection:Amsterdam.
Temin, P. 2003: The Golden Age of European Growth Reconsidered. European Review of EconomicHistory 6: 3–22.
Walters, A. 1986: Britain’s Economic Renaissance: Margaret Thatcher’s Reforms, 1979–1984.Oxford University Press.
Young, H. 1998: This Blessed Plot: Britain and Europe from Churchill to Blair. Overlook Press.
Open Acess This article is distributed under the terms of the Creative CommonsAttribution 4.0 International License (http://creativecommons.org/licenses/by/4.0/), which permits unrestricted use, distribution, and reproduction in any med-ium, provided you give appropriate credit to the original author(s) and the source,provide a link to the Creative Commons license, and indicate if changes weremade.
Electronic supplementary material The online version of this article (doi:10.1057/s41294-017-0023-7) contains supplementary material, which is available to authorized users.
N F Campos & F CoricelliEU Membership, Mrs Thatcher’s Reforms and Britain’s Economic Decline
193
Comparative Economic Studies