Embed Size (px)
Citation preview
EURAMET Project no. 1297
KCDB: EURAMET.M.FF.S8
Comparison of a 50 mL pycnometer and a 500 mL flask
Final Report
DMDM (Ljiljana Mićić) – Coordinator IPQ (Elsa Batista) – Support in comparison
November, 2016
EURAMET Project no. 1297
KCDB: EURAMET.M.FF.S8
Comparison of a 50 mL pycnometer and a 500 mL flask Final report
2 /37
Contents
1. Introduction .................................................................................................. 3
2. Participants ................................................................................................... 4
3. The transfer standards ................................................................................. 5
4. Calibration method ....................................................................................... 5
5. Measurement conditions and equipment used .......................................... 6
5.1. Measurement conditions ................................................................................................. 6
5.1.1. Temperatures of water and ambient conditions ....................................................... 6 5.1.2. Type of water ........................................................................................................... 8
5.2. Used equipment ............................................................................................................. 8 5.2.1. Mass standards ......................................................................................................... 8 5.2.2. Balances ................................................................................................................ 10
6. Stability of the transfer standards ............................................................. 11
6.1. Stability of the volumetric flask .................................................................................... 11
6.2. Stability of the pycnometers ......................................................................................... 11
7. Measurement results .................................................................................. 11
7.1. Measurement results for flask ....................................................................................... 11
7.2. Measurement results for pycnometer with s.n. 2 .......................................................... 13 7.3. Measurement results for pycnometer with s.n. 34 ........................................................ 14
8. Determination of the reference value ...................................................... 14
9. Results with reference value and RV uncertainty .................................... 16
9.1. Results with reference value and RV uncertainty for flask .......................................... 16
9.2. Results with reference value and RV uncertainty for pycnometer with s.n. 2 .............. 18 9.3. Results with reference value and RV uncertainty for pycnometer with s.n. 34 ........... 20
10. Uncertainty presentation ......................................................................... 21
10.1. Uncertainty presentation for flask ............................................................................... 21
10.2. Uncertainty presentation for pycnometers .................................................................. 23
11. CMCs as declared by the laboratories in the CIPM MRA ........................ 26
12. Conclusion ................................................................................................. 28
13. References ................................................................................................. 28
Annex 1 Spreadsheets .................................................................................. 29
Annex 2 Degree of equivalence between the laboratories......................... 33
Annex 2.1 Degree of equivalence between the laboratories for flask ............................... 33 Annex 2.2 Degree of equivalence between the laboratories for pycnometer with s.n. 2 ... 35
Annex 2.3 Degree of equivalence between the laboratories for pycnometer with s.n. 34 . 36
Annex 3 Changes to results after Draft A report........................................... 36
Annex 3.1 FORCE Technology explanation from 11 August 2016. ................................... 36
Annex 3.2 UME explanation from 31 August 2016 ............................................................ 36 Annex 3.3 DPM explanation from 30 August 2016 ............................................................ 37 Annex 3.4 ČMI 1 explanation from 26 August 2016 .......................................................... 37 Annex 3.5 En-values with results revised after draft A report ........................................... 37
EURAMET Project no. 1297
KCDB: EURAMET.M.FF.S8
Comparison of a 50 mL pycnometer and a 500 mL flask Final report
3 /37
1. Introduction
During the EURAMET TC-F meeting, held in Netherlands/Delft in March 2013, it was agreed to start a comparison regarding the calibration of laboratory glassware instruments and pycnometers in order to compare measurements results, the experimental methods as well as the uncertainty calculations.
Since there are several types of laboratory glassware in the range from 1 mL up to 10 L and pycnometers in the range from 1 mL up to 100 mL, it was agreed to perform measurements on 500 mL flask, as reperesentative instrument for laboratory glassware and 50 mL Gay Lussac type pycnometer, as representative instrument for pycnometers.
The purpose of this comparison was to compare the results of the participating laboratories in the calibration of 50 mL pycnometer and 500 mL volumetric flask using the gravimetric method.
Laboratories were asked to determined the “contained” volume of the 50 mL pycnometer and of the 500 mL flask at a reference temperature of 20 °C.
The gravimetric method was used for both instruments by all laboratories.
The project technical protocol was sent to all the EURAMET TC Flow members and 15 agreed to participate.
During the comparison two other NMIs joined.
Each laboratory had three weeks to perform calibrations.
During the comparison the pycnometer has been broken and replaced with another one with the same volume capacity and type.
The circulation of the 500 mL flask and 50 mL pycnometer started in February 2014 and ended in March 2015.
EURAMET Project no. 1297
KCDB: EURAMET.M.FF.S8
Comparison of a 50 mL pycnometer and a 500 mL flask Final report
4 /37
2. Participants
The participants are presented in table 1, in order of participation date.
Table 1 – Participants of the EURAMET Project 1297
NMI Country Participation date Responsible person
DMDM Serbia February, 2014 Ljiljana Mićić
INM Romania March, 2014 Radu Poenaru-Bordea
MKEH Hungary April, 2014 Csilla Vámossy
ČMI Laboratory RI
Brno
Czech Republic April, 2014 Miroslava Benkova
ČMI Laboratory RI
Pardubice
Czech Republic May, 2014 Miroslava Benkova
VSL Netherlands June, 2014 Erik Smits
GUM Poland June, 2014 Beata Sokolowska
BEV Austria July, 2014 Anton Niessner
IPQ Portugal August, 2014 Elsa Batista
FORCE Denmark September, 2014 Lise-Lotte Grue
INRIM Italy September, 2014 Andrea Malengo
CEM Spain October, 2014 Noelia Herrero
and Nieves Medina
MIRS Slovenia November, 2014 Matej Grum
DPM Albania December, 2014 Erinda Piluri
BoM Macedonia January, 2015 Anastazija Sarevska
MBM Montenegro
February, 2015 Mirjana Mihailović
UME Turkey February, 2015 Umit Akcadag
Participants presented a report of their measurements before the end of the comparison according to a spreadsheet supplied by the coordinator of the comparison, Annex 1.
EURAMET Project no. 1297
KCDB: EURAMET.M.FF.S8
Comparison of a 50 mL pycnometer and a 500 mL flask Final report
5 /37
3. The transfer standards
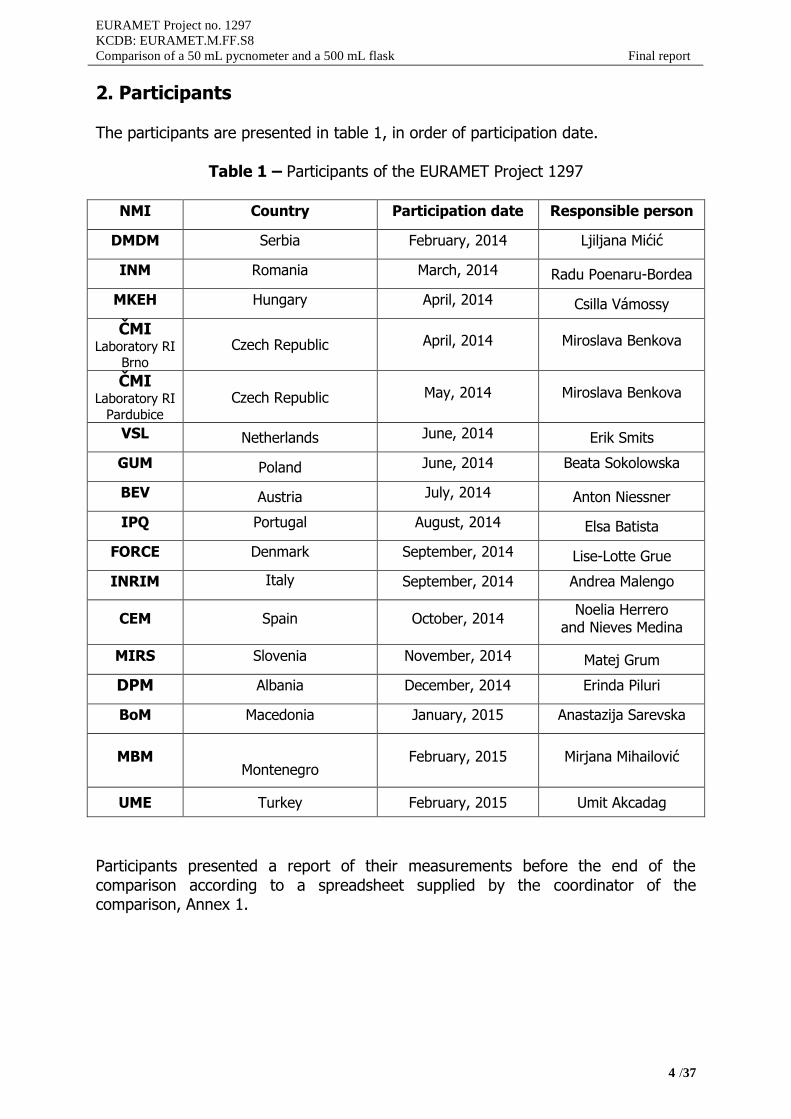
The transfer standards that were circulated in this comparison were:
1. Pycnometer (see Figure 1), nominal capacity 50 mL, Gay Lussac Type, made outof boro-silicate glass 3.3, pear-shaped, manufactured according to ISO 3507:1999,serial number: 2;
2. One – mark volumetric flask (see Figure 2), nominal capacity 500 mL, class A,made out of boro-silicate glass 3.3, narrow-necked, pear-shaped, manufacturedaccording to ISO 1042:1998, serial number: 1;
3. Pycnometer (see Figure 3), nominal capacity 50 mL, Gay Lussac Type, made outof boro-silicate glass 3.3, pear-shaped, manufactured according to ISO 3507:1999,serial number: 34.
The cubic coefficient of expansion for the boro-silicate glass 3.3 is 9,9×10⁻⁶ °C-1.
Figure 1 Pycnometer, s.n. 2
Figure 2 Volumetric flask, s.n. 1
Figure 3 Pycnometer, s.n. 34
4. Calibration method
The participating laboratories used the gravimetric method and their own procedure of calibration in order to determine the “contained” volume of a 500 mL flask and a 50 mL pycnometer. The results were given for a reference temperature of 20 ºC. Participating laboratory performed a series of ten (10) consecutive measurements for each standard.
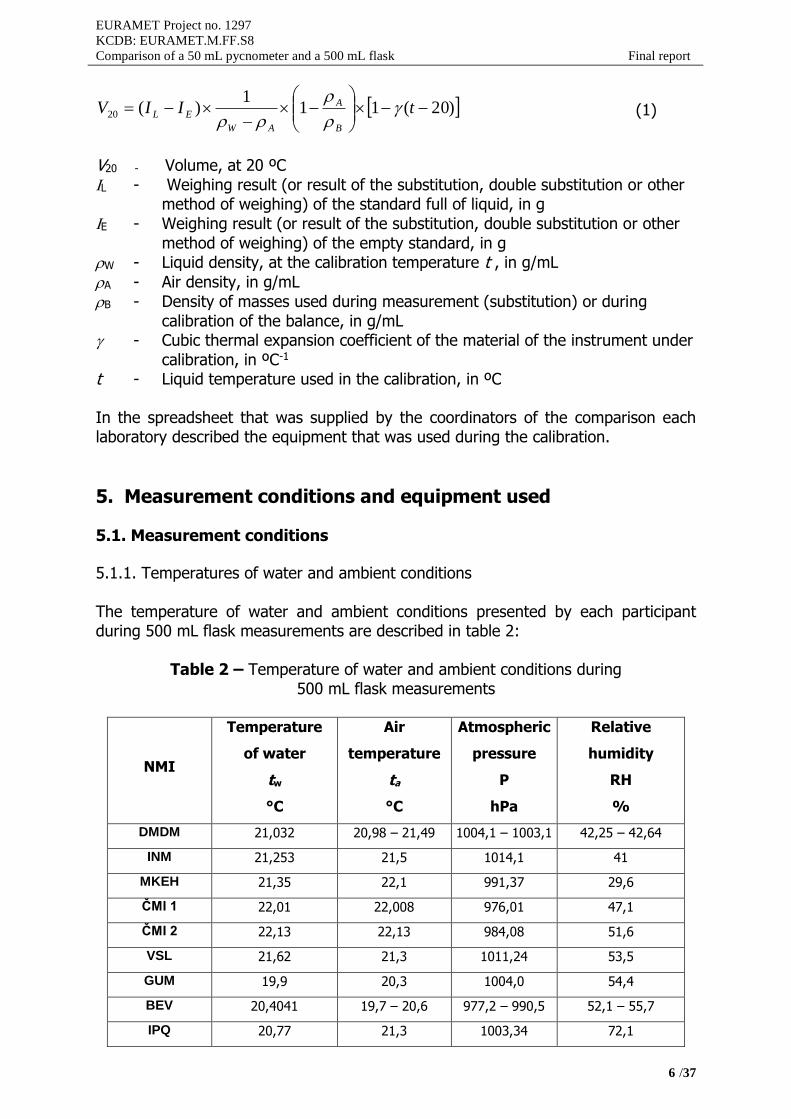
The laboratories used the formula described in ISO 4787:2010 [1] for volume determination:
EURAMET Project no. 1297
KCDB: EURAMET.M.FF.S8
Comparison of a 50 mL pycnometer and a 500 mL flask Final report
6 /37
)20(111
)(20
tIIV
B
A
AW
EL
(1)
V20 - Volume, at 20 ºC
L - Weighing result (or result of the substitution, double substitution or othermethod of weighing) of the standard full of liquid, in g
E - Weighing result (or result of the substitution, double substitution or other
method of weighing) of the empty standard, in gW - Liquid density, at the calibration temperature t , in g/mL
A - Air density, in g/mL
B - Density of masses used during measurement (substitution) or during
calibration of the balance, in g/mL - Cubic thermal expansion coefficient of the material of the instrument under
calibration, in ºC-1
t - Liquid temperature used in the calibration, in ºC
In the spreadsheet that was supplied by the coordinators of the comparison each laboratory described the equipment that was used during the calibration.
5. Measurement conditions and equipment used
5.1. Measurement conditions
5.1.1. Temperatures of water and ambient conditions
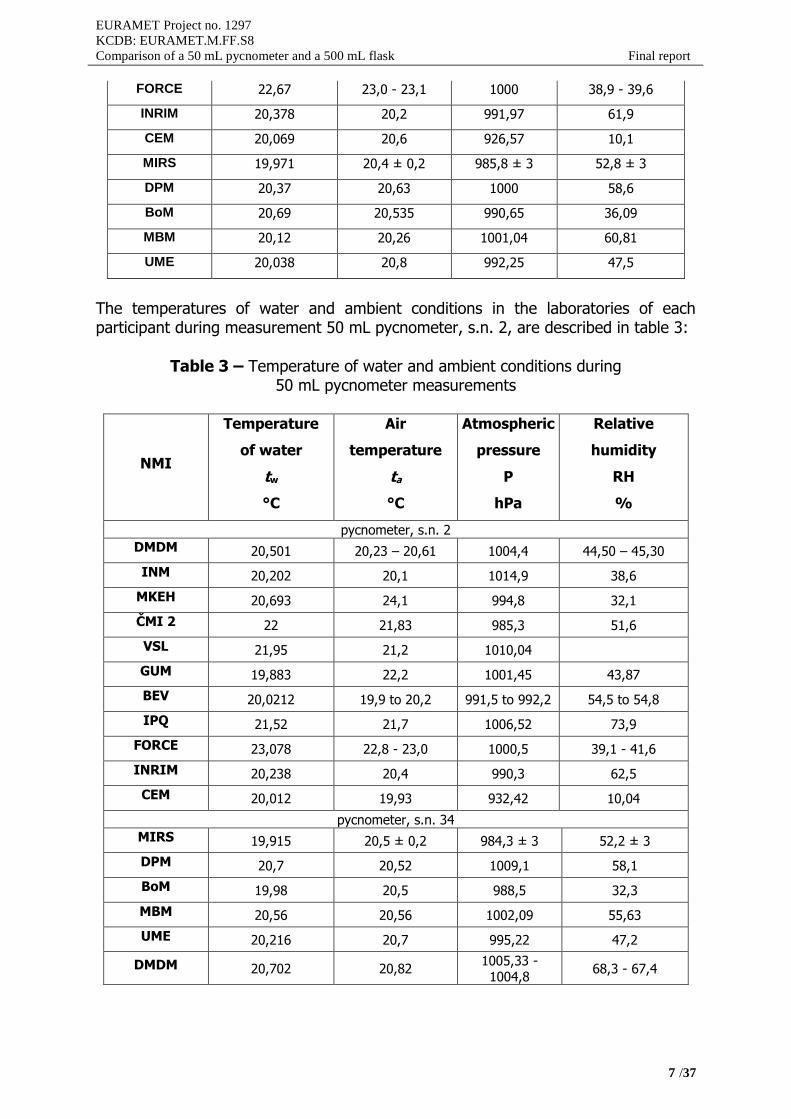
The temperature of water and ambient conditions presented by each participant during 500 mL flask measurements are described in table 2:
Table 2 – Temperature of water and ambient conditions during 500 mL flask measurements
NMI
Temperature
of water
tw
°C
Air
temperature
ta
°C
Atmospheric
pressure
P
hPa
Relative
humidity
RH
%
DMDM 21,032 20,98 – 21,49 1004,1 – 1003,1 42,25 – 42,64
INM 21,253 21,5 1014,1 41
MKEH 21,35 22,1 991,37 29,6
ČMI 1 22,01 22,008 976,01 47,1
ČMI 2 22,13 22,13 984,08 51,6
VSL 21,62 21,3 1011,24 53,5
GUM 19,9 20,3 1004,0 54,4
BEV 20,4041 19,7 – 20,6 977,2 – 990,5 52,1 – 55,7
IPQ 20,77 21,3 1003,34 72,1
EURAMET Project no. 1297
KCDB: EURAMET.M.FF.S8
Comparison of a 50 mL pycnometer and a 500 mL flask Final report
7 /37
FORCE 22,67 23,0 - 23,1 1000 38,9 - 39,6
INRIM 20,378 20,2 991,97 61,9
CEM 20,069 20,6 926,57 10,1
MIRS 19,971 20,4 ± 0,2 985,8 ± 3 52,8 ± 3
DPM 20,37 20,63 1000 58,6
BoM 20,69 20,535 990,65 36,09
MBM 20,12 20,26 1001,04 60,81
UME 20,038 20,8 992,25 47,5
The temperatures of water and ambient conditions in the laboratories of each participant during measurement 50 mL pycnometer, s.n. 2, are described in table 3:
Table 3 – Temperature of water and ambient conditions during 50 mL pycnometer measurements
NMI
Temperature
of water
tw
°C
Air
temperature
ta
°C
Atmospheric
pressure
P
hPa
Relative
humidity
RH
%
pycnometer, s.n. 2
DMDM 20,501 20,23 – 20,61 1004,4 44,50 – 45,30
INM 20,202 20,1 1014,9 38,6
MKEH 20,693 24,1 994,8 32,1
ČMI 2 22 21,83 985,3 51,6
VSL 21,95 21,2 1010,04
GUM 19,883 22,2 1001,45 43,87
BEV 20,0212 19,9 to 20,2 991,5 to 992,2 54,5 to 54,8
IPQ 21,52 21,7 1006,52 73,9
FORCE 23,078 22,8 - 23,0 1000,5 39,1 - 41,6
INRIM 20,238 20,4 990,3 62,5
CEM 20,012 19,93 932,42 10,04
pycnometer, s.n. 34
MIRS 19,915 20,5 ± 0,2 984,3 ± 3 52,2 ± 3
DPM 20,7 20,52 1009,1 58,1
BoM 19,98 20,5 988,5 32,3
MBM 20,56 20,56 1002,09 55,63
UME 20,216 20,7 995,22 47,2
DMDM 20,702 20,82 1005,33 - 1004,8
68,3 - 67,4
EURAMET Project no. 1297
KCDB: EURAMET.M.FF.S8
Comparison of a 50 mL pycnometer and a 500 mL flask Final report
8 /37
5.1.2. Type of water
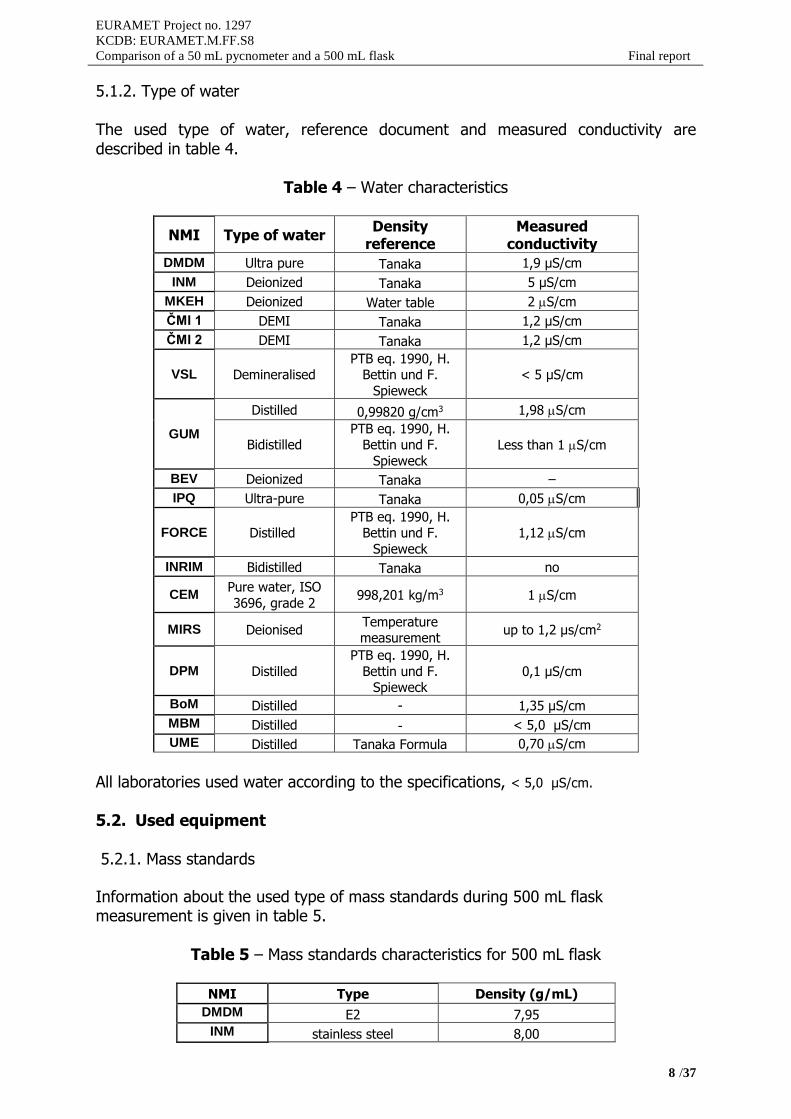
The used type of water, reference document and measured conductivity are described in table 4.
Table 4 – Water characteristics
NMI Type of water Density
reference Measured
conductivity
DMDM Ultra pure Tanaka 1,9 μS/cm
INM Deionized Tanaka 5 µS/cm
MKEH Deionized Water table 2 S/cm
ČMI 1 DEMI Tanaka 1,2 μS/cm
ČMI 2 DEMI Tanaka 1,2 μS/cm
VSL Demineralised PTB eq. 1990, H.
Bettin und F.
Spieweck
˂ 5 μS/cm
GUM
Distilled 0,99820 g/cm3 1,98 S/cm
Bidistilled PTB eq. 1990, H.
Bettin und F.
Spieweck Less than 1 S/cm
BEV Deionized Tanaka –
IPQ Ultra-pure Tanaka 0,05 S/cm
FORCE DistilledPTB eq. 1990, H.
Bettin und F.
Spieweck
1,12 S/cm
INRIM Bidistilled Tanaka no
CEM Pure water, ISO
3696, grade 2 998,201 kg/m3 1 S/cm
MIRS Deionised Temperature measurement
up to 1,2 µs/cm2
DPM Distilled
PTB eq. 1990, H.
Bettin und F. Spieweck
0,1 µS/cm
BoM Distilled - 1,35 µS/cm
MBM Distilled - < 5,0 µS/cm
UME Distilled Tanaka Formula 0,70 S/cm
All laboratories used water according to the specifications, < 5,0 µS/cm.
5.2. Used equipment
5.2.1. Mass standards
Information about the used type of mass standards during 500 mL flask measurement is given in table 5.
Table 5 – Mass standards characteristics for 500 mL flask
NMI Type Density (g/mL)
DMDM E2 7,95
INM stainless steel 8,00
EURAMET Project no. 1297
KCDB: EURAMET.M.FF.S8
Comparison of a 50 mL pycnometer and a 500 mL flask Final report
9 /37
MKEH Kern, E2 7,8606
ČMI 1 E2 7,97
ČMI 2 E2 7,97
VSL F2 8
GUM Steel 8,0 BEV E2 8 IPQ E2 8
FORCE F1 8,000
INRIM Mettler Class E2 8
CEM Class F1, Stainless steel 7,960
MIRS OIML R111 E2 7,95
DPM E2; Haigis 500 g 7,95
BoM F1 class (weights from 1 mg to 500 g)
7,950000
MBM E2 class 7,95 UME Hafner/ E1 Class 7,996 – 8,0127
Information about the used type of mass standards during 50 mL pycnometer measurement is given in table 6.
Table 6 – Mass standards characteristics for 50 mL pycnometer
NMI Type Density (g/mL)
pycnometer, s.n. 2
DMDM E2 7,95
INM Stainless steel 8,00
MKEH Kern, E2 7,8691
ČMI 2 E2 7,97
VSL E2 8
GUM Steel 8,0
BEV E2 8,000
IPQ E2 8
FORCE F1 8,000
INRIM Mettler Class E2 8
CEM Class F1, Stainless steel 7,960
pycnometer, s.n. 34
MIRS OIML R111 E2 7,95
DPM E2; Haigis 50 gr 7,95
BoM F1 class (weights from 1
mg to 500 g) 7,950000
MBM E2 class 7,95
UME Hafner/ E1 Class 7,996 – 8,0127
DMDM E2 7,95
EURAMET Project no. 1297
KCDB: EURAMET.M.FF.S8
Comparison of a 50 mL pycnometer and a 500 mL flask Final report
10 /37
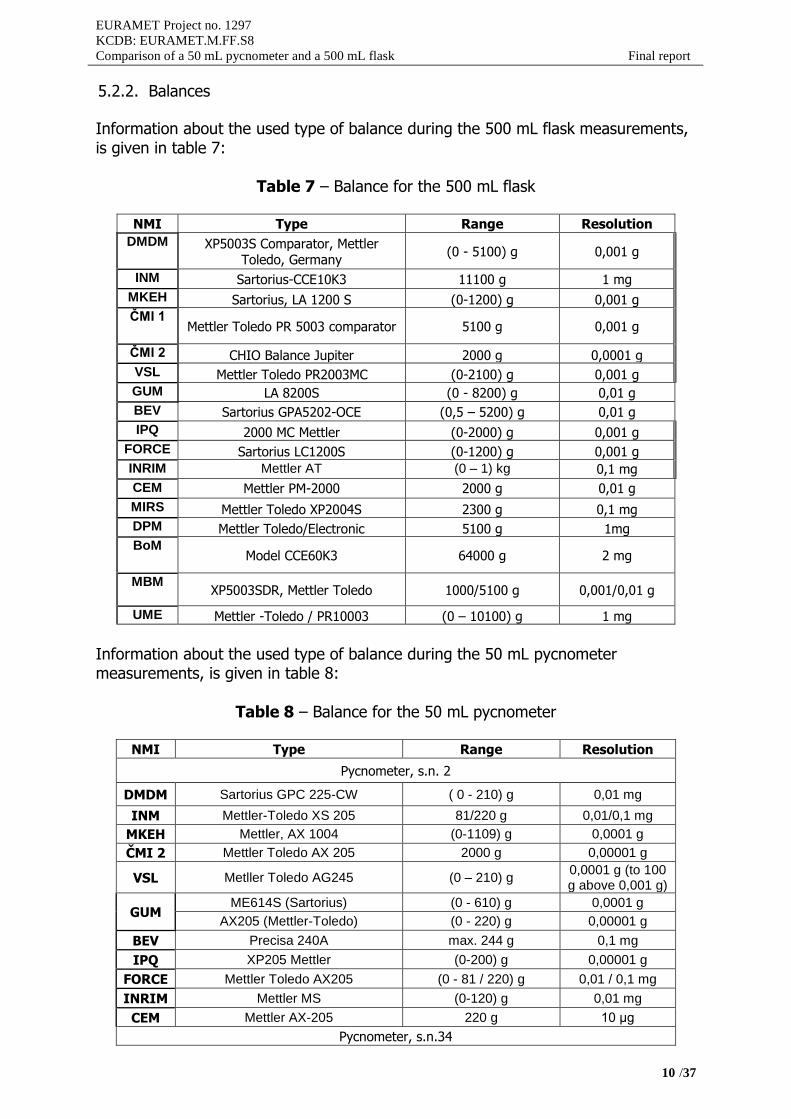
5.2.2. Balances
Information about the used type of balance during the 500 mL flask measurements, is given in table 7:
Table 7 – Balance for the 500 mL flask
NMI Type Range Resolution
DMDM XP5003S Comparator, Mettler Toledo, Germany
(0 - 5100) g 0,001 g
INM Sartorius-CCE10K3 11100 g 1 mg
MKEH Sartorius, LA 1200 S (0-1200) g 0,001 g
ČMI 1 Mettler Toledo PR 5003 comparator 5100 g 0,001 g
ČMI 2 CHIO Balance Jupiter 2000 g 0,0001 g
VSL Mettler Toledo PR2003MC (0-2100) g 0,001 g
GUM LA 8200S (0 - 8200) g 0,01 g
BEV Sartorius GPA5202-OCE (0,5 – 5200) g 0,01 g
IPQ 2000 MC Mettler (0-2000) g 0,001 g
FORCE Sartorius LC1200S (0-1200) g 0,001 g
INRIM Mettler AT (0 – 1) kg 0,1 mg
CEM Mettler PM-2000 2000 g 0,01 g
MIRS Mettler Toledo XP2004S 2300 g 0,1 mg
DPM Mettler Toledo/Electronic 5100 g 1mg
BoM Model CCE60K3 64000 g 2 mg
MBM XP5003SDR, Mettler Toledo 1000/5100 g 0,001/0,01 g
UME Mettler -Toledo / PR10003 (0 – 10100) g 1 mg
Information about the used type of balance during the 50 mL pycnometer measurements, is given in table 8:
Table 8 – Balance for the 50 mL pycnometer
NMI Type Range Resolution
Pycnometer, s.n. 2
DMDM Sartorius GPC 225-CW ( 0 - 210) g 0,01 mg
INM Mettler-Toledo XS 205 81/220 g 0,01/0,1 mg
MKEH Mettler, AX 1004 (0-1109) g 0,0001 g
ČMI 2 Mettler Toledo AX 205 2000 g 0,00001 g
VSL Metller Toledo AG245 (0 – 210) g 0,0001 g (to 100 g above 0,001 g)
GUM ME614S (Sartorius) (0 - 610) g 0,0001 g
AX205 (Mettler-Toledo) (0 - 220) g 0,00001 g
BEV Precisa 240A max. 244 g 0,1 mg
IPQ XP205 Mettler (0-200) g 0,00001 g
FORCE Mettler Toledo AX205 (0 - 81 / 220) g 0,01 / 0,1 mg
INRIM Mettler MS (0-120) g 0,01 mg
CEM Mettler AX-205 220 g 10 μg
Pycnometer, s.n.34
EURAMET Project no. 1297
KCDB: EURAMET.M.FF.S8
Comparison of a 50 mL pycnometer and a 500 mL flask Final report
11 /37
MIRS Sartorius MC 210 S 210 g 0,01 mg
DPM Mettler Toledo/Electronic 520 g 0,1 mg
BoM ME235 230g 0,01mg
MBM XP5003SDR, Mettler Toledo 1000/5100 g 0,001/0,01 g
UME Sartorius AG / ME 235 S (0 - 230) g 0,01 mg
DMDM Sartorius GPC 225-CW ( 0 - 210) g 0,01 mg
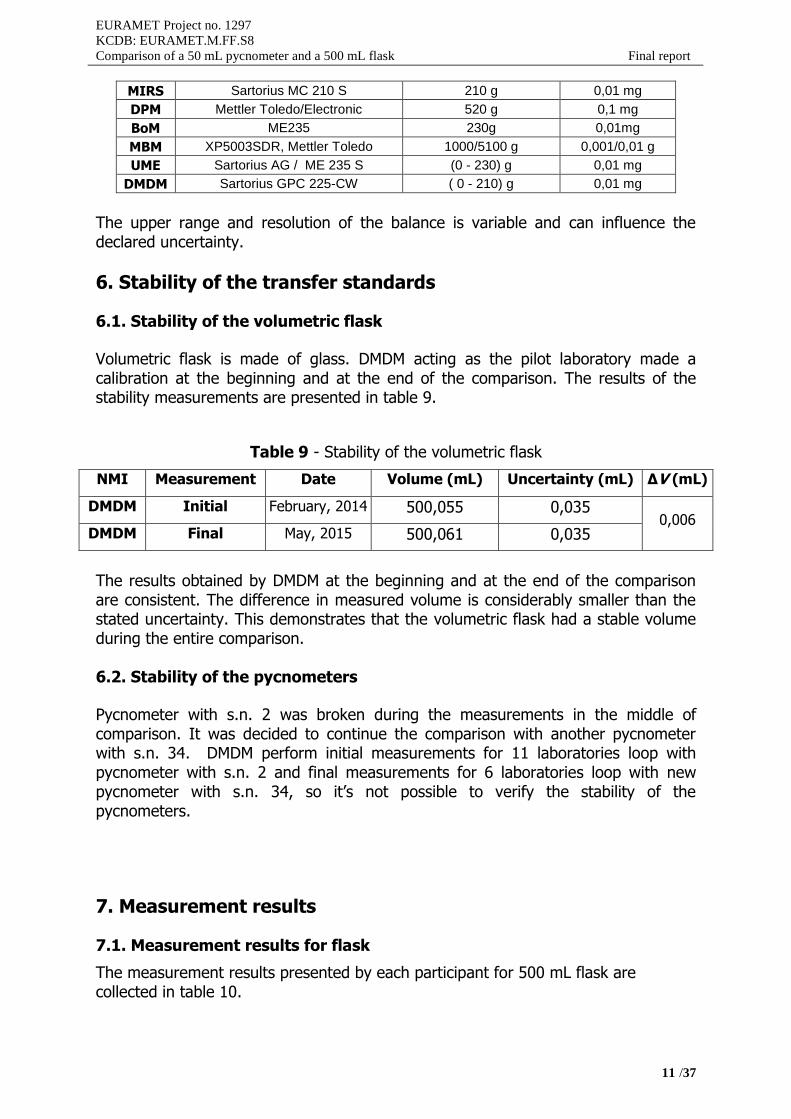
The upper range and resolution of the balance is variable and can influence the declared uncertainty.
6. Stability of the transfer standards
6.1. Stability of the volumetric flask
Volumetric flask is made of glass. DMDM acting as the pilot laboratory made a calibration at the beginning and at the end of the comparison. The results of the stability measurements are presented in table 9.
Table 9 - Stability of the volumetric flask
NMI Measurement Date Volume (mL) Uncertainty (mL) ΔV (mL)
DMDM Initial February, 2014 500,055 0,035 0,006
DMDM Final May, 2015 500,061 0,035
The results obtained by DMDM at the beginning and at the end of the comparison are consistent. The difference in measured volume is considerably smaller than the stated uncertainty. This demonstrates that the volumetric flask had a stable volume during the entire comparison.
6.2. Stability of the pycnometers
Pycnometer with s.n. 2 was broken during the measurements in the middle of comparison. It was decided to continue the comparison with another pycnometer with s.n. 34. DMDM perform initial measurements for 11 laboratories loop with pycnometer with s.n. 2 and final measurements for 6 laboratories loop with new pycnometer with s.n. 34, so it’s not possible to verify the stability of the pycnometers.
7. Measurement results
7.1. Measurement results for flask
The measurement results presented by each participant for 500 mL flask are collected in table 10.
EURAMET Project no. 1297
KCDB: EURAMET.M.FF.S8
Comparison of a 50 mL pycnometer and a 500 mL flask Final report
12 /37
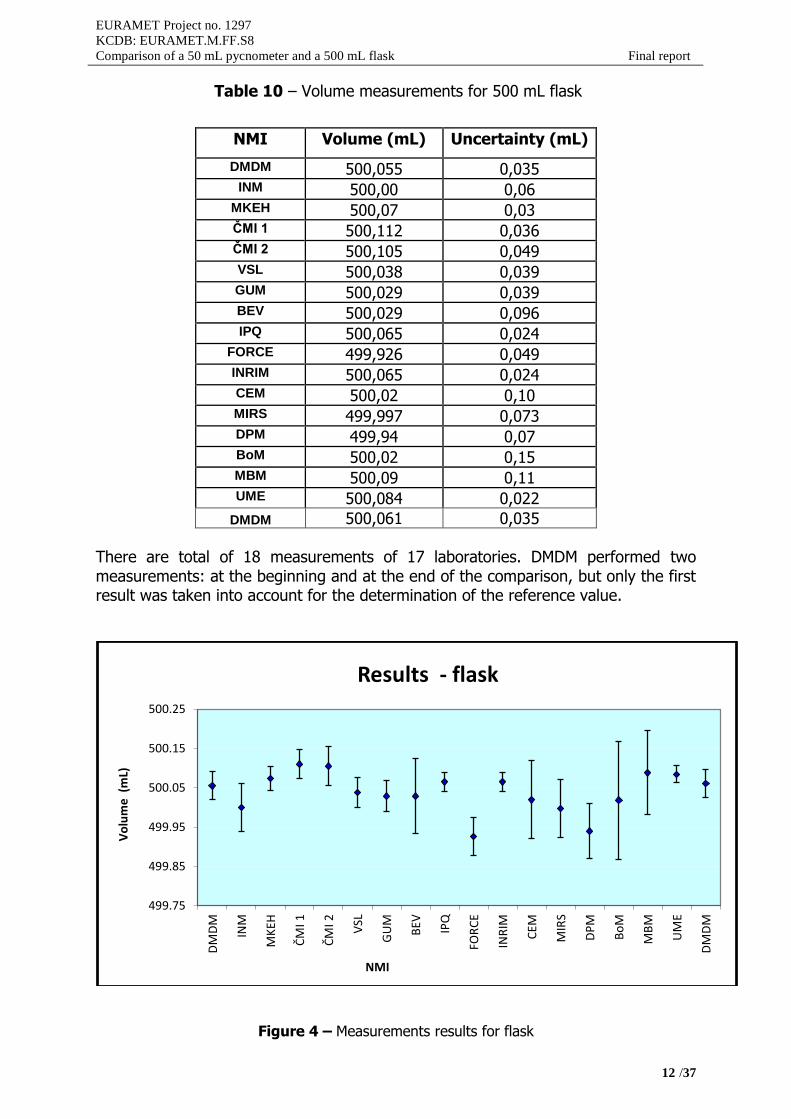
Table 10 – Volume measurements for 500 mL flask
NMI Volume (mL) Uncertainty (mL)
DMDM 500,055 0,035 INM 500,00 0,06
MKEH 500,07 0,03 ČMI 1 500,112 0,036 ČMI 2 500,105 0,049 VSL 500,038 0,039 GUM 500,029 0,039 BEV 500,029 0,096 IPQ 500,065 0,024
FORCE 499,926 0,049 INRIM 500,065 0,024 CEM 500,02 0,10 MIRS 499,997 0,073 DPM 499,94 0,07 BoM 500,02 0,15 MBM 500,09 0,11 UME 500,084 0,022
DMDM 500,061 0,035
There are total of 18 measurements of 17 laboratories. DMDM performed two measurements: at the beginning and at the end of the comparison, but only the first result was taken into account for the determination of the reference value.
Figure 4 – Measurements results for flask
499.75
499.85
499.95
500.05
500.15
500.25
DM
DM
INM
MK
EH
ČM
I 1
ČM
I 2 VSL
GU
M
BEV IPQ
FOR
CE
INR
IM
CEM
MIR
S
DP
M
Bo
M
MB
M
UM
E
DM
DM
Vo
lum
e (
mL)
NMI
Results - flask
EURAMET Project no. 1297
KCDB: EURAMET.M.FF.S8
Comparison of a 50 mL pycnometer and a 500 mL flask Final report
13 /37
7.2. Measurement results for pycnometer with s.n. 2
The measurement results presented by each participant for 50 mL pycnometer with s.n. 2 are collected in table 11.
Table 11 – Volume measurements for 50 mL pycnometer with s.n. 2
NMI Volume (mL) Uncertainty
(mL)
Pycnometer, s.n. 2
DMDM 51,331 0,003
INM 51,326 0,006
MKEH 51,332 0,002
ČMI 2 51,3274 0,0033
VSL 51,3330 0,0021
GUM 51,3315 0,0010
BEV 51,3316 0,0038
IPQ 51,3305 0,0008
FORCE 51,3299 0,0024
INRIM 51,3308 0,0008
CEM 51,3308 0,0050
There are total of 11 measurements from 11 laboratories.
Figure 5 – Measurement results for pycnometer, s.n. 2
51.32
51.32
51.33
51.33
51.34
51.34
51.35
DM
DM
INM
MK
EH
ČM
I 2 VSL
GU
M
BEV IPQ
FOR
CE
INR
IM
CEM
Vo
lum
e (
mL)
NMI
Results - pycnometer, s.n. 2
EURAMET Project no. 1297
KCDB: EURAMET.M.FF.S8
Comparison of a 50 mL pycnometer and a 500 mL flask Final report
14 /37
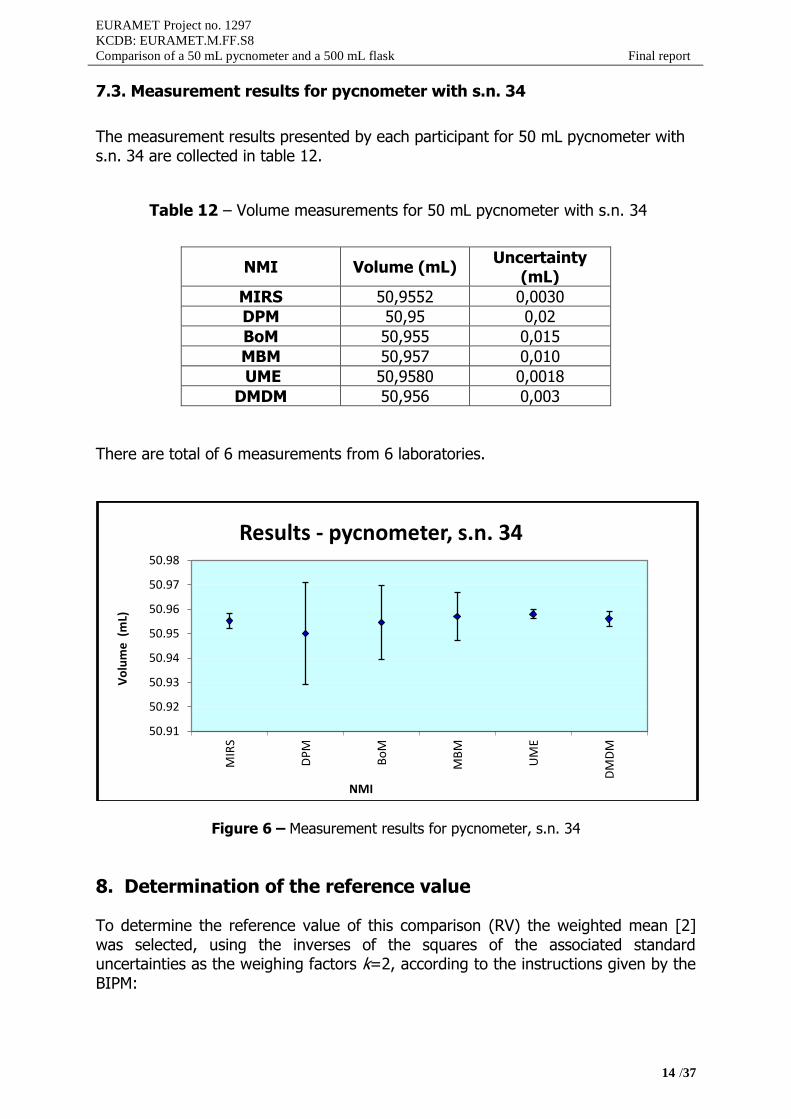
7.3. Measurement results for pycnometer with s.n. 34
The measurement results presented by each participant for 50 mL pycnometer with s.n. 34 are collected in table 12.
Table 12 – Volume measurements for 50 mL pycnometer with s.n. 34
NMI Volume (mL) Uncertainty
(mL)
MIRS 50,9552 0,0030
DPM 50,95 0,02
BoM 50,955 0,015
MBM 50,957 0,010
UME 50,9580 0,0018
DMDM 50,956 0,003
There are total of 6 measurements from 6 laboratories.
Figure 6 – Measurement results for pycnometer, s.n. 34
8. Determination of the reference value
To determine the reference value of this comparison (RV) the weighted mean [2] was selected, using the inverses of the squares of the associated standard uncertainties as the weighing factors k=2, according to the instructions given by the BIPM:
50.91
50.92
50.93
50.94
50.95
50.96
50.97
50.98
MIR
S
DP
M
Bo
M
MB
M
UM
E
DM
DM
Vo
lum
e (
mL)
NMI
Results - pycnometer, s.n. 34
EURAMET Project no. 1297
KCDB: EURAMET.M.FF.S8
Comparison of a 50 mL pycnometer and a 500 mL flask Final report
15 /37
)x(u/....)x(u/
)x(ux...)x(uxy
n
nn
2
1
2
2
1
2
1
11
(2)
To calculate the standard deviation u(y) associated with the volume y , equation (3) was used:
)x(u/...)x(u/)y(u
n
2
1
2 11
1
(3)
The expanded uncertainty of the reference value is U(y) = 2 × u(y).
To identify an overall consistency of the results a chi-square test can be applied to all n calibration results.
)x(u
)yx(...
)x(u
)yx(χ
n
nobs 2
2
1
2
2
12
(4)
where the degrees of freedom are: = n -1
The set of results is inconsistent when: 05,0)(Pr 22 obs . The function
CHIINV(0,05; n-1) in MS Excel was used. The set of results is rejected when CHIINV(0,05; n-1) < χ2
obs.
If the consistency check has a positive result then y is accepted as the RV xref and U(xref) is accepted as the expanded uncertainty of the RV. If the set of results appears to be inconsistent then the laboratory with the highest
value of )(
)(
2
2
i
i
xu
yx is excluded from the next round of evaluation and the new
reference value, reference standard uncertainty and observed chi-squared value is calculated again without the excluded laboratory. When the set or results passes the consistency check, the degree of equivalence di between each laboratory result xi and the RV (xref) is calculated using the following formulas:
di = xi - xj (5)
U(di) = 2 × u(di) (6)
where u(di) is calculated from
u 2(di) = u 2(xi) – u 2(xj) (7)
Discrepant values can be identified when |𝑑𝑖| > 2𝑢(𝑑𝑖),
To calculate the degrees of equivalence dij between the laboratories the following formulas are used: di,j= xi - xj (8)
U(di,j) = 2 × u(di,j) (9)
Where u(di,j) is calculated from
u 2(di,j) = u 2(xi) + u 2(xj) (10)
EURAMET Project no. 1297
KCDB: EURAMET.M.FF.S8
Comparison of a 50 mL pycnometer and a 500 mL flask Final report
16 /37
The factor 2 in equation (6 and 9) corresponds to a 95% coverage interval under the assumption of normal distribution of the results.
Also 𝐸𝑖 =|𝑥𝑖−𝑥𝑟𝑒𝑓|
2∗√𝑢2(𝑥𝑖)−𝑢2(𝑥𝑟𝑒𝑓) <1. (11)
9. Results with reference value and RV uncertainty
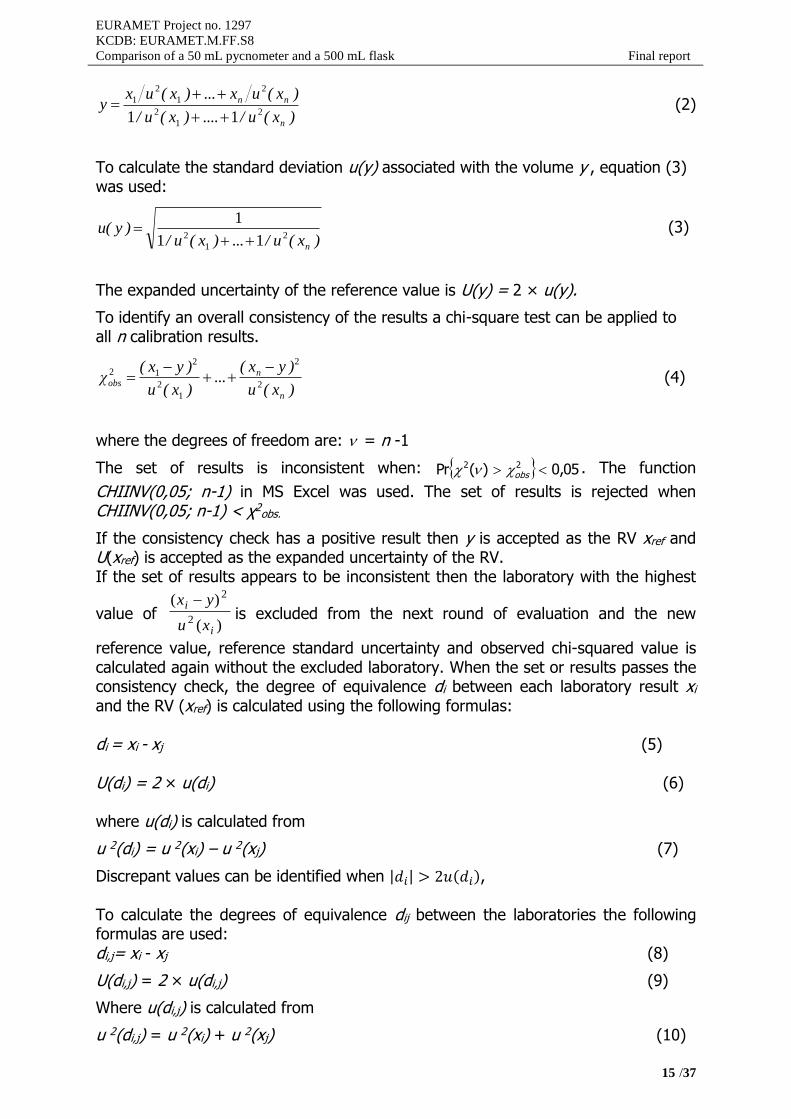
9.1. Results with reference value and RV uncertainty for flask
The obtained reference value is 500,059 mL. The expanded uncertainty U = 2 × u(y) of the reference value is: 0,009 mL.
The calculated value = 26,30 is smaller thanobs = 71,39, the observed value, this means that the chi-square test failed and the results are not consistent. Laboratories ČMI 2, FORCE, DPM and UME with an Ei number larger than 1 and di larger than Udi, have been excluded from the reference value determination in following order FORCE, DPM, ČMI 1 and UME, one after another, taking care about their Ei values and results of chi-square test. The obtained reference value is 500,057 mL. The expanded uncertainty U = 2 × u(y) of the reference value is: 0,011 mL.
The calculated value = 21,03is larger thanobs = 16,88, the observed value,
therefore the set of results is now consistent from a statistical point of view and the reference value is accepted.
All the measurement results, the reference value and its uncertainty are presented in the following figure 7:
Figure 7 – Reference value and uncertainty
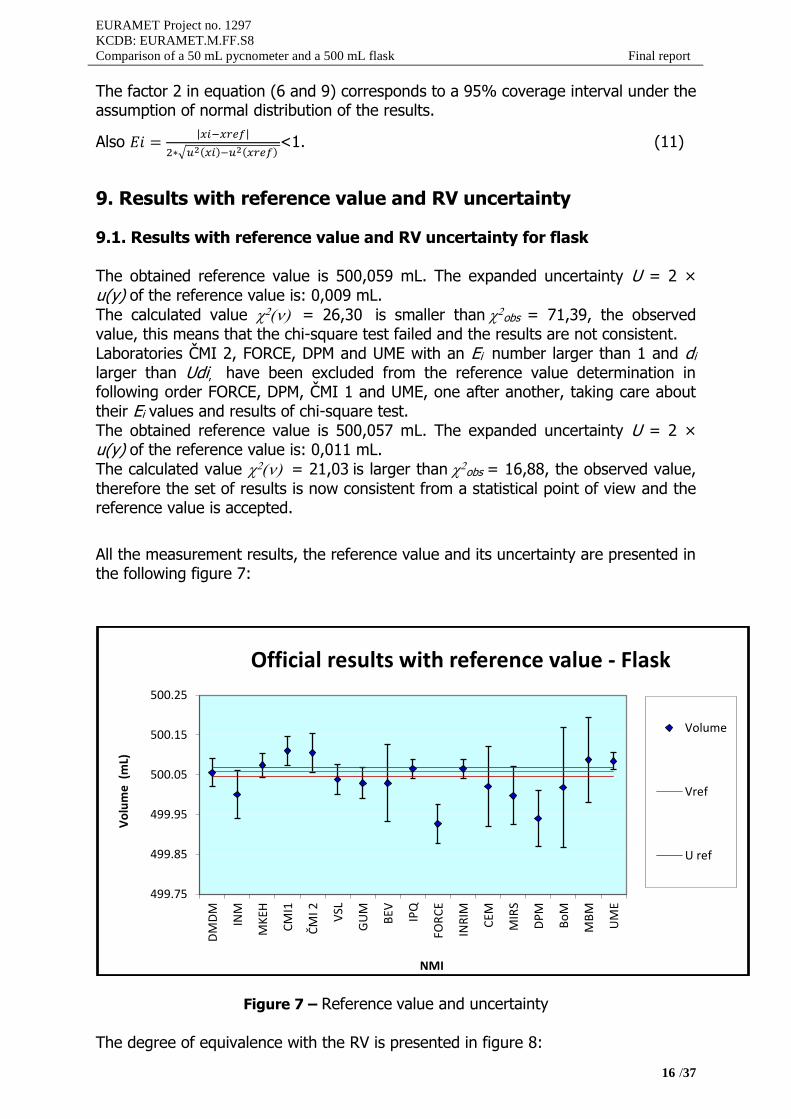
The degree of equivalence with the RV is presented in figure 8:
499.75
499.85
499.95
500.05
500.15
500.25
DM
DM
INM
MK
EH
CM
I1
ČM
I 2 VSL
GU
M
BEV IPQ
FOR
CE
INR
IM
CEM
MIR
S
DP
M
Bo
M
MB
M
UM
E
Vo
lum
e (
mL)
NMI
Official results with reference value - Flask
Volume
Vref
U ref
EURAMET Project no. 1297
KCDB: EURAMET.M.FF.S8
Comparison of a 50 mL pycnometer and a 500 mL flask Final report
17 /37
Figure 8 - Degree of equivalence with reference value for flask
Table 13 – Degree of equivalence with RV
Laboratory di
(mL)
U(di)
(mL)
Ei Info
DMDM 0,00 0,03 - 0,06INM - 0,06 0,06 - 0,97
MKEH 0,02 0,03 0,61 ČMI 1 0,05 0,03 1,55 Excluded ČMI 2 0,05 0,05 1,00 VSL - 0,02 0,04 - 0,52GUM - 0,03 0,04 - 0,75BEV - 0,03 0,10 - 0,30IPQ 0,01 0,02 0,37
FORCE - 0,13 0,05 - 2,76 Excluded INRIM 0,01 0,02 0,38 CEM - 0,04 0,10 - 0,37MIRS - 0,06 0,07 - 0,83DPM - 0,12 0,07 - 1,70 Excluded BoM - 0,04 0,15 - 0,26MBM 0,03 0,11 0,29 UME 0,03 0,02 1,42 Excluded
The results of the degree of equivalence between all the laboratories can be found in Annex 2.1.
-0.2
-0.1
0.0
0.1
0.2
DM
DM
INM
MK
EH
CM
I1
ČM
I 2
VS
L
GU
M
BE
V
IPQ
FO
RC
E
INR
IM
CE
M
MIR
S
DP
M
Bo
M
MB
M
UM
E
di/
mL
NMI
Degree of equivalence with RV - Flask
EURAMET Project no. 1297
KCDB: EURAMET.M.FF.S8
Comparison of a 50 mL pycnometer and a 500 mL flask Final report
18 /37
9.2. Results with reference value and RV uncertainty for pycnometer with s.n. 2
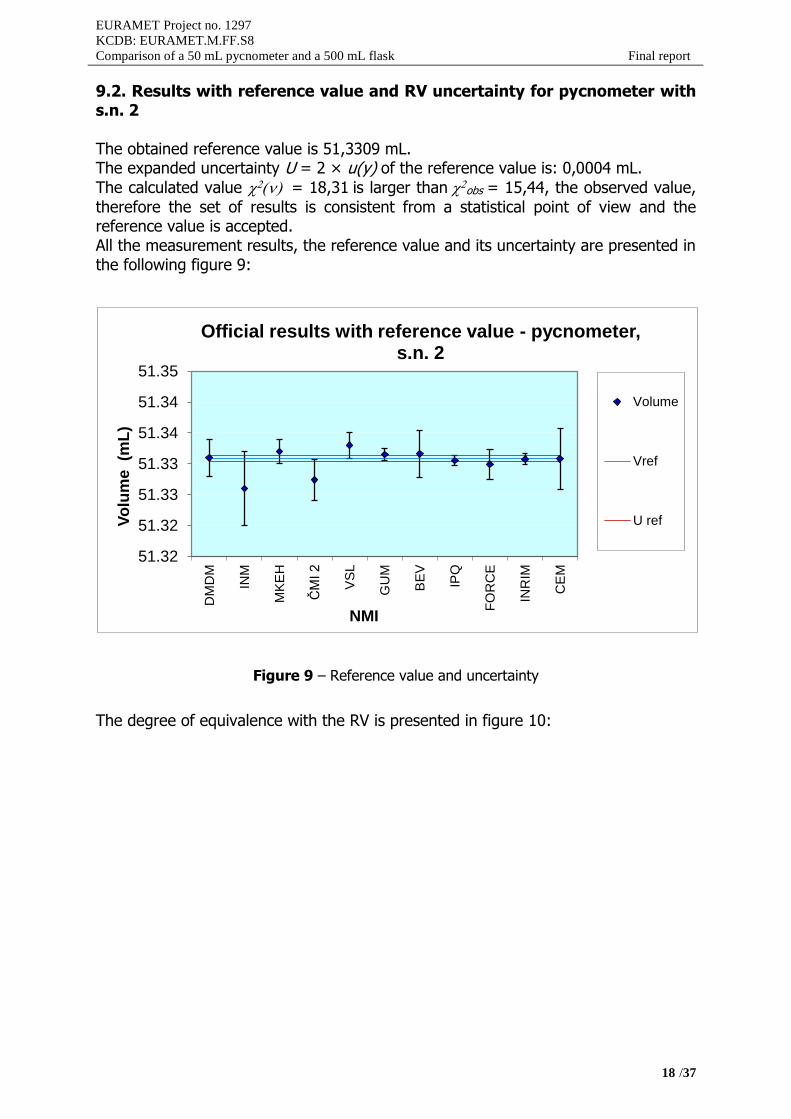
The obtained reference value is 51,3309 mL. The expanded uncertainty U = 2 × u(y) of the reference value is: 0,0004 mL.
The calculated value = 18,31is larger thanobs = 15,44, the observed value,
therefore the set of results is consistent from a statistical point of view and the reference value is accepted. All the measurement results, the reference value and its uncertainty are presented in the following figure 9:
Figure 9 – Reference value and uncertainty
The degree of equivalence with the RV is presented in figure 10:
51.32
51.32
51.33
51.33
51.34
51.34
51.35
DM
DM
INM
MK
EH
ČM
I 2
VS
L
GU
M
BE
V
IPQ
FO
RC
E
INR
IM
CE
M
Vo
lum
e (m
L)
NMI
Official results with reference value - pycnometer, s.n. 2
Volume
Vref
U ref
EURAMET Project no. 1297
KCDB: EURAMET.M.FF.S8
Comparison of a 50 mL pycnometer and a 500 mL flask Final report
19 /37
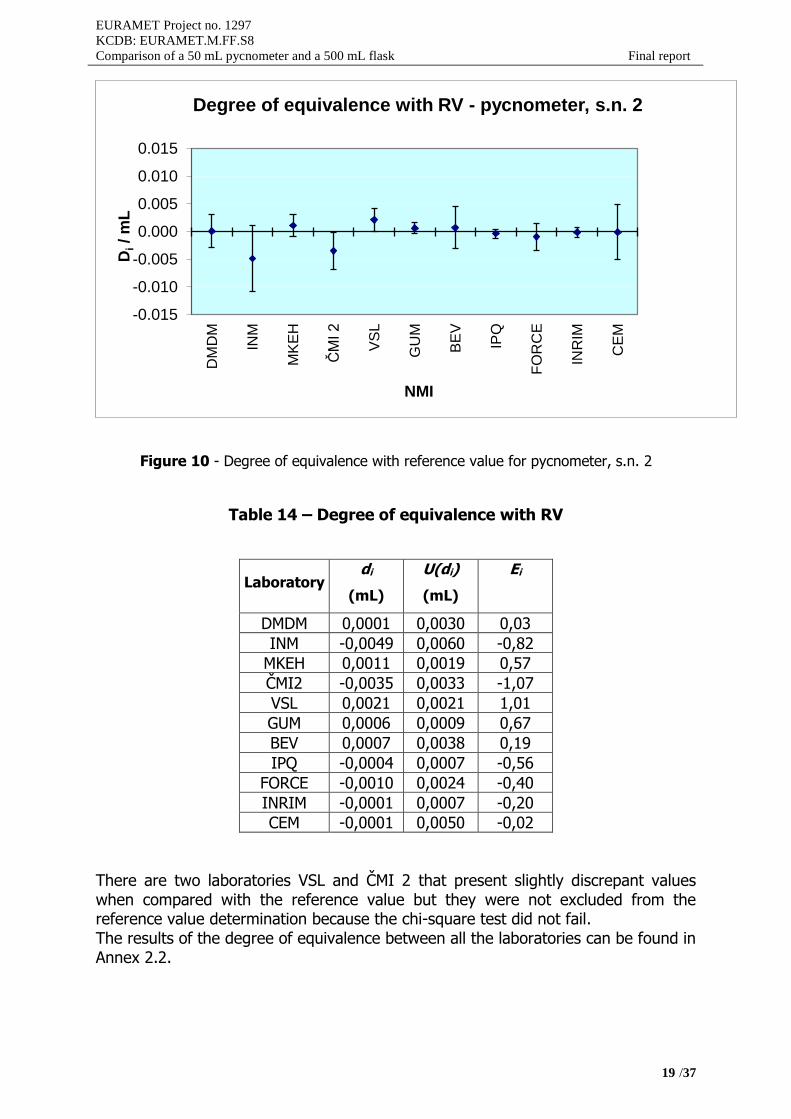
Figure 10 - Degree of equivalence with reference value for pycnometer, s.n. 2
Table 14 – Degree of equivalence with RV
Laboratory di
(mL)
U(di)
(mL)
Ei
DMDM 0,0001 0,0030 0,03
INM -0,0049 0,0060 -0,82
MKEH 0,0011 0,0019 0,57
ČMI2 -0,0035 0,0033 -1,07
VSL 0,0021 0,0021 1,01
GUM 0,0006 0,0009 0,67
BEV 0,0007 0,0038 0,19
IPQ -0,0004 0,0007 -0,56
FORCE -0,0010 0,0024 -0,40
INRIM -0,0001 0,0007 -0,20
CEM -0,0001 0,0050 -0,02
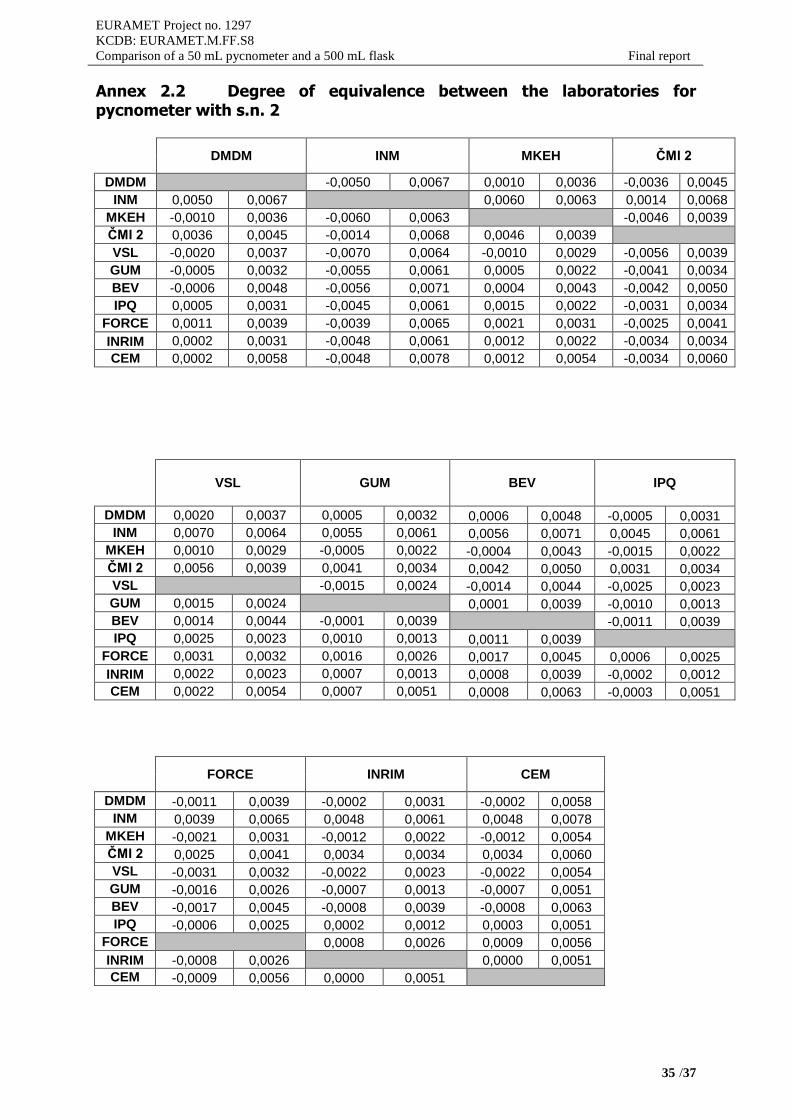
There are two laboratories VSL and ČMI 2 that present slightly discrepant values when compared with the reference value but they were not excluded from the reference value determination because the chi-square test did not fail. The results of the degree of equivalence between all the laboratories can be found in Annex 2.2.
-0.015
-0.010
-0.005
0.000
0.005
0.010
0.015
DM
DM
INM
MK
EH
ČM
I 2
VS
L
GU
M
BE
V
IPQ
FO
RC
E
INR
IM
CE
M
Di/
mL
NMI
Degree of equivalence with RV - pycnometer, s.n. 2
EURAMET Project no. 1297
KCDB: EURAMET.M.FF.S8
Comparison of a 50 mL pycnometer and a 500 mL flask Final report
20 /37
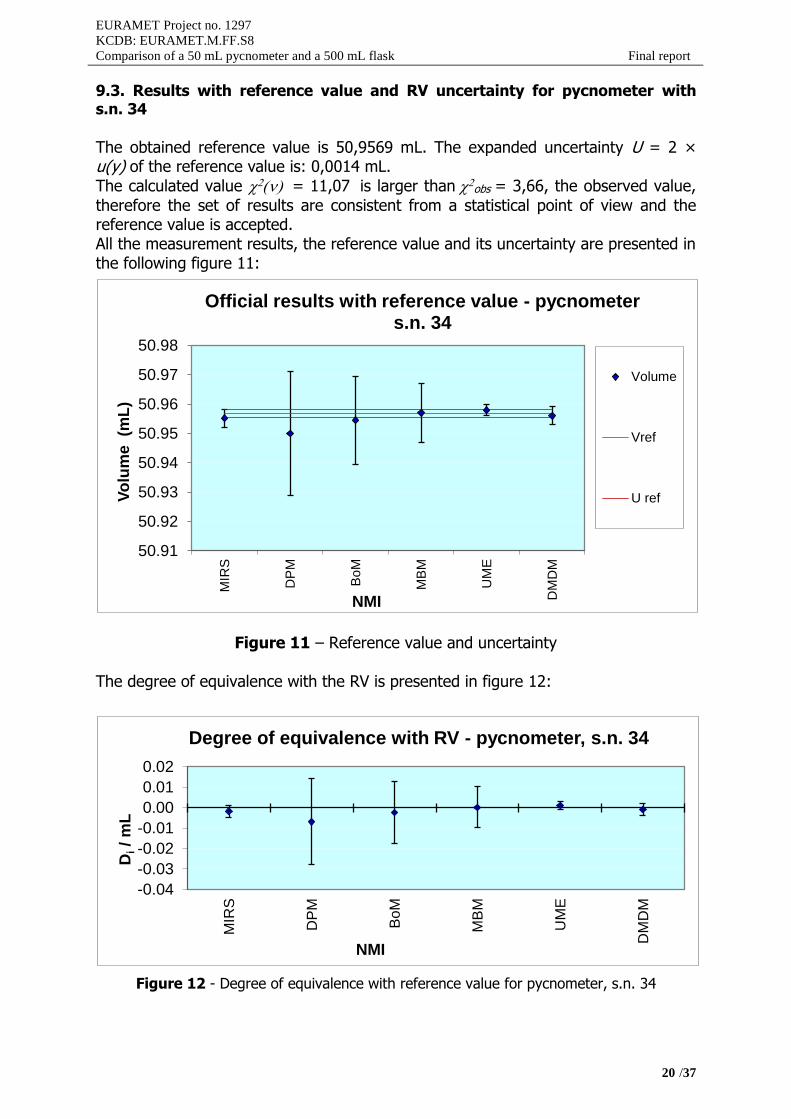
9.3. Results with reference value and RV uncertainty for pycnometer with s.n. 34
The obtained reference value is 50,9569 mL. The expanded uncertainty U = 2 × u(y) of the reference value is: 0,0014 mL.
The calculated value = 11,07 is larger thanobs = 3,66, the observed value,
therefore the set of results are consistent from a statistical point of view and the reference value is accepted. All the measurement results, the reference value and its uncertainty are presented in the following figure 11:
Figure 11 – Reference value and uncertainty
The degree of equivalence with the RV is presented in figure 12:
Figure 12 - Degree of equivalence with reference value for pycnometer, s.n. 34
50.91
50.92
50.93
50.94
50.95
50.96
50.97
50.98
MIR
S
DP
M
BoM
MB
M
UM
E
DM
DM
Vo
lum
e (m
L)
NMI
Official results with reference value - pycnometer s.n. 34
Volume
Vref
U ref
-0.04
-0.03
-0.02
-0.01
0.00
0.01
0.02
MIR
S
DP
M
Bo
M
MB
M
UM
E
DM
DM
Di/
mL
NMI
Degree of equivalence with RV - pycnometer, s.n. 34
EURAMET Project no. 1297
KCDB: EURAMET.M.FF.S8
Comparison of a 50 mL pycnometer and a 500 mL flask Final report
21 /37
Table 15 – Degree of equivalence with RV
Laboratory di
(mL)
U(di)
(mL)
Ei
MIRS - 0,002 0,003 - 0,65
DPM - 0,007 0,021 - 0,33
BoM - 0,002 0,015 - 0,16
MBM 0,000 0,010 0,01
UME 0,001 0,001 0,89
DMDM - 0,001 0,003 - 0,35
All the laboratories present consistent values when compared with the reference value and Ei number smaller than 1. The results of the degree of equivalence between all the laboratories can be found in Annex 2.3.
10. Uncertainty presentation
It was requested that all participants present there uncertainty calculations based on the GUM [3].
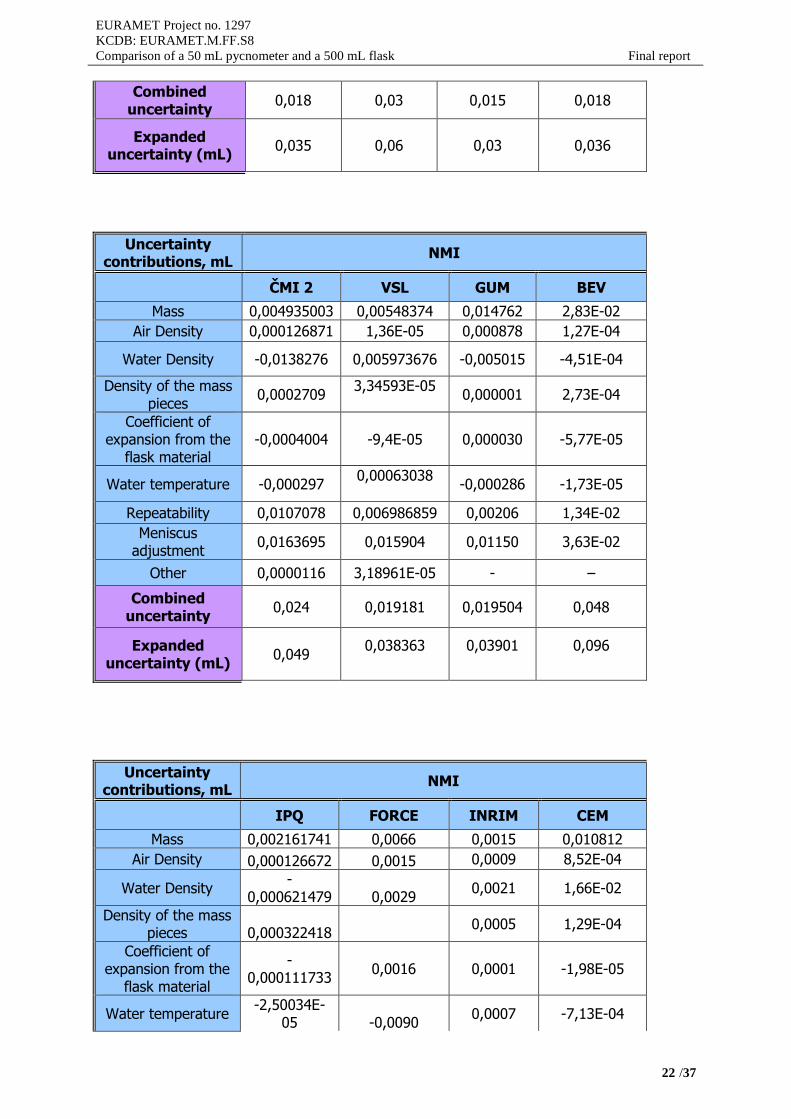
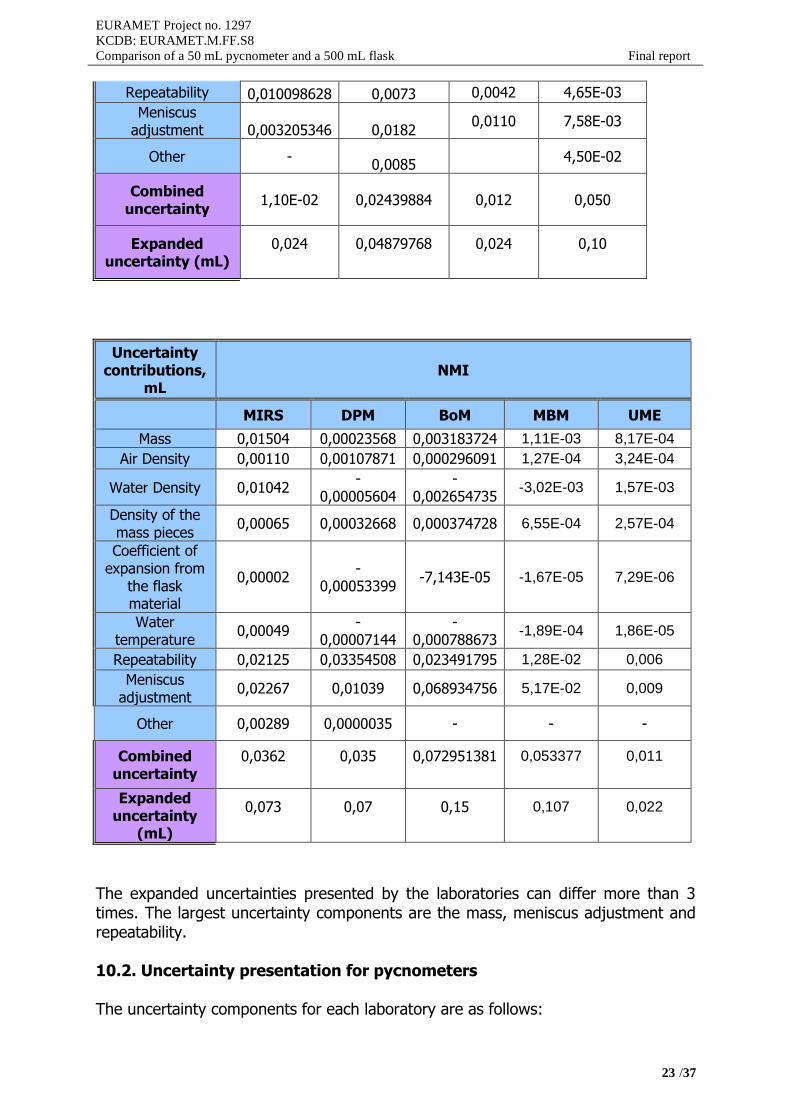
10.1. Uncertainty presentation for flask
The uncertainty components for each laboratory are as follows:
Table 16 – Uncertainty components
Uncertainty contributions, mL
NMI
DMDM INM MKEH ČMI 1
Mass 0,0004 4,275 x 10-3 0,001773 0,001761498
Air Density 0,0001 1,27 x 10⁻⁴ 0,000876157 0,000126582
Water Density -0,0004 5,09 x 10⁻³ 0,001254264 -0,004483449
Density of the mass pieces
0,0008 7,94 x 10⁻⁴ 0,000002454 0,000561
Coefficient of expansion from the
flask material -0,0003 1,79 x 10⁻⁴ 0,001336678 -0,00013442
Water temperature -0,0004 7,83 x 10⁻⁴ 0,000024751 -0,000099
Repeatability 0,0115 0,014654 0,012832 0,00489
Meniscus adjustment 0,0132 0,025521 0,0075 0,0163695
Other - - - 0,0000116
EURAMET Project no. 1297
KCDB: EURAMET.M.FF.S8
Comparison of a 50 mL pycnometer and a 500 mL flask Final report
22 /37
Combined uncertainty
0,018 0,03 0,015 0,018
Expanded uncertainty (mL)
0,035 0,06 0,03 0,036
Uncertainty contributions, mL
NMI
ČMI 2 VSL GUM BEV
Mass 0,004935003 0,00548374 0,014762 2,83E-02
Air Density 0,000126871 1,36E-05 0,000878 1,27E-04
Water Density -0,0138276 0,005973676 -0,005015 -4,51E-04
Density of the mass pieces
0,0002709 3,34593E-05
0,000001 2,73E-04
Coefficient of expansion from the
flask material -0,0004004 -9,4E-05 0,000030 -5,77E-05
Water temperature -0,0002970,00063038
-0,000286 -1,73E-05
Repeatability 0,0107078 0,006986859 0,00206 1,34E-02
Meniscus adjustment
0,0163695 0,015904 0,01150 3,63E-02
Other 0,0000116 3,18961E-05 - –
Combined uncertainty
0,024 0,019181 0,019504 0,048
Expanded uncertainty (mL)
0,049 0,038363 0,03901 0,096
Uncertainty contributions, mL
NMI
IPQ FORCE INRIM CEM
Mass 0,002161741 0,0066 0,0015 0,010812
Air Density 0,000126672 0,0015 0,0009 8,52E-04
Water Density -
0,000621479 0,0029 0,0021 1,66E-02
Density of the mass pieces 0,000322418
0,0005 1,29E-04
Coefficient of expansion from the
flask material
-0,000111733
0,0016 0,0001 -1,98E-05
Water temperature -2,50034E-
05 -0,00900,0007 -7,13E-04
EURAMET Project no. 1297
KCDB: EURAMET.M.FF.S8
Comparison of a 50 mL pycnometer and a 500 mL flask Final report
23 /37
Repeatability 0,010098628 0,0073 0,0042 4,65E-03
Meniscus adjustment 0,003205346 0,0182
0,0110 7,58E-03
Other - 0,0085
4,50E-02
Combined uncertainty
1,10E-02 0,02439884 0,012 0,050
Expanded uncertainty (mL)
0,024 0,04879768 0,024 0,10
Uncertainty contributions,
mL NMI
MIRS DPM BoM MBM UME
Mass 0,01504 0,00023568 0,003183724 1,11E-03 8,17E-04
Air Density 0,00110 0,00107871 0,000296091 1,27E-04 3,24E-04
Water Density 0,01042 -
0,00005604 -
0,002654735 -3,02E-03 1,57E-03
Density of the mass pieces
0,00065 0,00032668 0,000374728 6,55E-04 2,57E-04
Coefficient of expansion from
the flask material
0,00002 -
0,00053399 -7,143E-05 -1,67E-05 7,29E-06
Water temperature
0,00049 -
0,00007144 -
0,000788673 -1,89E-04 1,86E-05
Repeatability 0,02125 0,03354508 0,023491795 1,28E-02 0,006
Meniscus adjustment
0,02267 0,01039 0,068934756 5,17E-02 0,009
Other 0,00289 0,0000035 - - -
Combined uncertainty
0,0362 0,035 0,072951381 0,053377 0,011
Expanded uncertainty
(mL)
0,073 0,07 0,15 0,107 0,022
The expanded uncertainties presented by the laboratories can differ more than 3 times. The largest uncertainty components are the mass, meniscus adjustment and repeatability.
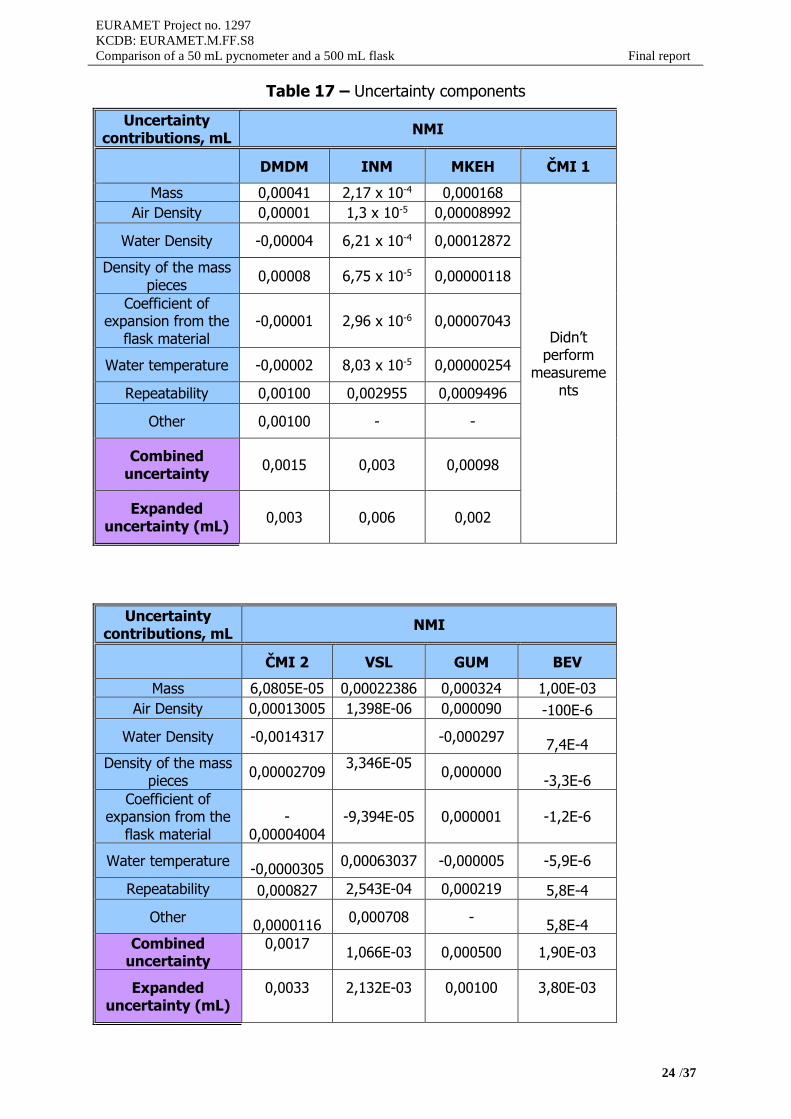
10.2. Uncertainty presentation for pycnometers
The uncertainty components for each laboratory are as follows:
EURAMET Project no. 1297
KCDB: EURAMET.M.FF.S8
Comparison of a 50 mL pycnometer and a 500 mL flask Final report
24 /37
Table 17 – Uncertainty components
Uncertainty contributions, mL
NMI
DMDM INM MKEH ČMI 1
Mass 0,00041 2,17 x 10⁻⁴ 0,000168
Didn’t perform
measurements
Air Density 0,00001 1,3 x 10⁻⁵ 0,00008992
Water Density -0,00004 6,21 x 10⁻⁴ 0,00012872
Density of the mass pieces
0,00008 6,75 x 10⁻⁵ 0,00000118
Coefficient of expansion from the
flask material -0,00001 2,96 x 10⁻⁶ 0,00007043
Water temperature -0,00002 8,03 x 10⁻⁵ 0,00000254
Repeatability 0,00100 0,002955 0,0009496
Other 0,00100 - -
Combined uncertainty
0,0015 0,003 0,00098
Expanded uncertainty (mL)
0,003 0,006 0,002
Uncertainty contributions, mL
NMI
ČMI 2 VSL GUM BEV
Mass 6,0805E-05 0,00022386 0,000324 1,00E-03
Air Density 0,00013005 1,398E-06 0,000090 -100E-6
Water Density -0,0014317 -0,0002977,4E-4
Density of the mass pieces
0,00002709 3,346E-05
0,000000 -3,3E-6
Coefficient of expansion from the
flask material -
0,00004004 -9,394E-05 0,000001 -1,2E-6
Water temperature -0,0000305
0,00063037 -0,000005 -5,9E-6
Repeatability 0,000827 2,543E-04 0,000219 5,8E-4
Other 0,0000116
0,000708 - 5,8E-4
Combined uncertainty
0,0017 1,066E-03 0,000500 1,90E-03
Expanded uncertainty (mL)
0,0033 2,132E-03 0,00100 3,80E-03
EURAMET Project no. 1297
KCDB: EURAMET.M.FF.S8
Comparison of a 50 mL pycnometer and a 500 mL flask Final report
25 /37
Uncertainty contributions, mL
NMI
IPQ FORCE INRIM CEM
Mass 0,000187909 0,000676 0,00015 0,000584
Air Density 3,31459E-05 0,000149 0,00009 3,74E-05
Water Density -6,60849E-
05 0,000299 0,00032
1,77E-03
Density of the mass pieces 1,30051E-05
0,00005 1,34E-05
Coefficient of expansion from the
flask material
-2,25235E-05
0,000180 0,00001 -3,52E-07
Water temperature -2,56657E-
06 -0,000900 0,00007 -7,62E-05
Repeatability 0,000193549 0,000220 0,00003 1,36E-04
Other 2,89E-04 0,000089 0,00020 1,67E-03
Combined uncertainty
4,00E-04 0,0012079 0,00042 0,0025
Expanded uncertainty (mL)
0,0008 0,0024159 0,00084 0,005
Uncertainty contributions,
mL NMI
MIRS DPM BoM MBM UME
Mass 0,000501 0,000235697 0,000135884 1,11E-03 8,30E-05
Air Density 0,000113 0,000109932 2,99002E-05 1,29E-05 3,29E-05
Water Density 0,000906
-0,000005711
-0,000254348
-3,14E-04 1,61E-04
Density of the mass pieces 0,000066 0,000033609 3,81155E-05
6,68E-05 2,60E-05
Coefficient of expansion from
the flask material
0,000003 -0,00009706 1,01944E-05 -8,22E-06 1,38E-06
Water temperature
0,000043 -0,00000728 -7,987E-05 -1,93E-05 1,89E-06
Repeatability 0,000920 0,002038572 0,002090829 6,80E-04 0,0008
Other 0,000577 0,010392305 0,007
0,005
EURAMET Project no. 1297
KCDB: EURAMET.M.FF.S8
Comparison of a 50 mL pycnometer and a 500 mL flask Final report
26 /37
Combined uncertainty
0,001507 0,011 0,00731 0,00518 0,0008
Expanded uncertainty
(mL)
0,0030 0,021 0,015 0,010 0,0018
The uncertainty values presented for the pycnometers are quite similar for all laboratories. The largest uncertainty component for the majority of the laboratories is the mass and the repeatability.
11. CMCs as declared by the laboratories in the CIPM MRA
The following table summarizes the uncertainty claims as published in the KCDB and those given by the participants of this comparison.
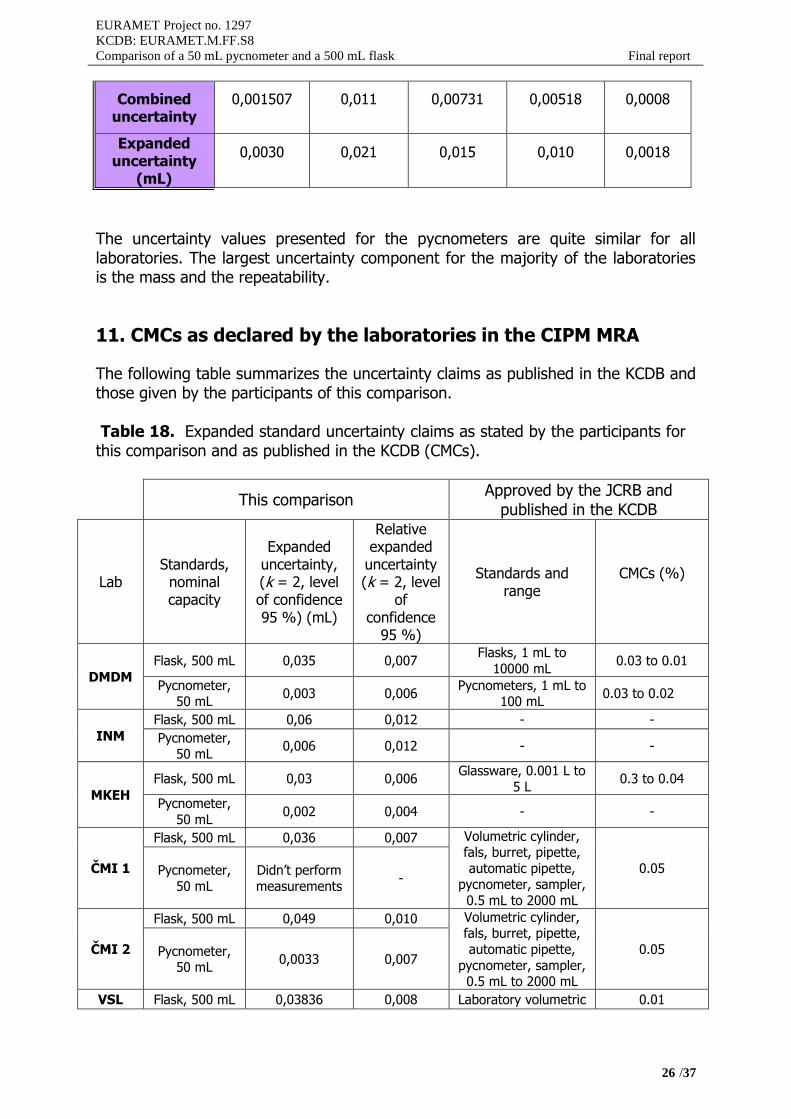
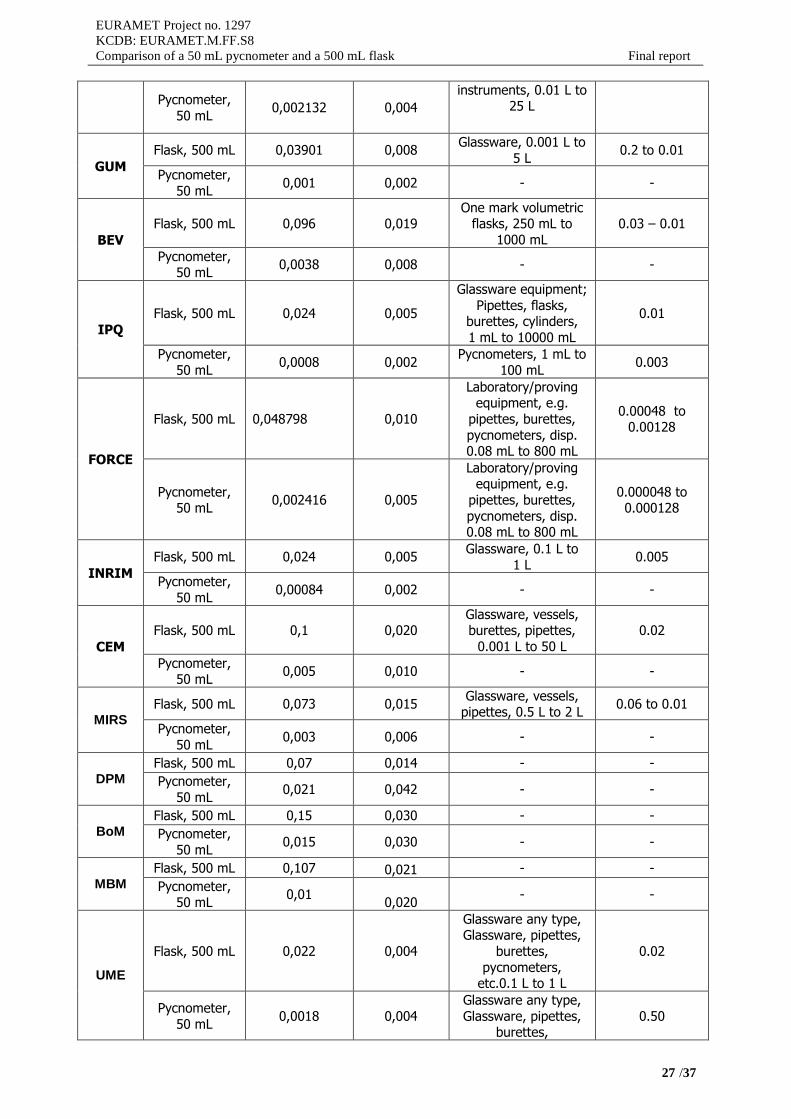
Table 18. Expanded standard uncertainty claims as stated by the participants for this comparison and as published in the KCDB (CMCs).
This comparison Approved by the JCRB and
published in the KCDB
Lab Standards, nominal capacity
Expanded uncertainty, (k = 2, level of confidence 95 %) (mL)
Relative expanded
uncertainty (k = 2, level
of confidence
95 %)
Standards and range
CMCs (%)
DMDM
Flask, 500 mL 0,035 0,007 Flasks, 1 mL to
10000 mL 0.03 to 0.01
Pycnometer, 50 mL
0,003 0,006 Pycnometers, 1 mL to
100 mL 0.03 to 0.02
INM
Flask, 500 mL 0,06 0,012 - -
Pycnometer, 50 mL
0,006 0,012 - -
MKEH
Flask, 500 mL 0,03 0,006 Glassware, 0.001 L to
5 L 0.3 to 0.04
Pycnometer,
50 mL 0,002 0,004 - -
ČMI 1
Flask, 500 mL 0,036 0,007 Volumetric cylinder, fals, burret, pipette,
automatic pipette, pycnometer, sampler,
0.5 mL to 2000 mL
0.05 Pycnometer,
50 mL
Didn’t perform
measurements -
ČMI 2
Flask, 500 mL 0,049 0,010 Volumetric cylinder, fals, burret, pipette,
automatic pipette,
pycnometer, sampler, 0.5 mL to 2000 mL
0.05 Pycnometer, 50 mL
0,0033 0,007
VSL Flask, 500 mL 0,03836 0,008 Laboratory volumetric 0.01
EURAMET Project no. 1297
KCDB: EURAMET.M.FF.S8
Comparison of a 50 mL pycnometer and a 500 mL flask Final report
27 /37
Pycnometer,
50 mL 0,002132 0,004
instruments, 0.01 L to 25 L
GUM
Flask, 500 mL 0,03901 0,008 Glassware, 0.001 L to
5 L 0.2 to 0.01
Pycnometer,
50 mL 0,001 0,002 - -
BEV
Flask, 500 mL 0,096 0,019 One mark volumetric
flasks, 250 mL to
1000 mL
0.03 – 0.01
Pycnometer, 50 mL
0,0038 0,008 - -
IPQ
Flask, 500 mL 0,024 0,005
Glassware equipment;
Pipettes, flasks, burettes, cylinders,
1 mL to 10000 mL
0.01
Pycnometer,
50 mL 0,0008 0,002
Pycnometers, 1 mL to
100 mL 0.003
FORCE
Flask, 500 mL 0,048798 0,010
Laboratory/proving equipment, e.g.
pipettes, burettes,
pycnometers, disp. 0.08 mL to 800 mL
0.00048 to 0.00128
Pycnometer, 50 mL
0,002416 0,005
Laboratory/proving equipment, e.g.
pipettes, burettes,
pycnometers, disp. 0.08 mL to 800 mL
0.000048 to 0.000128
INRIM
Flask, 500 mL 0,024 0,005 Glassware, 0.1 L to
1 L 0.005
Pycnometer,
50 mL 0,00084 0,002 - -
CEM
Flask, 500 mL 0,1 0,020 Glassware, vessels, burettes, pipettes,
0.001 L to 50 L
0.02
Pycnometer, 50 mL
0,005 0,010 - -
MIRS Flask, 500 mL 0,073 0,015
Glassware, vessels, pipettes, 0.5 L to 2 L
0.06 to 0.01
Pycnometer,
50 mL 0,003 0,006 - -
DPM Flask, 500 mL 0,07 0,014 - -
Pycnometer,
50 mL 0,021 0,042 - -
BoM Flask, 500 mL 0,15 0,030 - -
Pycnometer,
50 mL 0,015 0,030 - -
MBM Flask, 500 mL 0,107 0,021 - -
Pycnometer, 50 mL
0,01 0,020
- -
UME
Flask, 500 mL 0,022 0,004
Glassware any type, Glassware, pipettes,
burettes,
pycnometers, etc.0.1 L to 1 L
0.02
Pycnometer,
50 mL 0,0018 0,004
Glassware any type,
Glassware, pipettes, burettes,
0.50
EURAMET Project no. 1297
KCDB: EURAMET.M.FF.S8
Comparison of a 50 mL pycnometer and a 500 mL flask Final report
28 /37
pycnometers, etc.0.001 L to 0.1 L
12. Conclusion
This EURAMET comparison, regarding the calibration of laboratory glassware instruments and pycnometers, started in February 2014 and ended in March 2015. One 500 mL flask and two pycnometers of 50 mL were tested by 17 different laboratories. Regarding the flask measurements there were four laboratories that had inconsistent results, this represents 23,5 % of the all results. After draft A was published the laboratories identified the causes of the inconsistencies and sent their corrected results with explanations. According to the CIPM rules its not possible to change results in draft A report so four explanations and En-values of the revised results for 500
mL flask were not considered officially in this report, but are included in Annex 3, for information purposes. For the pycnometers measurements results are quite satisfactory. The majority of the laboratories present results that are consistent with the reference value, and with each other. There are two laboratories that present slightly discrepant values when compared with the reference value. The uncertainty values presented for the pycnometers are quite similar for all laboratories. For the flask the situation is quite different and the uncertainty values presented can vary more than 3 times.
13. References
1. ISO 4787-2010; Laboratory glassware – Volumetric glassware – Methods foruse and testing of capacity.
2. M.G. Cox, The evaluation of key comparison data, Metrologia, 2002, Vol. 39,589-595.
3. JGCM100:2008 - Guide to the expression of uncertainty in measurement(GUM).
4. JCGM200:2012 – International vocabulary of metrology (VIM).
EURAMET Project no. 1297
KCDB: EURAMET.M.FF.S8
Comparison of a 50 mL pycnometer and a 500 mL flask Final report
29 /37
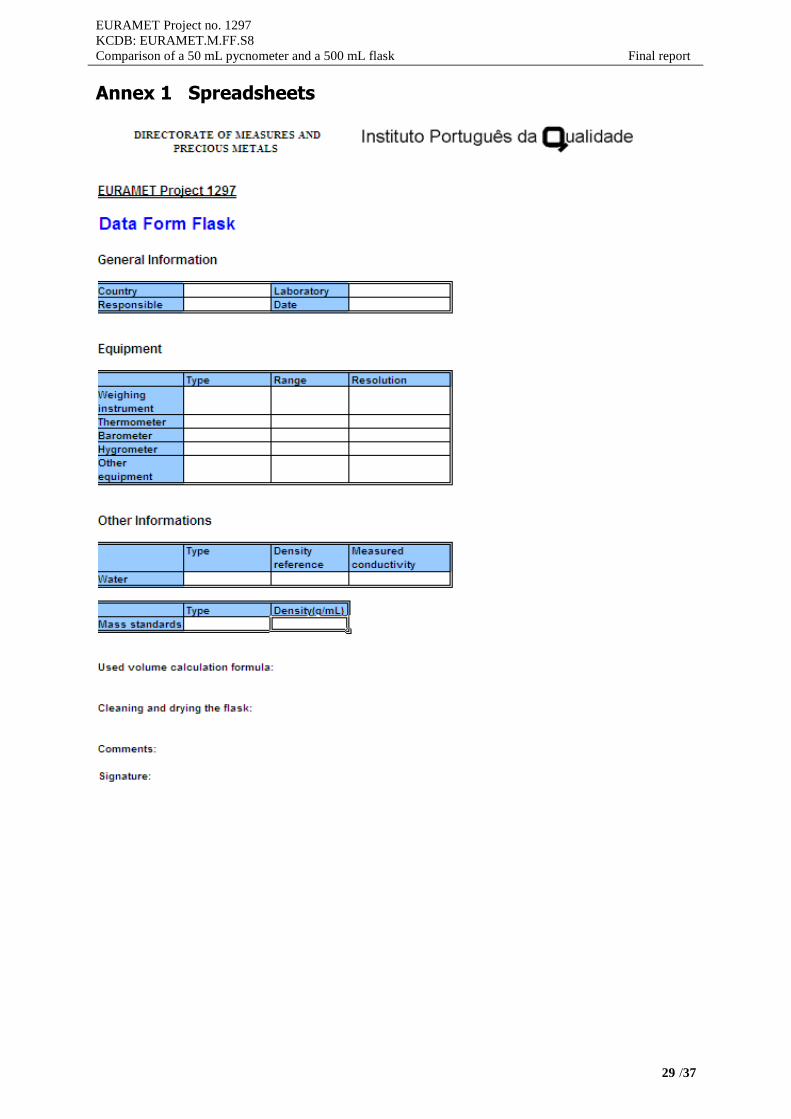
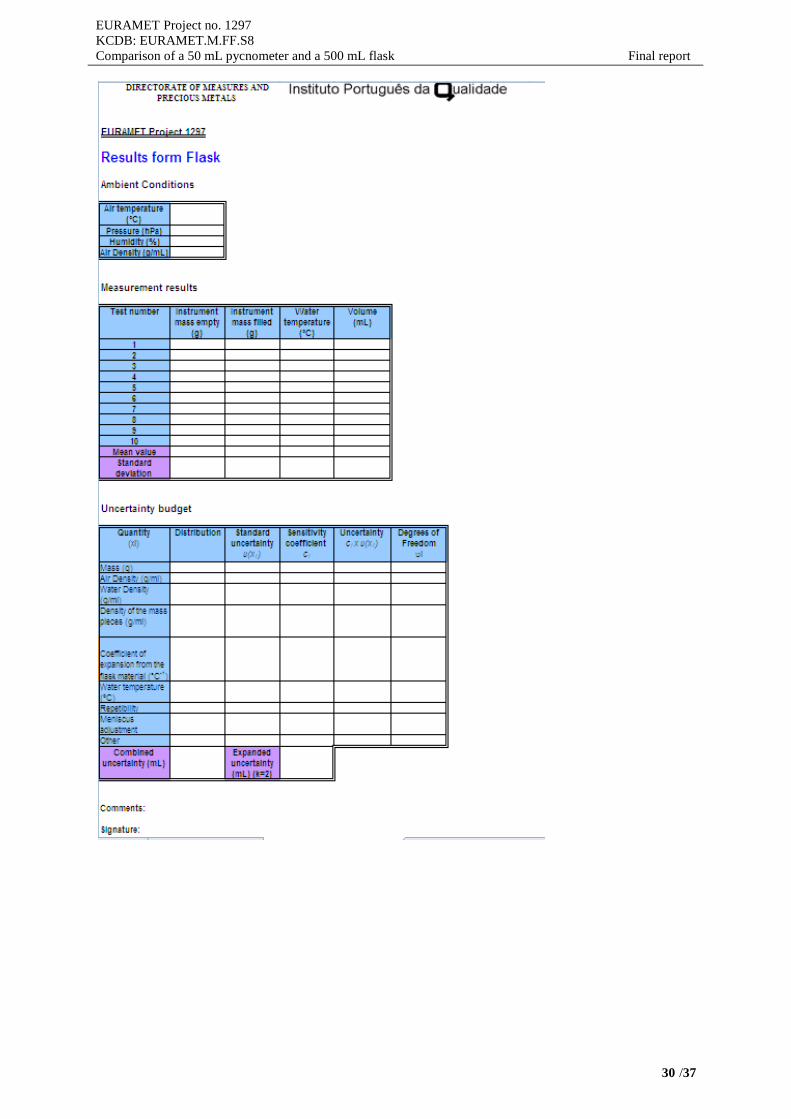
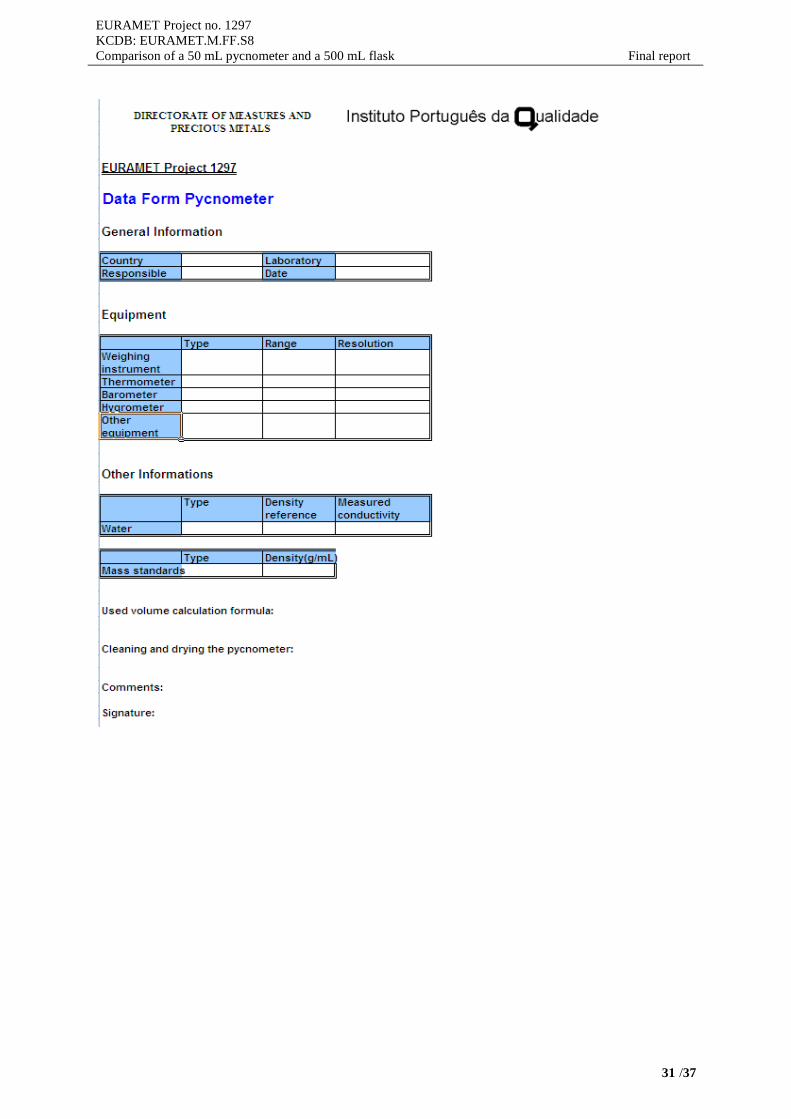
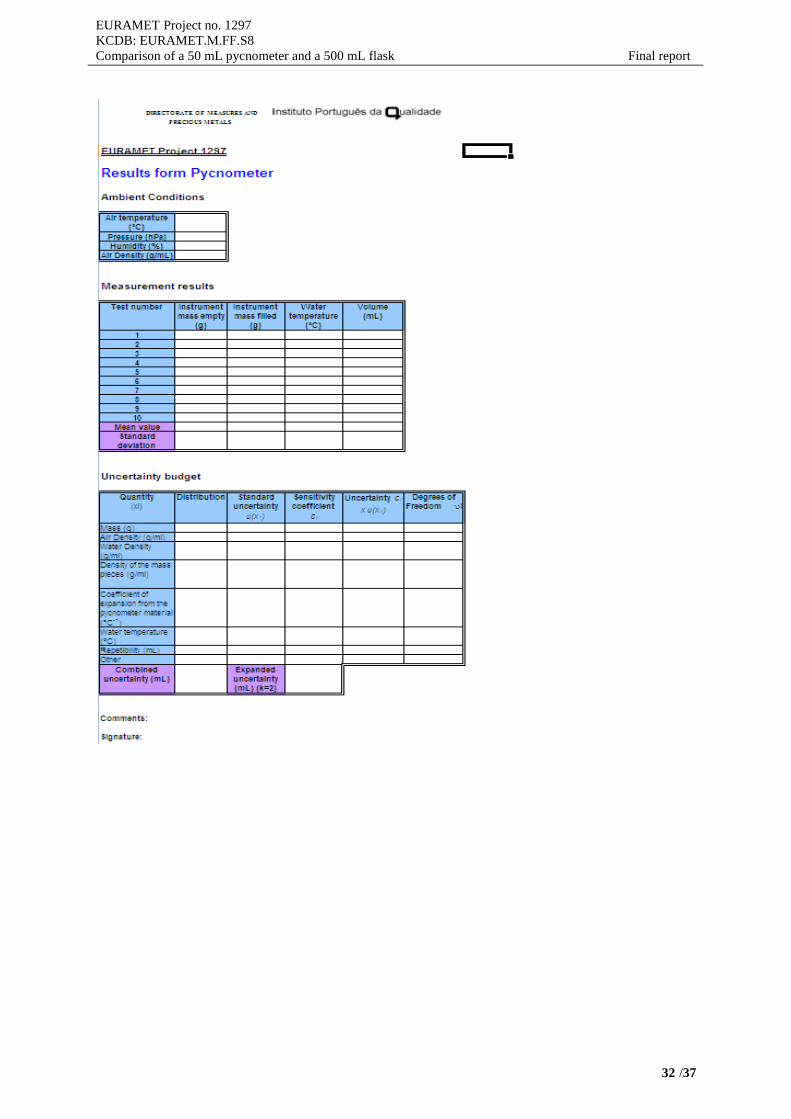
Annex 1 Spreadsheets
EURAMET Project no. 1297
KCDB: EURAMET.M.FF.S8
Comparison of a 50 mL pycnometer and a 500 mL flask Final report
30 /37
EURAMET Project no. 1297
KCDB: EURAMET.M.FF.S8
Comparison of a 50 mL pycnometer and a 500 mL flask Final report
31 /37
EURAMET Project no. 1297
KCDB: EURAMET.M.FF.S8
Comparison of a 50 mL pycnometer and a 500 mL flask Final report
32 /37
EURAMET Project no. 1297
KCDB: EURAMET.M.FF.S8
Comparison of a 50 mL pycnometer and a 500 mL flask Final report
33 /37
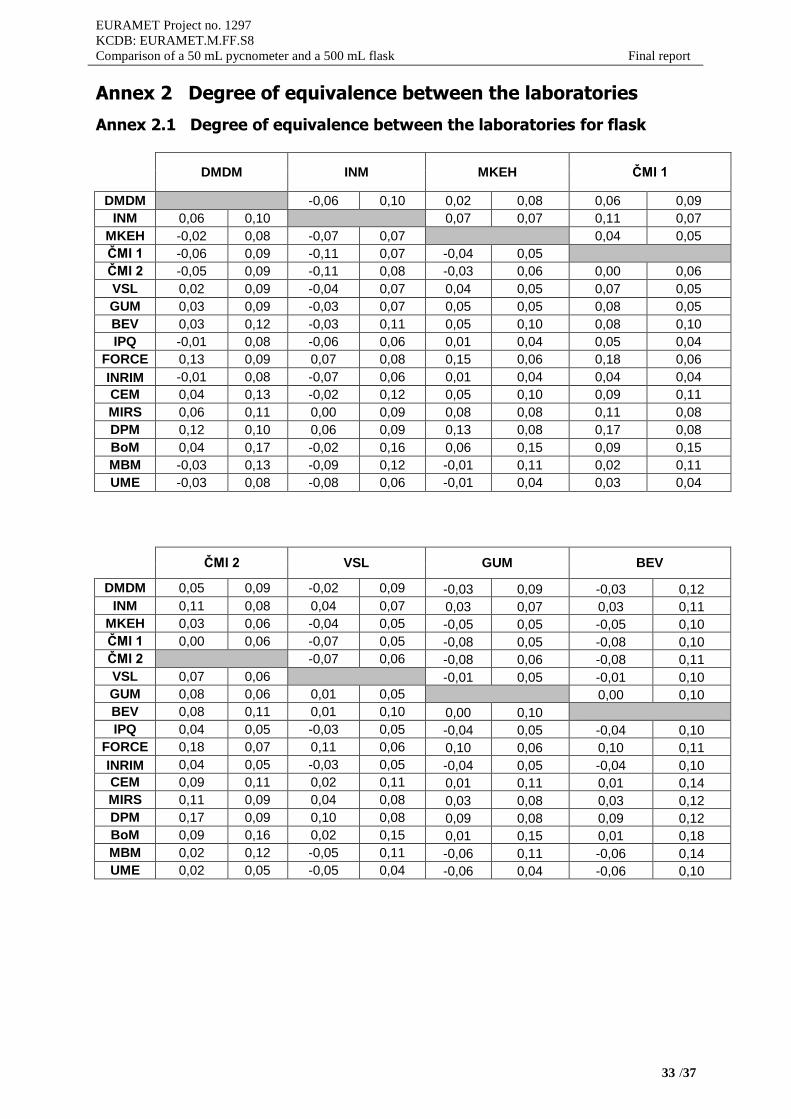
Annex 2 Degree of equivalence between the laboratories
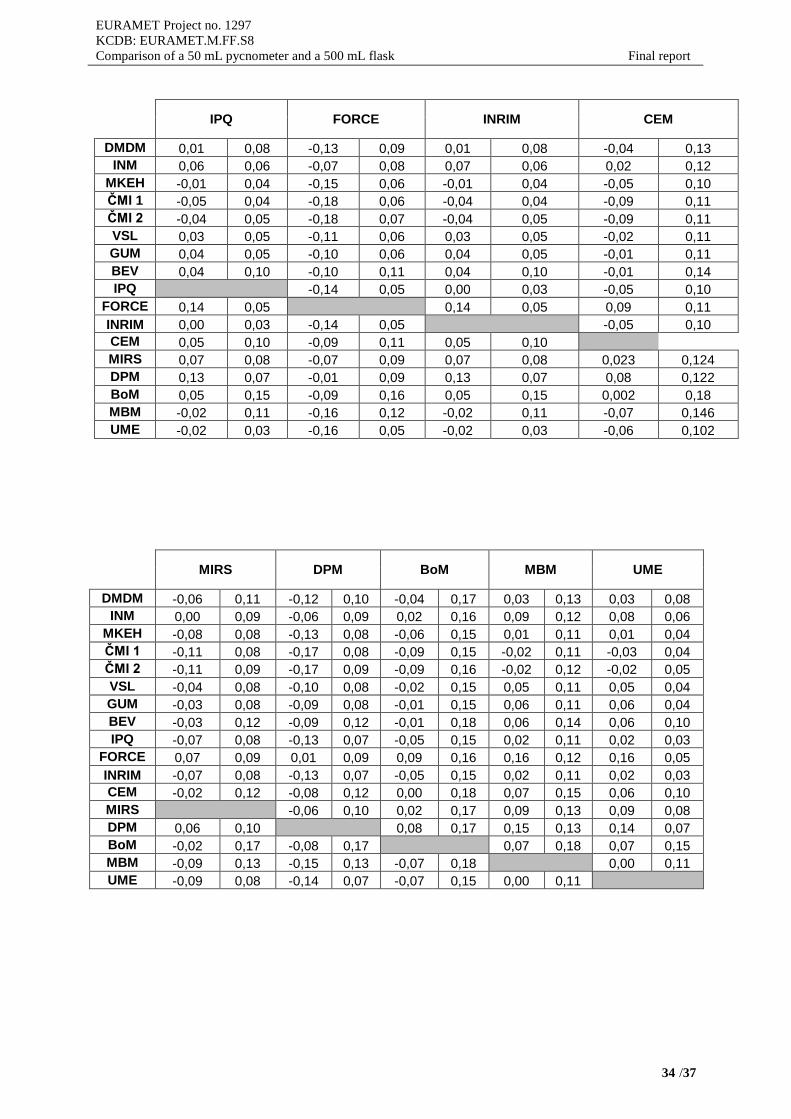
Annex 2.1 Degree of equivalence between the laboratories for flask
DMDM INM MKEH ČMI 1
DMDM -0,06 0,10 0,02 0,08 0,06 0,09
INM 0,06 0,10 0,07 0,07 0,11 0,07
MKEH -0,02 0,08 -0,07 0,07 0,04 0,05
ČMI 1 -0,06 0,09 -0,11 0,07 -0,04 0,05
ČMI 2 -0,05 0,09 -0,11 0,08 -0,03 0,06 0,00 0,06
VSL 0,02 0,09 -0,04 0,07 0,04 0,05 0,07 0,05
GUM 0,03 0,09 -0,03 0,07 0,05 0,05 0,08 0,05
BEV 0,03 0,12 -0,03 0,11 0,05 0,10 0,08 0,10
IPQ -0,01 0,08 -0,06 0,06 0,01 0,04 0,05 0,04
FORCE 0,13 0,09 0,07 0,08 0,15 0,06 0,18 0,06
INRIM -0,01 0,08 -0,07 0,06 0,01 0,04 0,04 0,04
CEM 0,04 0,13 -0,02 0,12 0,05 0,10 0,09 0,11
MIRS 0,06 0,11 0,00 0,09 0,08 0,08 0,11 0,08
DPM 0,12 0,10 0,06 0,09 0,13 0,08 0,17 0,08
BoM 0,04 0,17 -0,02 0,16 0,06 0,15 0,09 0,15
MBM -0,03 0,13 -0,09 0,12 -0,01 0,11 0,02 0,11
UME -0,03 0,08 -0,08 0,06 -0,01 0,04 0,03 0,04
ČMI 2 VSL GUM BEV
DMDM 0,05 0,09 -0,02 0,09 -0,03 0,09 -0,03 0,12
INM 0,11 0,08 0,04 0,07 0,03 0,07 0,03 0,11
MKEH 0,03 0,06 -0,04 0,05 -0,05 0,05 -0,05 0,10
ČMI 1 0,00 0,06 -0,07 0,05 -0,08 0,05 -0,08 0,10
ČMI 2 -0,07 0,06 -0,08 0,06 -0,08 0,11
VSL 0,07 0,06 -0,01 0,05 -0,01 0,10
GUM 0,08 0,06 0,01 0,05 0,00 0,10
BEV 0,08 0,11 0,01 0,10 0,00 0,10
IPQ 0,04 0,05 -0,03 0,05 -0,04 0,05 -0,04 0,10
FORCE 0,18 0,07 0,11 0,06 0,10 0,06 0,10 0,11
INRIM 0,04 0,05 -0,03 0,05 -0,04 0,05 -0,04 0,10
CEM 0,09 0,11 0,02 0,11 0,01 0,11 0,01 0,14
MIRS 0,11 0,09 0,04 0,08 0,03 0,08 0,03 0,12
DPM 0,17 0,09 0,10 0,08 0,09 0,08 0,09 0,12
BoM 0,09 0,16 0,02 0,15 0,01 0,15 0,01 0,18
MBM 0,02 0,12 -0,05 0,11 -0,06 0,11 -0,06 0,14
UME 0,02 0,05 -0,05 0,04 -0,06 0,04 -0,06 0,10
EURAMET Project no. 1297
KCDB: EURAMET.M.FF.S8
Comparison of a 50 mL pycnometer and a 500 mL flask Final report
34 /37
IPQ FORCE INRIM CEM
DMDM 0,01 0,08 -0,13 0,09 0,01 0,08 -0,04 0,13
INM 0,06 0,06 -0,07 0,08 0,07 0,06 0,02 0,12
MKEH -0,01 0,04 -0,15 0,06 -0,01 0,04 -0,05 0,10
ČMI 1 -0,05 0,04 -0,18 0,06 -0,04 0,04 -0,09 0,11
ČMI 2 -0,04 0,05 -0,18 0,07 -0,04 0,05 -0,09 0,11
VSL 0,03 0,05 -0,11 0,06 0,03 0,05 -0,02 0,11
GUM 0,04 0,05 -0,10 0,06 0,04 0,05 -0,01 0,11
BEV 0,04 0,10 -0,10 0,11 0,04 0,10 -0,01 0,14
IPQ -0,14 0,05 0,00 0,03 -0,05 0,10
FORCE 0,14 0,05 0,14 0,05 0,09 0,11
INRIM 0,00 0,03 -0,14 0,05 -0,05 0,10
CEM 0,05 0,10 -0,09 0,11 0,05 0,10
MIRS 0,07 0,08 -0,07 0,09 0,07 0,08 0,023 0,124
DPM 0,13 0,07 -0,01 0,09 0,13 0,07 0,08 0,122
BoM 0,05 0,15 -0,09 0,16 0,05 0,15 0,002 0,18
MBM -0,02 0,11 -0,16 0,12 -0,02 0,11 -0,07 0,146
UME -0,02 0,03 -0,16 0,05 -0,02 0,03 -0,06 0,102
MIRS DPM BoM MBM UME
DMDM -0,06 0,11 -0,12 0,10 -0,04 0,17 0,03 0,13 0,03 0,08
INM 0,00 0,09 -0,06 0,09 0,02 0,16 0,09 0,12 0,08 0,06
MKEH -0,08 0,08 -0,13 0,08 -0,06 0,15 0,01 0,11 0,01 0,04
ČMI 1 -0,11 0,08 -0,17 0,08 -0,09 0,15 -0,02 0,11 -0,03 0,04
ČMI 2 -0,11 0,09 -0,17 0,09 -0,09 0,16 -0,02 0,12 -0,02 0,05
VSL -0,04 0,08 -0,10 0,08 -0,02 0,15 0,05 0,11 0,05 0,04
GUM -0,03 0,08 -0,09 0,08 -0,01 0,15 0,06 0,11 0,06 0,04
BEV -0,03 0,12 -0,09 0,12 -0,01 0,18 0,06 0,14 0,06 0,10
IPQ -0,07 0,08 -0,13 0,07 -0,05 0,15 0,02 0,11 0,02 0,03
FORCE 0,07 0,09 0,01 0,09 0,09 0,16 0,16 0,12 0,16 0,05
INRIM -0,07 0,08 -0,13 0,07 -0,05 0,15 0,02 0,11 0,02 0,03
CEM -0,02 0,12 -0,08 0,12 0,00 0,18 0,07 0,15 0,06 0,10
MIRS -0,06 0,10 0,02 0,17 0,09 0,13 0,09 0,08
DPM 0,06 0,10 0,08 0,17 0,15 0,13 0,14 0,07
BoM -0,02 0,17 -0,08 0,17 0,07 0,18 0,07 0,15
MBM -0,09 0,13 -0,15 0,13 -0,07 0,18 0,00 0,11
UME -0,09 0,08 -0,14 0,07 -0,07 0,15 0,00 0,11
EURAMET Project no. 1297
KCDB: EURAMET.M.FF.S8
Comparison of a 50 mL pycnometer and a 500 mL flask Final report
35 /37
Annex 2.2 Degree of equivalence between the laboratories for pycnometer with s.n. 2
DMDM INM MKEH ČMI 2
DMDM -0,0050 0,0067 0,0010 0,0036 -0,0036 0,0045
INM 0,0050 0,0067 0,0060 0,0063 0,0014 0,0068
MKEH -0,0010 0,0036 -0,0060 0,0063 -0,0046 0,0039
ČMI 2 0,0036 0,0045 -0,0014 0,0068 0,0046 0,0039
VSL -0,0020 0,0037 -0,0070 0,0064 -0,0010 0,0029 -0,0056 0,0039
GUM -0,0005 0,0032 -0,0055 0,0061 0,0005 0,0022 -0,0041 0,0034
BEV -0,0006 0,0048 -0,0056 0,0071 0,0004 0,0043 -0,0042 0,0050
IPQ 0,0005 0,0031 -0,0045 0,0061 0,0015 0,0022 -0,0031 0,0034
FORCE 0,0011 0,0039 -0,0039 0,0065 0,0021 0,0031 -0,0025 0,0041
INRIM 0,0002 0,0031 -0,0048 0,0061 0,0012 0,0022 -0,0034 0,0034
CEM 0,0002 0,0058 -0,0048 0,0078 0,0012 0,0054 -0,0034 0,0060
VSL GUM BEV IPQ
DMDM 0,0020 0,0037 0,0005 0,0032 0,0006 0,0048 -0,0005 0,0031
INM 0,0070 0,0064 0,0055 0,0061 0,0056 0,0071 0,0045 0,0061
MKEH 0,0010 0,0029 -0,0005 0,0022 -0,0004 0,0043 -0,0015 0,0022
ČMI 2 0,0056 0,0039 0,0041 0,0034 0,0042 0,0050 0,0031 0,0034
VSL -0,0015 0,0024 -0,0014 0,0044 -0,0025 0,0023
GUM 0,0015 0,0024 0,0001 0,0039 -0,0010 0,0013
BEV 0,0014 0,0044 -0,0001 0,0039 -0,0011 0,0039
IPQ 0,0025 0,0023 0,0010 0,0013 0,0011 0,0039
FORCE 0,0031 0,0032 0,0016 0,0026 0,0017 0,0045 0,0006 0,0025
INRIM 0,0022 0,0023 0,0007 0,0013 0,0008 0,0039 -0,0002 0,0012
CEM 0,0022 0,0054 0,0007 0,0051 0,0008 0,0063 -0,0003 0,0051
FORCE INRIM CEM
DMDM -0,0011 0,0039 -0,0002 0,0031 -0,0002 0,0058
INM 0,0039 0,0065 0,0048 0,0061 0,0048 0,0078
MKEH -0,0021 0,0031 -0,0012 0,0022 -0,0012 0,0054
ČMI 2 0,0025 0,0041 0,0034 0,0034 0,0034 0,0060
VSL -0,0031 0,0032 -0,0022 0,0023 -0,0022 0,0054
GUM -0,0016 0,0026 -0,0007 0,0013 -0,0007 0,0051
BEV -0,0017 0,0045 -0,0008 0,0039 -0,0008 0,0063
IPQ -0,0006 0,0025 0,0002 0,0012 0,0003 0,0051
FORCE 0,0008 0,0026 0,0009 0,0056
INRIM -0,0008 0,0026 0,0000 0,0051
CEM -0,0009 0,0056 0,0000 0,0051
EURAMET Project no. 1297
KCDB: EURAMET.M.FF.S8
Comparison of a 50 mL pycnometer and a 500 mL flask Final report
36 /37
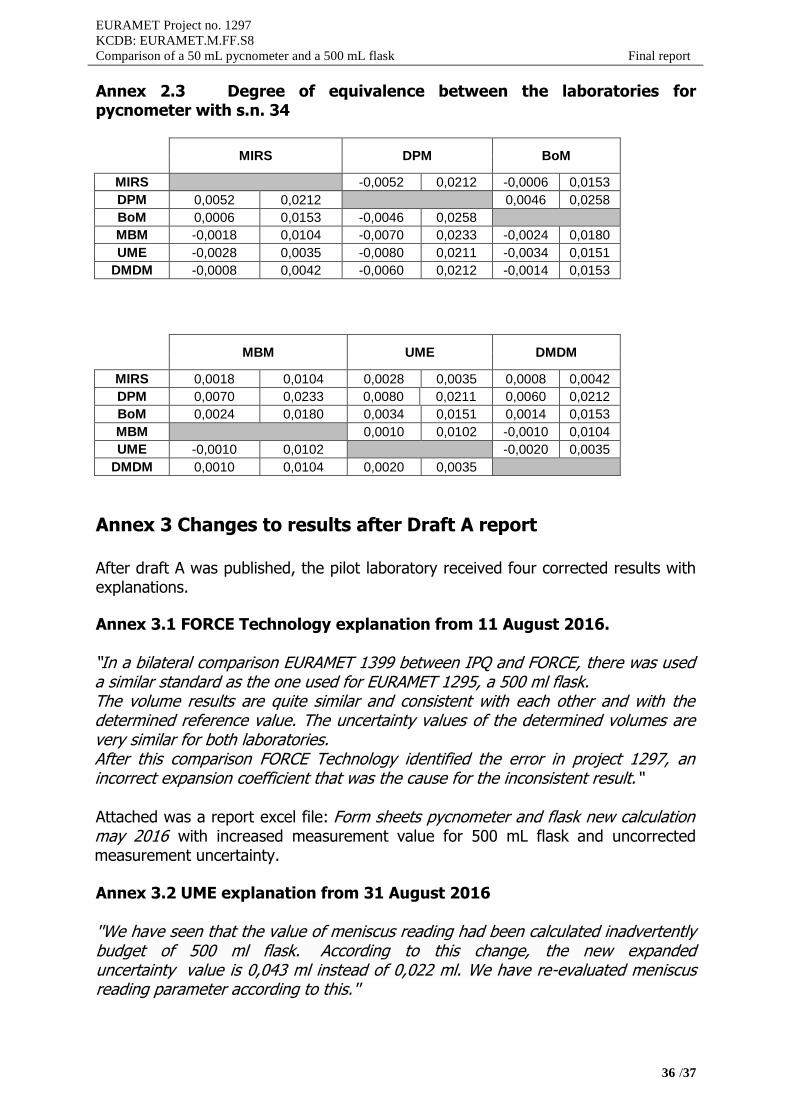
Annex 2.3 Degree of equivalence between the laboratories for pycnometer with s.n. 34
MIRS DPM BoM
MIRS -0,0052 0,0212 -0,0006 0,0153
DPM 0,0052 0,0212 0,0046 0,0258
BoM 0,0006 0,0153 -0,0046 0,0258
MBM -0,0018 0,0104 -0,0070 0,0233 -0,0024 0,0180
UME -0,0028 0,0035 -0,0080 0,0211 -0,0034 0,0151
DMDM -0,0008 0,0042 -0,0060 0,0212 -0,0014 0,0153
MBM UME DMDM
MIRS 0,0018 0,0104 0,0028 0,0035 0,0008 0,0042
DPM 0,0070 0,0233 0,0080 0,0211 0,0060 0,0212
BoM 0,0024 0,0180 0,0034 0,0151 0,0014 0,0153
MBM 0,0010 0,0102 -0,0010 0,0104
UME -0,0010 0,0102 -0,0020 0,0035
DMDM 0,0010 0,0104 0,0020 0,0035
Annex 3 Changes to results after Draft A report
After draft A was published, the pilot laboratory received four corrected results with explanations.
Annex 3.1 FORCE Technology explanation from 11 August 2016.
“In a bilateral comparison EURAMET 1399 between IPQ and FORCE, there was used a similar standard as the one used for EURAMET 1295, a 500 ml flask. The volume results are quite similar and consistent with each other and with the determined reference value. The uncertainty values of the determined volumes are very similar for both laboratories. After this comparison FORCE Technology identified the error in project 1297, an incorrect expansion coefficient that was the cause for the inconsistent result.“
Attached was a report excel file: Form sheets pycnometer and flask new calculation may 2016 with increased measurement value for 500 mL flask and uncorrected measurement uncertainty.
Annex 3.2 UME explanation from 31 August 2016
''We have seen that the value of meniscus reading had been calculated inadvertently budget of 500 ml flask. According to this change, the new expanded uncertainty value is 0,043 ml instead of 0,022 ml. We have re-evaluated meniscus reading parameter according to this.''
EURAMET Project no. 1297
KCDB: EURAMET.M.FF.S8
Comparison of a 50 mL pycnometer and a 500 mL flask Final report
37 /37
Annex 3.3 DPM explanation from 30 August 2016
“I detect a mistake in the DPM reported value for the uncertainty of meniscus (instead of 0.0103 ml it is 0.1199 ml). I have re-evaluated again the uncertainty with these change and I have a new uncertainty for the flask. Attached is the report file with value changed and increased uncertainty.“
Attached was a report excell file: Form sheets flask:2 with increased measuremet uncertainty.
Annex 3.4 ČMI 1 explanation from 26 August 2016
“Because that the measurement performed three persons laboratories, we have incorporated into the repeatability of the results even standard deviation of the measurements. The value of the result of the volume stays the same. “
Attached was a report Excel file: Vysledky Brno 2016 with increasedmeasurement uncertainty.
Annex 3.5 En-values with results revised after draft A report
The Excel spreadsheet Results_ EURAMET_ 1297_October_2016_revised_values contains values revised for FORCE Technology, UME, DPM and ČMI 1, according to Annex 3.1, Annex 3.2, annex 3.3 and Annex 3.4. The Ei - values for the parameters subject to changes were calculated again and are summarized in Table 19. Values in red or their uncertainties were changed.
Table 19. Ei - values of the revised results for 500 mL flask.
Laboratory di(mL) Udi(mL) Ei
DMDM 0,00 0,03 - 0,15INM - 0,06 0,06 - 1,01
MKEH 0,01 0,03 0,50 ČMI 1 0,05 0,05 0,93 ČMI 2 0,05 0,05 0,94 VSL - 0,02 0,04 - 0,59GUM - 0,03 0,04 - 0,82BEV - 0,03 0,10 - 0,32IPQ 0,01 0,02 0,23
FORCE - 0,01 0,05 - 0,27INRIM 0,01 0,02 0,24 CEM - 0,04 0,10 - 0,40MIRS - 0,06 0,07 - 0,87DPM - 0,12 0,25 - 0,48BoM - 0,04 0,15 - 0,28MBM 0,03 0,11 0,26 UME 0,02 0,04 0,58


![Bibliography of Peer-Reviewed Papers Citing Micromeritics ... · Micromeritics Product Citations AccuPyc Gas Pycnometer No. Title, Publication, Author(s) [through March 2006] MIC](https://img.pdfslide.net/doc/110x75/5e9062ea334b7c00d6758887/bibliography-of-peer-reviewed-papers-citing-micromeritics-micromeritics-product.jpg)