Embed Size (px)
DESCRIPTION
Citation preview
Turkey’s Economic & Political Outlook
June 3, 2014
Mehmet Şimşek
Minister of Finance
1
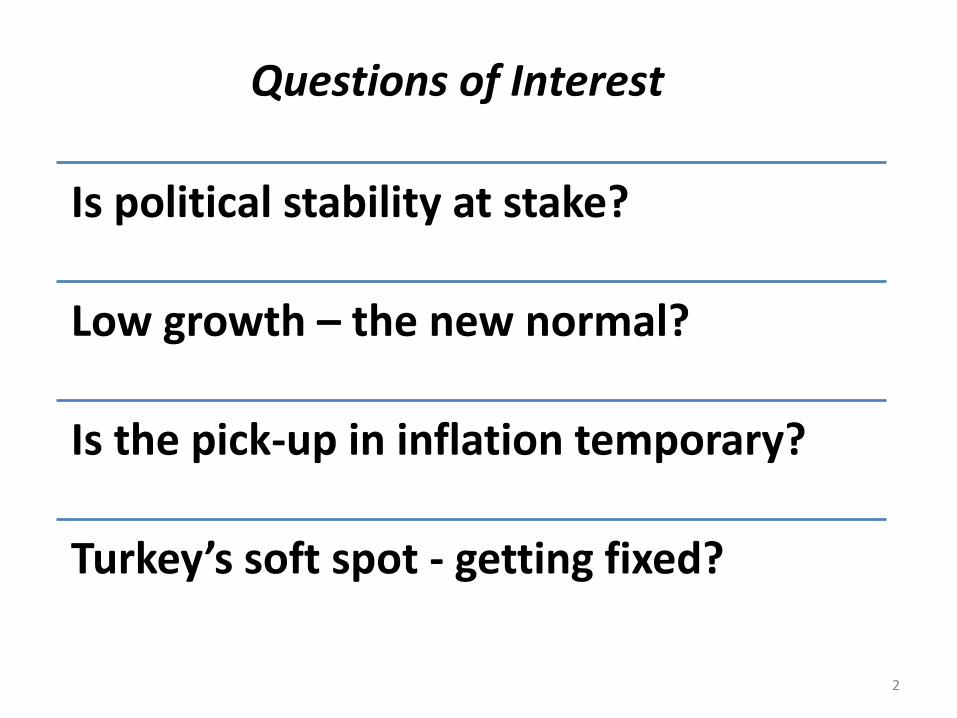
Is political stability at stake?
Low growth – the new normal?
Is the pick-up in inflation temporary?
Turkey’s soft spot - getting fixed?
Questions of Interest
2
Is political stability at stake?
3
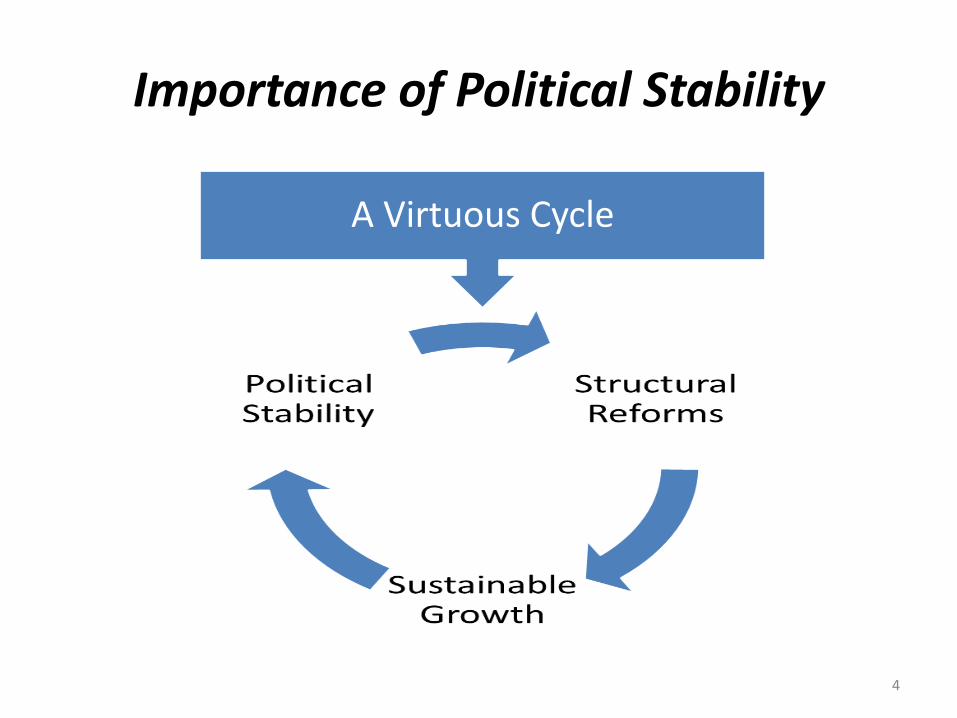
Importance of Political Stability
4
v
A Virtuous Cycle
Political Stability
5
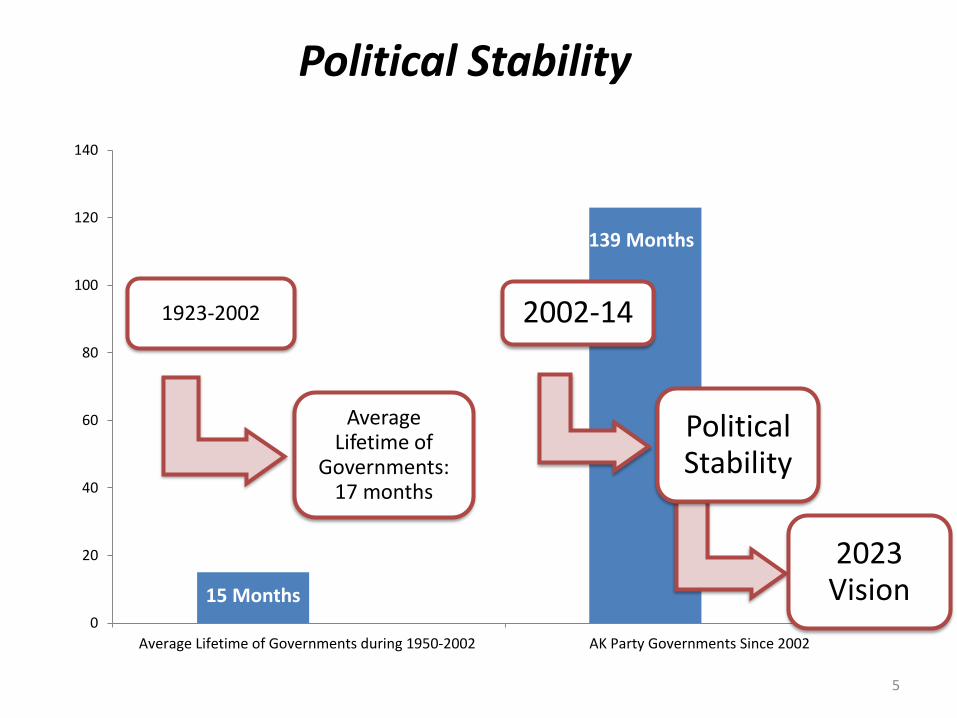
15 Months
139 Months
0
20
40
60
80
100
120
140
Average Lifetime of Governments during 1950-2002 AK Party Governments Since 2002
1923-2002
Average Lifetime of
Governments: 17 months
2002-14
Political Stability
2023 Vision
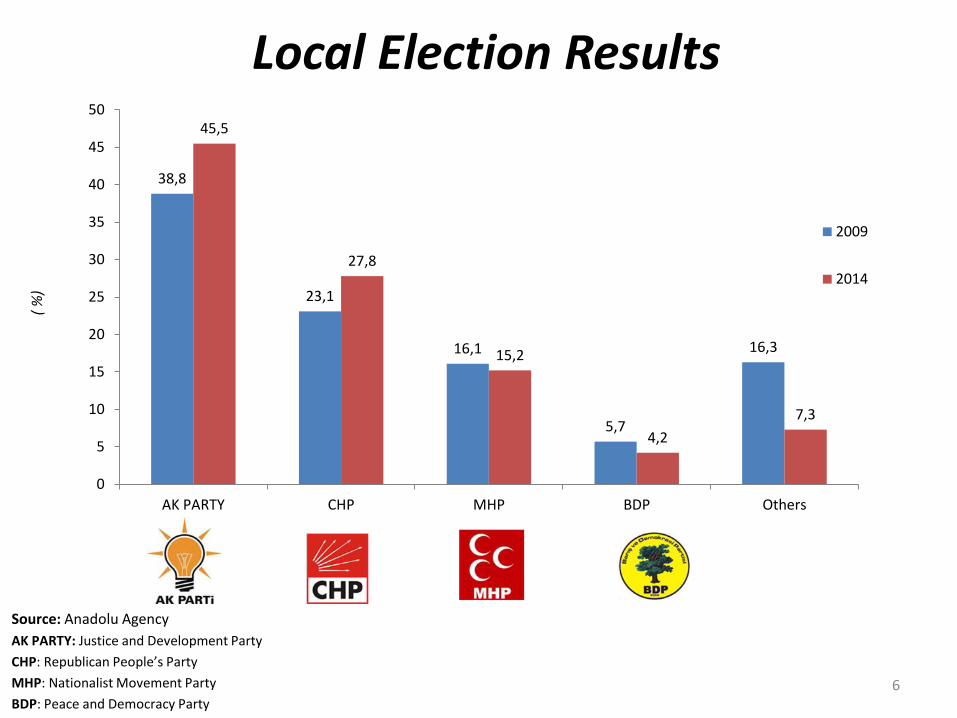
Local Election Results
Source: Anadolu Agency
AK PARTY: Justice and Development Party
CHP: Republican People’s Party
MHP: Nationalist Movement Party
BDP: Peace and Democracy Party
( %
)
38,8
23,1
16,1
5,7
16,3
45,5
27,8
15,2
4,2
7,3
0
5
10
15
20
25
30
35
40
45
50
AK PARTY CHP MHP BDP Others
2009
2014
6
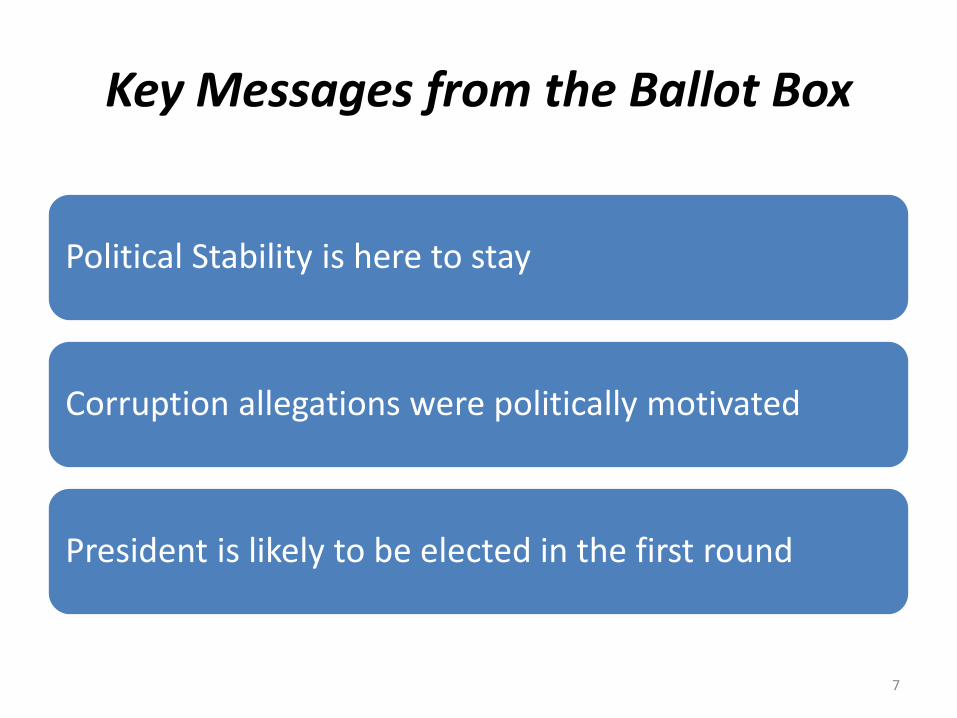
Key Messages from the Ballot Box
Political Stability is here to stay
Corruption allegations were politically motivated
President is likely to be elected in the first round
7
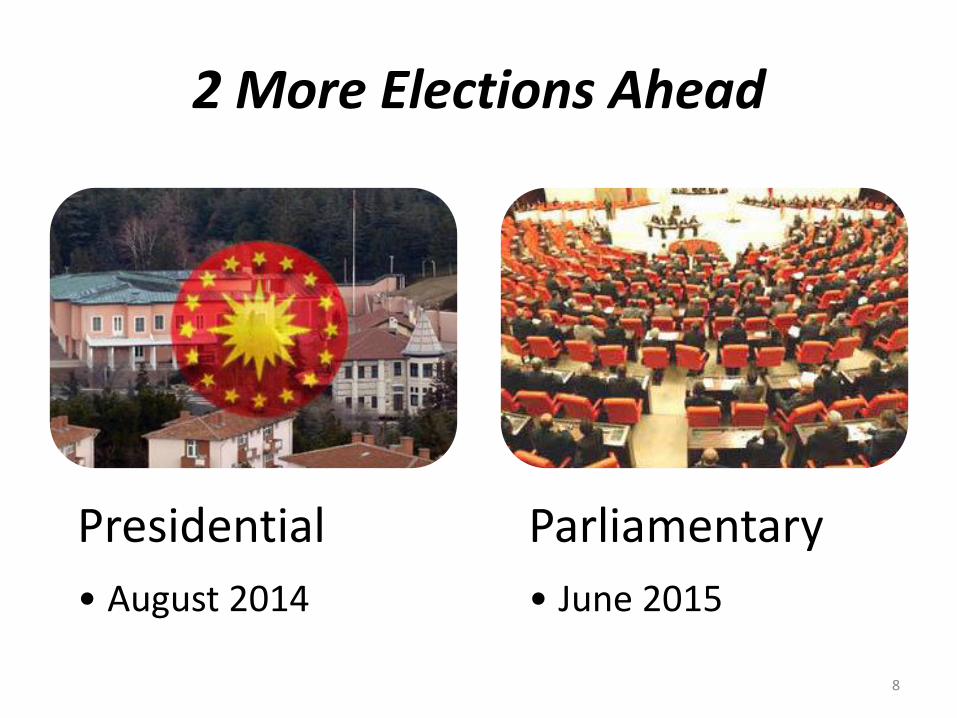
2 More Elections Ahead
Presidential
• August 2014
Parliamentary
• June 2015
8

Low growth – the new normal?
9
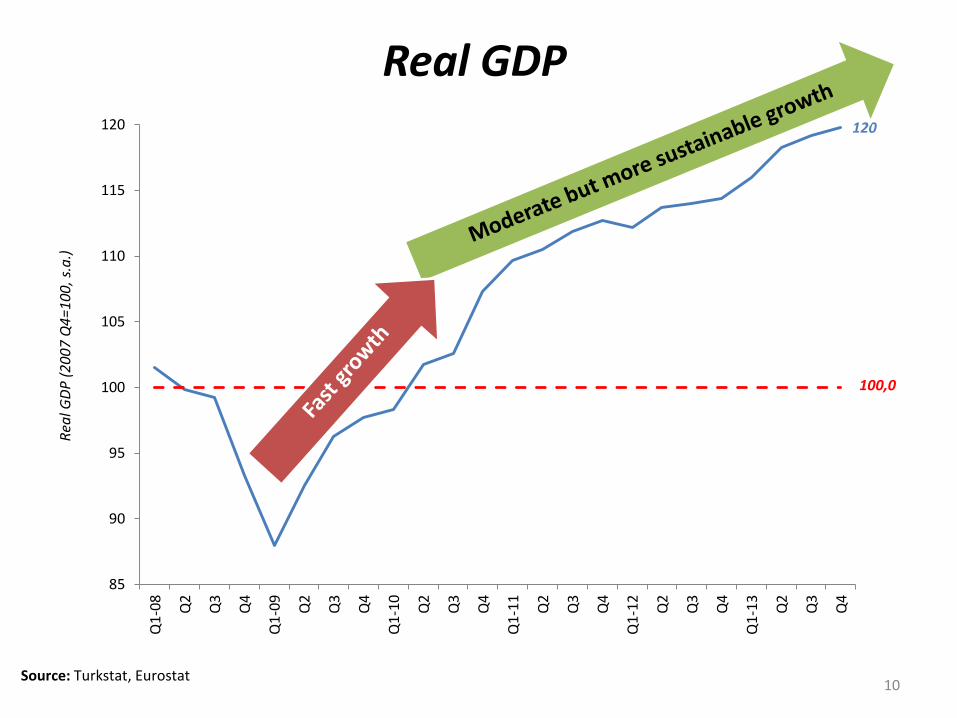
Real GDP
Source: Turkstat, Eurostat
120
100,0
85
90
95
100
105
110
115
120
Q1
-08
Q2
Q3
Q4
Q1
-09
Q2
Q3
Q4
Q1
-10
Q2
Q3
Q4
Q1
-11
Q2
Q3
Q4
Q1
-12
Q2
Q3
Q4
Q1
-13
Q2
Q3
Q4
Rea
l GD
P (
20
07
Q4
=1
00
, s.a
.)
10
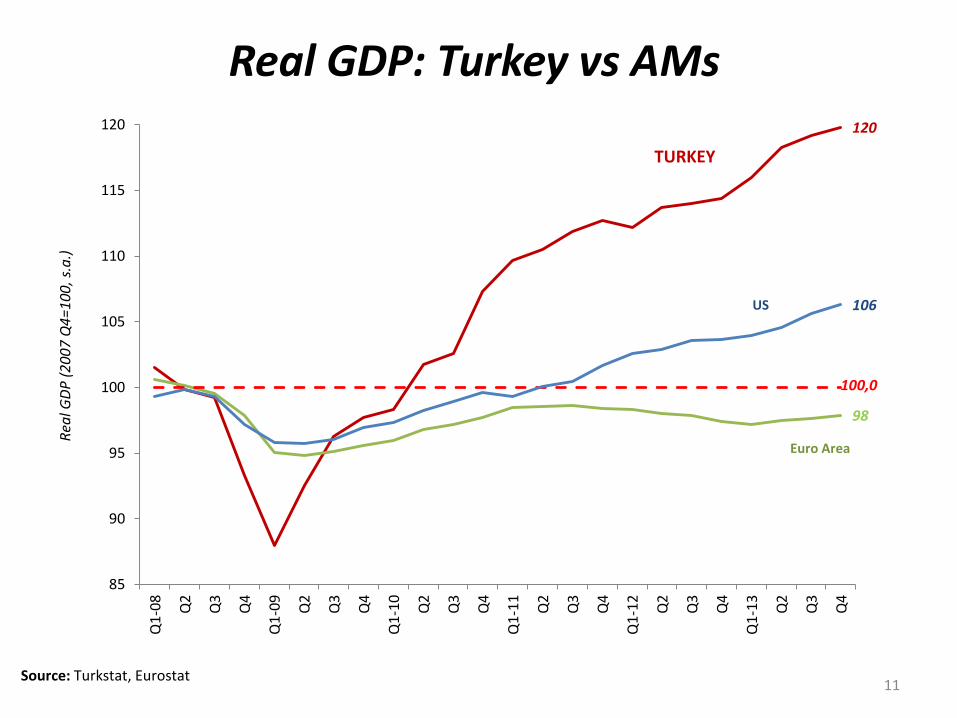
Real GDP: Turkey vs AMs
Source: Turkstat, Eurostat
120
98
100,0
106
85
90
95
100
105
110
115
120
Q1
-08
Q2
Q3
Q4
Q1
-09
Q2
Q3
Q4
Q1
-10
Q2
Q3
Q4
Q1
-11
Q2
Q3
Q4
Q1
-12
Q2
Q3
Q4
Q1
-13
Q2
Q3
Q4
Rea
l GD
P (
20
07
Q4
=1
00
, s.a
.)
TURKEY
US
Euro Area
11
12
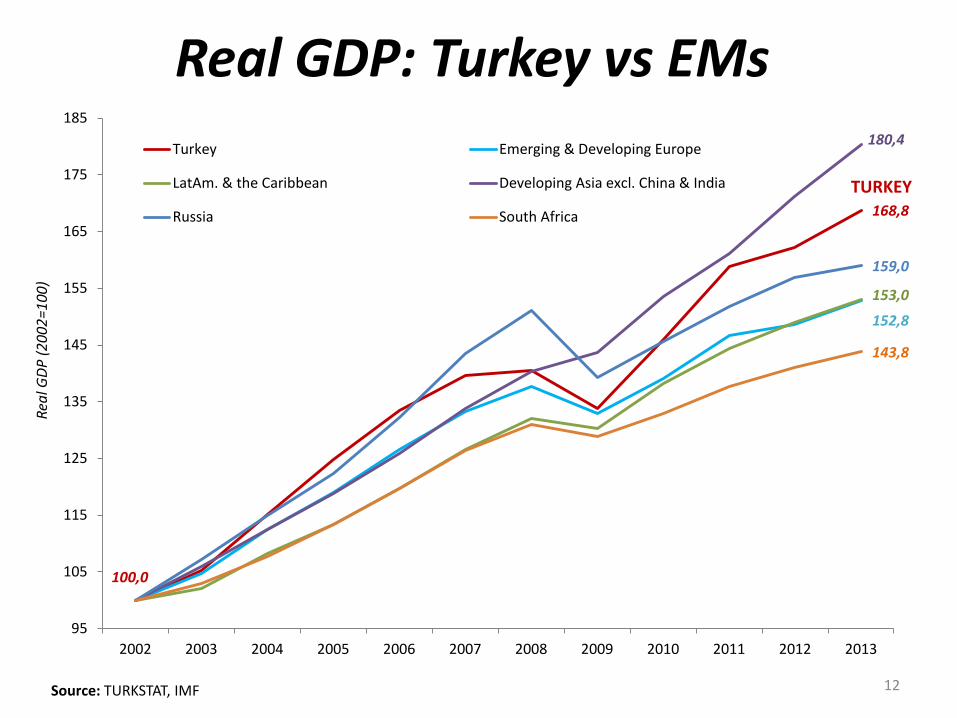
Real GDP: Turkey vs EMs
Source: TURKSTAT, IMF
168,8
100,0
152,8
153,0
180,4
159,0
143,8
95
105
115
125
135
145
155
165
175
185
2002 2003 2004 2005 2006 2007 2008 2009 2010 2011 2012 2013
Turkey Emerging & Developing Europe
LatAm. & the Caribbean Developing Asia excl. China & India
Russia South Africa
TURKEY
Rea
l GD
P (
20
02
=10
0)

Upside
• Stronger external demand
• EU pulling out of recession
• Arab Spring becoming less disruptive
• TL depreciation
Downside
• Tighter financial conditions
• Geopolitical tensions
Growth Outlook
13
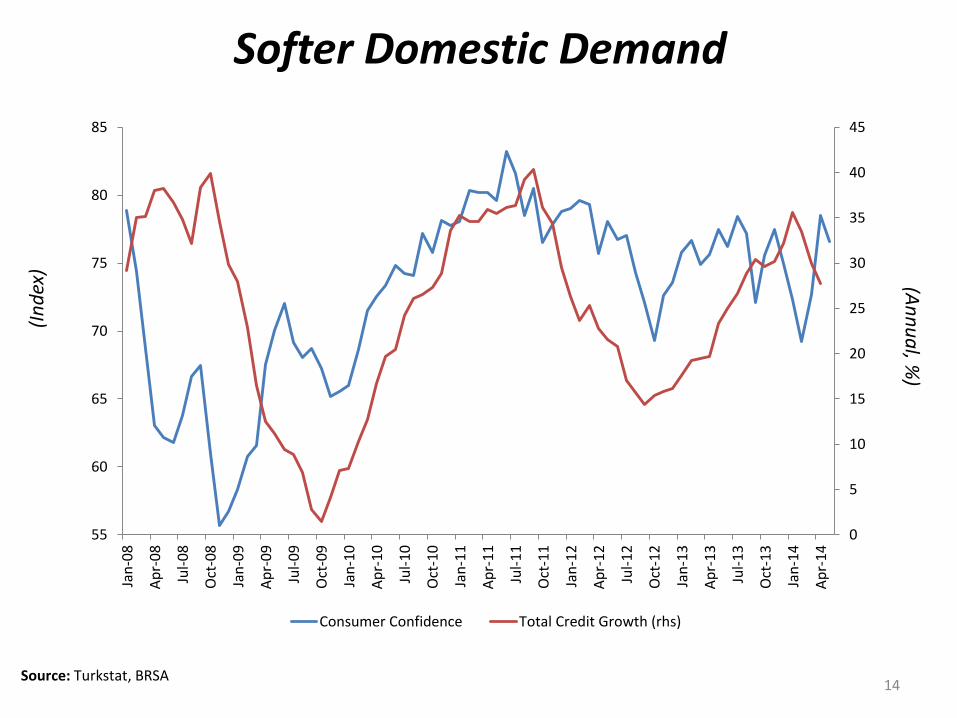
Softer Domestic Demand
14 Source: Turkstat, BRSA
(In
dex
) (A
nn
ua
l, %)
0
5
10
15
20
25
30
35
40
45
55
60
65
70
75
80
85Ja
n-0
8
Ap
r-0
8
Jul-
08
Oct
-08
Jan
-09
Ap
r-0
9
Jul-
09
Oct
-09
Jan
-10
Ap
r-1
0
Jul-
10
Oct
-10
Jan
-11
Ap
r-1
1
Jul-
11
Oct
-11
Jan
-12
Ap
r-1
2
Jul-
12
Oct
-12
Jan
-13
Ap
r-1
3
Jul-
13
Oct
-13
Jan
-14
Ap
r-1
4
Consumer Confidence Total Credit Growth (rhs)
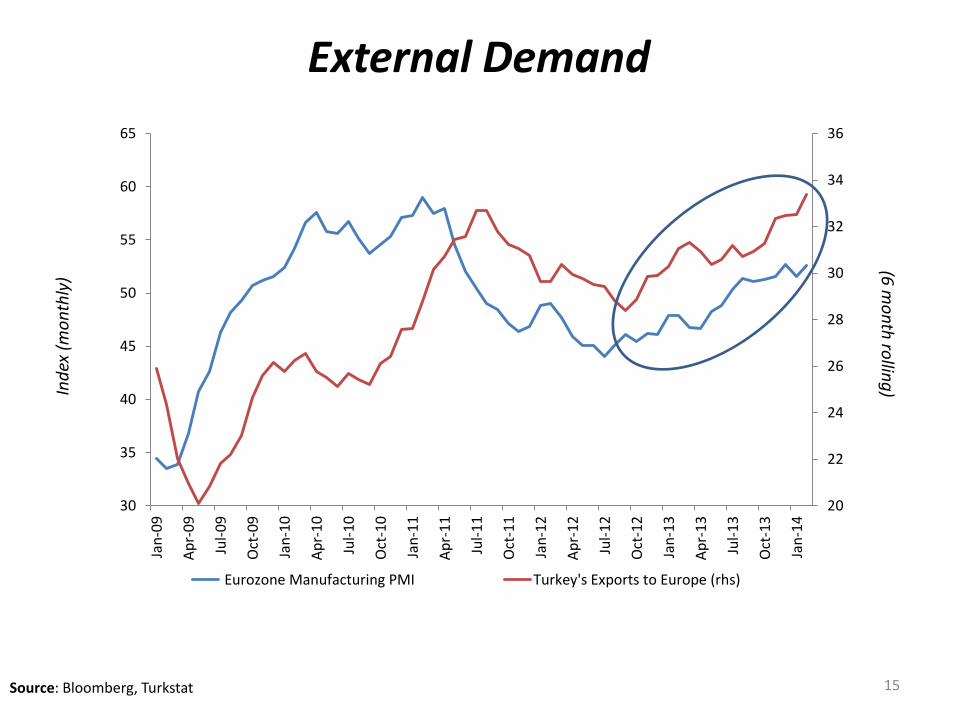
15 Source: Bloomberg, Turkstat
Ind
ex (
mo
nth
ly)
(6 m
on
th ro
lling
)
20
22
24
26
28
30
32
34
36
30
35
40
45
50
55
60
65
Jan
-09
Ap
r-0
9
Jul-
09
Oct
-09
Jan
-10
Ap
r-1
0
Jul-
10
Oct
-10
Jan
-11
Ap
r-1
1
Jul-
11
Oct
-11
Jan
-12
Ap
r-1
2
Jul-
12
Oct
-12
Jan
-13
Ap
r-1
3
Jul-
13
Oct
-13
Jan
-14
Eurozone Manufacturing PMI Turkey's Exports to Europe (rhs)
External Demand
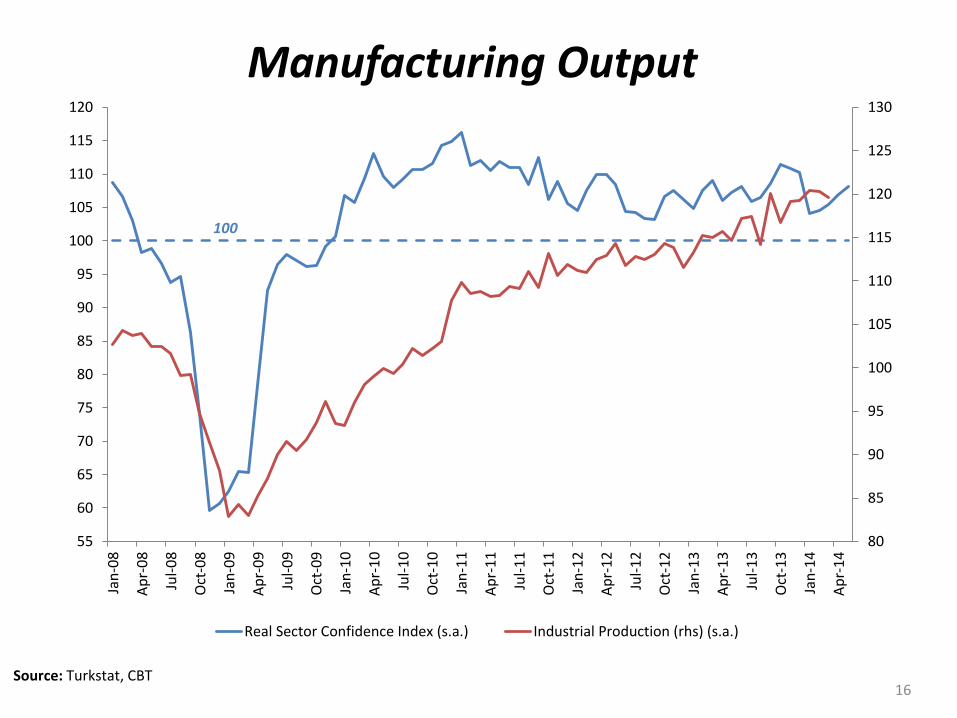
Manufacturing Output
16 Source: Turkstat, CBT
100
80
85
90
95
100
105
110
115
120
125
130
55
60
65
70
75
80
85
90
95
100
105
110
115
120Ja
n-0
8
Ap
r-0
8
Jul-
08
Oct
-08
Jan
-09
Ap
r-0
9
Jul-
09
Oct
-09
Jan
-10
Ap
r-1
0
Jul-
10
Oct
-10
Jan
-11
Ap
r-1
1
Jul-
11
Oct
-11
Jan
-12
Ap
r-1
2
Jul-
12
Oct
-12
Jan
-13
Ap
r-1
3
Jul-
13
Oct
-13
Jan
-14
Ap
r-1
4
Real Sector Confidence Index (s.a.) Industrial Production (rhs) (s.a.)
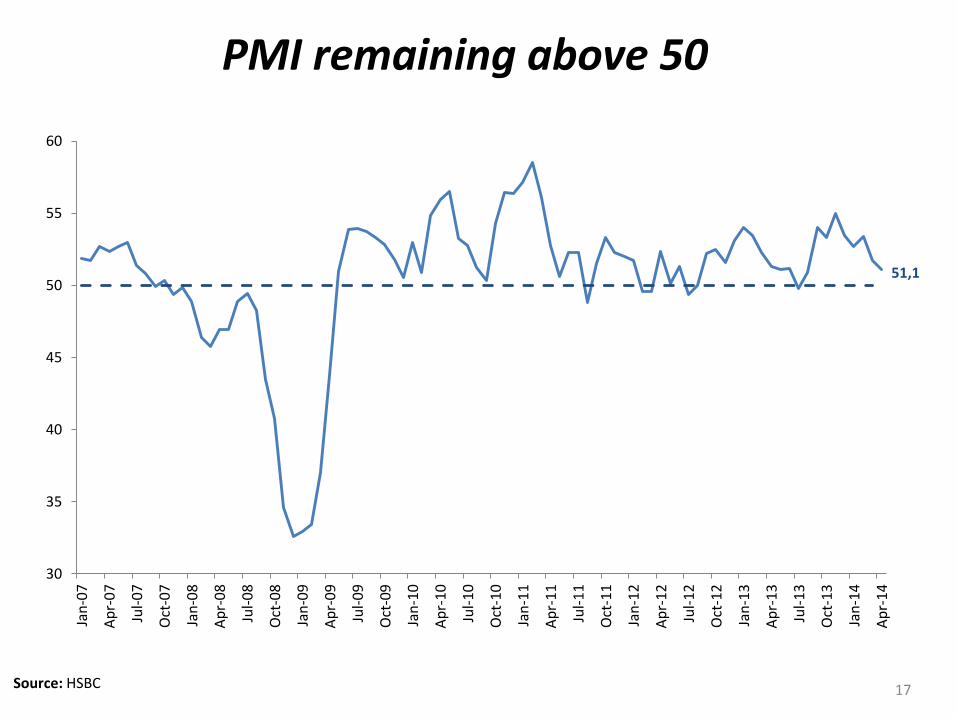
PMI remaining above 50
17 Source: HSBC
51,1
30
35
40
45
50
55
60
Jan
-07
Ap
r-0
7
Jul-
07
Oct
-07
Jan
-08
Ap
r-0
8
Jul-
08
Oct
-08
Jan
-09
Ap
r-0
9
Jul-
09
Oct
-09
Jan
-10
Ap
r-1
0
Jul-
10
Oct
-10
Jan
-11
Ap
r-1
1
Jul-
11
Oct
-11
Jan
-12
Ap
r-1
2
Jul-
12
Oct
-12
Jan
-13
Ap
r-1
3
Jul-
13
Oct
-13
Jan
-14
Ap
r-1
4
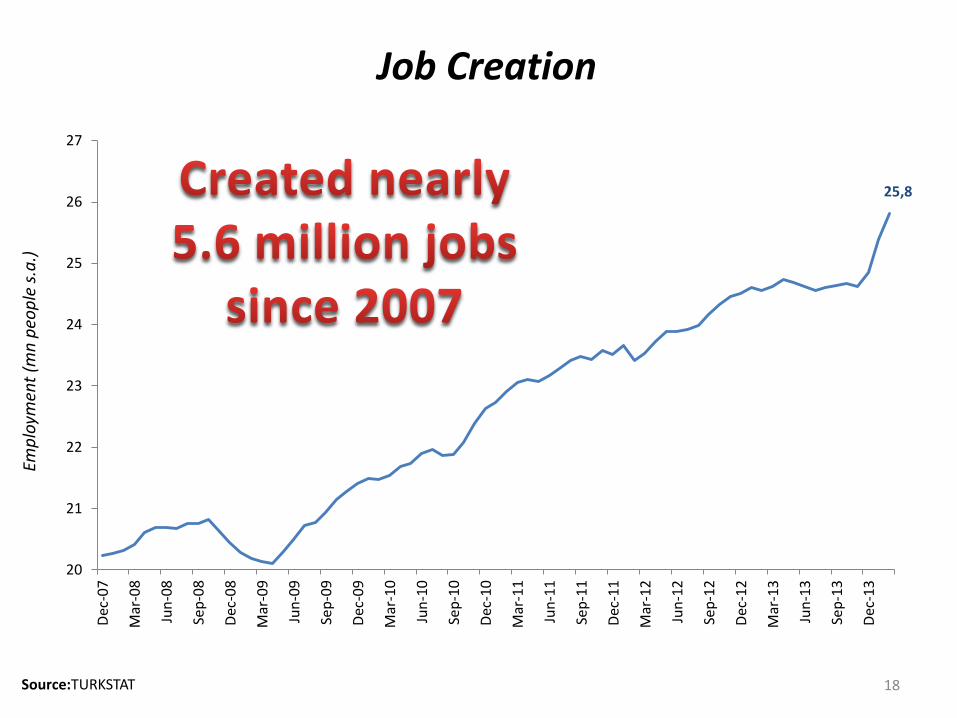
Job Creation Em
plo
ymen
t (m
n p
eop
le s
.a.)
Source:TURKSTAT 18
25,8
20
21
22
23
24
25
26
27
Dec
-07
Mar
-08
Jun
-08
Sep
-08
Dec
-08
Mar
-09
Jun
-09
Sep
-09
Dec
-09
Mar
-10
Jun
-10
Sep
-10
Dec
-10
Mar
-11
Jun
-11
Sep
-11
Dec
-11
Mar
-12
Jun
-12
Sep
-12
Dec
-12
Mar
-13
Jun
-13
Sep
-13
Dec
-13
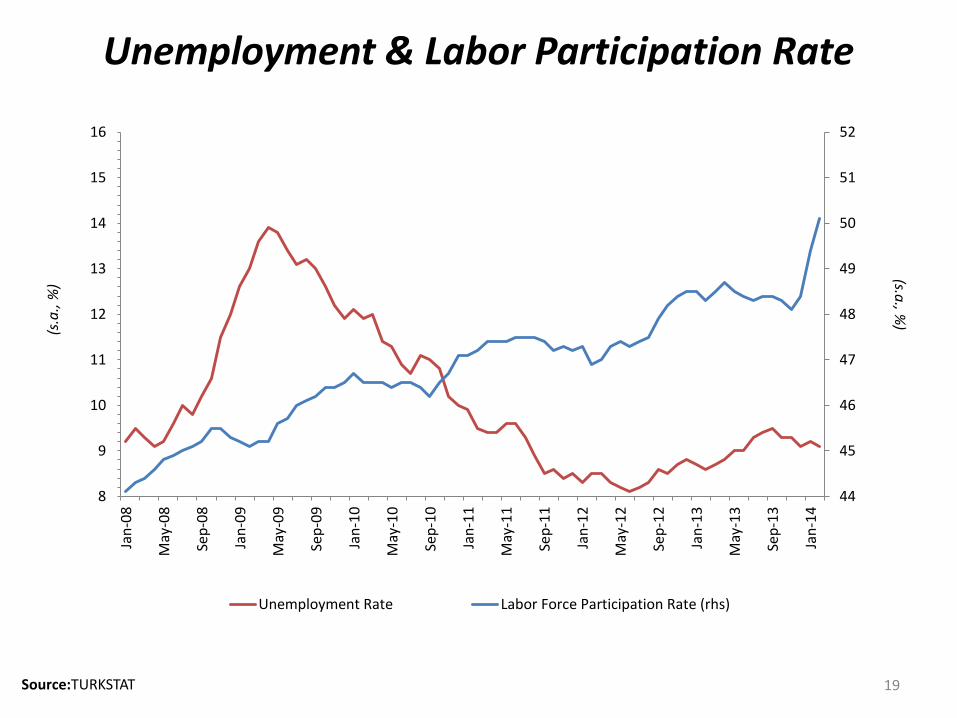
Unemployment & Labor Participation Rate
Source:TURKSTAT
44
45
46
47
48
49
50
51
52
8
9
10
11
12
13
14
15
16Ja
n-0
8
May
-08
Sep
-08
Jan
-09
May
-09
Sep
-09
Jan
-10
May
-10
Sep
-10
Jan
-11
May
-11
Sep
-11
Jan
-12
May
-12
Sep
-12
Jan
-13
May
-13
Sep
-13
Jan
-14
Unemployment Rate Labor Force Participation Rate (rhs)
(s.a., %
) (s.a
., %
)
19
Is the pick up in Inflation Temporary?
20
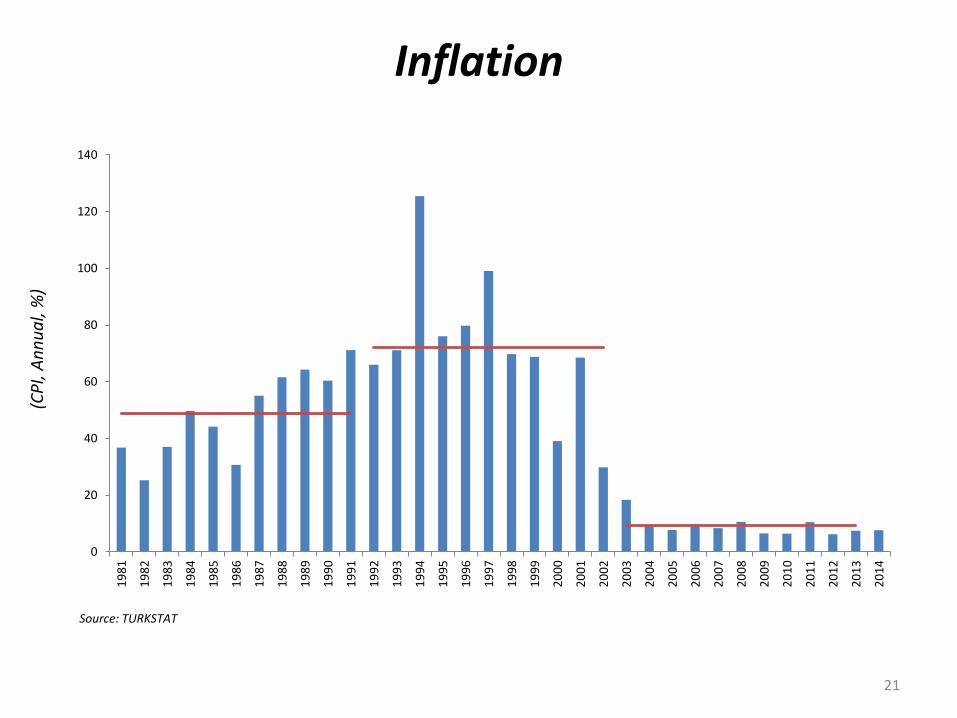
Inflation
0
20
40
60
80
100
120
140
19
81
19
82
19
83
19
84
19
85
19
86
19
87
19
88
19
89
19
90
19
91
19
92
19
93
19
94
19
95
19
96
19
97
19
98
19
99
20
00
20
01
20
02
20
03
20
04
20
05
20
06
20
07
20
08
20
09
20
10
20
11
20
12
20
13
20
14
Source: TURKSTAT
(CP
I, A
nn
ua
l, %
)
21
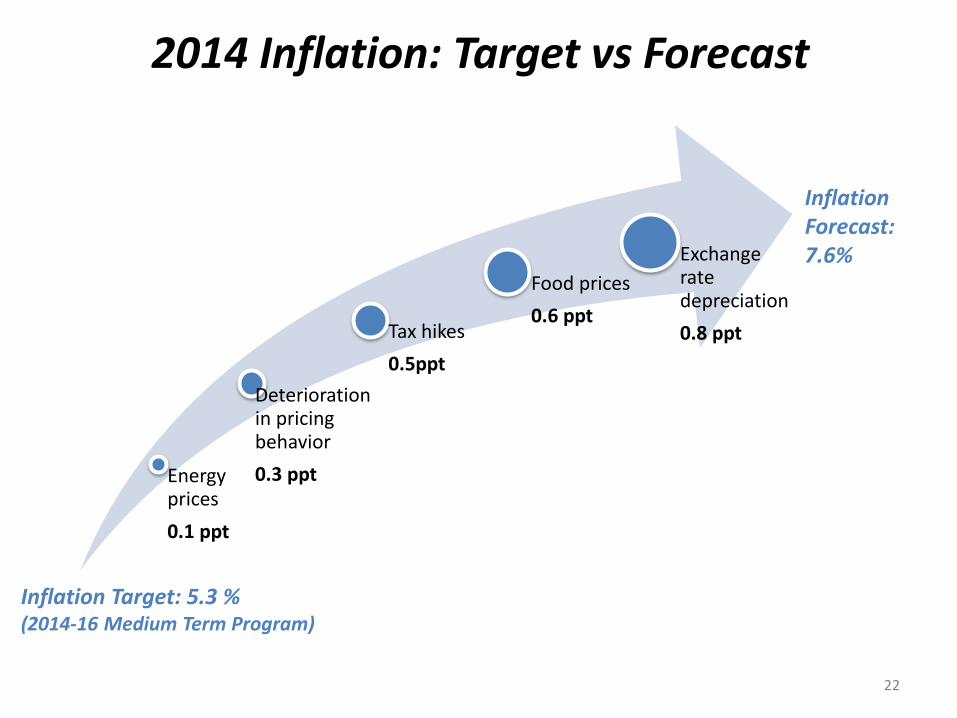
2014 Inflation: Target vs Forecast
Energy prices
0.1 ppt
Deterioration in pricing behavior
0.3 ppt
Tax hikes
0.5ppt
Food prices
0.6 ppt
Exchange rate depreciation
0.8 ppt
Inflation Target: 5.3 % (2014-16 Medium Term Program)
Inflation Forecast: 7.6%
22
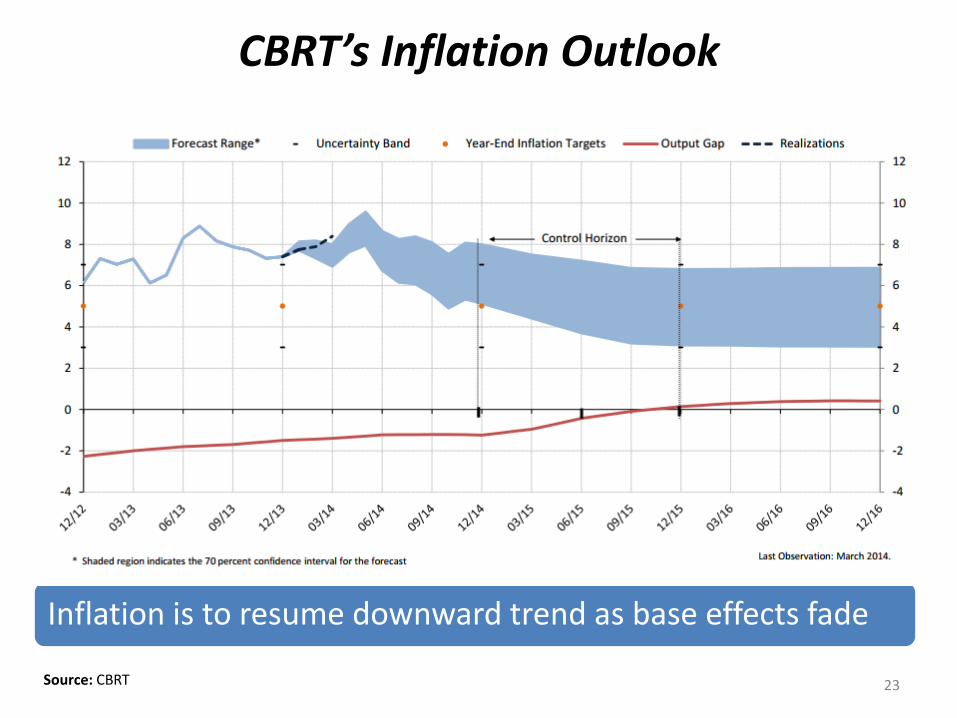
CBRT’s Inflation Outlook
23
Inflation is to resume downward trend as base effects fade
Source: CBRT
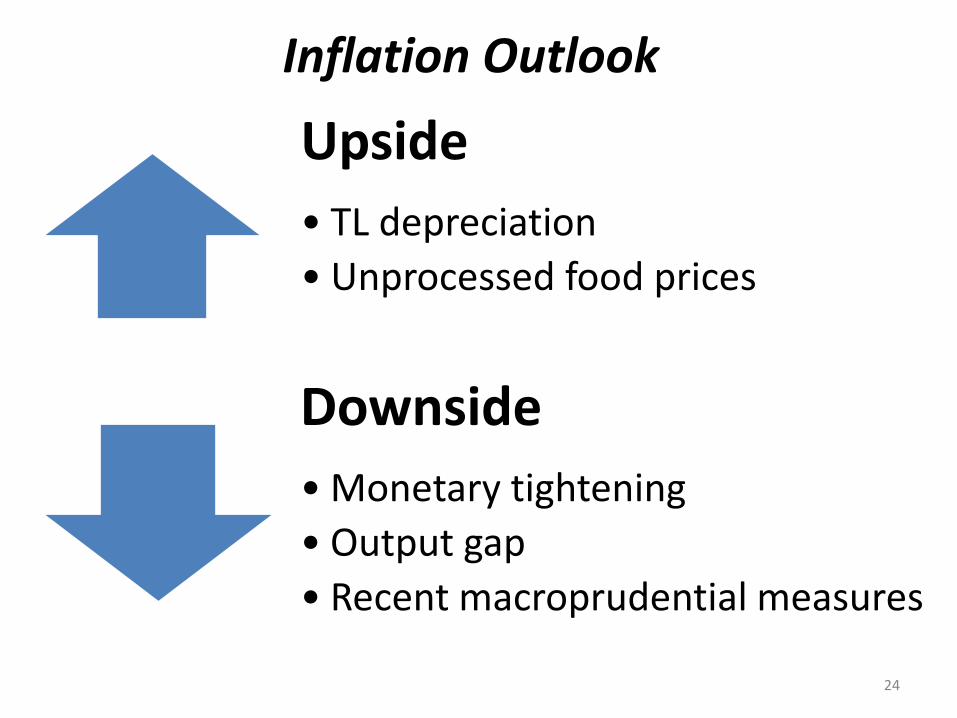
Upside
• TL depreciation
• Unprocessed food prices
Downside
• Monetary tightening
• Output gap
• Recent macroprudential measures
Inflation Outlook
24
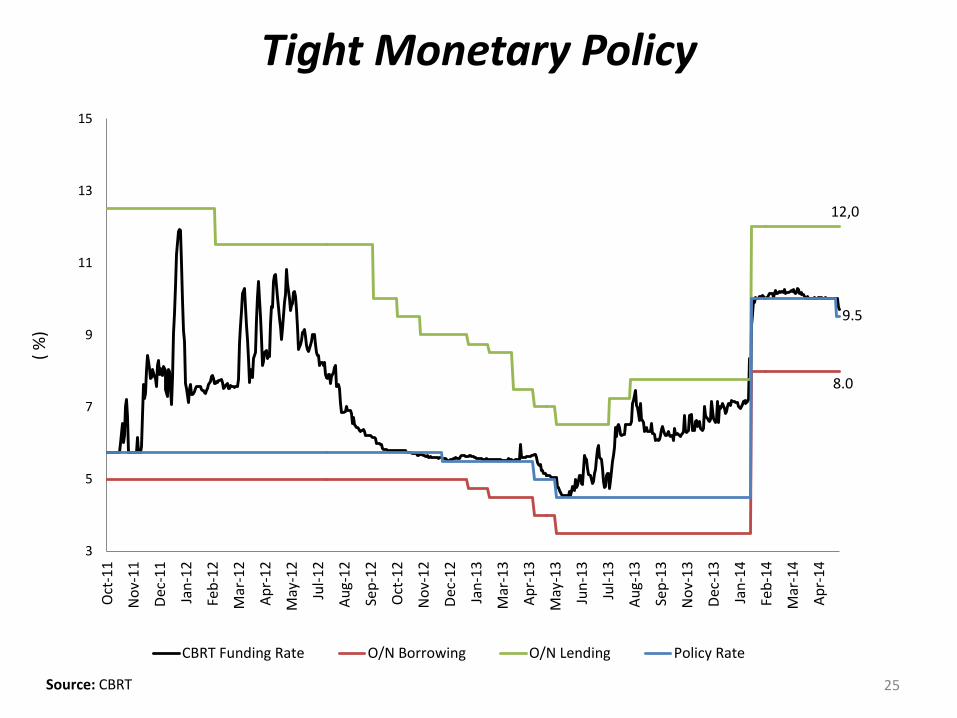
( %
) Tight Monetary Policy
Source: CBRT 25
8.0
12,0
9.5
3
5
7
9
11
13
15O
ct-1
1
No
v-1
1
Dec
-11
Jan
-12
Feb
-12
Mar
-12
Ap
r-1
2
May
-12
Jul-
12
Au
g-1
2
Sep
-12
Oct
-12
No
v-1
2
Dec
-12
Jan
-13
Mar
-13
Ap
r-1
3
May
-13
Jun
-13
Jul-
13
Au
g-1
3
Sep
-13
No
v-1
3
Dec
-13
Jan
-14
Feb
-14
Mar
-14
Ap
r-1
4
CBRT Funding Rate O/N Borrowing O/N Lending Policy Rate
( %
)
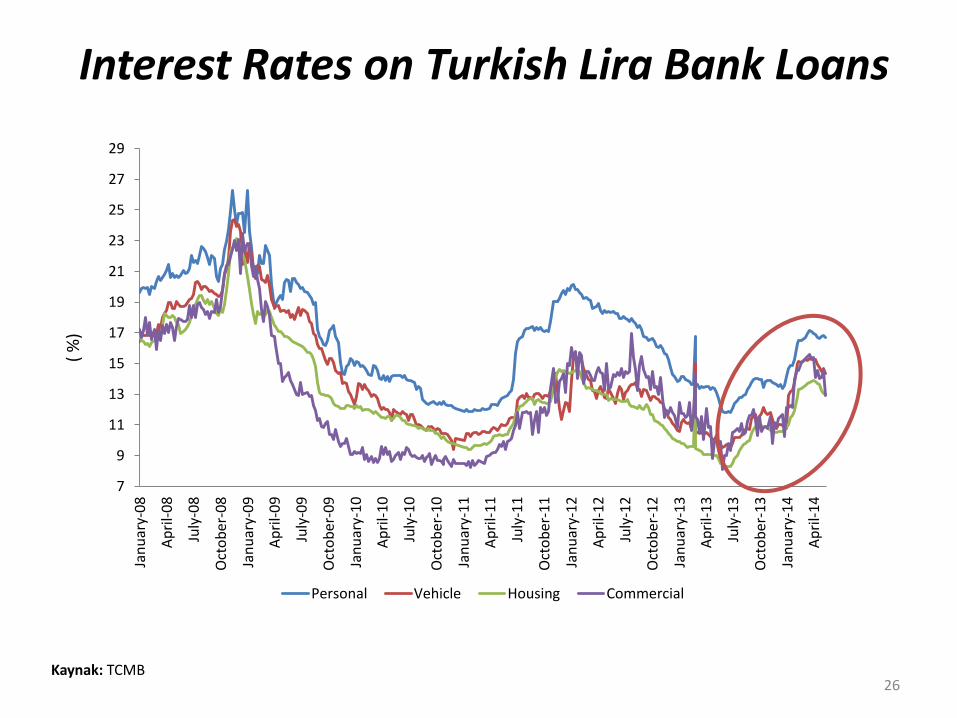
26 Kaynak: TCMB
Interest Rates on Turkish Lira Bank Loans
7
9
11
13
15
17
19
21
23
25
27
29Ja
nu
ary-
08
Ap
ril-
08
July
-08
Oct
ob
er-0
8
Jan
uar
y-0
9
Ap
ril-
09
July
-09
Oct
ob
er-0
9
Jan
uar
y-1
0
Ap
ril-
10
July
-10
Oct
ob
er-1
0
Jan
uar
y-1
1
Ap
ril-
11
July
-11
Oct
ob
er-1
1
Jan
uar
y-1
2
Ap
ril-
12
July
-12
Oct
ob
er-1
2
Jan
uar
y-1
3
Ap
ril-
13
July
-13
Oct
ob
er-1
3
Jan
uar
y-1
4
Ap
ril-
14
Personal Vehicle Housing Commercial
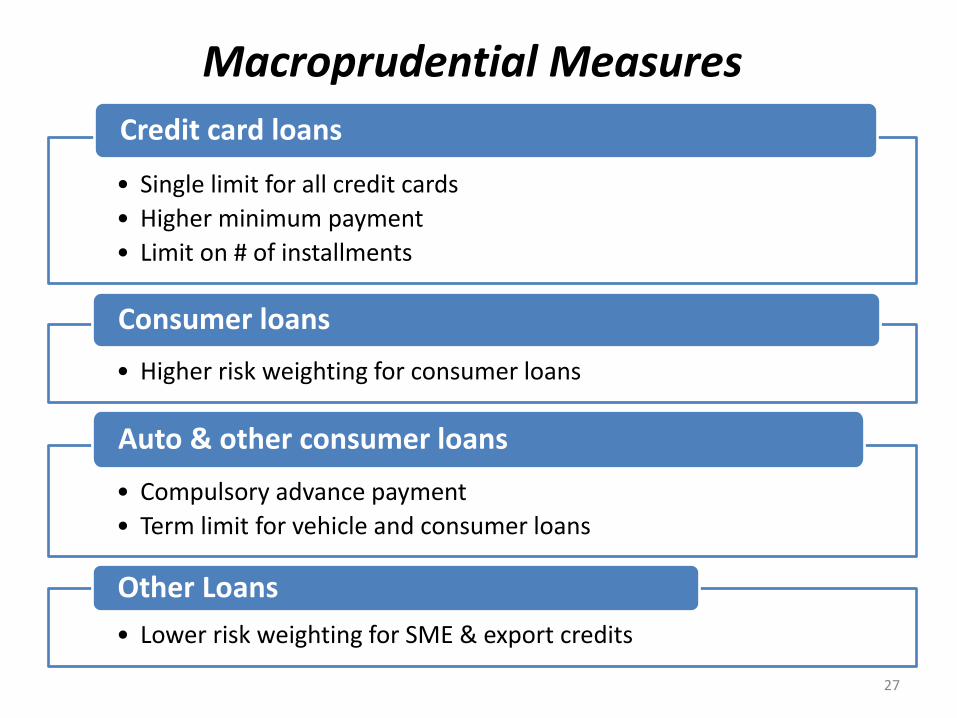
Macroprudential Measures
• Single limit for all credit cards
• Higher minimum payment
• Limit on # of installments
Credit card loans
• Higher risk weighting for consumer loans
Consumer loans
• Compulsory advance payment
• Term limit for vehicle and consumer loans
Auto & other consumer loans
• Lower risk weighting for SME & export credits
Other Loans
27
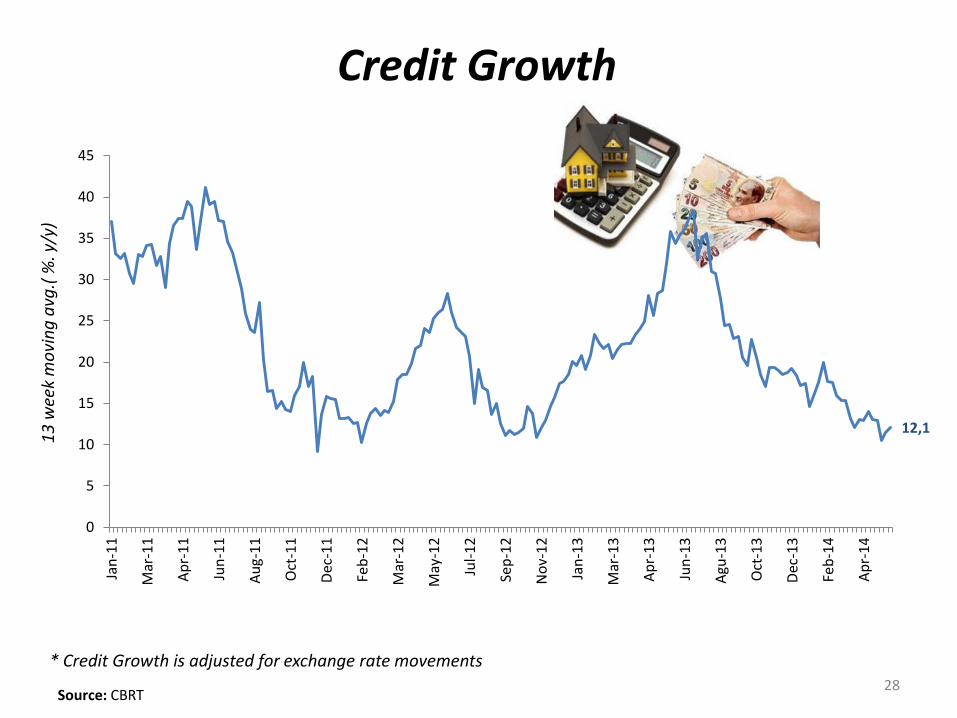
28 Source: CBRT
Credit Growth 1
3 w
eek
mo
vin
g a
vg.(
%. y
/y)
* Credit Growth is adjusted for exchange rate movements
12,1
0
5
10
15
20
25
30
35
40
45
Jan
-11
Mar
-11
Ap
r-1
1
Jun
-11
Au
g-1
1
Oct
-11
Dec
-11
Feb
-12
Mar
-12
May
-12
Jul-
12
Sep
-12
No
v-1
2
Jan
-13
Mar
-13
Ap
r-1
3
Jun
-13
Agu
-13
Oct
-13
Dec
-13
Feb
-14
Ap
r-1
4
Turkey’s Soft Spot – Getting Fixed?
29
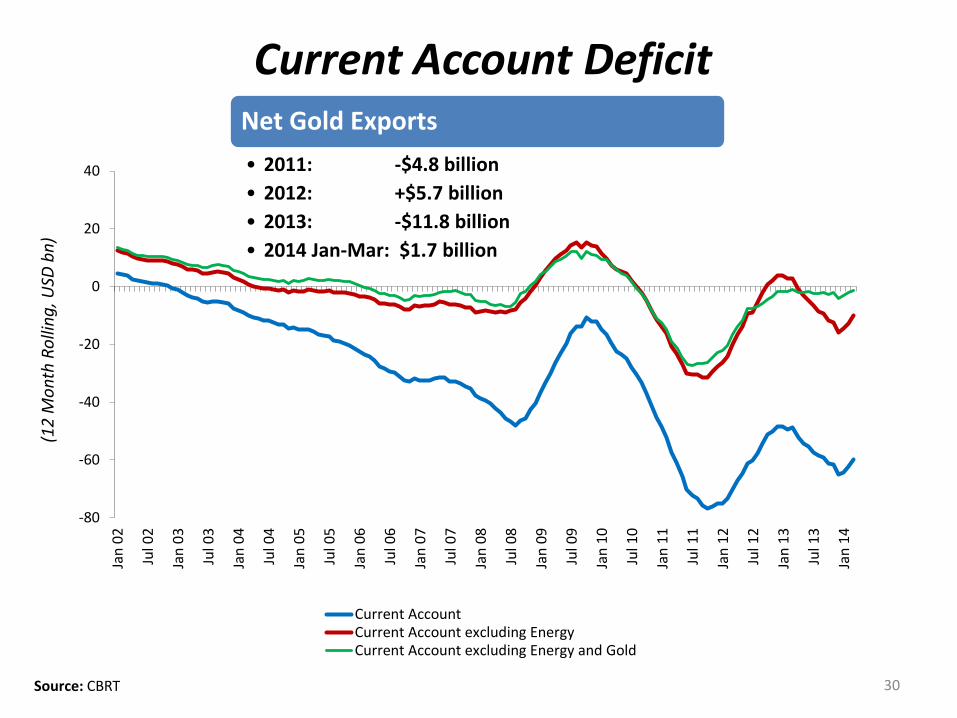
Current Account Deficit
Source: CBRT 30
(12
Mo
nth
Ro
llin
g, U
SD b
n)
-80
-60
-40
-20
0
20
40
Jan
02
Jul 0
2
Jan
03
Jul 0
3
Jan
04
Jul 0
4
Jan
05
Jul 0
5
Jan
06
Jul 0
6
Jan
07
Jul 0
7
Jan
08
Jul 0
8
Jan
09
Jul 0
9
Jan
10
Jul 1
0
Jan
11
Jul 1
1
Jan
12
Jul 1
2
Jan
13
Jul 1
3
Jan
14
Current AccountCurrent Account excluding EnergyCurrent Account excluding Energy and Gold
Net Gold Exports
• 2011: -$4.8 billion
• 2012: +$5.7 billion
• 2013: -$11.8 billion
• 2014 Jan-Mar: $1.7 billion
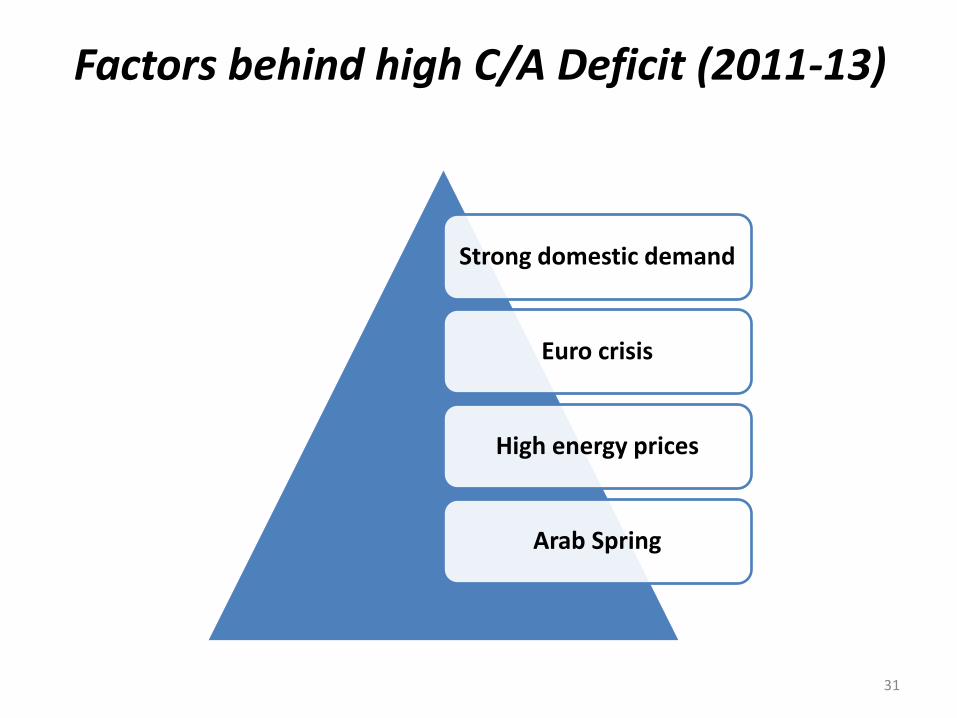
Factors behind high C/A Deficit (2011-13)
Strong domestic demand
Euro crisis
High energy prices
Arab Spring
31
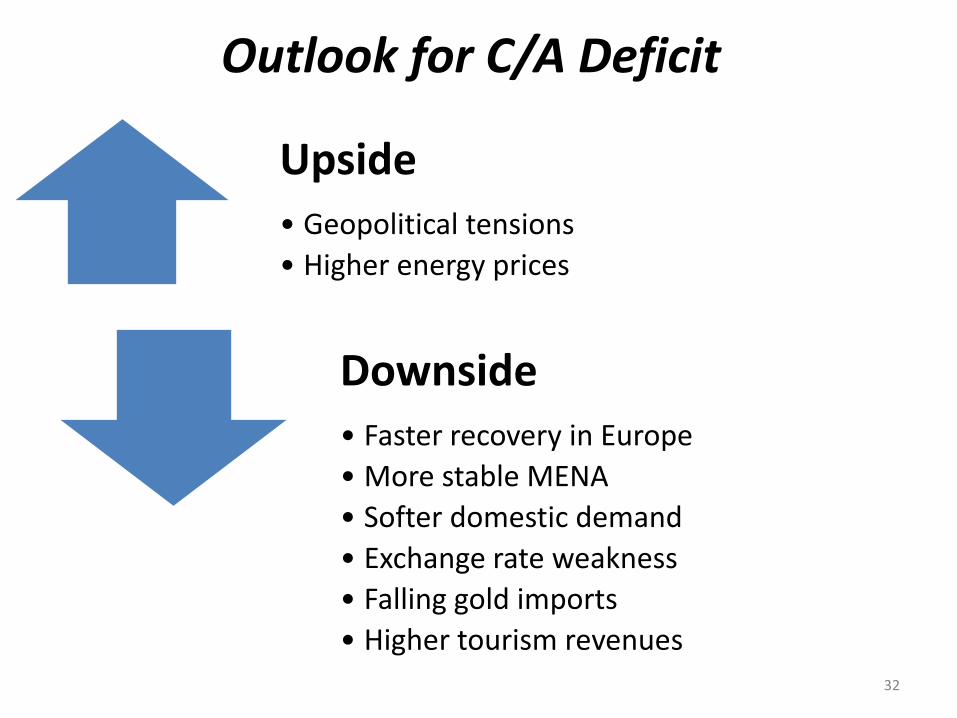
Upside • Geopolitical tensions
• Higher energy prices
Downside
• Faster recovery in Europe
• More stable MENA
• Softer domestic demand
• Exchange rate weakness
• Falling gold imports
• Higher tourism revenues
Outlook for C/A Deficit
32

Should we be worried about Open FX Positions?
33
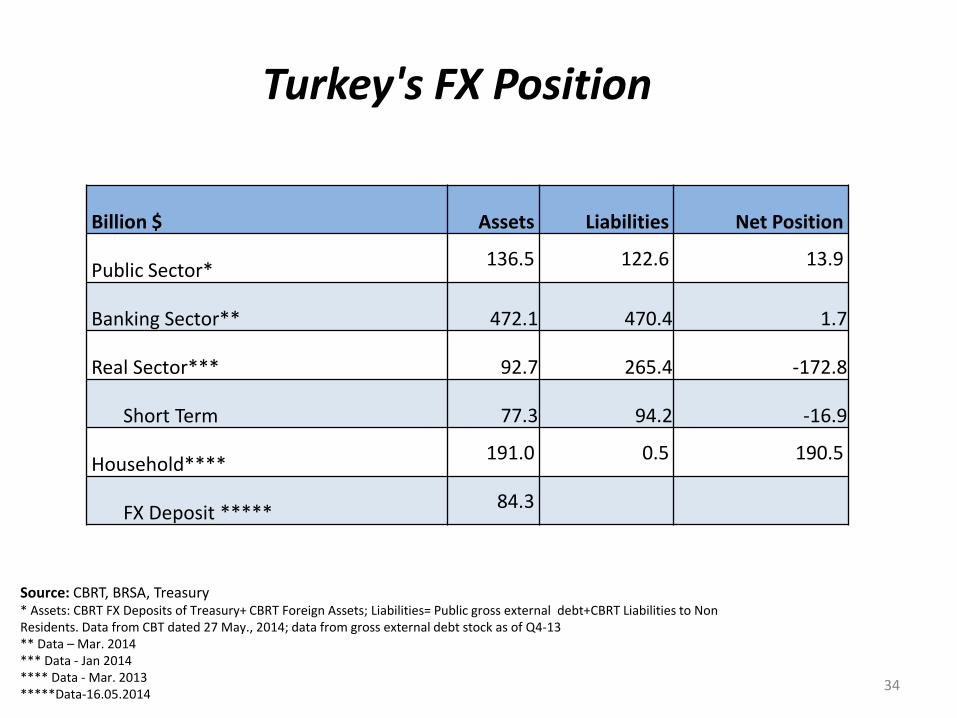
Turkey's FX Position
Source: CBRT, BRSA, Treasury * Assets: CBRT FX Deposits of Treasury+ CBRT Foreign Assets; Liabilities= Public gross external debt+CBRT Liabilities to Non Residents. Data from CBT dated 27 May., 2014; data from gross external debt stock as of Q4-13
** Data – Mar. 2014
*** Data - Jan 2014 **** Data - Mar. 2013
*****Data-16.05.2014
Billion $ Assets Liabilities Net Position
Public Sector* 136.5 122.6 13.9
Banking Sector** 472.1 470.4 1.7
Real Sector*** 92.7 265.4 -172.8
Short Term 77.3 94.2 -16.9
Household**** 191.0 0.5 190.5
FX Deposit ***** 84.3
34
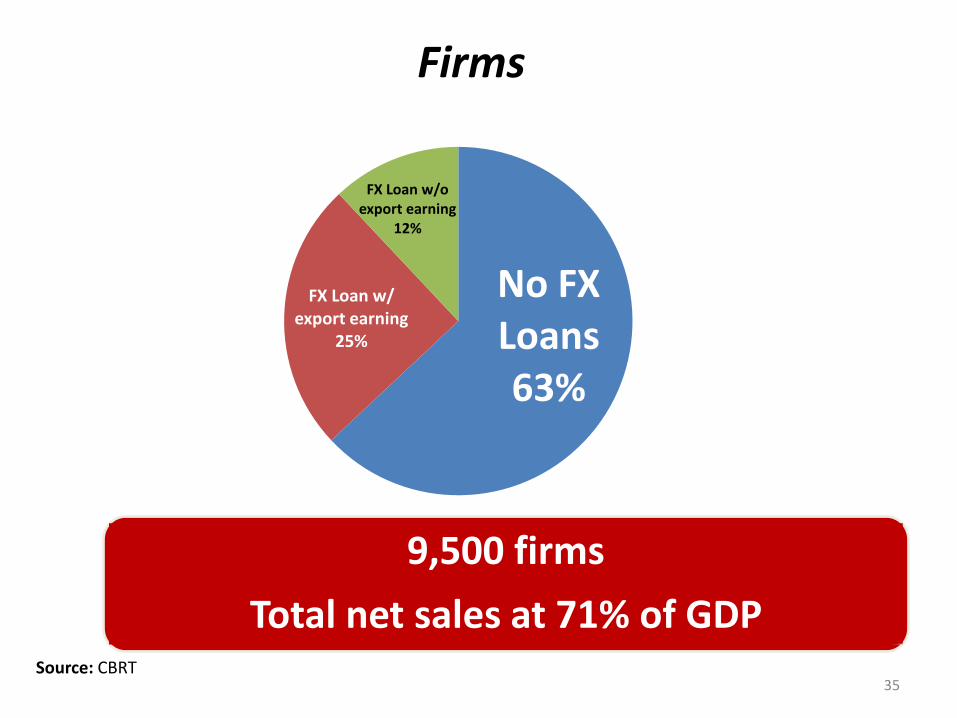
Firms
Source: CBRT
No FX Loans 63%
FX Loan w/ export earning
25%
FX Loan w/o export earning
12%
9,500 firms
Total net sales at 71% of GDP
35
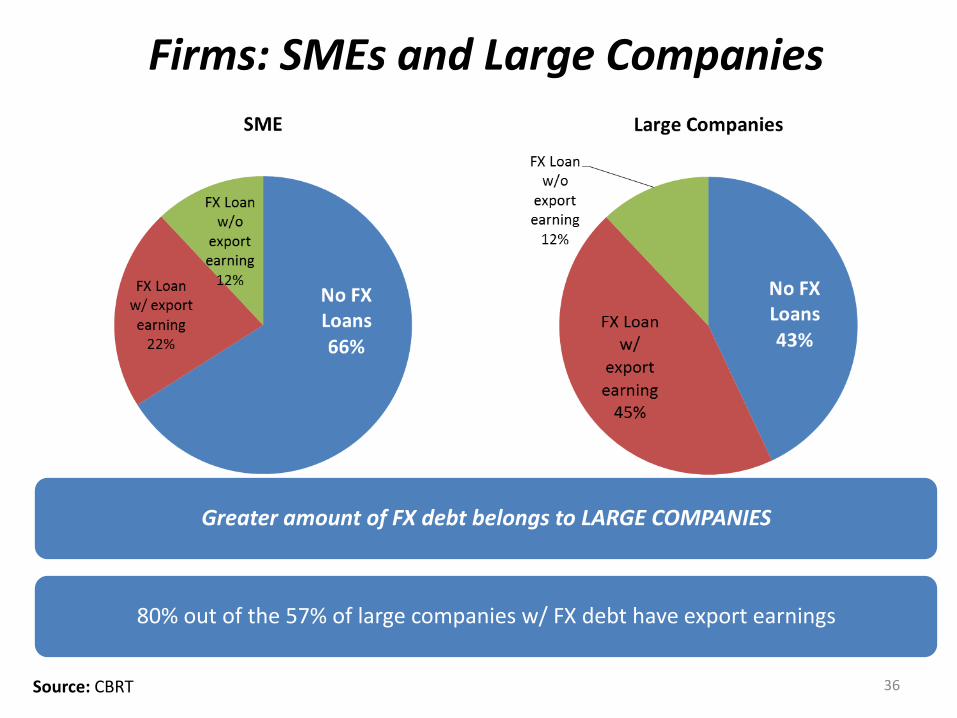
Firms: SMEs and Large Companies
Greater amount of FX debt belongs to LARGE COMPANIES
80% out of the 57% of large companies w/ FX debt have export earnings
Source: CBRT 36
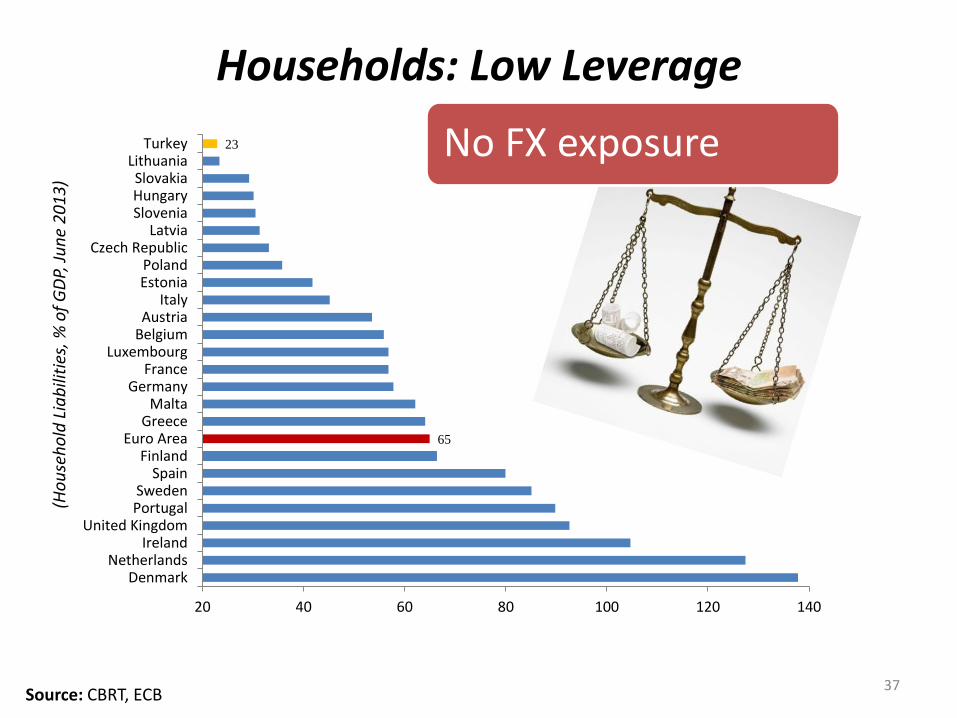
Households: Low Leverage
Source: CBRT, ECB
(Ho
use
ho
ld L
iab
iliti
es, %
of
GD
P, J
un
e 2
01
3)
No FX exposure
65
23
20 40 60 80 100 120 140
DenmarkNetherlands
IrelandUnited Kingdom
PortugalSweden
SpainFinland
Euro AreaGreece
MaltaGermany
FranceLuxembourg
BelgiumAustria
ItalyEstoniaPoland
Czech RepublicLatvia
SloveniaHungarySlovakia
LithuaniaTurkey
37
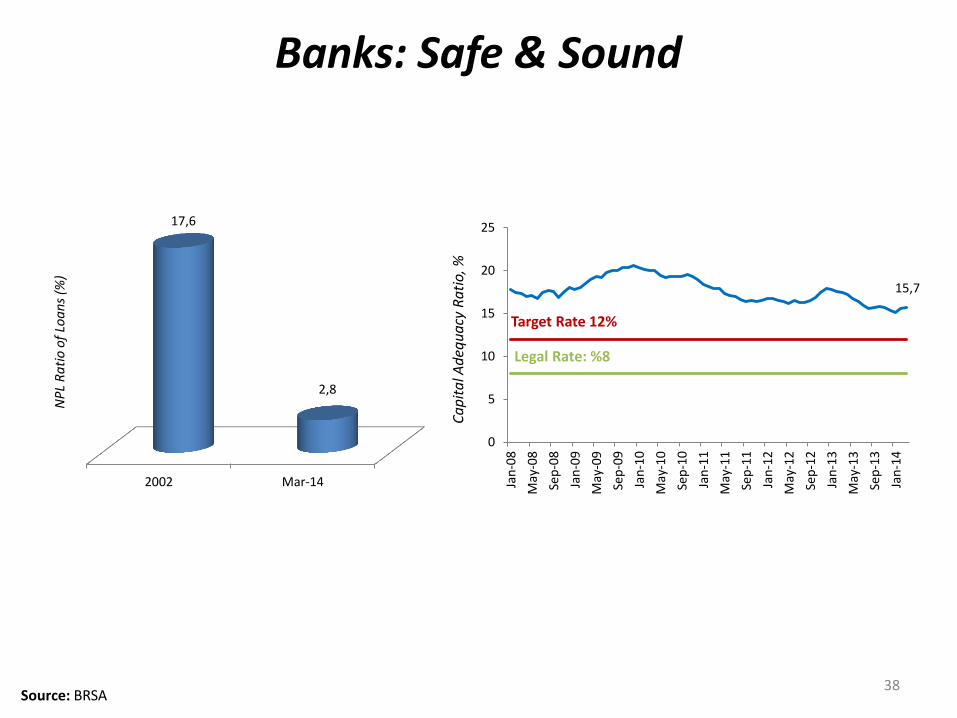
Banks: Safe & Sound
Ca
pit
al A
deq
ua
cy R
ati
o, %
2002 Mar-14
17,6
2,8
NP
L R
ati
o o
f Lo
an
s (%
)
15,7
0
5
10
15
20
25
Jan
-08
May
-08
Sep
-08
Jan
-09
May
-09
Sep
-09
Jan
-10
May
-10
Sep
-10
Jan
-11
May
-11
Sep
-11
Jan
-12
May
-12
Sep
-12
Jan
-13
May
-13
Sep
-13
Jan
-14
Legal Rate: %8
Target Rate 12%
Source: BRSA 38
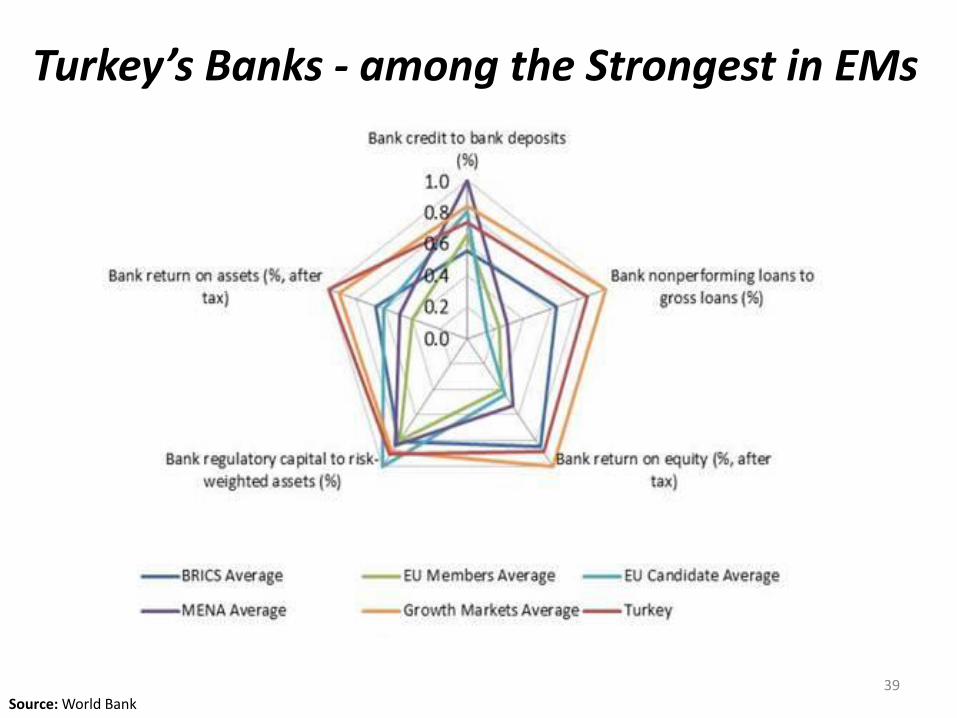
Turkey’s Banks - among the Strongest in EMs
39 Source: World Bank
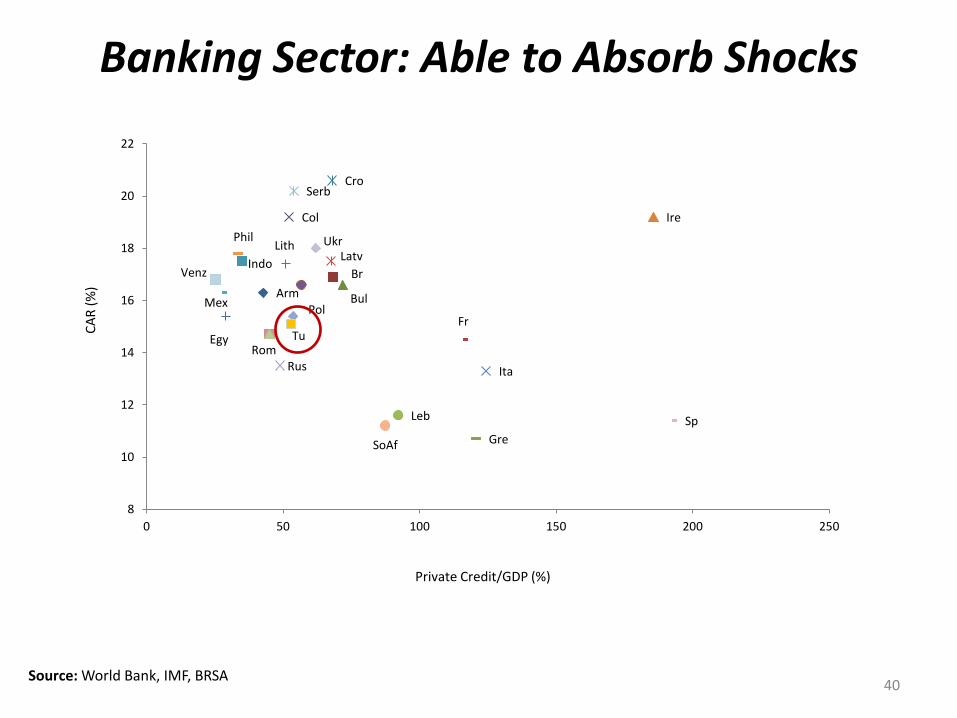
Source: World Bank, IMF, BRSA
Banking Sector: Able to Absorb Shocks
Arm
Br
Bul
Col
Cro
Egy
Fr
Gre
Indo
Ire
Ita
Latv
Leb
Lith
Mex
Phil
Pol
Rom Rus
Serb
SoAf
Sp
Tu
Ukr
Venz
8
10
12
14
16
18
20
22
0 50 100 150 200 250
Private Credit/GDP (%)
CA
R (
%)
40

Fiscally:
Room to Manoeuvre
41
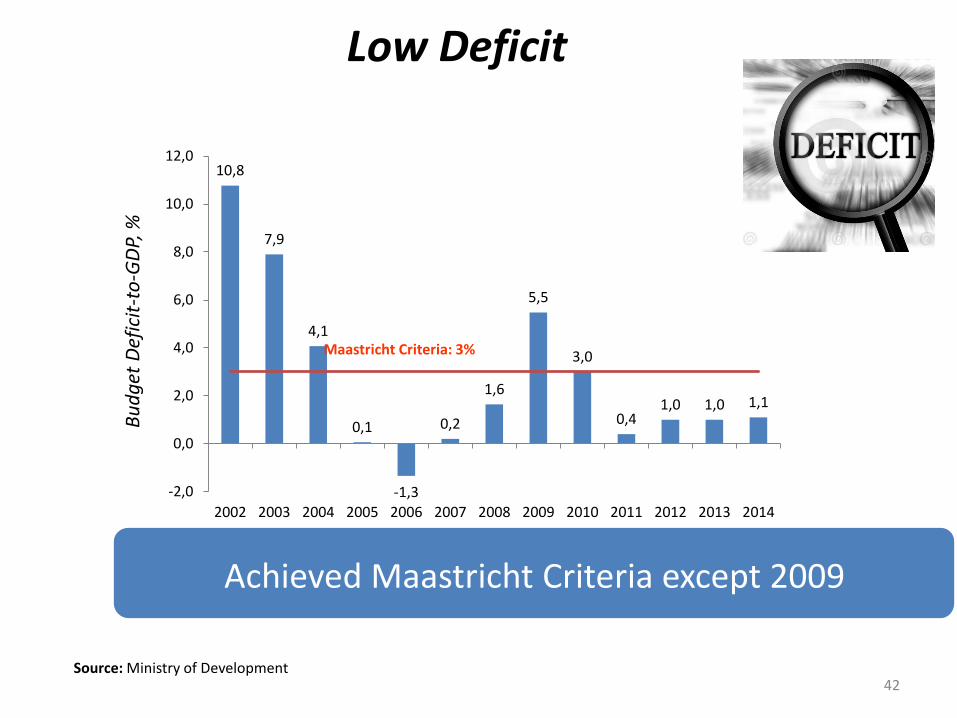
10,8
7,9
4,1
0,1
-1,3
0,2
1,6
5,5
3,0
0,4 1,0 1,0 1,1
-2,0
0,0
2,0
4,0
6,0
8,0
10,0
12,0
2002 2003 2004 2005 2006 2007 2008 2009 2010 2011 2012 2013 2014
Maastricht Criteria: 3%
Achieved Maastricht Criteria except 2009
Source: Ministry of Development
Bu
dg
et D
efic
it-t
o-G
DP,
%
Low Deficit
42
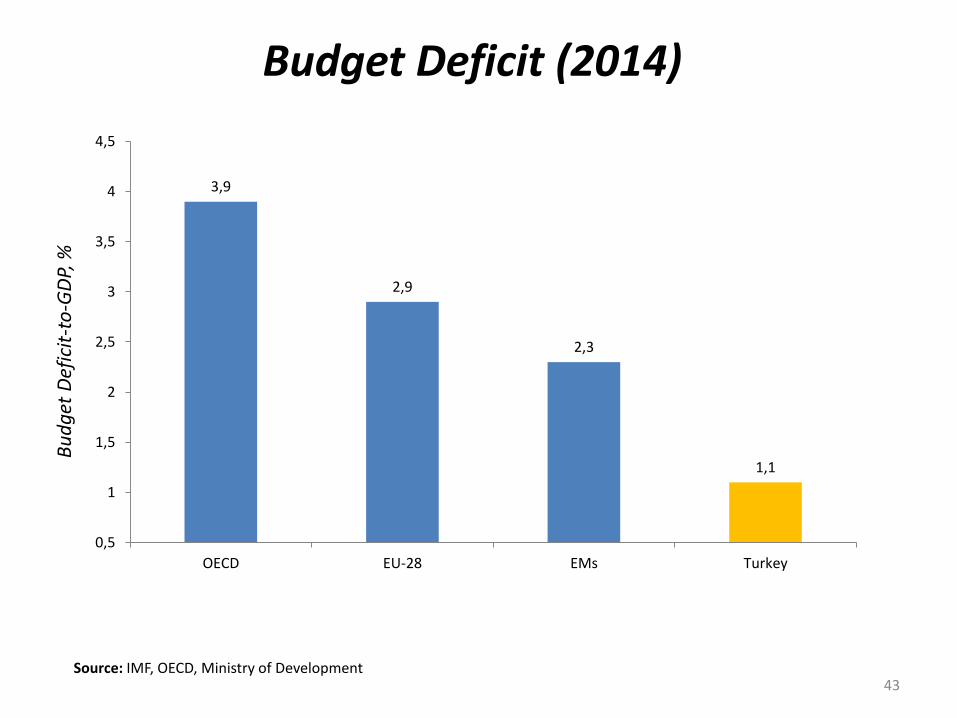
Budget Deficit (2014) B
ud
get
Def
icit
-to
-GD
P, %
Source: IMF, OECD, Ministry of Development
3,9
2,9
2,3
1,1
0,5
1
1,5
2
2,5
3
3,5
4
4,5
OECD EU-28 EMs Turkey
43
44
Upside
• Conservative revenue assumptions
• Outperformance in non-tax revenues
• Improving tax compliance
Downside
• Weaker domestic demand
• Higher VAT rebates
Fiscal Outlook
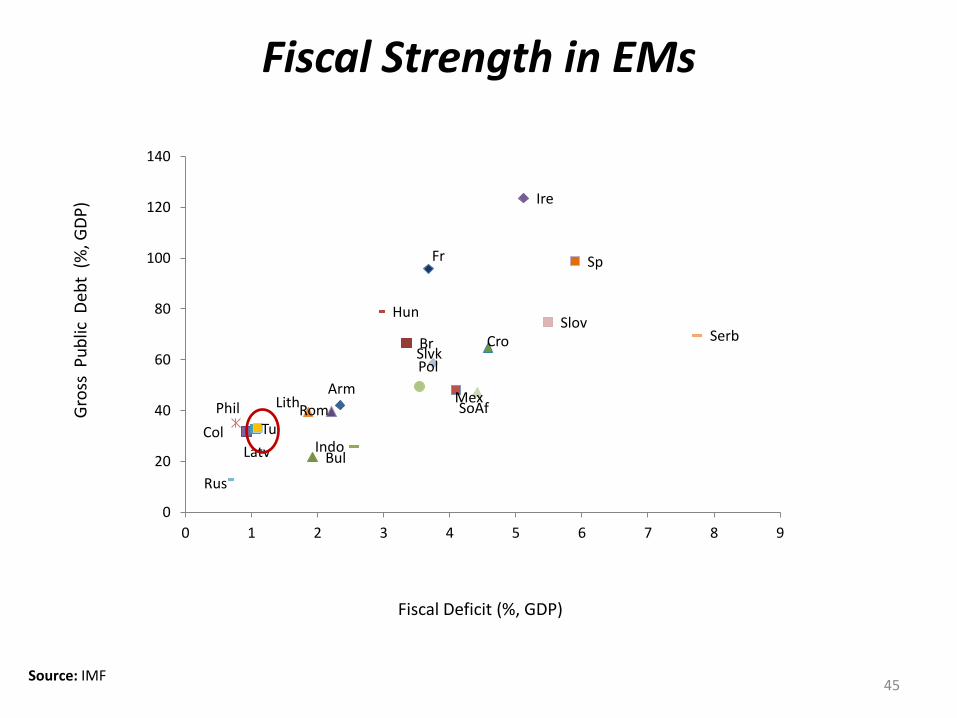
Source: IMF
Fiscal Strength in EMs G
ross
Pu
blic
Deb
t (
%, G
DP
)
Fiscal Deficit (%, GDP)
Arm
Br
Bul
Col
Cro
Fr
Hun
Indo
Ire
Latv
Lith Mex Phil
Pol
Rom
Rus
Serb Slvk
Slov
SoAf
Sp
Tu
0
20
40
60
80
100
120
140
0 1 2 3 4 5 6 7 8 9
45
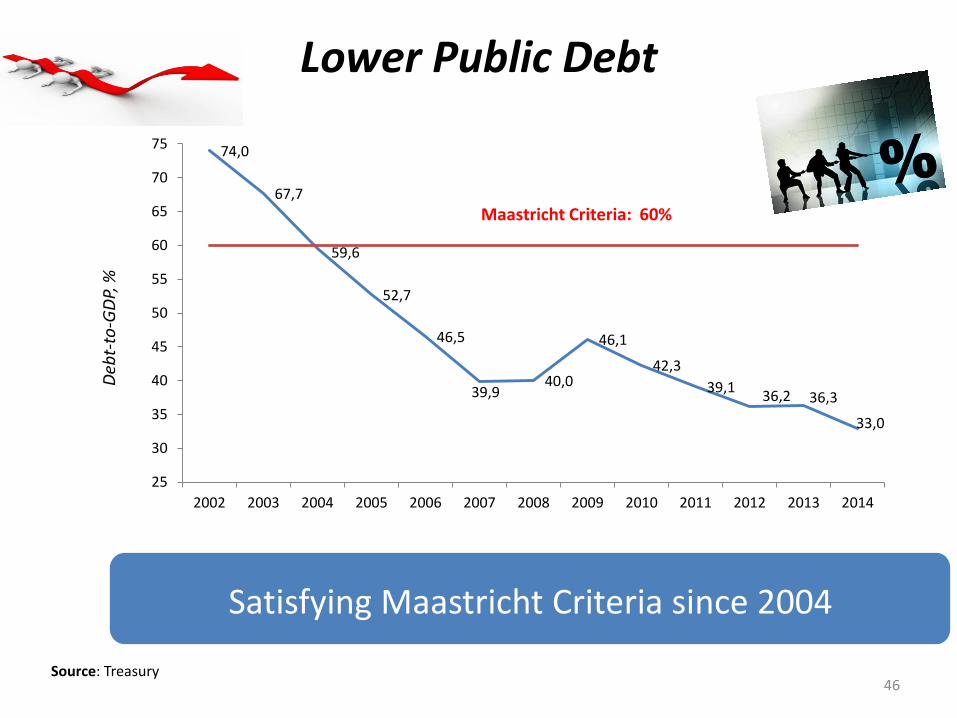
74,0
67,7
59,6
52,7
46,5
39,9 40,0
46,1
42,3
39,1 36,2 36,3
33,0
25
30
35
40
45
50
55
60
65
70
75
2002 2003 2004 2005 2006 2007 2008 2009 2010 2011 2012 2013 2014
Lower Public Debt D
ebt-
to-G
DP,
%
Satisfying Maastricht Criteria since 2004
Maastricht Criteria: 60%
Source: Treasury 46
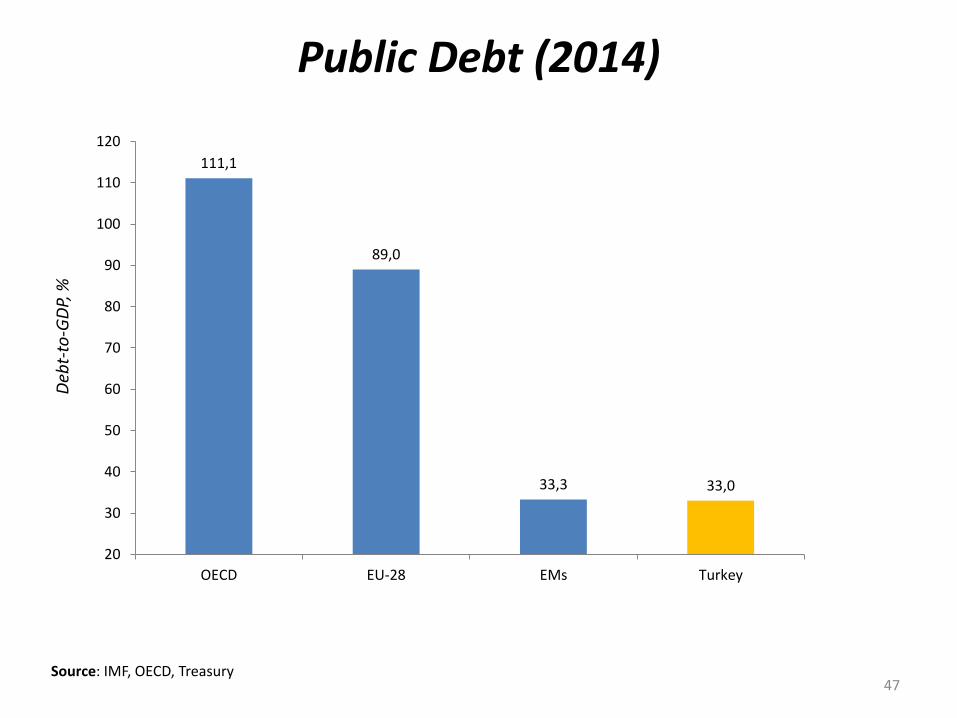
Public Debt (2014)
Source: IMF, OECD, Treasury
Deb
t-to
-GD
P, %
111,1
89,0
33,3 33,0
20
30
40
50
60
70
80
90
100
110
120
OECD EU-28 EMs Turkey
47
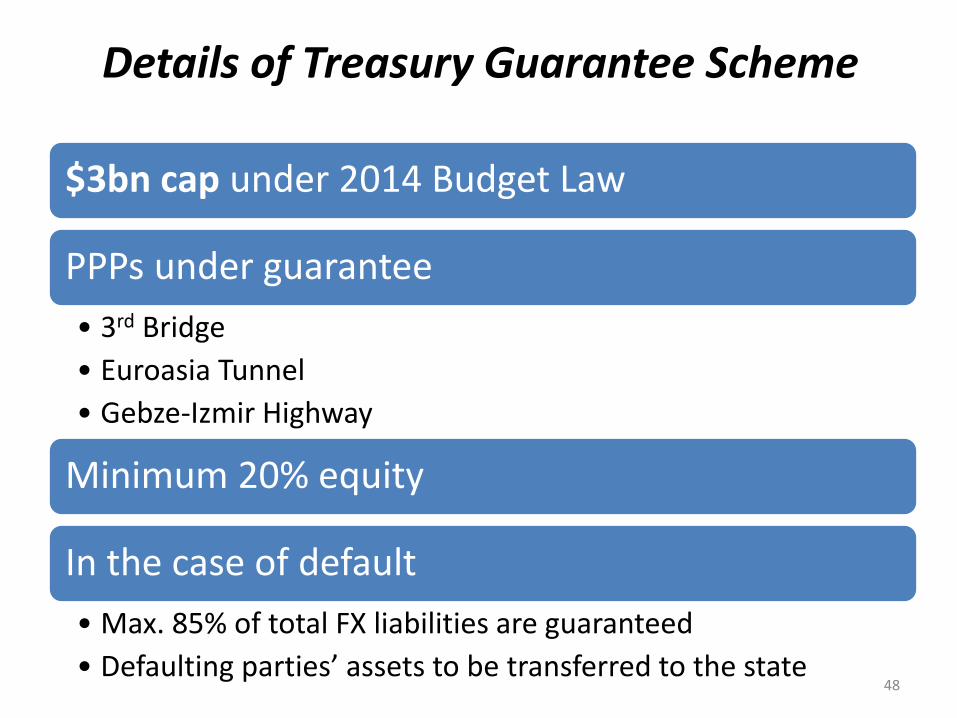
Details of Treasury Guarantee Scheme
$3bn cap under 2014 Budget Law
PPPs under guarantee
• 3rd Bridge
• Euroasia Tunnel
• Gebze-Izmir Highway
Minimum 20% equity
In the case of default
• Max. 85% of total FX liabilities are guaranteed
• Defaulting parties’ assets to be transferred to the state 48

Priorities & Reform Agenda
49
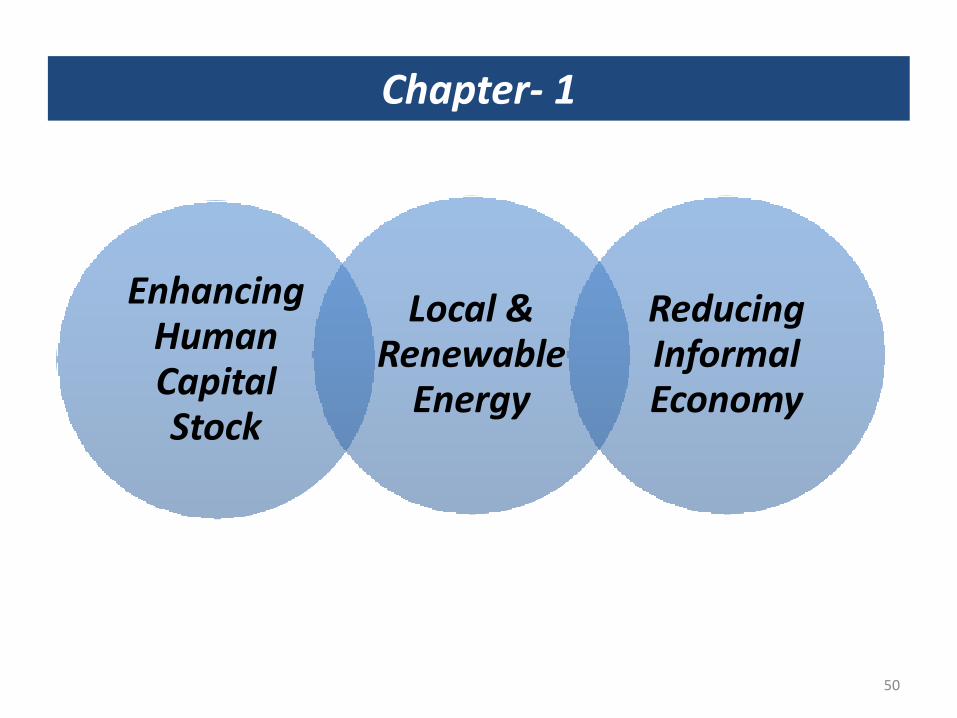
Chapter- 1
Enhancing Human Capital Stock
Local & Renewable
Energy
Reducing Informal Economy
50
Enhancing Human Capital Stock
51
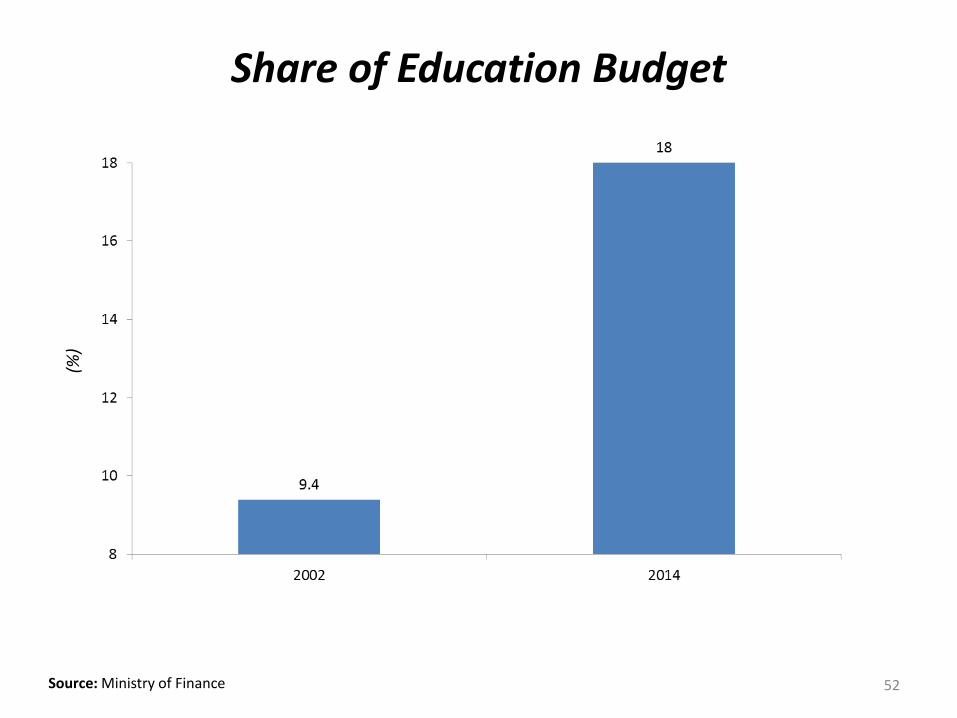
Source: Ministry of Finance
Share of Education Budget (%
)
52
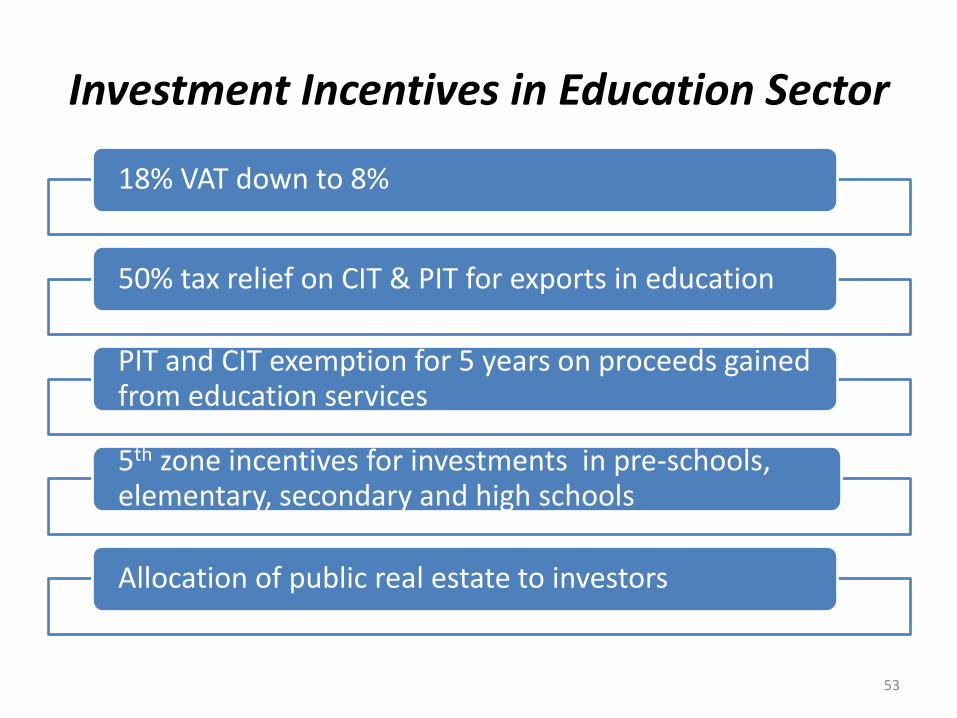
Investment Incentives in Education Sector
18% VAT down to 8%
50% tax relief on CIT & PIT for exports in education
PIT and CIT exemption for 5 years on proceeds gained from education services
5th zone incentives for investments in pre-schools, elementary, secondary and high schools
Allocation of public real estate to investors
53
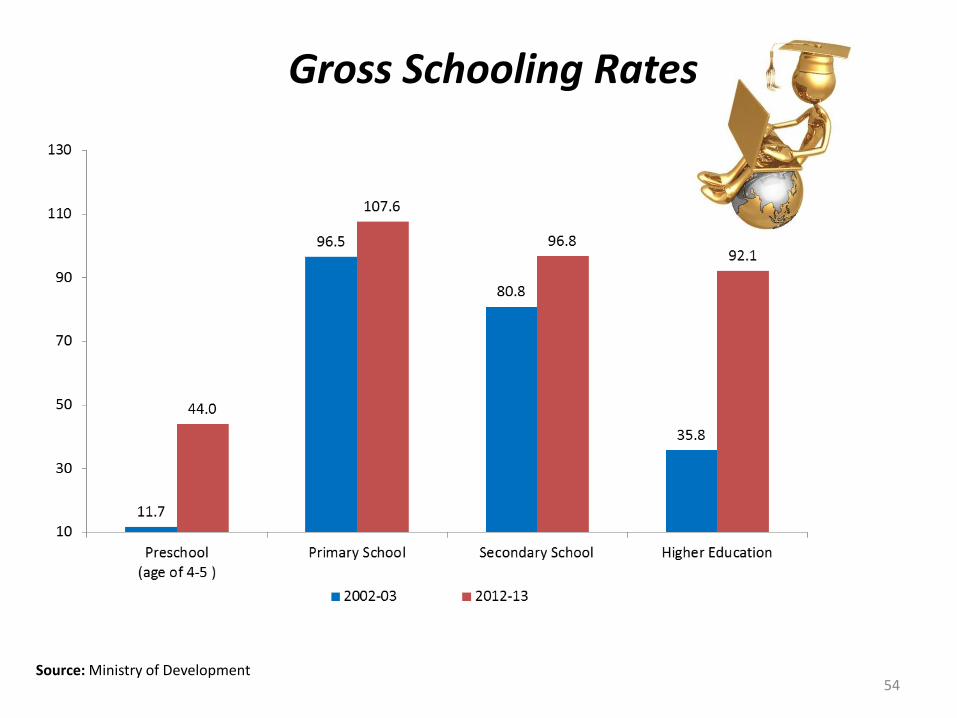
Gross Schooling Rates
Source: Ministry of Development 54
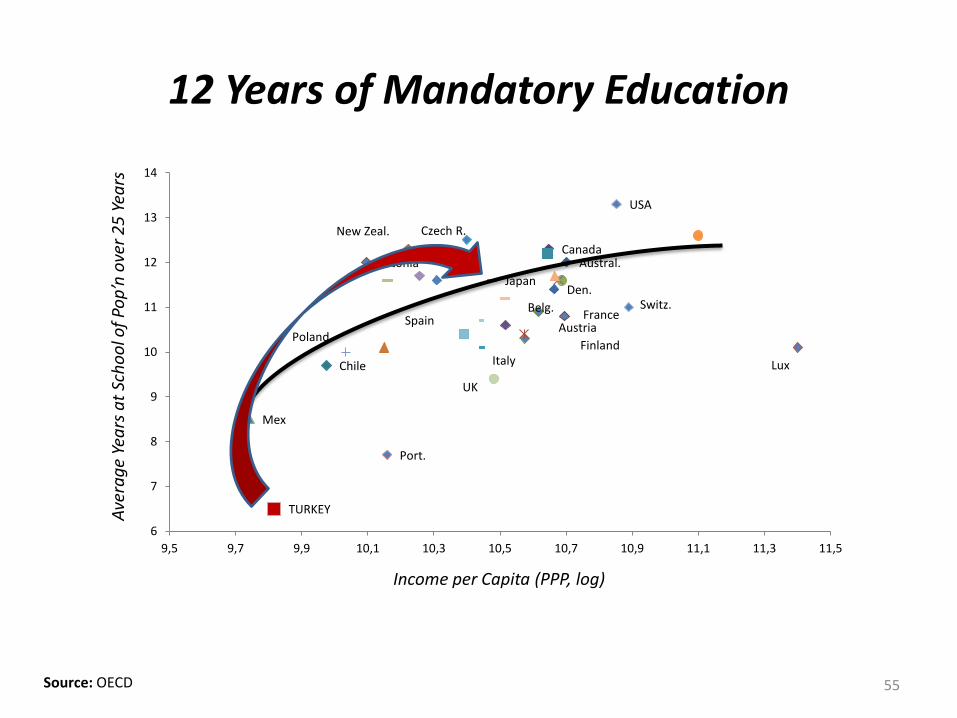
12 Years of Mandatory Education
Austral.
Austria
Belg.
Canada
Chile
Czech R.
Den.
Estonia
Finland
France
Italy
Japan
Lux
Mex
New Zeal.
Poland
Port.
Spain Switz.
TURKEY
UK
USA
6
7
8
9
10
11
12
13
14
9,5 9,7 9,9 10,1 10,3 10,5 10,7 10,9 11,1 11,3 11,5
Ave
rag
e Ye
ars
at
Sch
oo
l of
Pop
’n o
ver
25
Yea
rs
Income per Capita (PPP, log)
Source: OECD 55
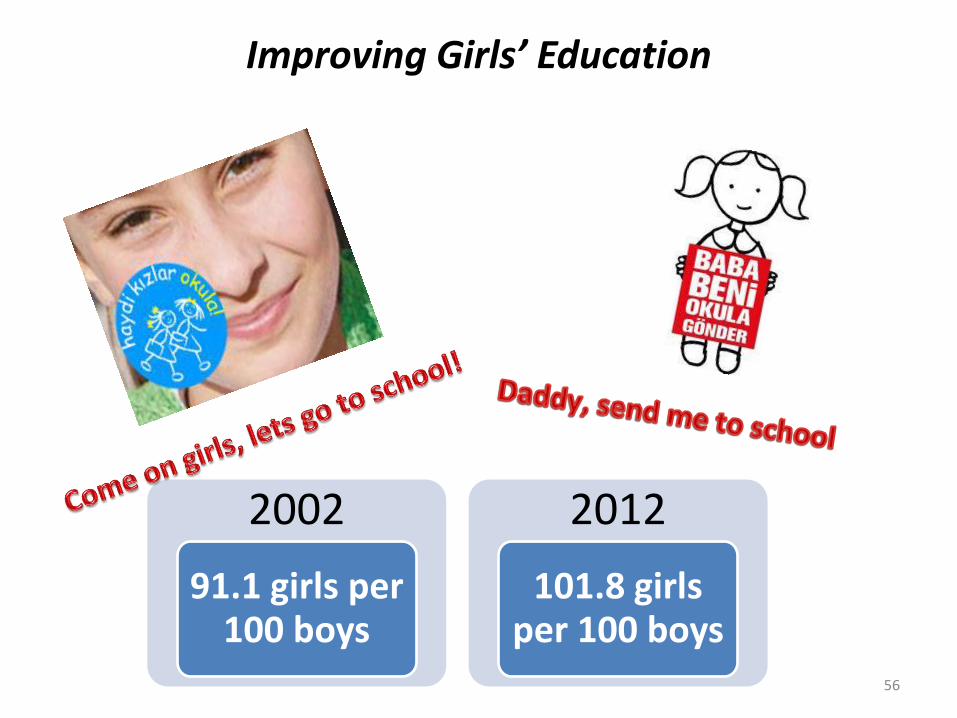
2002
91.1 girls per 100 boys
2012
101.8 girls per 100 boys
Improving Girls’ Education
56
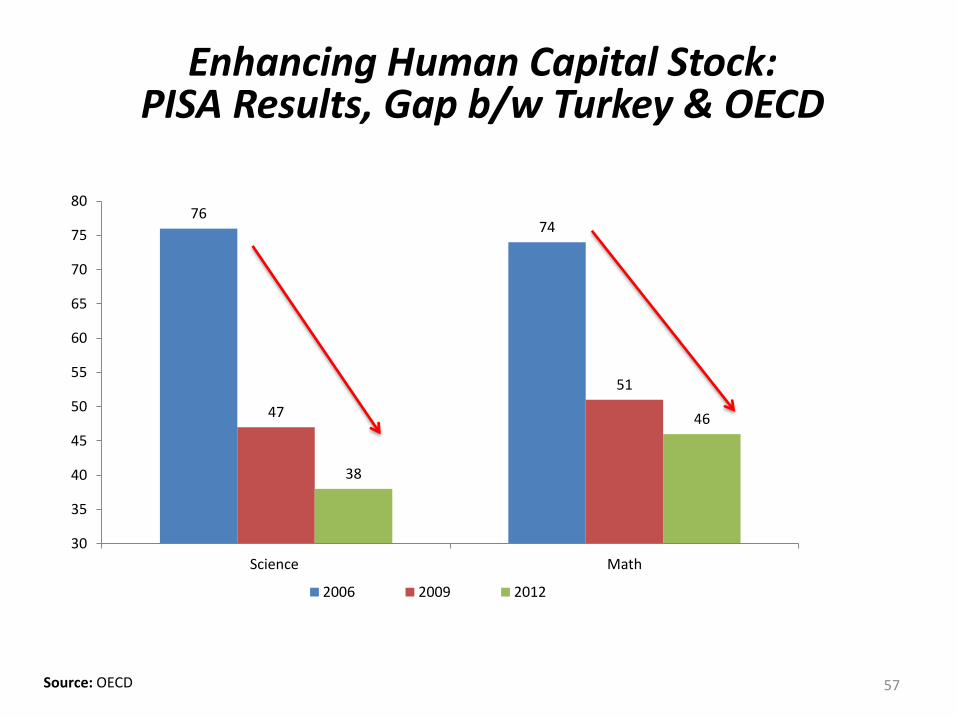
Source: OECD
76 74
47
51
38
46
30
35
40
45
50
55
60
65
70
75
80
Science Math
2006 2009 2012
Enhancing Human Capital Stock: PISA Results, Gap b/w Turkey & OECD
57

Improving Quality of Education
With Fatih Project, we are providing our children with
Broadband Internet Access
Smart Boards
Tablet PCs
Other Information Technology Tools
58

Local & Renewable Energy
59
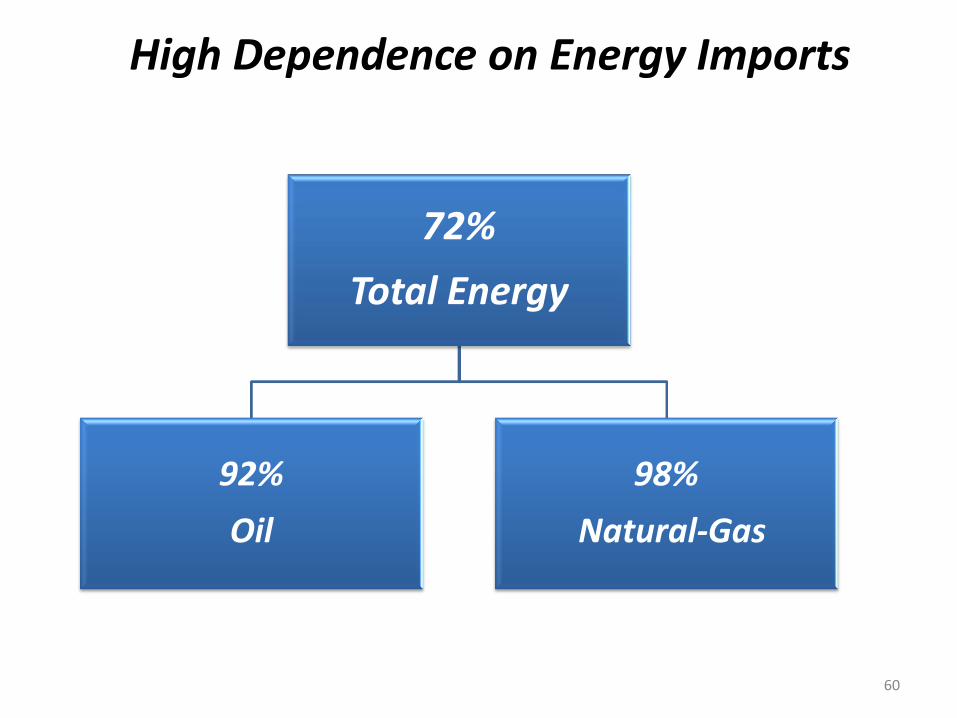
High Dependence on Energy Imports
72%
Total Energy
92%
Oil
98%
Natural-Gas
60
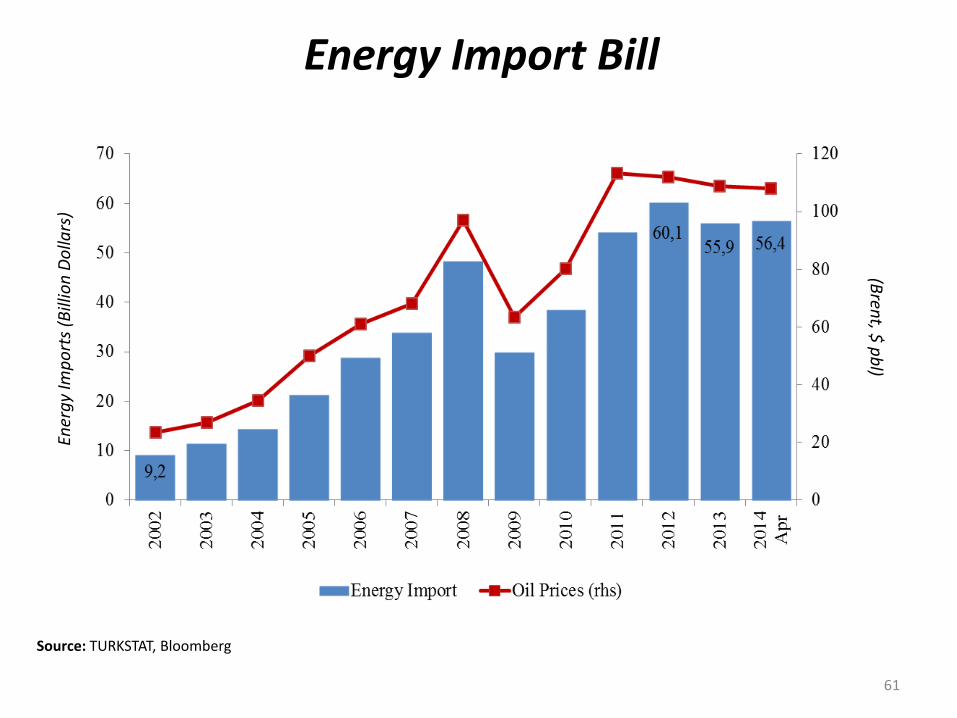
Source: TURKSTAT, Bloomberg
Energy Import Bill (B
rent, $
pb
l) En
erg
y Im
po
rts
(Bill
ion
Do
llars
)
61
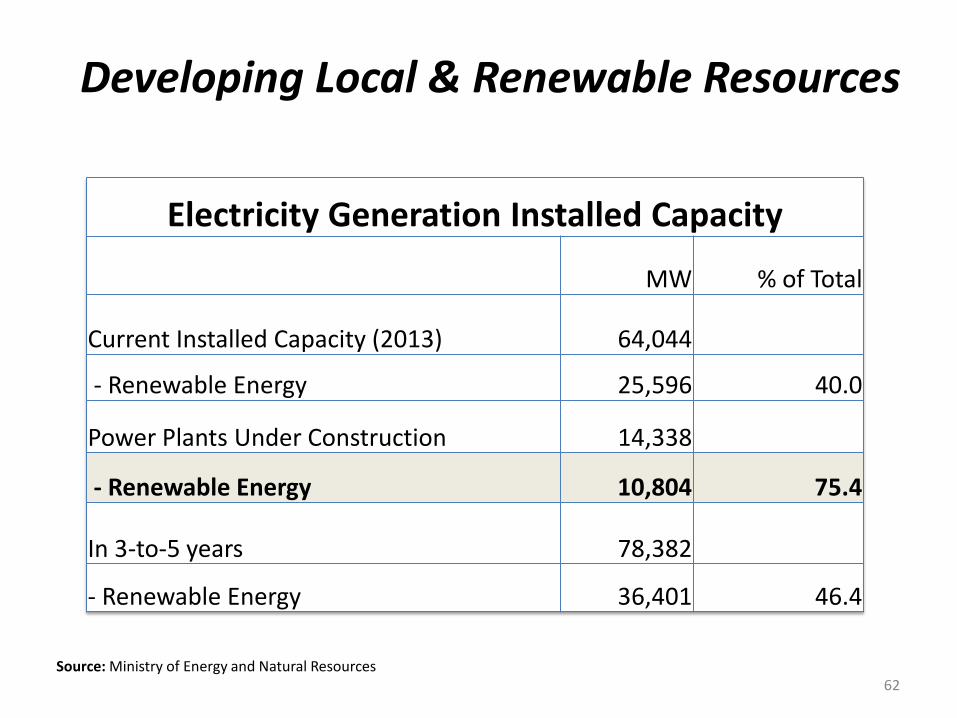
Developing Local & Renewable Resources
Source: Ministry of Energy and Natural Resources
Electricity Generation Installed Capacity
MW % of Total
Current Installed Capacity (2013) 64,044
- Renewable Energy 25,596 40.0
Power Plants Under Construction 14,338
- Renewable Energy 10,804 75.4
In 3-to-5 years 78,382
- Renewable Energy 36,401 46.4
62
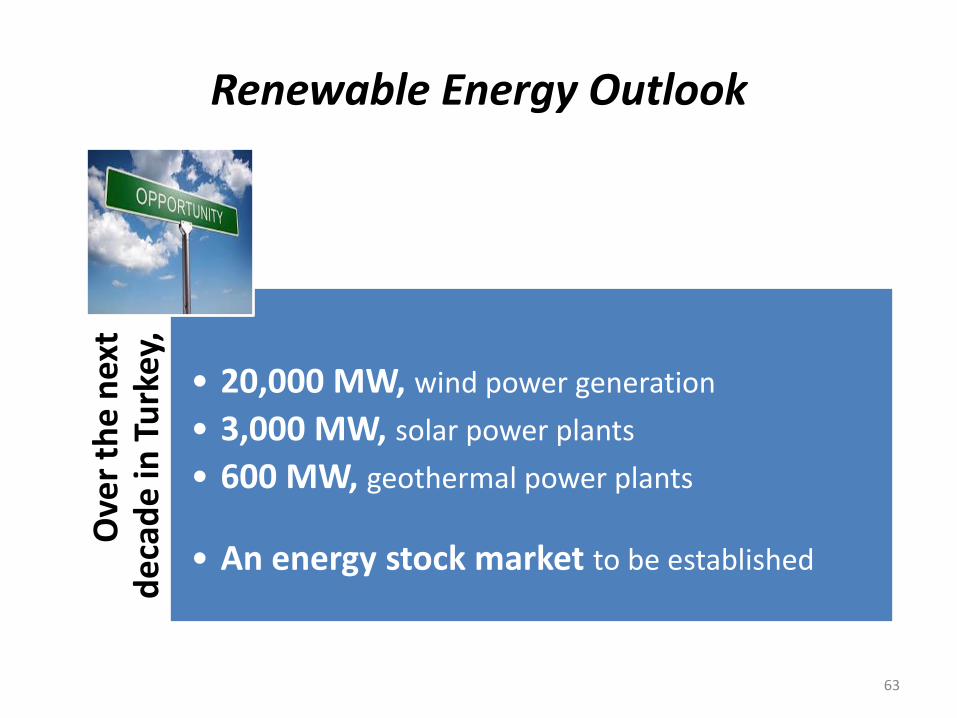
Renewable Energy Outlook O
ver
the
nex
t d
eca
de
in T
urk
ey,
• 20,000 MW, wind power generation
• 3,000 MW, solar power plants
• 600 MW, geothermal power plants
• An energy stock market to be established
63
64
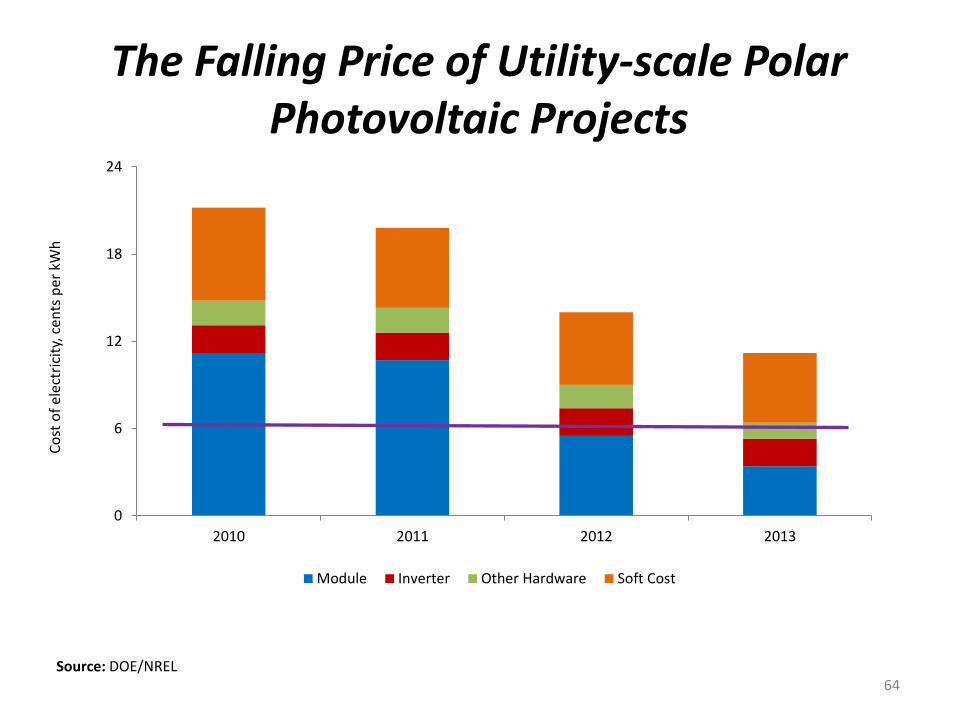
0
6
12
18
24
2010 2011 2012 2013
Module Inverter Other Hardware Soft Cost
Co
st o
f el
ect
rici
ty, c
ents
per
kW
h
Source: DOE/NREL
The Falling Price of Utility-scale Polar Photovoltaic Projects
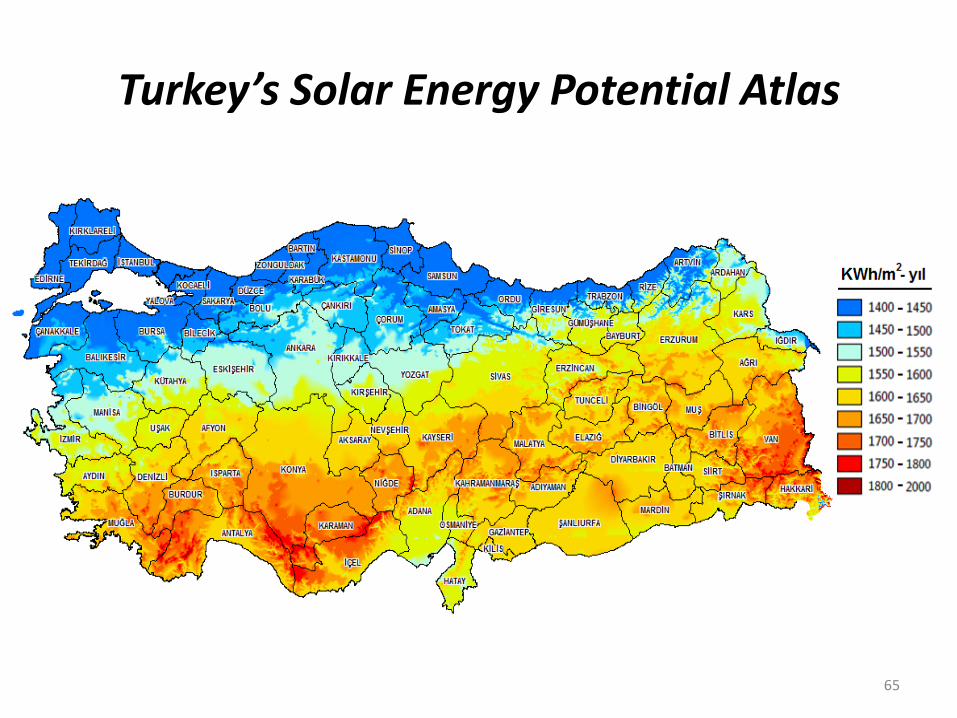
Turkey’s Solar Energy Potential Atlas
65

Building Nuclear Capacity
Akkuyu: JV with Russia
Sinop JV with a Japanese-French consortium
Working on a 3rd plant
66
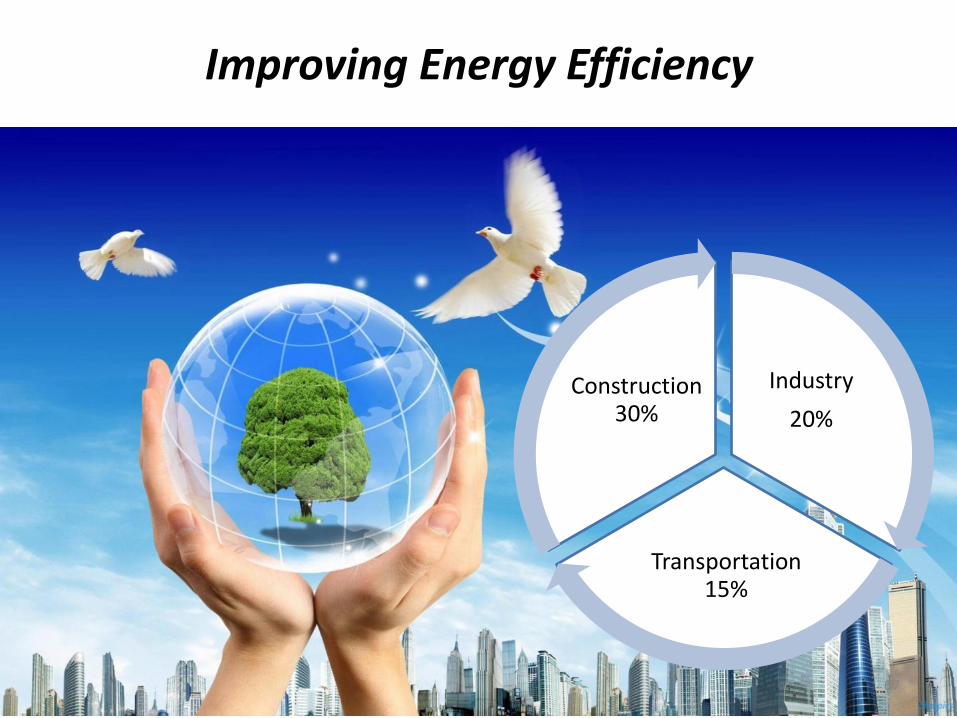
Improving Energy Efficiency
Industry
20%
Transportation 15%
Construction 30%
67
Combatting Shadow Economy
68
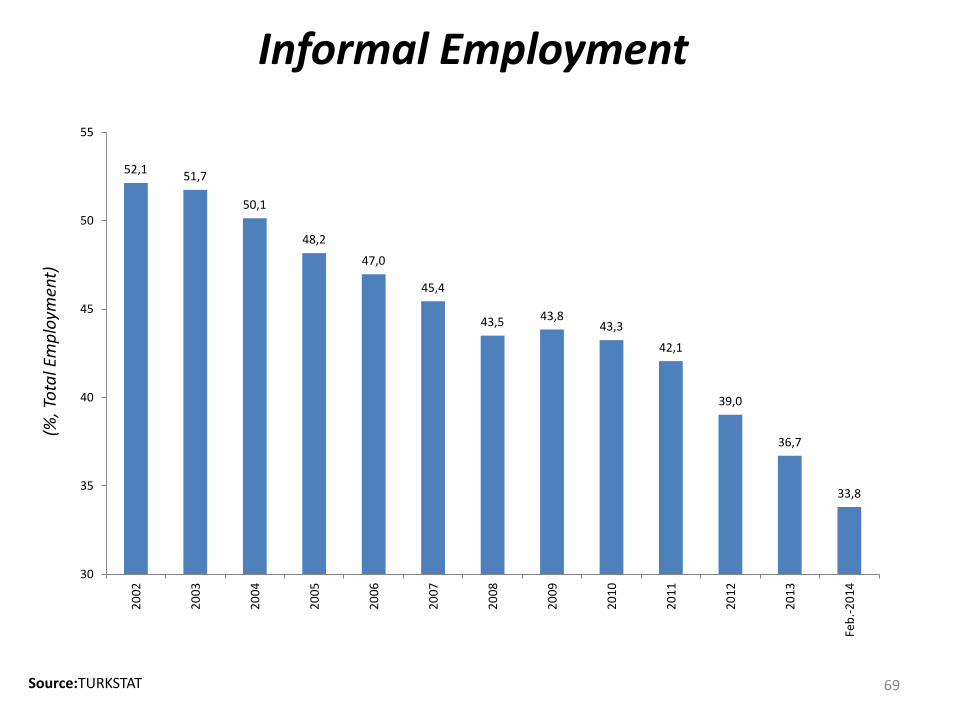
52,1 51,7
50,1
48,2
47,0
45,4
43,5 43,8 43,3
42,1
39,0
36,7
33,8
30
35
40
45
50
552
00
2
20
03
20
04
20
05
20
06
20
07
20
08
20
09
20
10
20
11
20
12
20
13
Feb
.-2
01
4
(%, T
ota
l Em
plo
ymen
t)
Informal Employment
Source:TURKSTAT 69
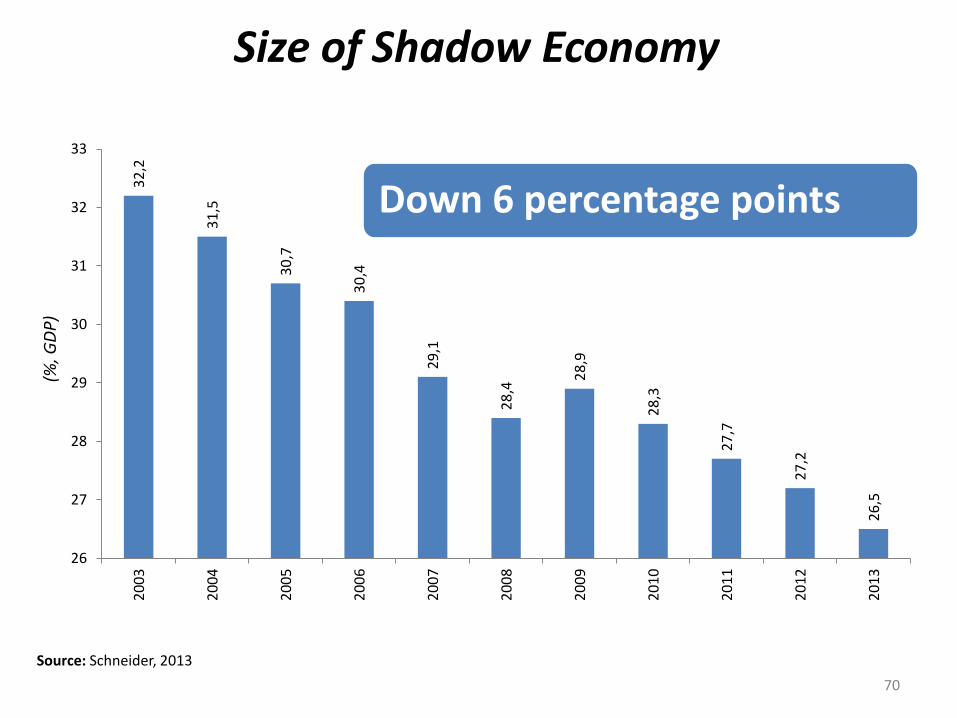
Size of Shadow Economy
32
,2
31
,5
30
,7
30
,4
29
,1
28
,4 2
8,9
28
,3
27
,7
27
,2
26
,5
26
27
28
29
30
31
32
332
00
3
20
04
20
05
20
06
20
07
20
08
20
09
20
10
20
11
20
12
20
13
Source: Schneider, 2013
Down 6 percentage points
70
(%, G
DP
)
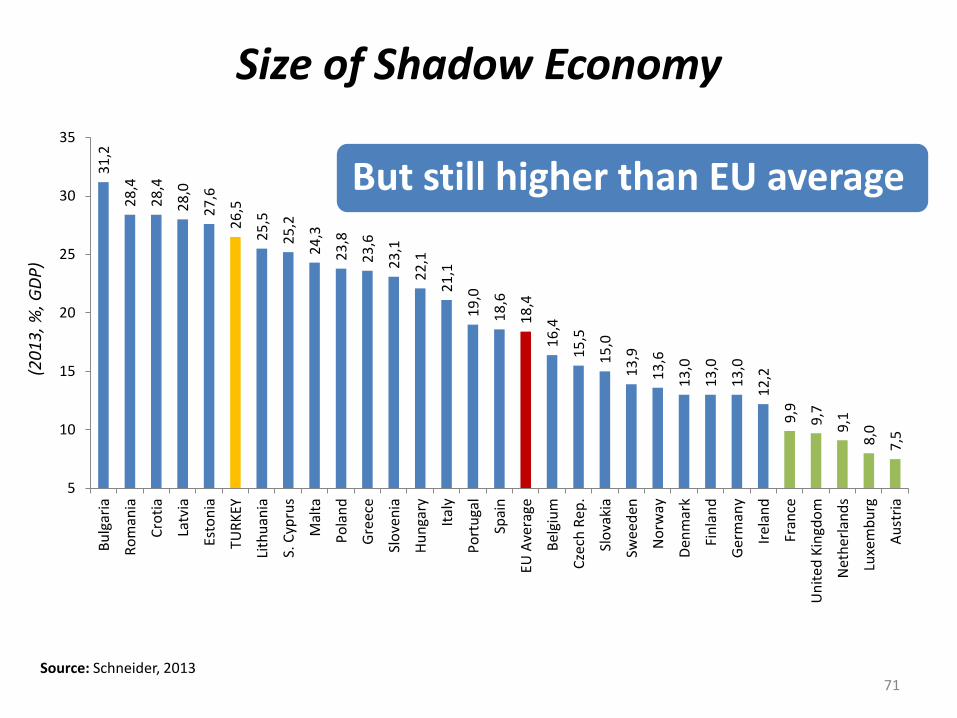
Size of Shadow Economy
Source: Schneider, 2013
But still higher than EU average 31
,2
28
,4
28
,4
28
,0
27
,6
26
,5
25
,5
25
,2
24
,3
23
,8
23
,6
23
,1
22
,1
21
,1
19
,0
18
,6
18
,4
16
,4
15
,5
15
,0
13
,9
13
,6
13
,0
13
,0
13
,0
12
,2
9,9
9,7
9,1
8,0
7,5
5
10
15
20
25
30
35
Bu
lgar
ia
Ro
man
ia
Cro
tia
Latv
ia
Esto
nia
TUR
KEY
Lith
uan
ia
S. C
ypru
s
Mal
ta
Po
lan
d
Gre
ece
Slo
ven
ia
Hu
nga
ry
Ital
y
Po
rtu
gal
Spai
n
EU A
vera
ge
Bel
giu
m
Cze
ch R
ep.
Slo
vaki
a
Swee
den
No
rway
Den
mar
k
Fin
lan
d
Ger
man
y
Irel
and
Fran
ce
Un
ited
Kin
gdo
m
Net
her
lan
ds
Luxe
mb
urg
Au
stri
a
(20
13
, %, G
DP
)
71
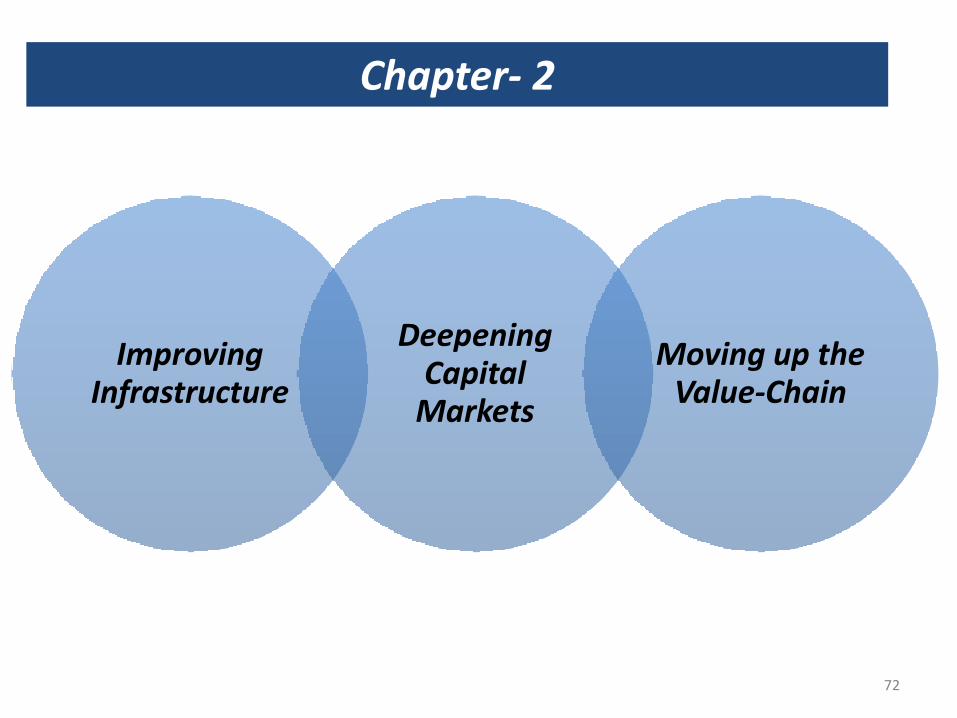
Chapter- 2
Improving Infrastructure
Deepening Capital
Markets
Moving up the Value-Chain
72
Improving Infrastructure
73
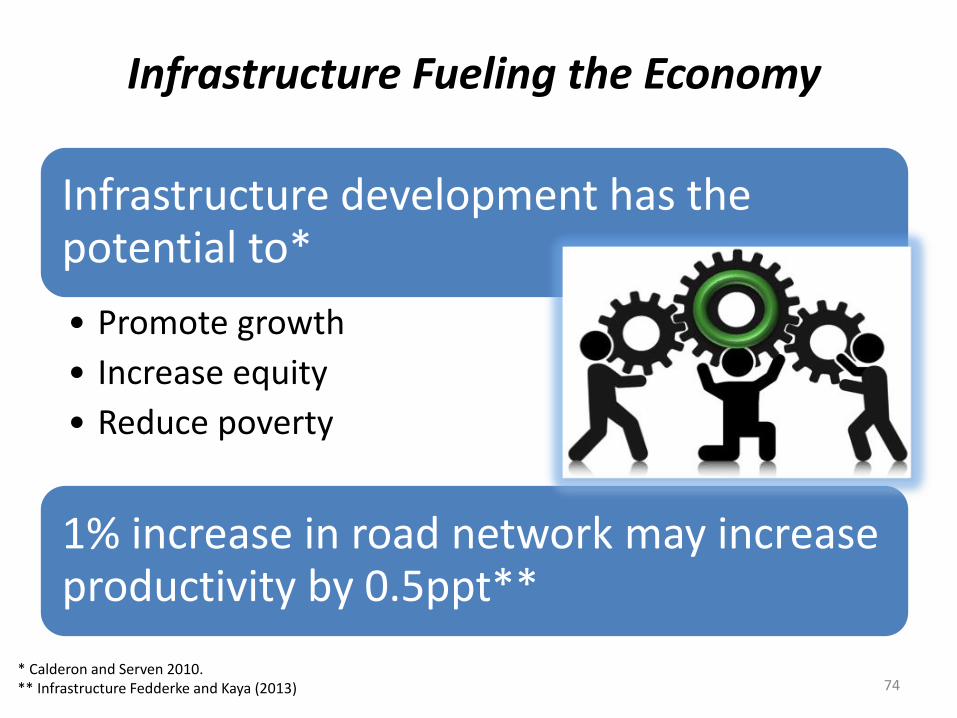
Infrastructure Fueling the Economy
Infrastructure development has the potential to*
• Promote growth
• Increase equity
• Reduce poverty
1% increase in road network may increase productivity by 0.5ppt**
74 * Calderon and Serven 2010. ** Infrastructure Fedderke and Kaya (2013)
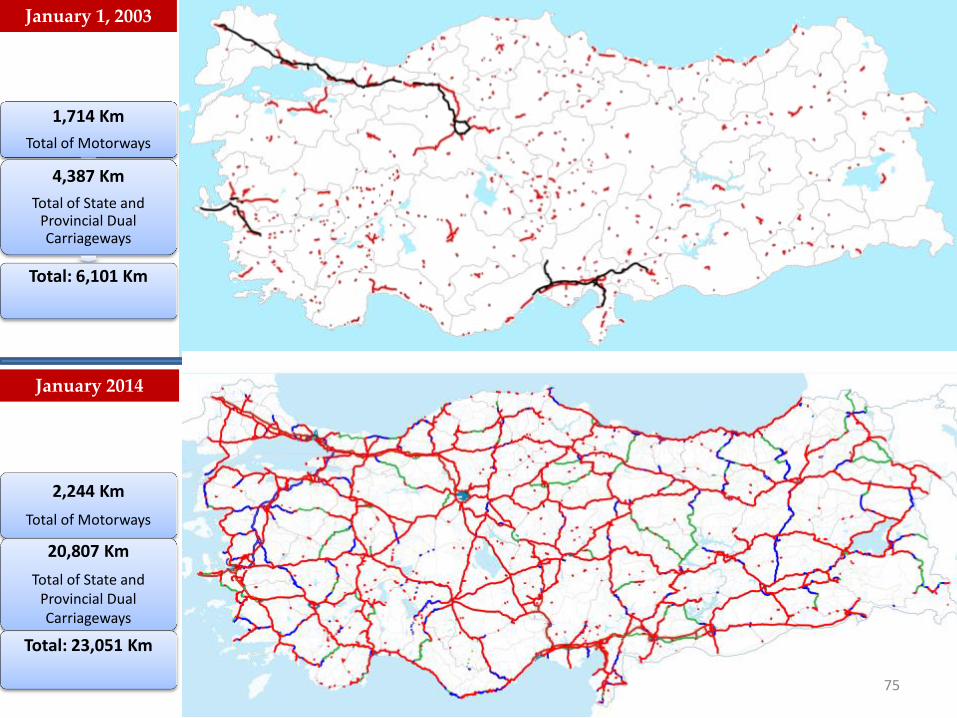
1,714 Km
Total of Motorways
4,387 Km
Total of State and Provincial Dual Carriageways
Total: 6,101 Km
January 1, 2003
2,244 Km
Total of Motorways
20,807 Km
Total of State and Provincial Dual Carriageways
Total: 23,051 Km
January 2014
75
İSTANBUL
EDİRNE
ESKİŞEHİR
Polatlı
ANKARA
KONYA
İZMİR
SİVAS
AFYONKARHİSAR
KAYSERİ
BURSA
ERZİNCAN
ERZURUM
KARS
MERSİN ADANA
DİYARBAKIR
ELAZIĞ
MALATYA
ZONGULDAK SAMSUN
Bandırma
VAN
MUŞ
BİLECİK
ÇANKIRI
KIRIKKALE
TEKİRDAĞ
İZMİT
BALIKESİR
AYDIN
DENİZLİ BURDUR
ISPARTA
UŞAK MANİSA
KARAMAN
NİĞDE
OSMANİYE
K.MARAŞ
AMASYA
BATMAN
MARDİN
Yerköy
KARABÜK
Yenişehir
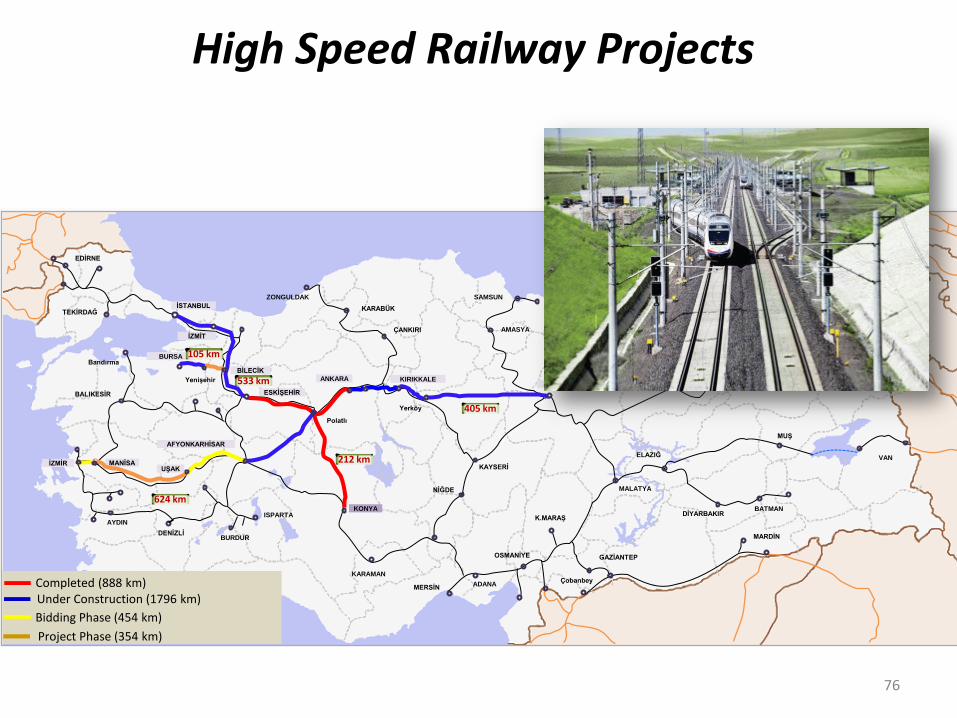
405 km
212 km
533 km
624 km
105 km
Completed (888 km) Under Construction (1796 km)
Bidding Phase (454 km)
Project Phase (354 km)
GAZİANTEP
Çobanbey
76
High Speed Railway Projects
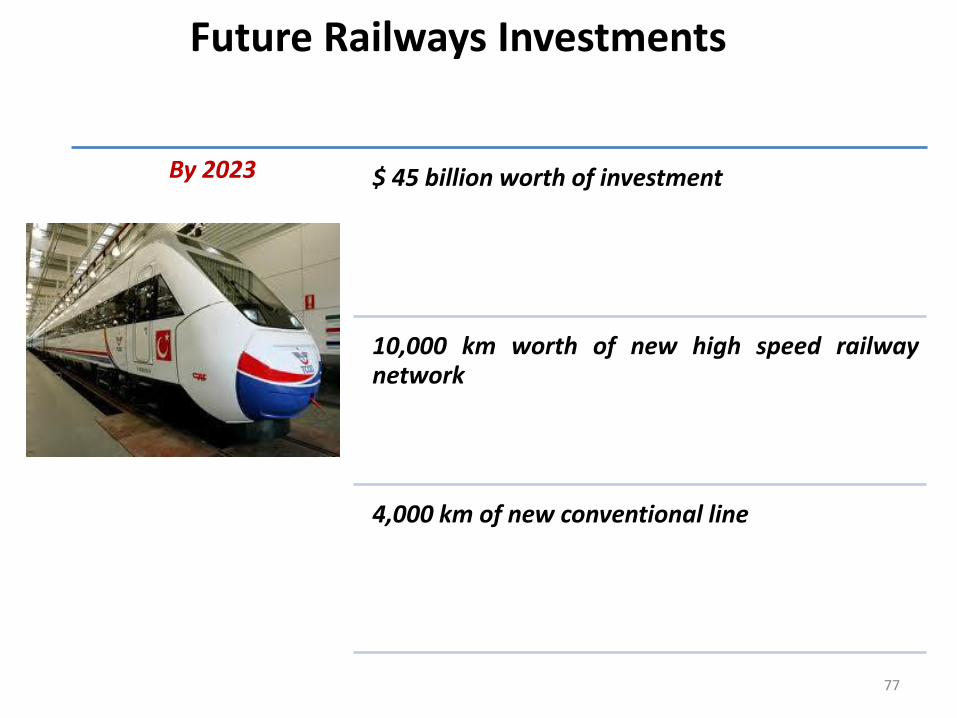
Future Railways Investments
By 2023 $ 45 billion worth of investment
10,000 km worth of new high speed railway network
4,000 km of new conventional line
77

İstanbul
Antalya
İzmir
Gaziantep
Trabzon
Kayseri
Samsun
Erzurum
Kars
Van
Diyarbakır
Malatya
Dalaman
Bodrum
Sivas
Elazığ
Bursa
Ankara
Ağrı
Erzincan
Muş
Batman
Mardin Şanlıurfa
Adana
Konya
Denizli
KKTC THY
THY Pegasus Onur Air SUN Express ATLAS JET
Tokat
Zonguldak
BoraJet
Edremit
Siirt
Gazipaşa
Çorlu
KKTC
Iğdır
Gökçeada
Hatay
Adana Antalya
İzmir
Gaziantep
Trabzon
Kayseri
Ankara
Bursa
Samsun
Erzurum
Kars
Van
Mardin
Malatya
Dalaman
Bodrum
Konya
Sivas
Elazığ
Sinop
Nevşehir
Adıyaman Batman
Çanakkale
Denizli
Eskişehir
Isparta
Kahramanmaraş
Merzifon
Muş Uşak
Ağrı
Tekirdağ
Erzincan
Diyarbakır
Şanlıurfa
İstanbul
Kastamonu
Bingöl
Şırnak
2014 6 Airlines 7 Centers
52 Airports
2003 2 Centers
26 Airports
In domestic lines
the fastest
growing country
in Europe
TURKEY
Flight Points (Domestic Lines)
78
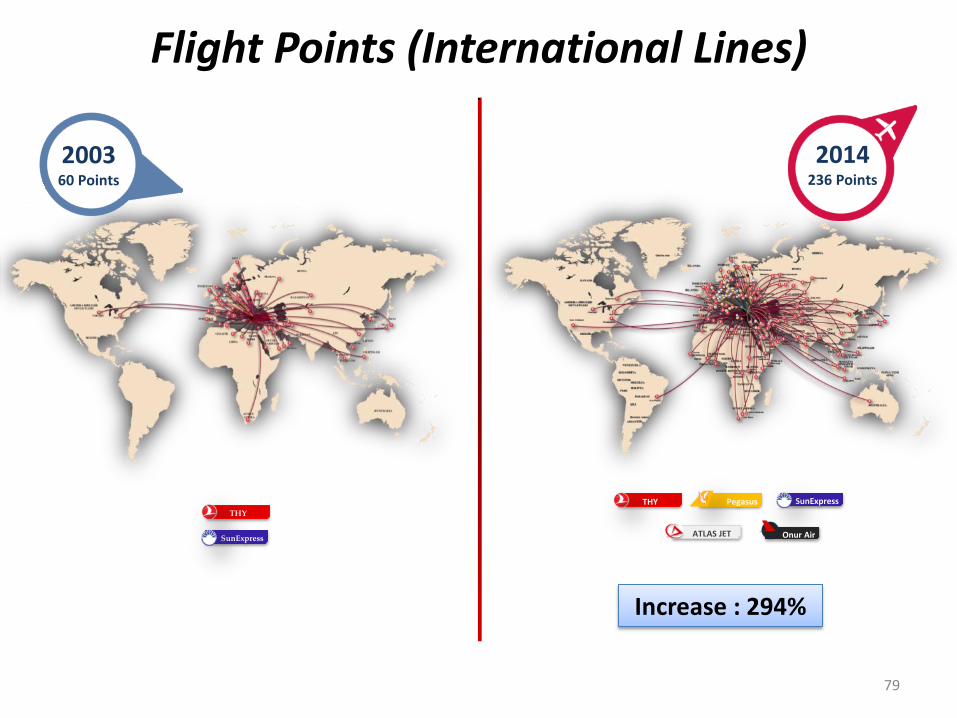
2003 60 Points
SunExpress Pegasus
ATLAS JET Onur Air
2014 236 Points
THY THY
SunExpress
Increase : 294%
79
Flight Points (International Lines)
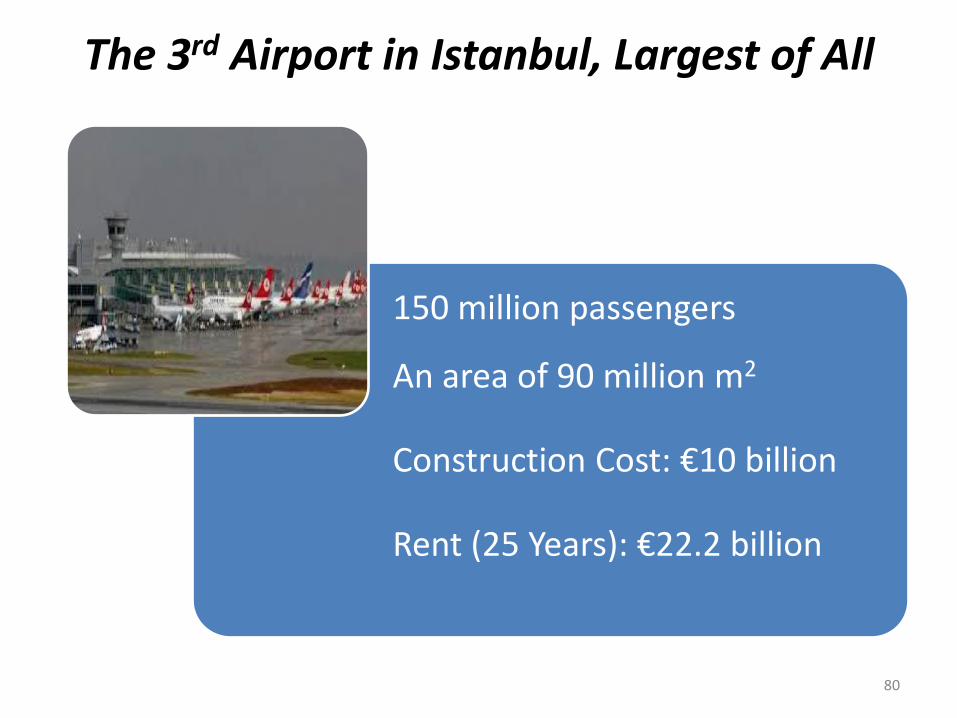
The 3rd Airport in Istanbul, Largest of All
150 million passengers
An area of 90 million m2
Construction Cost: €10 billion
Rent (25 Years): €22.2 billion
80
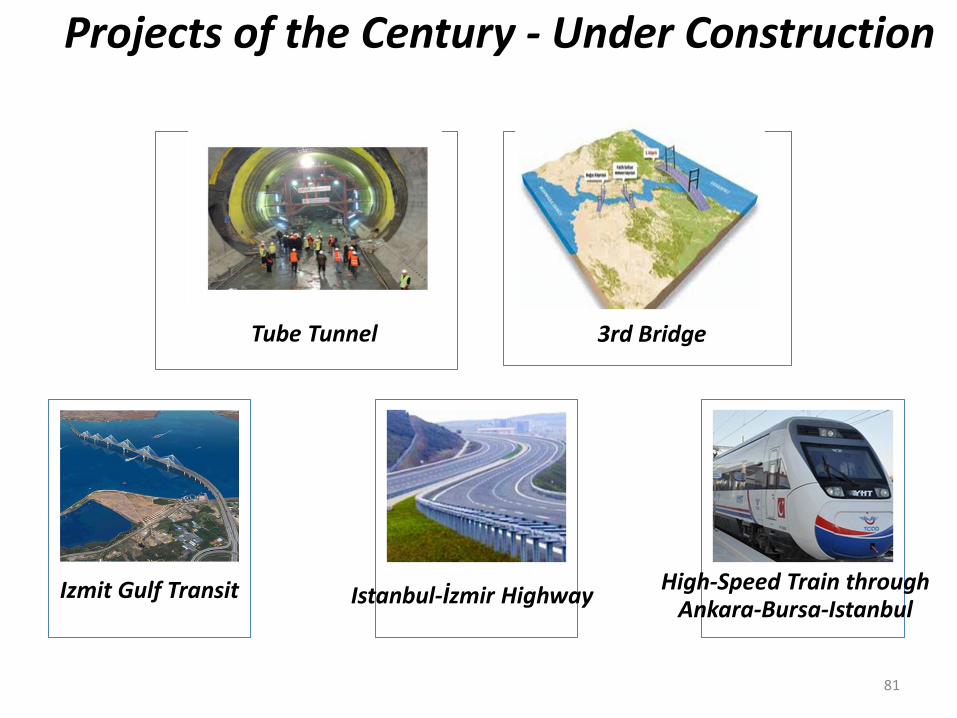
Projects of the Century - Under Construction
Tube Tunnel 3rd Bridge
Izmit Gulf Transit Istanbul-İzmir Highway High-Speed Train through
Ankara-Bursa-Istanbul
81
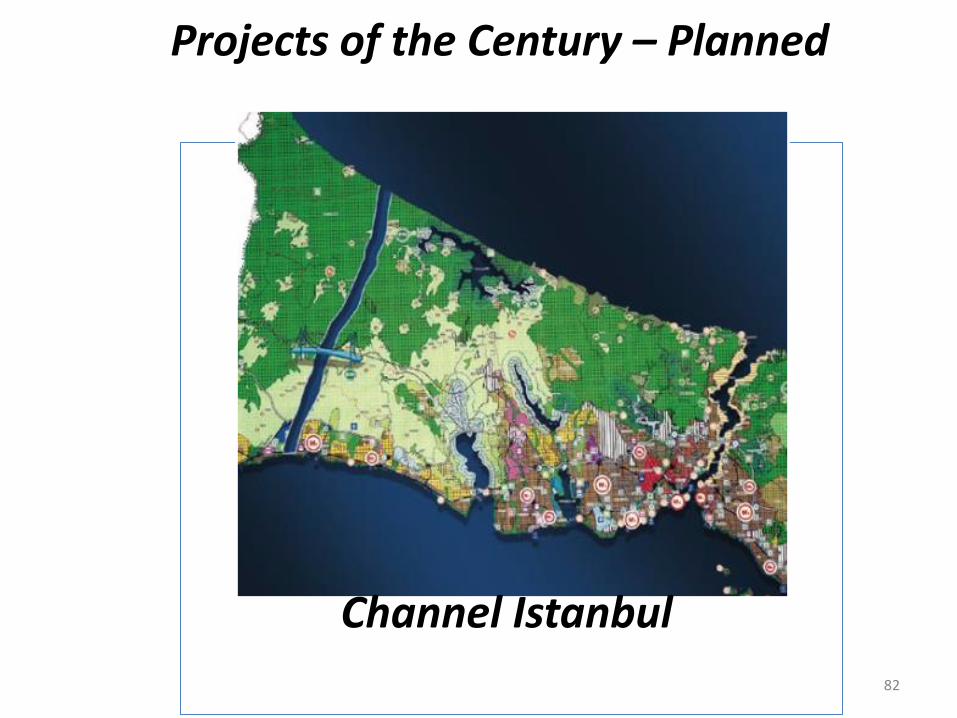
Projects of the Century – Planned
Channel Istanbul
82
Deepening Capital Markets
83
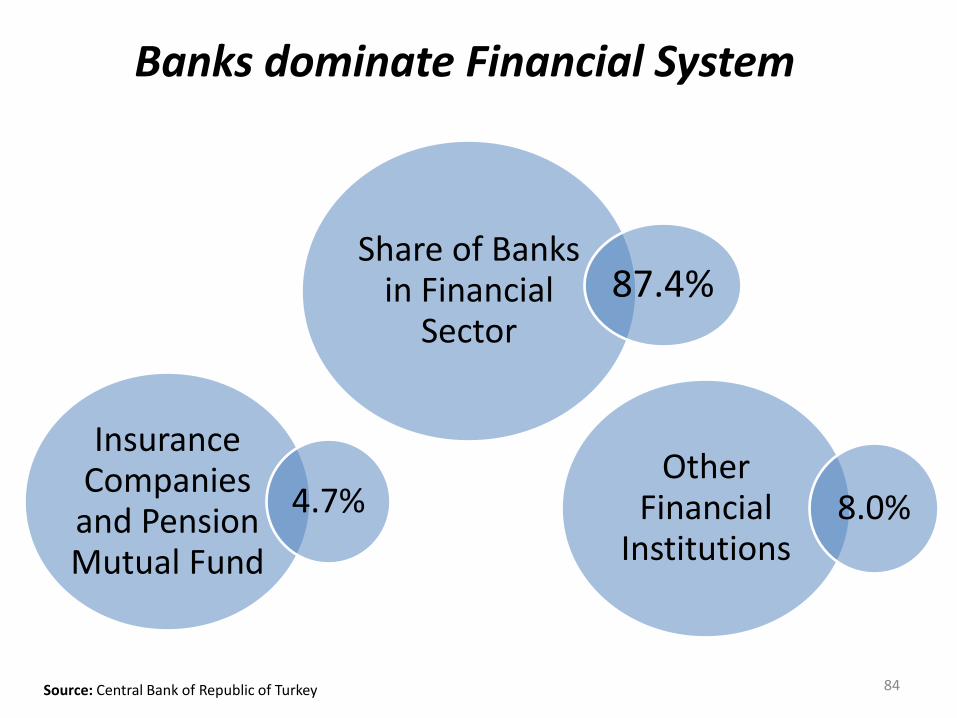
Banks dominate Financial System
Share of Banks in Financial
Sector 87.4%
84 Source: Central Bank of Republic of Turkey
Insurance Companies and Pension Mutual Fund
4.7% Other
Financial Institutions
8.0%
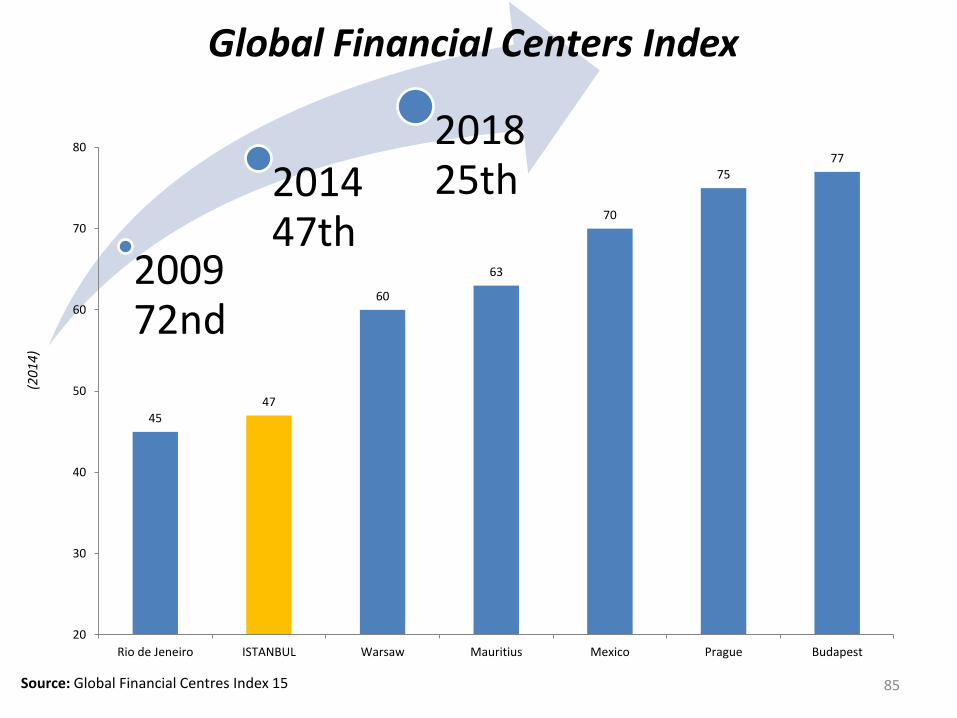
2009 72nd
2014 47th
2018 25th
Global Financial Centers Index
Source: Global Financial Centres Index 15
45 47
60
63
70
75 77
20
30
40
50
60
70
80
Rio de Jeneiro ISTANBUL Warsaw Mauritius Mexico Prague Budapest
(20
14
)
85
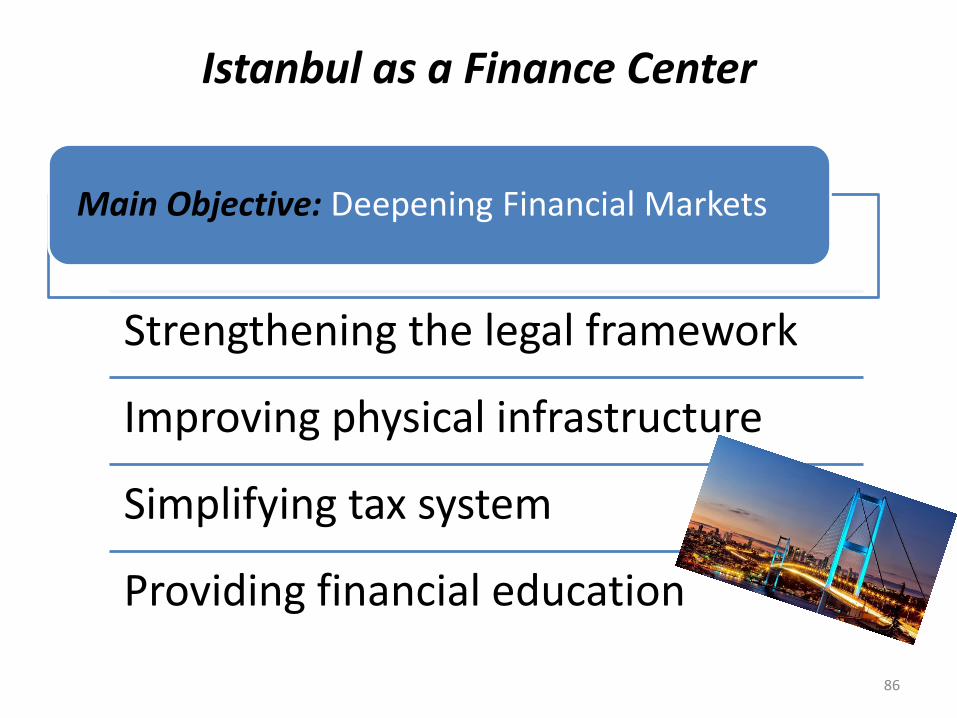
Strengthening the legal framework
Improving physical infrastructure
Simplifying tax system
Providing financial education
Istanbul as a Finance Center
86
Main Objective: Deepening Financial Markets
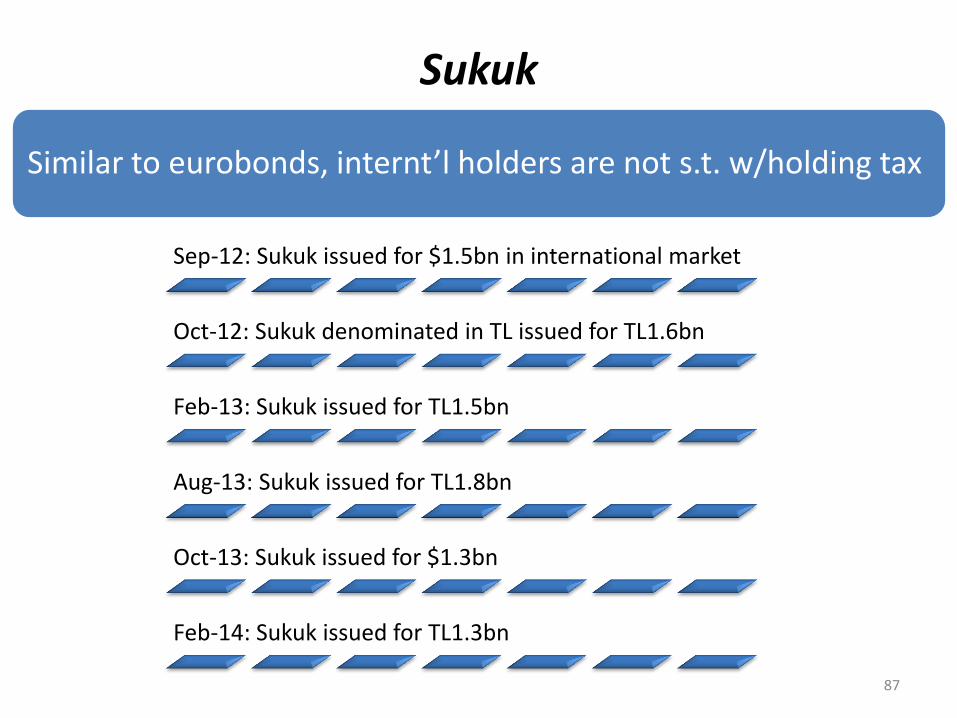
Sukuk
87
Sep-12: Sukuk issued for $1.5bn in international market
Oct-12: Sukuk denominated in TL issued for TL1.6bn
Feb-13: Sukuk issued for TL1.5bn
Aug-13: Sukuk issued for TL1.8bn
Oct-13: Sukuk issued for $1.3bn
Feb-14: Sukuk issued for TL1.3bn
Similar to eurobonds, internt’l holders are not s.t. w/holding tax

Increasing Savings: Private Pensions
25% State Contribution
1.4 million new
participants and TL7.9bn funds since end-2012
88
Support for Start-Ups
Incentives for Biz Angels
Incentives for VCs
89

Moving up the Value-Chain
90
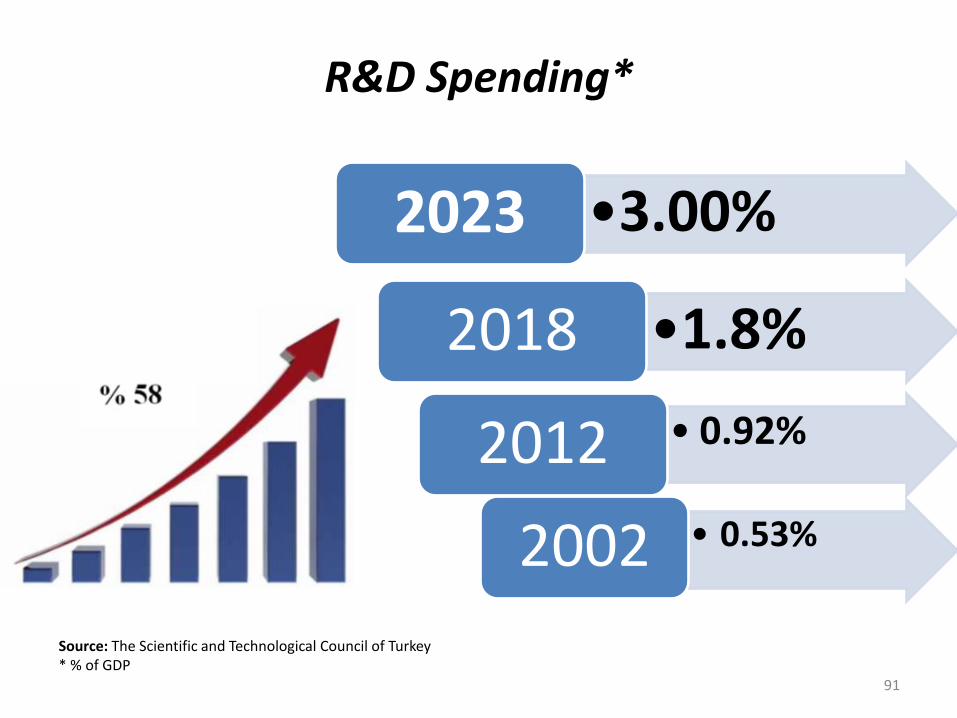
Source: The Scientific and Technological Council of Turkey * % of GDP
R&D Spending*
91
•3.00% 2023
•1.8% 2018
• 0.92% 2012
• 0.53% 2002
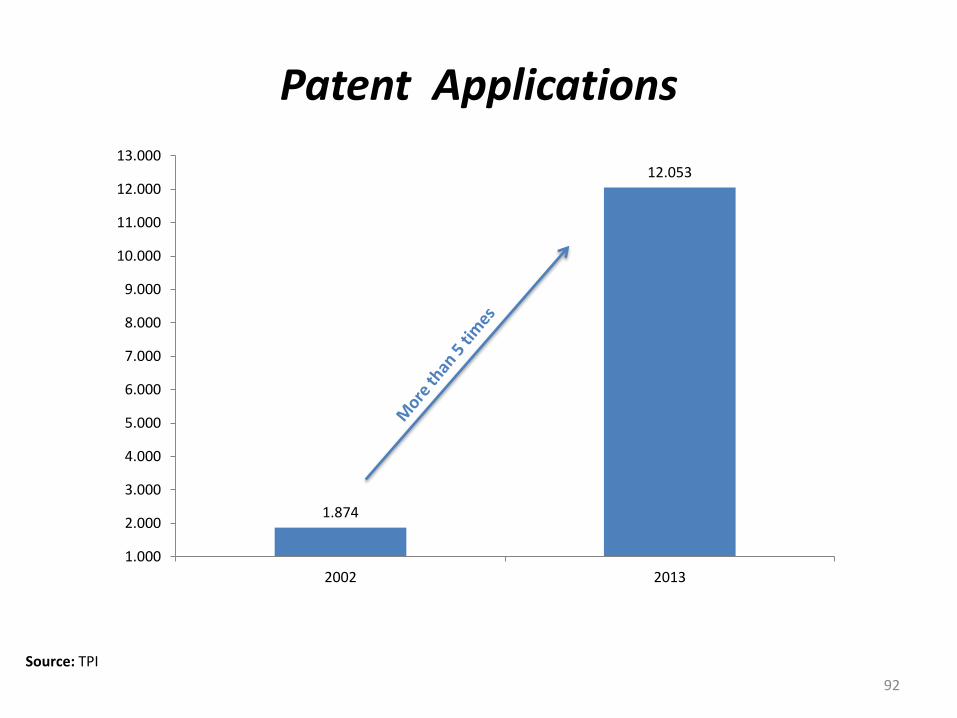
Patent Applications
Source: TPI 92
1.874
12.053
1.000
2.000
3.000
4.000
5.000
6.000
7.000
8.000
9.000
10.000
11.000
12.000
13.000
2002 2013
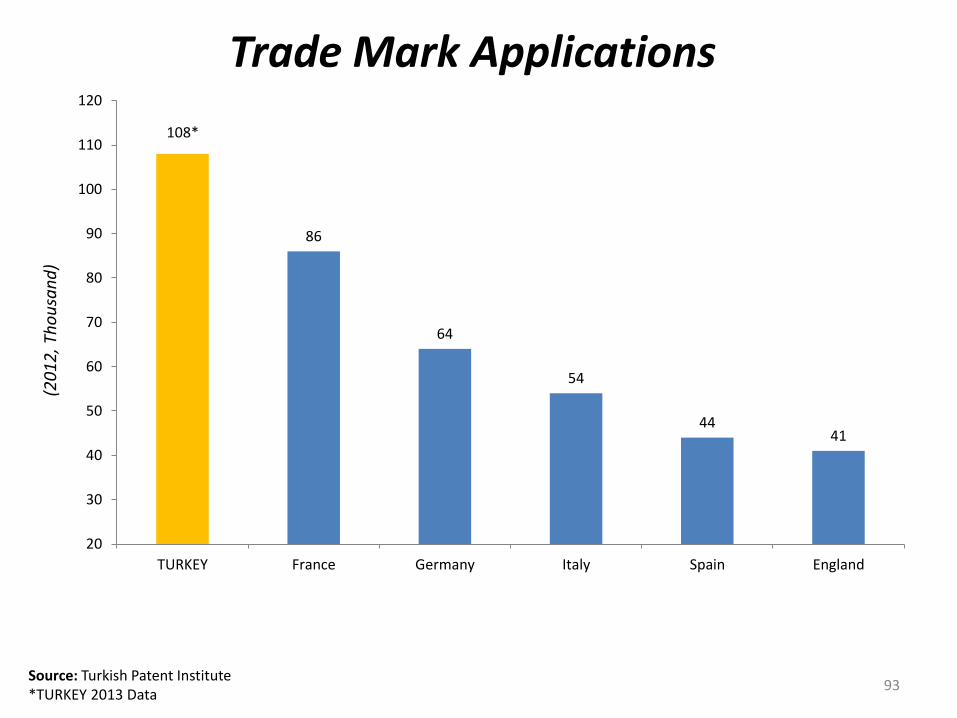
Trade Mark Applications (2
01
2, T
ho
usa
nd
)
86
64
54
44 41
20
30
40
50
60
70
80
90
100
110
120
TURKEY France Germany Italy Spain England
108*
Source: Turkish Patent Institute *TURKEY 2013 Data
93
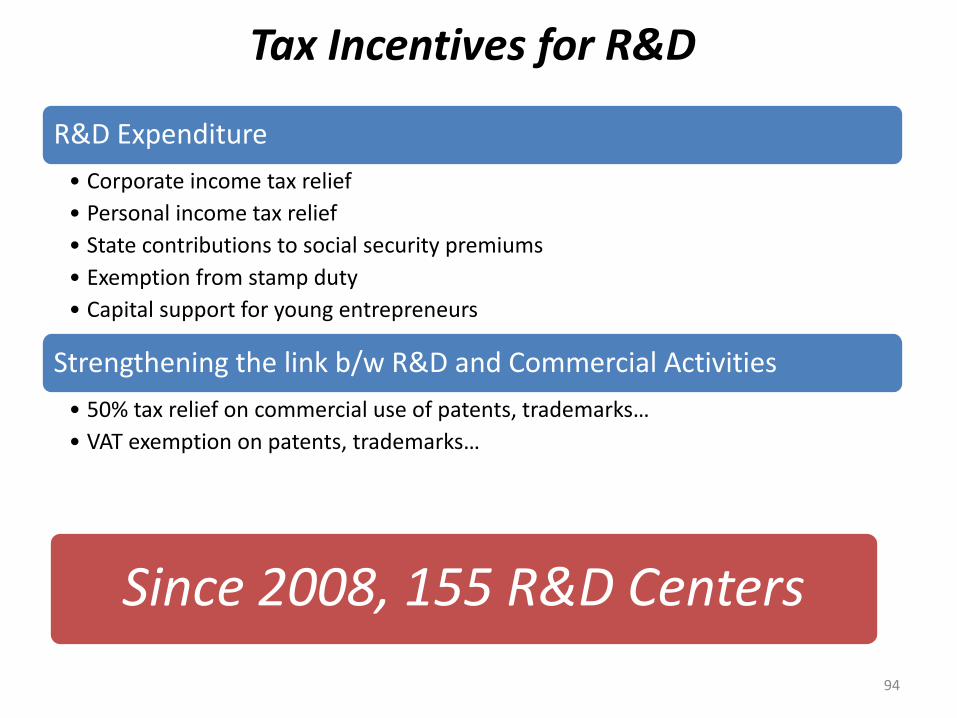
Tax Incentives for R&D
R&D Expenditure
• Corporate income tax relief
• Personal income tax relief
• State contributions to social security premiums
• Exemption from stamp duty
• Capital support for young entrepreneurs
Strengthening the link b/w R&D and Commercial Activities
• 50% tax relief on commercial use of patents, trademarks…
• VAT exemption on patents, trademarks…
94
Since 2008, 155 R&D Centers
Global Investors in Turkey
95
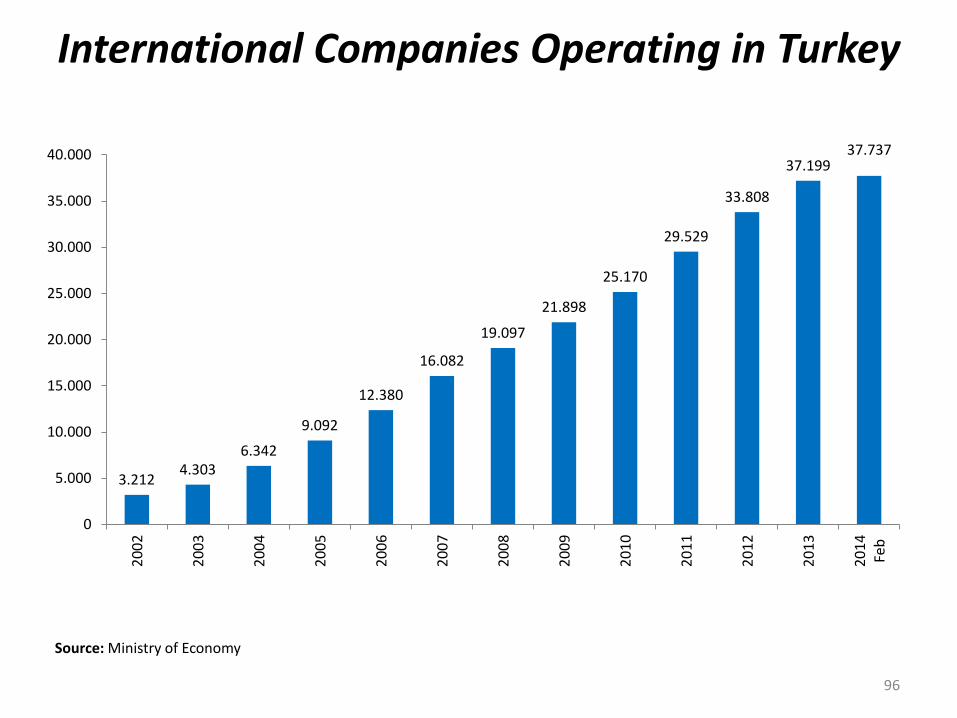
International Companies Operating in Turkey
Source: Ministry of Economy
96
3.212 4.303
6.342
9.092
12.380
16.082
19.097
21.898
25.170
29.529
33.808
37.199 37.737
0
5.000
10.000
15.000
20.000
25.000
30.000
35.000
40.0002
00
2
20
03
20
04
20
05
20
06
20
07
20
08
20
09
20
10
20
11
20
12
20
13
20
14
Feb
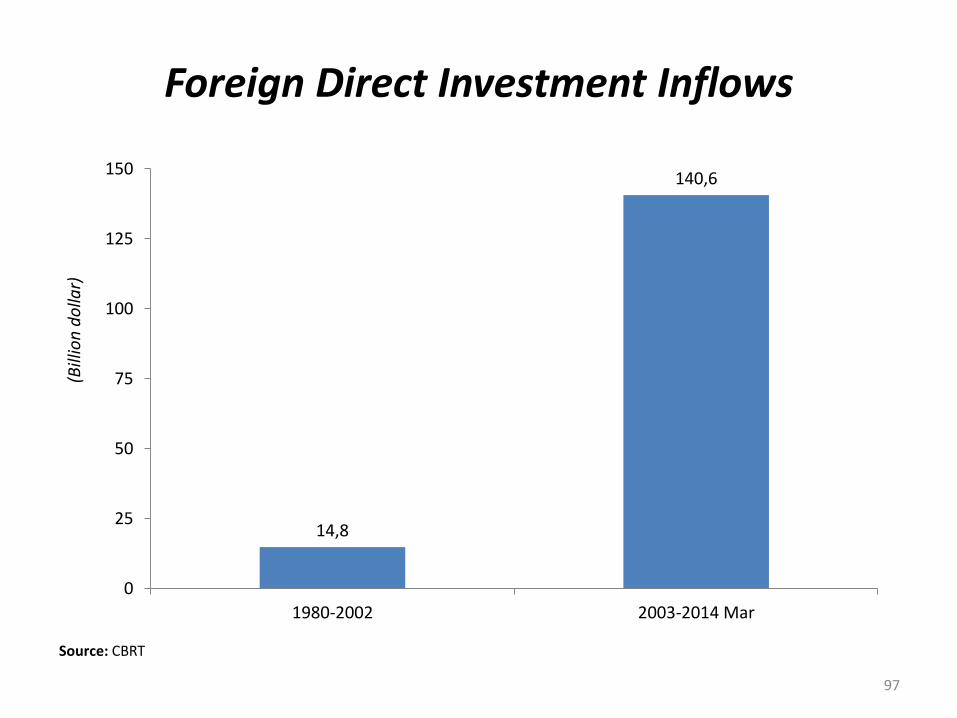
Foreign Direct Investment Inflows
Source: CBRT
(Bill
ion
do
llar)
97
14,8
140,6
0
25
50
75
100
125
150
1980-2002 2003-2014 Mar

Strong Long-Term Prospects
98
Determinants of Long-Term Growth
Quality of Institutions
Demographics
Productivity
99
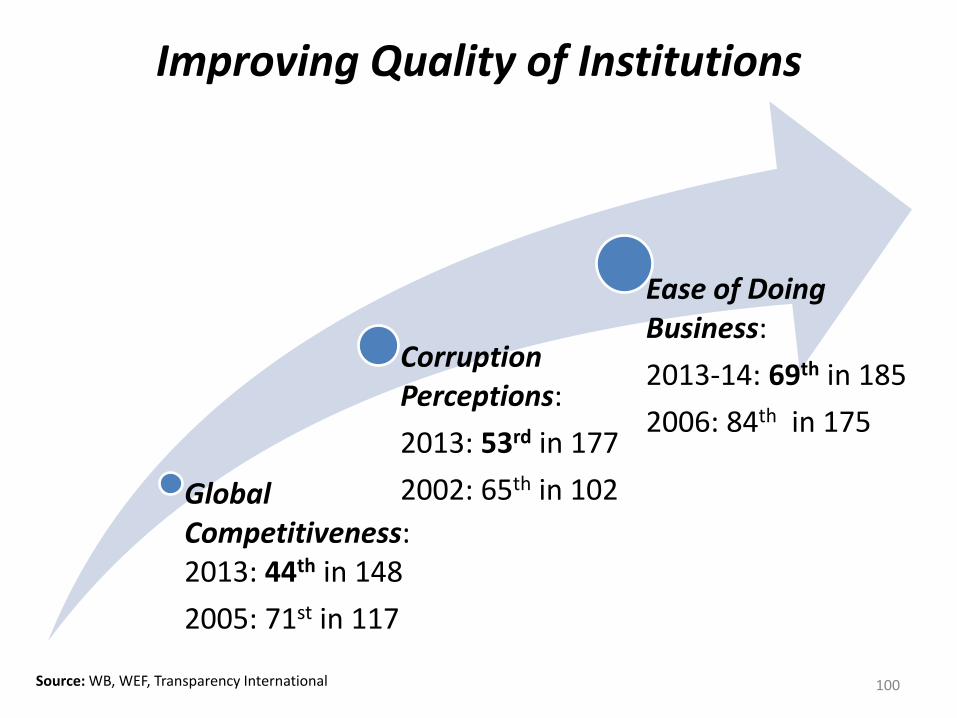
Improving Quality of Institutions
Corruption Perceptions:
2013: 53rd in 177
2002: 65th in 102
Ease of Doing Business:
2013-14: 69th in 185
2006: 84th in 175
Global Competitiveness: 2013: 44th in 148
2005: 71st in 117
Source: WB, WEF, Transparency International 100
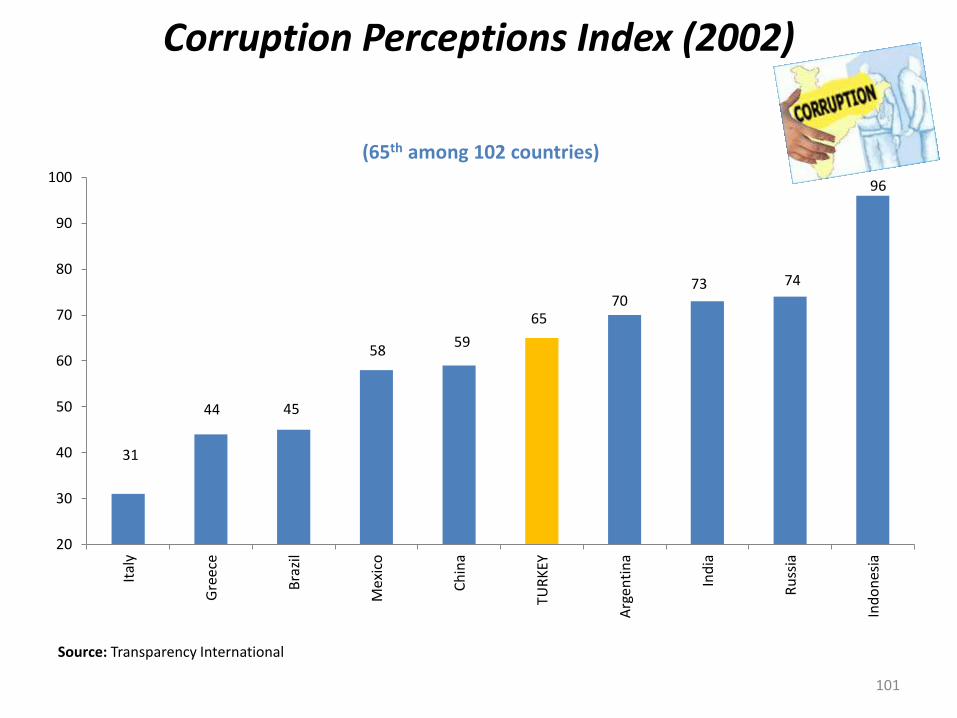
Corruption Perceptions Index (2002)
(65th among 102 countries)
31
44 45
58 59
65 70
73 74
96
20
30
40
50
60
70
80
90
100
Ital
y
Gre
ece
Bra
zil
Mex
ico
Ch
ina
TUR
KEY
Arg
enti
na
Ind
ia
Ru
ssia
Ind
on
esia
Source: Transparency International
101
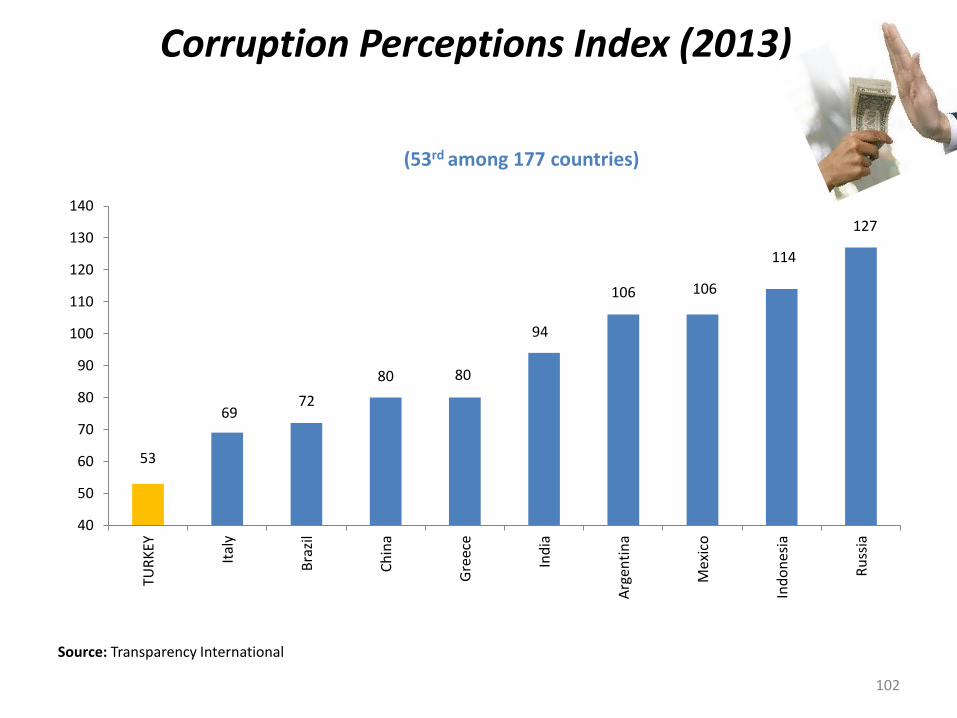
Corruption Perceptions Index (2013)
(53rd among 177 countries)
Source: Transparency International
53
69 72
80 80
94
106 106
114
127
40
50
60
70
80
90
100
110
120
130
140
TUR
KEY
Ital
y
Bra
zil
Ch
ina
Gre
ece
Ind
ia
Arg
enti
na
Mex
ico
Ind
on
esia
Ru
ssia
102
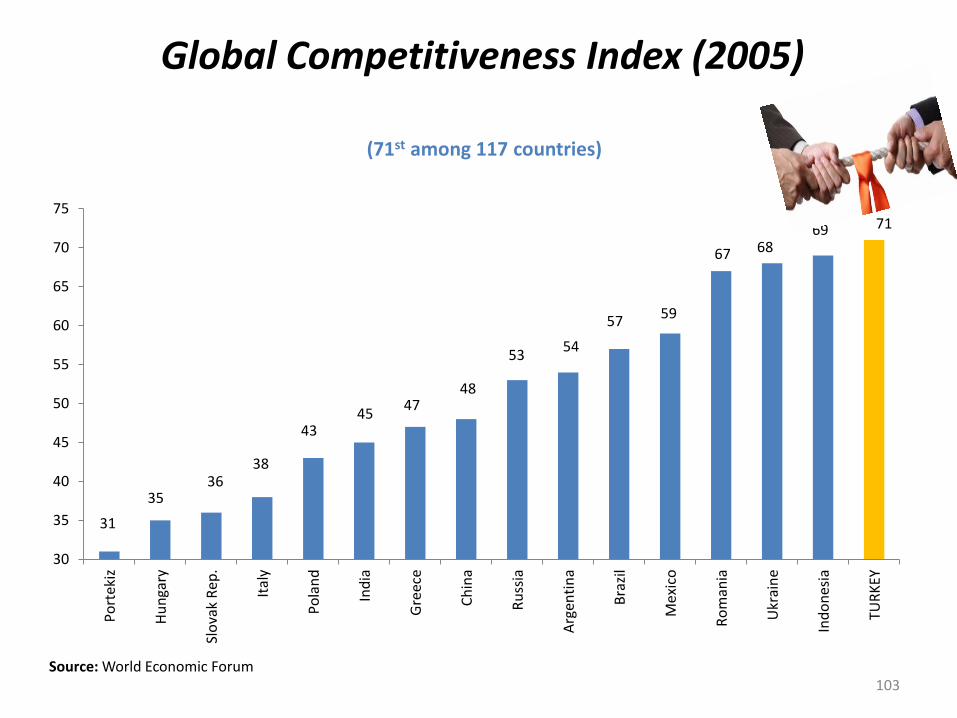
Within the period of 2005-2012, Turkey has ranked higher than Russia, Argentina and Greece. (71st among 117 countries)
31
35 36
38
43 45
47 48
53 54
57 59
67 68 69 71
30
35
40
45
50
55
60
65
70
75
Po
rtek
iz
Hu
nga
ry
Slo
vak
Rep
.
Ital
y
Po
lan
d
Ind
ia
Gre
ece
Ch
ina
Ru
ssia
Arg
enti
na
Bra
zil
Mex
ico
Ro
man
ia
Ukr
ain
e
Ind
on
esia
TUR
KEY
Source: World Economic Forum
Global Competitiveness Index (2005)
103
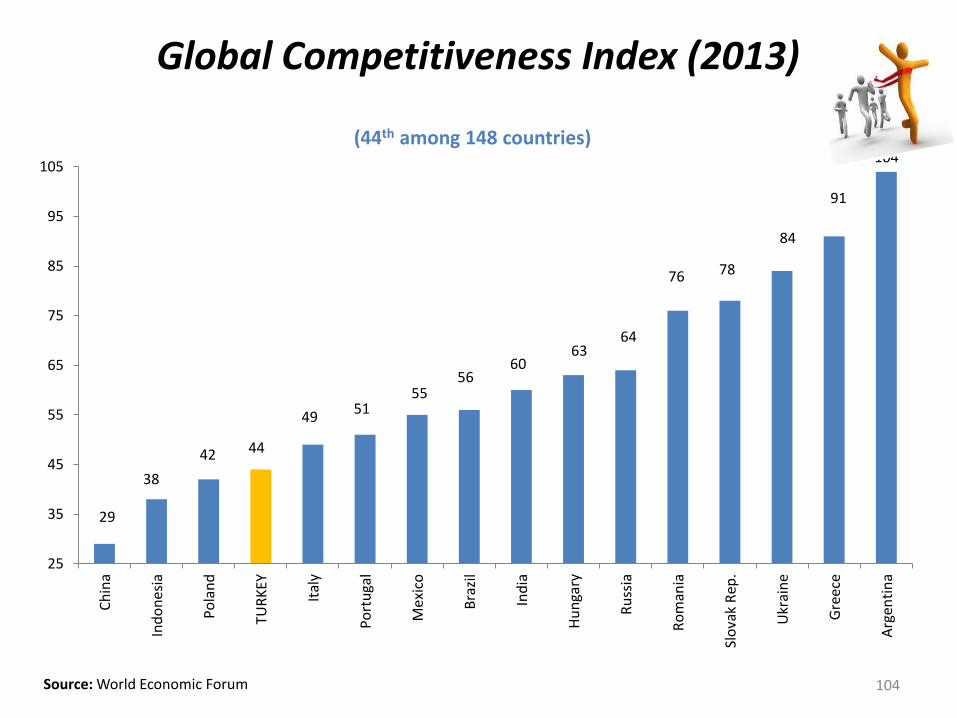
(44th among 148 countries)
Source: World Economic Forum
Global Competitiveness Index (2013)
29
38
42 44
49 51
55 56
60 63
64
76 78
84
91
104
25
35
45
55
65
75
85
95
105
Ch
ina
Ind
on
esia
Po
lan
d
TUR
KEY
Ital
y
Po
rtu
gal
Mex
ico
Bra
zil
Ind
ia
Hu
nga
ry
Ru
ssia
Ro
man
ia
Slo
vak
Rep
.
Ukr
ain
e
Gre
ece
Arg
enti
na
104
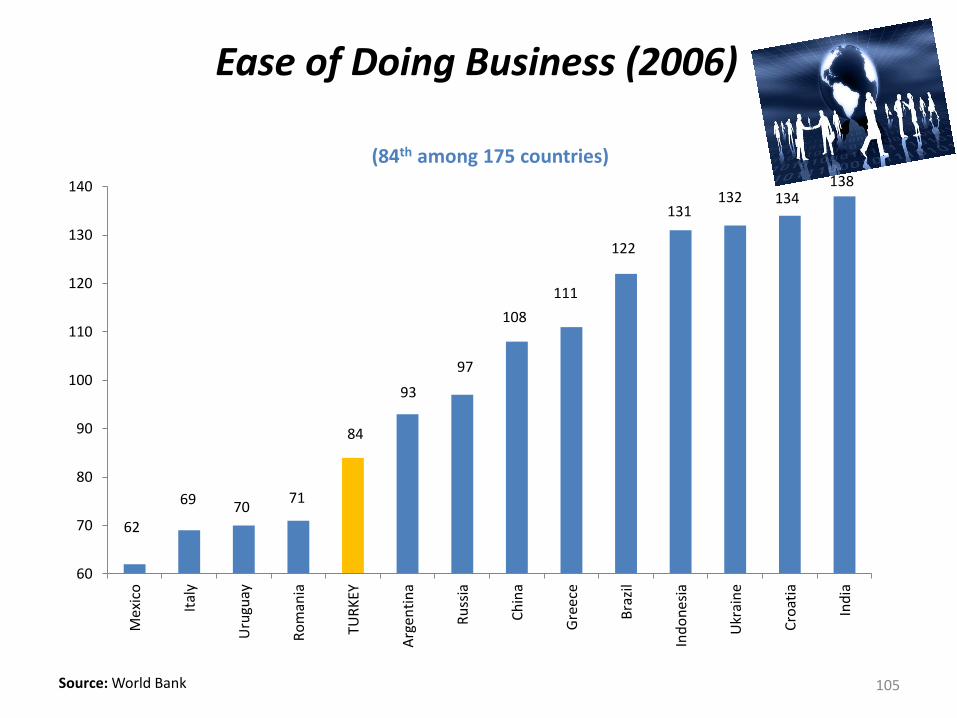
(84th among 175 countries)
Source: World Bank
Ease of Doing Business (2006)
62
69 70 71
84
93
97
108
111
122
131 132 134
138
60
70
80
90
100
110
120
130
140
Mex
ico
Ital
y
Uru
guay
Ro
man
ia
TUR
KEY
Arg
enti
na
Ru
ssia
Ch
ina
Gre
ece
Bra
zil
Ind
on
esia
Ukr
ain
e
Cro
atia
Ind
ia
105
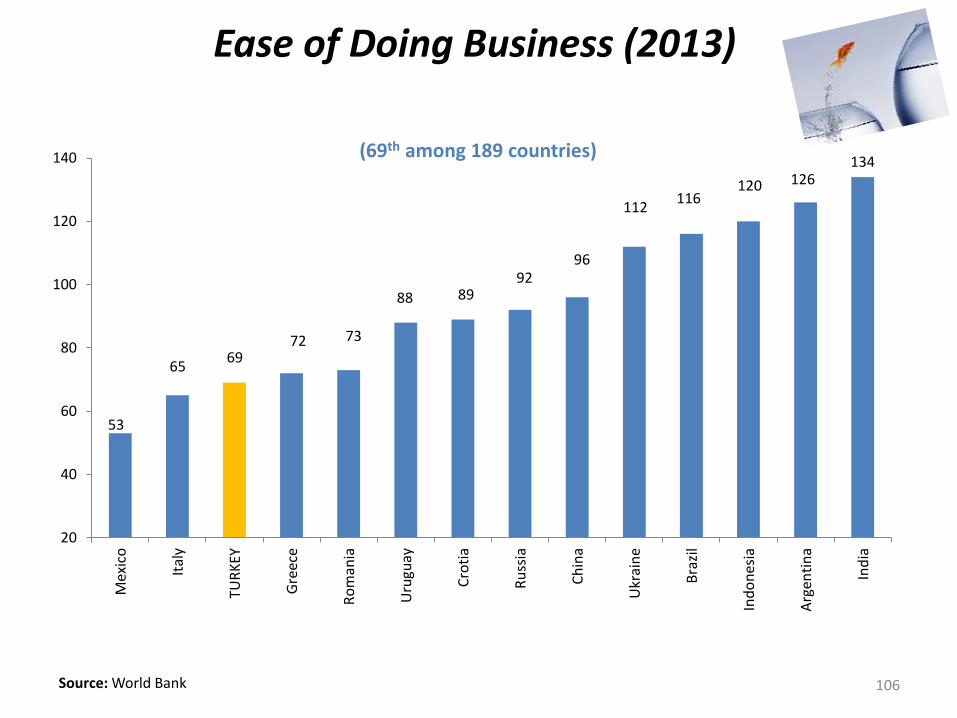
(69th among 189 countries)
Source: World Bank
Ease of Doing Business (2013)
53
65 69
72 73
88 89 92
96
112 116
120 126 134
20
40
60
80
100
120
140
Mex
ico
Ital
y
TUR
KEY
Gre
ece
Ro
man
ia
Uru
guay
Cro
tia
Ru
ssia
Ch
ina
Ukr
ain
e
Bra
zil
Ind
on
esia
Arg
enti
na
Ind
ia
106
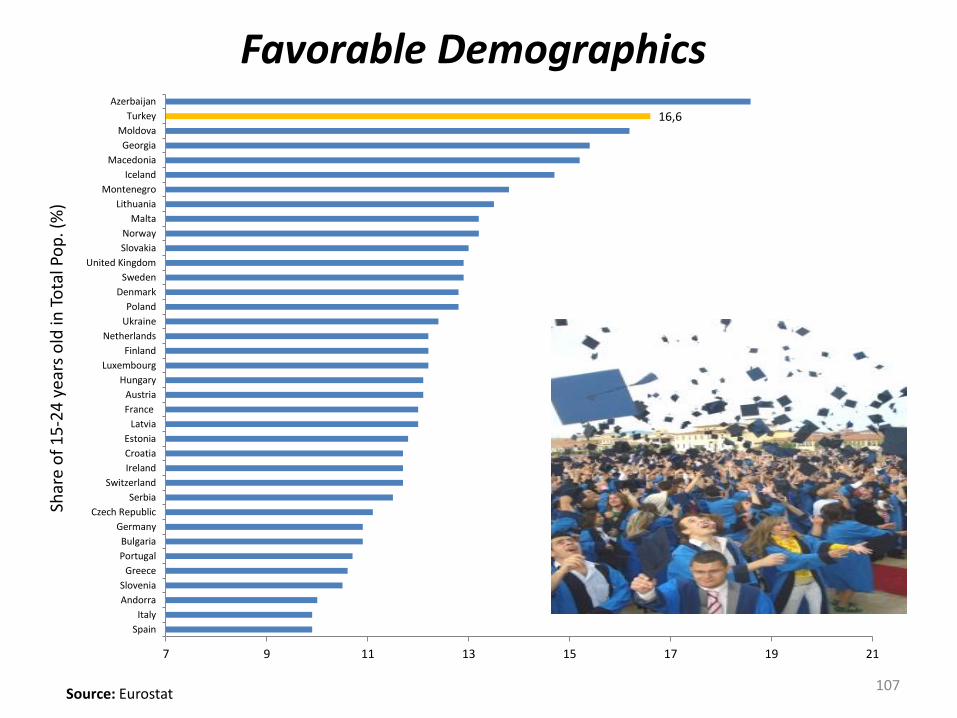
Favorable Demographics
Source: Eurostat
Shar
e o
f 1
5-2
4 y
ears
old
in T
ota
l Po
p. (
%)
16,6
7 9 11 13 15 17 19 21
Spain
Italy
Andorra
Slovenia
Greece
Portugal
Bulgaria
Germany
Czech Republic
Serbia
Switzerland
Ireland
Croatia
Estonia
Latvia
France
Austria
Hungary
Luxembourg
Finland
Netherlands
Ukraine
Poland
Denmark
Sweden
United Kingdom
Slovakia
Norway
Malta
Lithuania
Montenegro
Iceland
Macedonia
Georgia
Moldova
Turkey
Azerbaijan
107
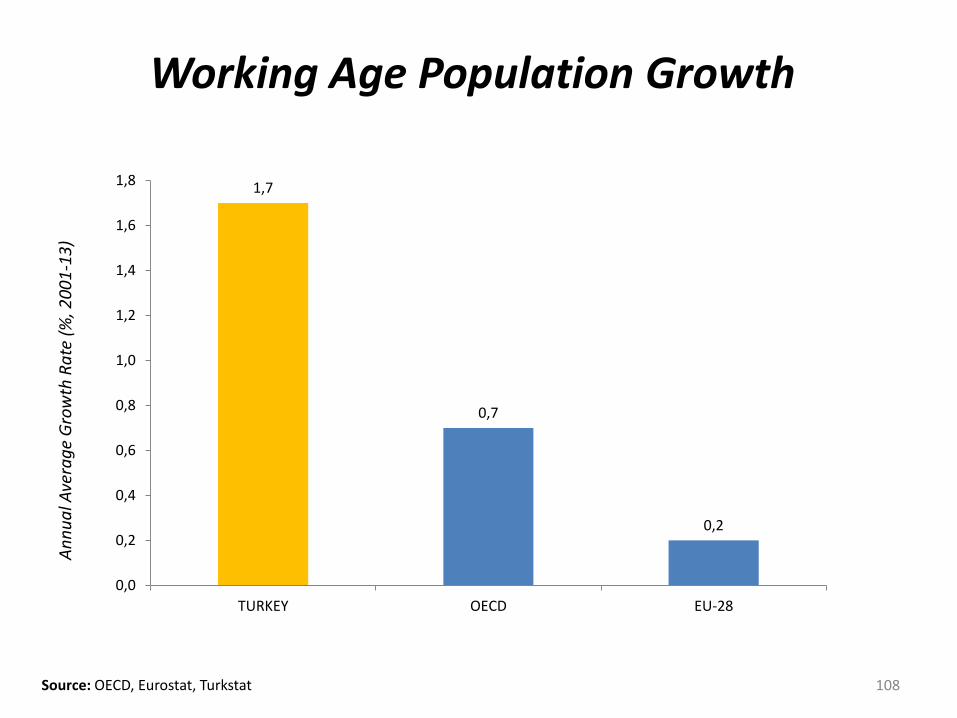
1,7
0,7
0,2
0,0
0,2
0,4
0,6
0,8
1,0
1,2
1,4
1,6
1,8
TURKEY OECD EU-28
An
nu
al A
vera
ge
Gro
wth
Ra
te (
%, 2
00
1-1
3)
Working Age Population Growth
Source: OECD, Eurostat, Turkstat 108
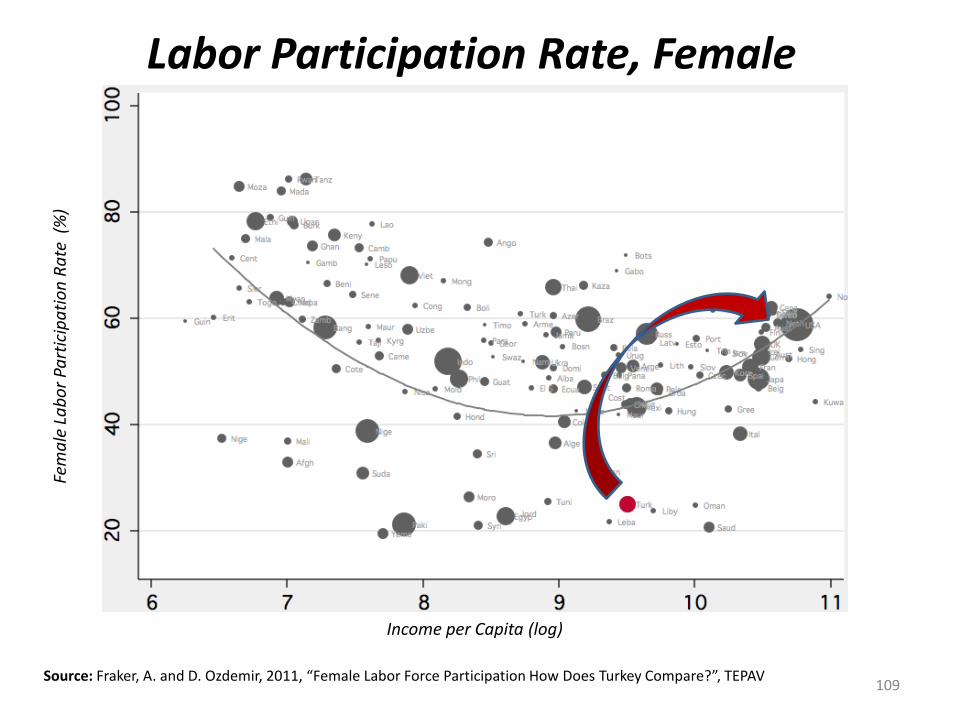
Labor Participation Rate, Female
Source: Fraker, A. and D. Ozdemir, 2011, “Female Labor Force Participation How Does Turkey Compare?”, TEPAV
Fem
ale
La
bo
r Pa
rtic
ipa
tio
n R
ate
(%
)
Income per Capita (log)
109
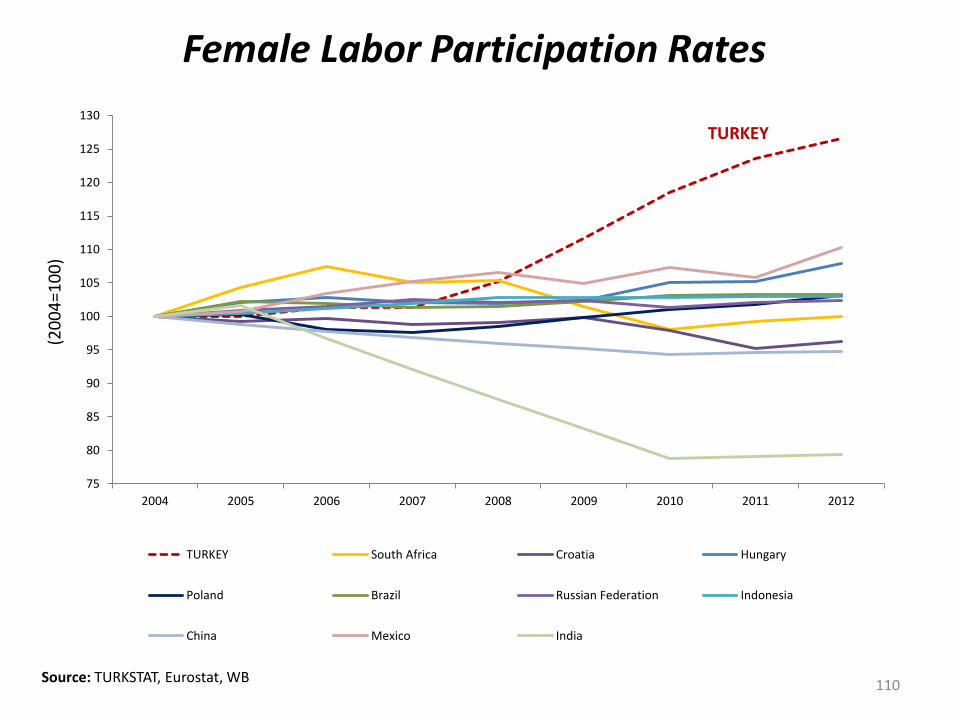
Source: TURKSTAT, Eurostat, WB
(
20
04
=10
0)
75
80
85
90
95
100
105
110
115
120
125
130
2004 2005 2006 2007 2008 2009 2010 2011 2012
TURKEY South Africa Croatia Hungary
Poland Brazil Russian Federation Indonesia
China Mexico India
TURKEY
Female Labor Participation Rates
110
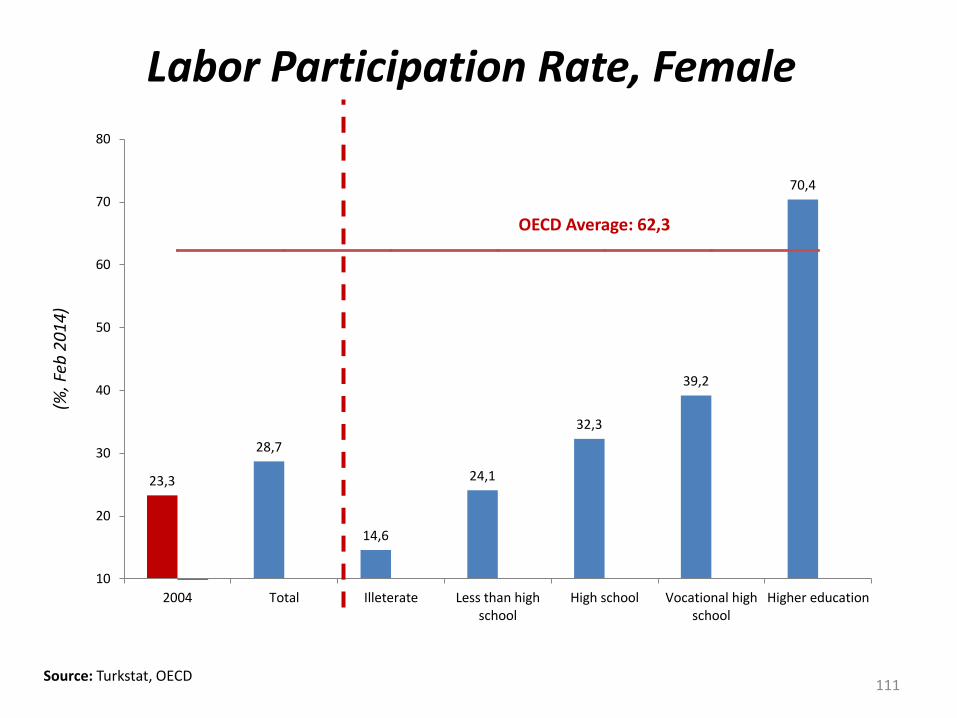
Labor Participation Rate, Female
Source: Turkstat, OECD 111
(%, F
eb 2
01
4)
23,3
28,7
14,6
24,1
32,3
39,2
70,4
10
20
30
40
50
60
70
80
2004 Total Illeterate Less than highschool
High school Vocational highschool
Higher education
OECD Average: 62,3

Formal Employment rising with Education
112 Source: TURKSTAT
No education
Primary
Lower secondary
Upper secondary
Tertiary
0
10
20
30
40
50
60
70
80
90
100
020406080100
(Informal Employment, %)
(Form
al Em
plo
ymen
t , %)
113
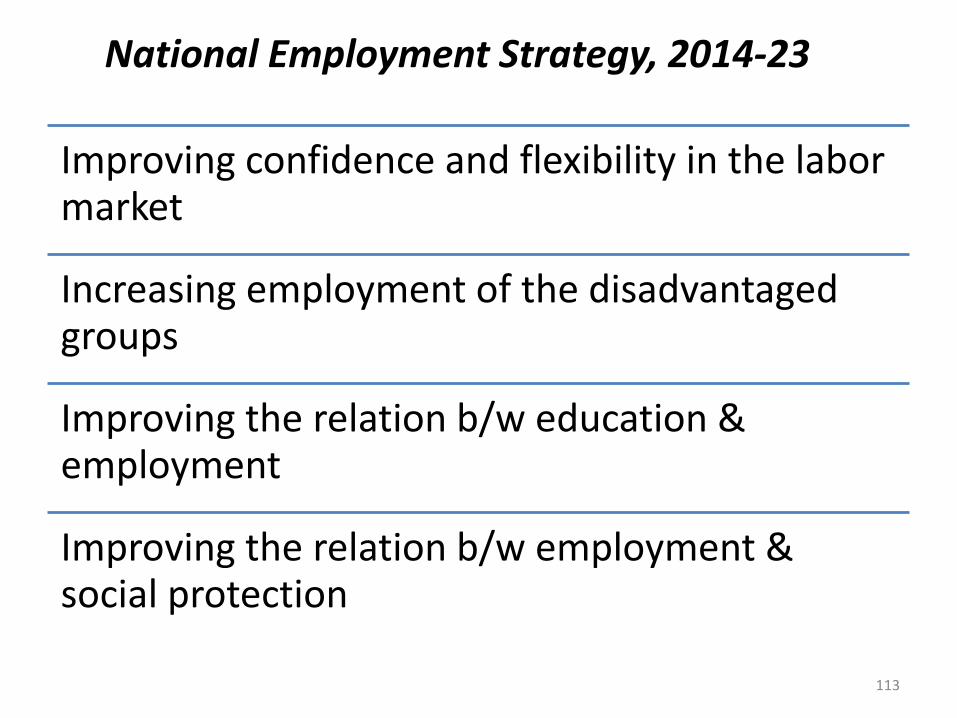
National Employment Strategy, 2014-23
Improving confidence and flexibility in the labor market
Increasing employment of the disadvantaged groups
Improving the relation b/w education & employment
Improving the relation b/w employment & social protection
114
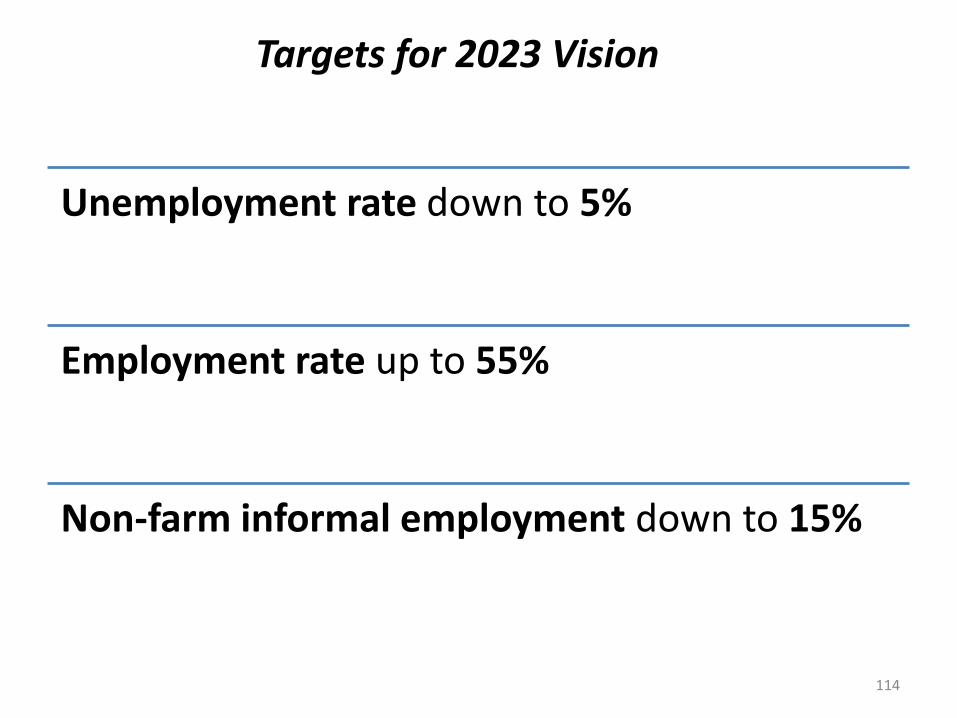
Targets for 2023 Vision
Unemployment rate down to 5%
Employment rate up to 55%
Non-farm informal employment down to 15%
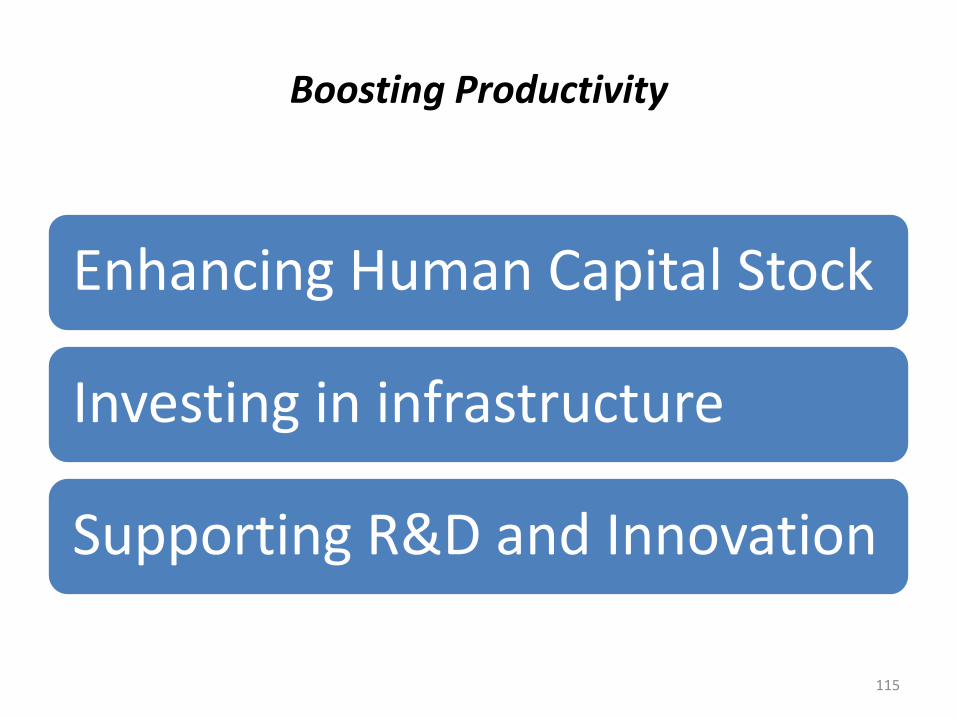
Boosting Productivity
Enhancing Human Capital Stock
Investing in infrastructure
Supporting R&D and Innovation
115
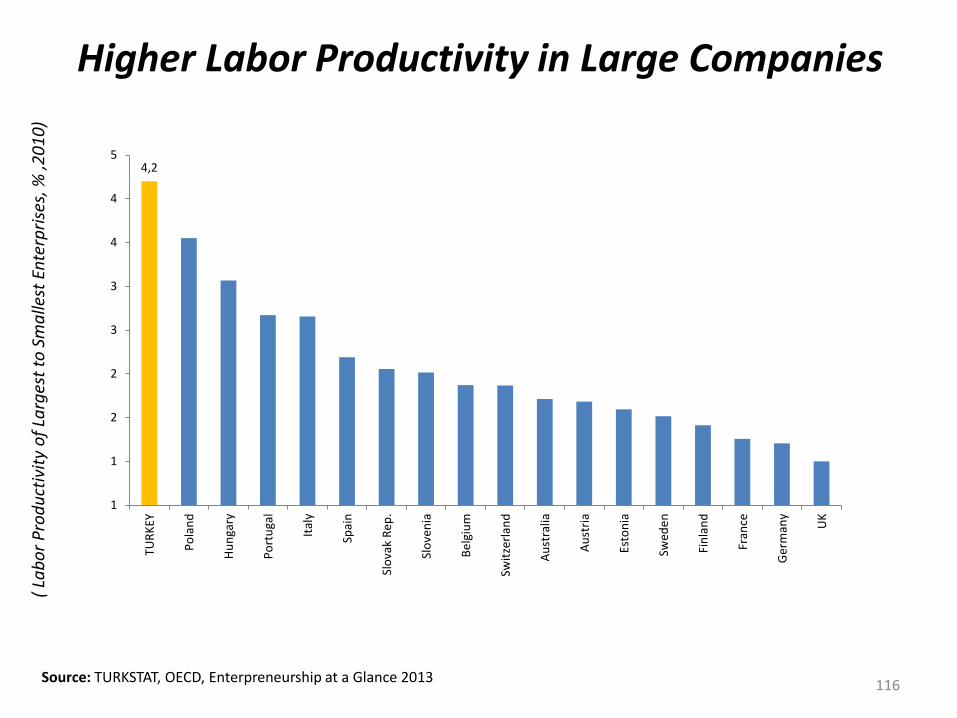
Higher Labor Productivity in Large Companies
116
( La
bo
r P
rod
uct
ivit
y o
f La
rges
t to
Sm
alle
st E
nte
rpri
ses,
% ,2
01
0)
Source: TURKSTAT, OECD, Enterpreneurship at a Glance 2013
4,2
1
1
2
2
3
3
4
4
5TU
RK
EY
Po
lan
d
Hu
nga
ry
Po
rtu
gal
Ital
y
Spai
n
Slo
vak
Rep
.
Slo
ven
ia
Be
lgiu
m
Swit
zerl
and
Au
stra
lia
Au
stri
a
Esto
nia
Swed
en
Fin
lan
d
Fran
ce
Ger
man
y
UK
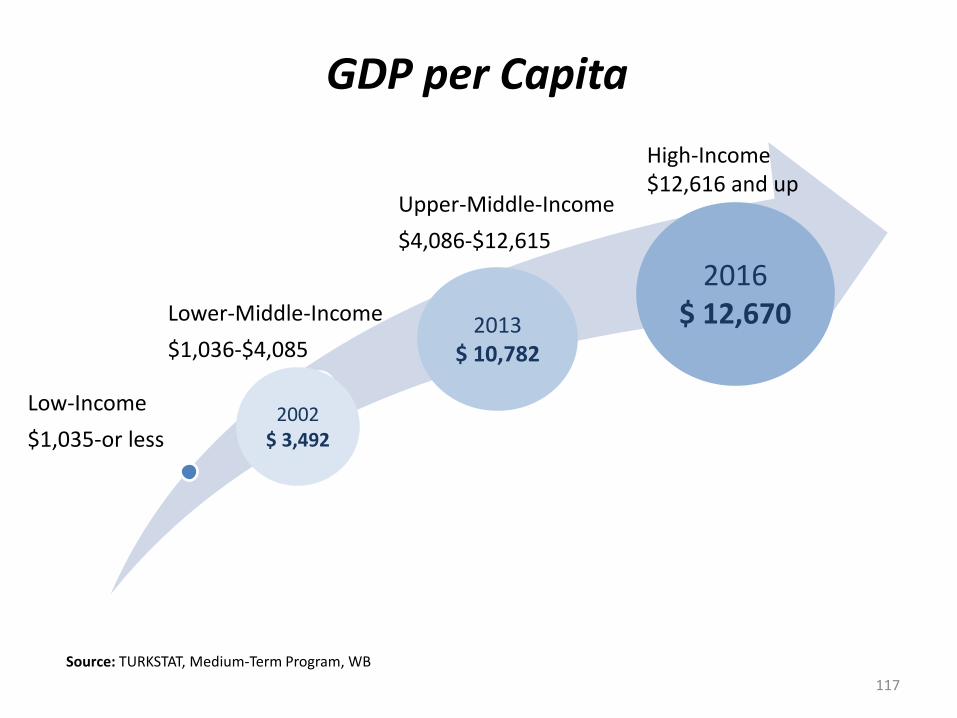
GDP per Capita
Low-Income
$1,035-or less
Lower-Middle-Income
$1,036-$4,085
Upper-Middle-Income
$4,086-$12,615
117
High-Income $12,616 and up
2002 $ 3,492
2013 $ 10,782
2016 $ 12,670
Source: TURKSTAT, Medium-Term Program, WB
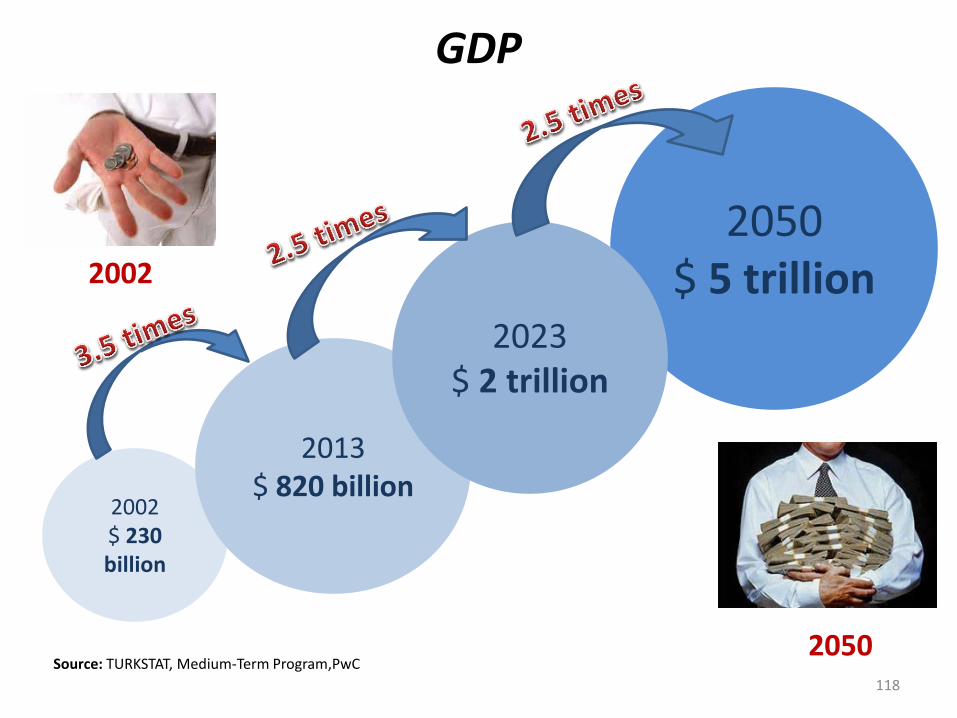
GDP
Source: TURKSTAT, Medium-Term Program,PwC
2002
2050
2002 $ 230 billion
2050 $ 5 trillion
2013 $ 820 billion
2023 $ 2 trillion
118

Thank You…
119