Embed Size (px)
Citation preview
2008 edition
European Economic Statistics
S t a t i s t i c a l b o o k s


2008 edition
European Economic Statistics
S t a t i s t i c a l b o o k s

Europe Direct is a service to help you find answers
to your questions about the European Union
Freephone number (*):
00 800 6 7 8 9 10 11(*) Certain mobile telephone operators do not allow access
to 00 800 numbers or these calls may be billed.
More information on the European Union is available on the Internet (http://europa.eu).
Luxembourg: Office for Official Publications of the European Communities, 2008
ISBN 978-92-79-08886-5
Cat. No. KS-30-08-410-EN-N
(Cat. No. printed publication KS-30-08-410-EN-C)
Theme: Economy and finance
Collection: Statistical books
© European Communities, 2008
© Cover photo: Argus @ fotolia.com
Copyrights of photos: Page 9: European Community. Page 23: Marlee @ fotolia.com.
Page 119: Alexander Moritz @ fotolia.com. Page 157: Marco Scisetti @ fotolia.com
Eurostat is the Statistical Office of the European Communities. Its mission is to pro-
vide the European Union with high-quality statistical information. For that purpose,
it gathers and analyses figures from the national statistical offices across Europe and
provides comparable and harmonised data for the European Union to use in the defi-
nition, implementation and analysis of Community policies. Its statistical products
and services are also of great value to Europe’s business community, professional
organisations, academics, librarians, NGOs, the media and citizens.
Eurostat's publications programme consists of several collections:
News releases provide recent information on the Euro-Indicators and on social,
economic, regional, agricultural or environmental topics.
Statistical books are larger A4 publications with statistical data and analysis.
Pocketbooks are free of charge publications aiming to give users a set of basic
figures on a specific topic.
Statistics in focus provides updated summaries of the main results of surveys, stu-
dies and statistical analysis.
Data in focus present the most recent statistics with methodological notes.
Methodologies and working papers are technical publications for statistical
experts working in a particular field.
Eurostat publications can be ordered via the EU Bookshop at http://bookshop.euro-
pa.eu.
All publications are also downloadable free of charge in PDF format from the Eurostat
website http://ec.europa.eu/eurostat. Furthermore, Eurostat’s databases are freely
available there, as are tables with the most frequently used and demanded short-
and long-term indicators.
Eurostat has set up with the members of the ‘European statistical system’ (ESS) a
network of user support centres which exist in nearly all Member States as well as in
some EFTA countries. Their mission is to provide help and guidance to Internet users
of European statistical data. Contact details for this support network can be found
on Eurostat Internet site.
EUROSTAT
L-2920 Luxembourg — Tel. (352) 43 01-1 — website http://ec.europa.eu/eurostat

4 European Economic Statistics
Acknowledgements
This Statistical Book could only be published thanks to the assistance and support of the Eurostat Editorial Committee, the authors of editorial and methodological articles, and the following colleagues in Eurostat who contributed to the data analysis sections:
EUROSTAT, THE STATISTICAL OFFICE OF THE EUROPEAN COMMUNITIES
DIRECTORATE C: NATIONAL AND EUROPEAN ACCOUNTS
C1 National accounts – methodology and analysis: P. Konijn, L.Svennebye
C2 National accounts - production: L. Biedma, D. Leythienne, A. Krüger, J. Jalava
C3 Public finance: L. Frej-Ohlsson
C4 Balance of payments: M. Hult, M. Hussain, L. Pappalardo, G. Vergina, T. Petridou
C5 Validation of public accounts: P. Parlasca, J. Verrinder, M. Wozowczyk
DIRECTORATE D: ECONOMIC AND REGIONAL STATISTICS
D4 Price statistics: C. Wirtz, T. Mrlianova
DIRECTORATE F: SOCIAL STATISTICS AND INFORMATION SOCIETY
F2 Labour market statistics: A. de la Fuente, F Ramb
DIRECTORATE G: BUSINESS STATISTICS
G3 International trade statistics — production: G. Gambini
Eurostat would like to thank following institutions for their assistance:
DIRECTORATE-GENERAL FOR TRANSLATION OF THE EUROPEAN COMMISSION
OFFICE FOR OFFICIAL PUBLICATIONS OF THE EUROPEAN COMMUNITIES

5 European Economic Statistics
Table of contents
page
Foreword . . . . . . . . . . . . . . . . . . . . . . . . . . . . . . . . . . . . . . . . . . . . . . . . . . . . . . . . . . . . . . . . . . . . . . . . . . . . . . . . . . . . . . . . . . . . . . . . . . . . . . . . . . . . . . . . . . . . . . . . . . . . . . . . . . . . . . . . . . . . . . . . . . . . . . . . . . . . . . . . . . . . . . . . . . . . . . . . . . . . . . . . . . . . . . . . . . . . . . . . . . . . . . 7
1. Editorial . . . . . . . . . . . . . . . . . . . . . . . . . . . . . . . . . . . . . . . . . . . . . . . . . . . . . . . . . . . . . . . . . . . . . . . . . . . . . . . . . . . . . . . . . . . . . . . . . . . . . . . . . . . . . . . . . . . . . . . . . . . . . . . . . . . . . . . . . . . . . . . . . . . . . . . . . . . . . . . . . . . . . . . . . . . . . . . . . . . . . . . . . . . . . . . . . . . . . . . . . . . 9
1.1 How macroeconomic statistics shape economic policy and vice-versa . . . . . . . . . . . . . . . . . . . . . . . . . . . . . . . . . . . . . . . . . . . . . . . . . . . . . . . . . . . . . . . . . . . . . . . . . . . . . . 11
1.2 Global economic statistics: The example of purchasing power parities . . . . . . . . . . . . . . . . . . . . . . . . . . . . . . . . . . . . . . . . . . . . . . . . . . . . . . . . . . . . . . . . . . . . . . . . . . . . . 17
2. Statistical Analysis . . . . . . . . . . . . . . . . . . . . . . . . . . . . . . . . . . . . . . . . . . . . . . . . . . . . . . . . . . . . . . . . . . . . . . . . . . . . . . . . . . . . . . . . . . . . . . . . . . . . . . . . . . . . . . . . . . . . . . . . . . . . . . . . . . . . . . . . . . . . . . . . . . . . . . . . . . . . . . . . . . . . . . . . . . . . . . . . . . . 23
2.1 Overview of statistical analysis . . . . . . . . . . . . . . . . . . . . . . . . . . . . . . . . . . . . . . . . . . . . . . . . . . . . . . . . . . . . . . . . . . . . . . . . . . . . . . . . . . . . . . . . . . . . . . . . . . . . . . . . . . . . . . . . . . . . . . . . . . . . . . . . . . . . . . . . . . . . . . . . . . . . 25
2.2 National accounts . . . . . . . . . . . . . . . . . . . . . . . . . . . . . . . . . . . . . . . . . . . . . . . . . . . . . . . . . . . . . . . . . . . . . . . . . . . . . . . . . . . . . . . . . . . . . . . . . . . . . . . . . . . . . . . . . . . . . . . . . . . . . . . . . . . . . . . . . . . . . . . . . . . . . . . . . . . . . . . . . . . . . . . . . . . . 28
2.3 Public finances . . . . . . . . . . . . . . . . . . . . . . . . . . . . . . . . . . . . . . . . . . . . . . . . . . . . . . . . . . . . . . . . . . . . . . . . . . . . . . . . . . . . . . . . . . . . . . . . . . . . . . . . . . . . . . . . . . . . . . . . . . . . . . . . . . . . . . . . . . . . . . . . . . . . . . . . . . . . . . . . . . . . . . . . . . . . . . . . . . 48
2.4 Inflation, interest rates and exchange rates . . . . . . . . . . . . . . . . . . . . . . . . . . . . . . . . . . . . . . . . . . . . . . . . . . . . . . . . . . . . . . . . . . . . . . . . . . . . . . . . . . . . . . . . . . . . . . . . . . . . . . . . . . . . . . . . . . . . . . . . . . . . . . . .76
2.5 External dimension of the economy . . . . . . . . . . . . . . . . . . . . . . . . . . . . . . . . . . . . . . . . . . . . . . . . . . . . . . . . . . . . . . . . . . . . . . . . . . . . . . . . . . . . . . . . . . . . . . . . . . . . . . . . . . . . . . . . . . . . . . . . . . . . . . . . . . . . . . . . . . . .87
2.6 Labour market . . . . . . . . . . . . . . . . . . . . . . . . . . . . . . . . . . . . . . . . . . . . . . . . . . . . . . . . . . . . . . . . . . . . . . . . . . . . . . . . . . . . . . . . . . . . . . . . . . . . . . . . . . . . . . . . . . . . . . . . . . . . . . . . . . . . . . . . . . . . . . . . . . . . . . . . . . . . . . . . . . . . . . . . . . . . . . . . 106
3. Methodology . . . . . . . . . . . . . . . . . . . . . . . . . . . . . . . . . . . . . . . . . . . . . . . . . . . . . . . . . . . . . . . . . . . . . . . . . . . . . . . . . . . . . . . . . . . . . . . . . . . . . . . . . . . . . . . . . . . . . . . . . . . . . . . . . . . . . . . . . . . . . . . . . . . . . . . . . . . . . . . . . . . . . . . . . . . . . . . . . . . . . . . . . . .119
3.1 Updating statistical methodology . . . . . . . . . . . . . . . . . . . . . . . . . . . . . . . . . . . . . . . . . . . . . . . . . . . . . . . . . . . . . . . . . . . . . . . . . . . . . . . . . . . . . . . . . . . . . . . . . . . . . . . . . . . . . . . . . . . . . . . . . . . . . . . . . . . . . . . . . . . . . 121
3.1.1 Update of the SNA 1993 and revision of ESA 95 . . . . . . . . . . . . . . . . . . . . . . . . . . . . . . . . . . . . . . . . . . . . . . . . . . . . . . . . . . . . . . . . . . . . . . . . . . . . . . . . . . . . . . . . . . . . . . . . . . . . . . 122
3.1.2 The Balance of Payments and International Investment Manual (BPM6) . . . . . . . . . . . . . . . . . . . . . . . . . . . . . . . . . . . . . . . . . . . . . . . . . . . . . . . . 130
3.2 European sector accounts . . . . . . . . . . . . . . . . . . . . . . . . . . . . . . . . . . . . . . . . . . . . . . . . . . . . . . . . . . . . . . . . . . . . . . . . . . . . . . . . . . . . . . . . . . . . . . . . . . . . . . . . . . . . . . . . . . . . . . . . . . . . . . . . . . . . . . . . . . . . . . . . . . . . . . . . . . . . 135
3.3 Harmonised indices of consumer prices . . . . . . . . . . . . . . . . . . . . . . . . . . . . . . . . . . . . . . . . . . . . . . . . . . . . . . . . . . . . . . . . . . . . . . . . . . . . . . . . . . . . . . . . . . . . . . . . . . . . . . . . . . . . . . . . . . . . . . . . . . . . . . . . . 144
4. Statistical annex . . . . . . . . . . . . . . . . . . . . . . . . . . . . . . . . . . . . . . . . . . . . . . . . . . . . . . . . . . . . . . . . . . . . . . . . . . . . . . . . . . . . . . . . . . . . . . . . . . . . . . . . . . . . . . . . . . . . . . . . . . . . . . . . . . . . . . . . . . . . . . . . . . . . . . . . . . . . . . . . . . . . . . . . . . . . . . . . . . . . . 157


7 European Economic Statistics
Foreword
It is a great pleasure for me to introduce a new Eurostat flagship publication “European Economic Statistics”. There are already a number of Eurostat publications illustrating different areas of the economy. However, a comprehensive Eurostat publication giving an overall picture of the structure and development of the European economy has not been available. This publication fills that need.
Although the major part of the publication is devoted to presenting and analysing the most recent statistics on the Euro-pean economy, its novel editorial and methodological sections provide background on topical issues and on the data pre-sented. Preparation of high quality and relevant statistics requires a close coordination between countries at international level and also a sensitivity to user needs, including the use of the data for decision making. These aspects are explored in the editorial section.
The publication covers the full range of Eurostat’s economic indicators, including national accounts, government finances, balance of payments, prices, monetary and financial accounts, foreign trade and the labour market.
I would like to congratulate members of the Eurostat editorial board and contributors for their valuable input.
Years ago a statistician might have claimed that statistics dealt only with the processing of data. A statistician today will be more likely to say that statistics is concerned with both processing data and ensuring they are relevant for decision making in the face of uncertainty. We can read in The Adventures of Sherlock Holmes “Data! data! data!” …I can’t make bricks without clay.” In this sense, I do hope that this publication will serve as clay for building bricks; that it will be found as a useful tool to study the European economy, and provide a helpful overview for the generalist user.
Hervé CarréDirector-General, Eurostat


Editorial


11 European Economic Statistics
1.1 How macroeconomic statistics shape economic policy and vice-versa
Marco Buti and João Nogueira Martins*European Commission — Directorate-General for Economic and Financial Affairs
“Nothing is more important for [economic] policy than good statistics.” Alexandre Lamfalussy (1996) 1
Economic accounting and macroeconomic statistics have been extremely successful fields of economics and statistics. Nowadays, it is inconceivable to reflect on economic issues without the concepts developed by statisticians — such as GDP or GNI, net borrowings, current account, price deflators, etc. — or discuss policy options without the respective data. It is no coincidence that economic theory and macroeconomic accounting have evolved in parallel for most of the last 80 years.2 The success and popularity of economic accounting also extends to the public at large. It is now all but impossible to find a copy of a quality newspaper in a democratic country that does not refer to GDP growth rates, external balances, govern-ment deficit and debt, savings ratio, etc.
Economic statistics as a key input into economic policy
In his presidential address to the Econometric Society, over 50 years ago, Kenneth J. Arrow described policymaking as having four parts: (i) an objective function; (ii) a range of policy instruments; (iii) a model of empirical relations between macroeconomic variables and (iv) computational methods.3 Macroeconomic statisticians have provided not only the meas-urement of the variables that enter each of the four parts identified by Arrow, but most of the concepts that constitute the language of modern economists and policymakers.
The objective function of policymakers expresses the relative desirability of different possible macroeconomic outcomes. Its form depends on a number of considerations, some cultural and ideological, and evolves with time. While acknowledging that the objective function should represent the welfare of a representative economic agent, economists often model policy-maker preferences with the help of simplified functions which depend on statistical concepts, such as projected real growth, the inflation rate, unemployment, the government deficit, external imbalances, the share of taxes paid and benefits received by social strata, and the distribution of income among factors or within categories of population. It is useful to keep in mind that these are only simplified descriptions of social welfare functions. Indeed, it is not possible to list all the arguments that enter into objective policymaker functions, let alone to present that function in an explicit way. If ever it was possible to make explicit the objective function of a policymaker (e.g. of a central bank or of a fiscal policymaker), and to have full knowledge of the relationship between policy instruments and variables in the objective function, then policymaking could be delegated to some computation device. This is also why the macroeconomic statistics that are required by policymakers are so extensive and ever changing.
To optimise the social welfare function — in analytical models, the objective function is often presented as a loss function of a quadratic form to be minimised — the policymaker has a number of instruments at its disposal. It may increase or decrease total government expenditure, modify the structure of expenditure either by changes in its economic classifica-tion (e.g. increasing investment and reducing social benefits) or in its functional classification (e.g. increasing education ex-penditure and reducing expenditure on public order), or replace social contributions with indirect taxes, among many other policy alternatives. The implementation of these policies will, in practice, involve changes in tax codes or in the budget laws,
1 The precise quote is “Nothing is more important for monetary policy than good statistics”, since it appeared in the foreword of a booklet published by the European Monetary Institute – the forerunner of the ECB — specifically devoted to statistics for monetary policy (The Statistical Requirements for Monetary Union, Frankfurt am Main, July 1996). We are confident that the Baron Lamfalussy would agree that his view on statistics extends to economic policy in general.
2 On the progress of economic accounts over the twentieth century and its cross-fertilisation with economy theory, see André Vanoli, Une Histoire de la Comptabilité Nationale, Paris: La Découverte, 2002. English version: A History of National Accounting, Amsterdam: IOS Press, 2005.
3 Kenneth Arrow, Statistics and Economic Policy, presidential address to the Econometric Society (Cleveland, 27 December 1956); reprinted in Econometrica, 25(4): 523-531.
* The views expressed in this article are those of the authors and are not attributable to the European Commission.
Editorial 1

12 European Economic Statistics
or some kind of administrative decision. However, as these examples illustrate, the whole reflection by the policymaker is based on concepts defined and measured by macroeconomic statistics.
For structural policies, the instrument may be more difficult to measure or to describe in economic accounting terms — consider for example, a change in the unemployment allowance eligibility rules, or in the rules on working hours, a liberalisation in the opening times of shops, reform of the financial supervisory framework, minimum wages for low-productivity workers or setting some minimum income for people on low incomes. However, these measures are expected to have some direct or indirect impact on variables monitored by macroeconomic statisticians — such as the poverty rate, growth, government deficit, unemployment, or private consumption — which appear in the objective function, or on intermediate targets.
The policymaker’s model, that is, the relations connecting instruments and variables that enter the objective function, and the tradeoffs or synergies between those variables, depend on theoretical conjectures. Purely theoretical considerations are, nevertheless, of limited interest for policymakers if they are not tested against empirical evidence. The information ac-cumulated over many years by statisticians and synthesised in long time series represent a laboratory for testing economic theories. Or, as Alan Greenspan puts it in his memoirs, “a forecast system is only as good as the accuracy of its historical data base from which future in a cycle can be projected”.4 This brings us to an important issue: a statistic in isolation is of limited value; the data accumulated over a number of periods is more valuable than the sum of its components in isolation. To know that the euro area external trade surplus amounted to EUR 6.1 bn in October 20075 would not be particularly use-ful for policymaking if one did not have comparable data for several years.
The computational methods can be seen as concrete forecasting procedures, like the forecasts published by Commission departments,6 or those underlying the government budget in each country. These computational methods try to anticipate the consequences of policy actions or market developments on the variables that enter the objective function. These fore-casts will have macroeconomic statistics as their key input and will show results according to the same concepts used by the statisticians. It is useful to note that, on most occasions, forecasts are the real triggers of policy action. Given the lags in policy decisions and in policy transmission mechanisms, policymakers cannot wait for hard data before reacting. A concrete example should make this clear: forward-looking central banks usually do not increase (or reduce) interest rates because the latest readings of price indices show inflation above (or below) some target, but because the latest available in-formation — including policy actions and soft data — have led them to change their inflation projections. This also shows that the arguments of the objective function to be optimised are not the data released by statisticians, but the projection for future developments in each of the macroeconomic variables.7 This is because policymaking is intended to influence events to come, while statistics are a description of past developments. The release of statistics is often more important to monitor the implementation of policies than to decide them in the first place.
In democratic societies, policymaking requires another step, not explicitly identified in the Arrow’s typology, in connection with the accountability of economic authorities. The latter must explain to the populations and to their elected representa-tives what the macroeconomic issues are and how policy initiatives tackle those issues. The public should be able to check the statistics to assess how effective policymakers have been — in controlling inflation, promoting growth, fighting unem-ployment, reducing income inequalities, etc. — whether policies are decided by elected governments or by independent agencies (such as a central bank or a fiscal council). This is not only because of the need for transparency in a democratic so-ciety, but for efficiency reasons. If policy decisions cannot be justified by reference to empirical evidence, the policy-maker will lack credibility. There are plenty of examples that show that decisions by credible institutions gain in efficiency. As a result, the statistical indicators must be able to summarise complex developments and issues in a small number of simple variables that can be understood not only by experts, but by the public at large.
The availability of statistics has helped to make modern-day politicians and policymakers more accountable for their ac-tions than ever. However, the role of statistics in the accountability of policymakers raises the issue of the statistical literacy
4 Alan Greenspan (2007), The Age of Turbulence: Adventures in a New World, New York, Penguin Press.
5 Eurostat News Release No 180/2007, 18 December 2007.
6 The Commission services’ forecasts appear four times a year: two rounds of full-fledged forecasts in spring and autumn — more than sixty variables for all EU Member States, candidate countries and for a few other major economies — and two rounds of interim forecasts for a reduced set of countries and variables. See e.g. Economic Forecasts — Autumn 2007, European Economy, No 7, 2007.
7 For example, in the literature on inflation targeting, the intermediate variable for the central bank is expected inflation and not the official inflation series compiled by the statistical offices.
1 Editorial

13 European Economic Statistics
of the public at large.8 In societies of ever-increasing complexity, with a proliferation of information sources of unequal quality, effective communication of official economic statistics is a task that needs to increase in relevance and priority for statistical offices. This communication and education includes explaining concepts, solving misunderstandings and avoid-ing pitfalls, as well as stating the limits of simple statistics in depicting complex issues, and making clear the margins of error of the published data.
Parallel evolution of economic policy and of economic accounting
To understand how the available statistics shape and influence economic policy, it is useful to consider how macroeconomic issues have influenced data requirements. The ‘birth certificate’ of modern macroeconomic statistics is dated 1934 when the first modern estimates of national income for the US for 1929-1932 were published by the US Department of Commerce in a report to the Senate.9 Modern macroeconomic statistics appeared as an autonomous branch of economics and statistics because of a concrete policy need. When the US Senate asked the Department of Commerce to prepare income statistics, the United States — and, in fact, most Western economies — were in the middle of the Great Depression. There was an ur-gent need to provide policymakers with information about the state of the economy that was more consistent and complete than the fragmentary information available until then, so that they could better understand effective developments, and ponder and calibrate measures to be taken.
The same policymaking purpose was present on several occasions in the last eight decades when economic accounting made a number of leaps forward. During World War II, in the UK and in the US, planning needs were the motivation for the development of macroeconomic statistics. There was a need to grasp what the military effort would imply for private consumption, or in the Keynes’s words ‘how to pay for the war’.10 The link between wartime policymaking and the develop-ment of economic accounting in the UK is well illustrated by the fact that the first set of modern accounts for the UK, by Richard Stone and James Meade, were published as an appendix to the white paper that accompanied the UK budget of April 1941.11 The need to know the economic consequences of demobilisation on employment and unemployment were also behind the compilation of input-output tables in the US shortly after.
At the end of the 1940s, the main macroeconomic policy issues were how to allocate resources in order to reconstruct the European economies. This was the context in which Stone helped to draft the UN report on the measurement of na-tional income and the construction of social accounts,12 which led to the 1953 edition of the System of National Accounts (SNA).13 In the 1950s and 1960s, when Keynesianism was reaching its zenith, the policy issues were the government’s tax-and-spend role with the aim of reaching and keeping full employment over the business cycle. The accumulation of consistent statistical data contributed to the development of the first macroeconomic models, such as those pioneered by Jan Tinbergen and Lawrence Klein, for forecasting and policy assessment purposes. The modelling of economies was also an incentive to compile more complete and detailed statistics and longer time series. At the same time, financial issues were becoming more and more relevant to the understanding of economic developments. This explains several of the improvements in the SNA of 1968, the development of national accounting systems in many countries, improvements in the measurement of non-market output, on the production of constant-price measures that would allow better compari-son of economies across time and the production of accounts that distinguish financial and non-financial corporations. The evolution of the balance of payment manuals14 was also heavily influenced by changes in the international monetary system and by a number of currency crises. In Europe, the establishment of the customs union was fundamental to the development of external trade statistics.
8 Some authors even question statistical literacy among economists and policymakers! See for example Vito Tanzi, ‘Fiscal Policy: When Theory Collides with Reality’, CEPS Working Document, No 246, June 2006; and Fritz Bos, ‘Use, Misuse and Proper Use of National Accounts Statistics’, Statistics Netherlands Occasional Paper, NA-096, 2007.
9 US Department of Commerce (1934), ‘National Income 1929 to 1932’, Senate Document 124, 73d Congress, 2d session, January 4 1934; summary published in Survey of Current Business, 14(2), February, 17-19 available for download at: http://library.bea.gov/u?/SCB,4219.
10 Keynes, J. M., How to Pay for the War: A Radical Plan for the Chancellor of the Exchequer, London: Macmillan, 1940.
11 ‘An Analysis of the Sources of War Finance and an Estimate of the National Income and Expenditure in 1938 and 1940’, 7 April 1941.
12 United Nations, Measurement of National Income and the Construction of Social Accounts, Geneva: United Nations.
13 Organisation for European Economic Cooperation, A Standardised System of National Accounts, Paris: OEEC, 1952; and United Nations, A System of National Accounts and Supporting Tables, 1952.
14 The balance of payments manual was initially published in 1948, and then revised in 1950 (2nd edition), 1961 (3rd edition), 1977 (4th edition) and 1993 (5th edition). The 6th edition is expected to be completed by the IMF in 2008.
Editorial 1

14 European Economic Statistics
The publication of ESA (1st and 2nd editions, 1970 and 1979 respectively)15 was directly related to the need for macroeco-nomic coordination among the EU Member States. ESA expanded on previous manuals in areas like production and fi-nance, distribution and redistribution of income and allowed more precise comparison of different economies. During the stagflation years of the 1970s, interest and methodological progress moved to the development of more accurate measures of prices and of inflation-adjusted output. More recently, technological progress, and major changes in the quality and price of some products and services, led to better measurements of deflators, including direct measurement of non-market output, hedonic pricing and chain-linking of constant-price series. The SNA of 199316 and the corresponding European version — ESA9517– can be seen as a reply to the changing structure of economies, given a stronger emphasis on financial issues, identifying new financial instruments, widening the concept of capital formation (e.g. expenditure in software) and opening the way to environmental accounts — an area that remains underdeveloped but that one may expect will increase in political relevance in coming years.
Over the last 15 years, economic and monetary union has been a major catalyst of the increase in quantity and quality of macroeconomic statistics in the EU. Initially, attention focused on the variables that were relevant to the assessment of con-vergence as defined in the Maastricht Treaty, in particular harmonised price indices and the government deficit and debt. Inflation and fiscal data were, and remain, crucial in the identification of countries eligible to join the monetary union. In both areas, prices and fiscal, there has been major progress in terms of quality, comparability and timeliness of the data.18
Since 1998, attention has focused on the availability and timeliness of several other indicators — notably quarterly national accounts; short-term public finance data; labour market statistics; short-term business statistics, including industrial pro-duction, construction and retail trade; and external trade indicators — not only for the EU and the monetary union but for each country. This development came from the clear perception by both statisticians and policymakers that the euro area was more than the simple sum of its component countries and that a proper analysis of economic developments in the monetary union required a strategy that would go beyond the aggregation of statistics compiled by each country for its own use, with less than fully consistent definitions and published at different intervals. However, in spite of major advances in the last decade, macroeconomic statistics in the euro area are still somewhat behind those available for the US, notably in terms of timeliness and wealth of detail. Moreover, most statistics for the euro area are still the result of aggregating data from different countries, rather than a direct estimation of data for the area as a whole.
Challenges for the future
Macroeconomic statistics have long lead times between the decision to compile specific data and the effective use of those data by policymakers. Methodological issues need to be discussed; concepts harmonised among countries; the proper in-frastructure to compile data needs to be put in place; the statistical quality of the first estimates needs to be tested; series for past years have to be estimated or retropolated; new concepts need to be explained to data users; users themselves also need time to become acquainted with a new series, understanding its attributes and links with other variables, and even to acquire trust in the new figures. As a result, statisticians need to anticipate policy needs; this can only be done if there is permanent interaction between data users and data producers.
A number of trends are emerging in the statistical requirements for the next decades. Economies are increasingly complex. Though statistics have the merit of summarising complex events in simple indicators, the complexity of real life will re-quire the compilation of different statistics with similar purposes. This will allow different sets of data to be tested for their plausibility and accuracy and give users different perspectives on the same phenomenon. This refers to different inflation measures (for example by including the price of assets, imputed rentals for owner-occupied housing, or establishing price indices by social stratum), different growth measures (taking for example environmental issues and depletion of natural resources into account), or different concepts of government deficit (for example, calculated with alternative government delimitations, or on competing basis, such as accruals and cash) or of debt (for example including contingent commitments or implicit liabilities). In several areas, the competition between different indicators may also help to solve the trade-offs between the different dimensions of statistical quality, such as reliability, completeness, timeliness and comparability across
15 Eurostat, European System of Integrated Economic Accounts, Luxembourg, 1970 (2nd edition 1979).
16 Eurostat-IMF-OECD-UN-World Bank, System of National Accounts 1993, Luxembourg, New York, Paris and Washington.
17 Official Journal of the European Communities, L 310, 30 November 1996.
18 On preparation for monetary union and the development of statistics, see Hans van Wijk, Bridging the Fault Lines — The Early Years of the CMFB, 2001; and Peter Bull, The Development of Statistics for the Economic and Monetary Union, Frankfurt: ECB, 2004.
1 Editorial

15 European Economic Statistics
time and space. However, this competition among different indicators for similar purposes is not without risks. Data us-ers, both experts and the public at large, should be informed of the merits and drawbacks of each indicator — for example their respective margins of uncertainty — so that they learn how to compare pears with pears and apples with apples, when assessing the performance of different countries and regions. Moreover, communication with the public also needs to im-prove where there are persistent gaps between the official measurements and popular perceptions.
The fast change in economies means that policy reactions should be quicker than they used to be to remain effective. Policy-makers will need data that are published with a higher frequency and with shorter lags after the events they describe. More and more, statisticians are, and will be, asked to ‘nowcast’ a number of variables, blurring the boundaries between ex post hard data and ex ante forecasts. In a number of areas, data that used to be available annually are now compiled quarterly, and data that are available quarterly will have to be published monthly.19 While higher frequency data and short publication lags may contribute to improving policymaking by reducing the lag between the appearance of a macroeconomic issue and the policy response, there is also a need to ensure that high-frequency data properly identify new trends and distinguish these from the intrinsic volatility of variables, and that the reduction in compilation lags is not achieved at the expense of a deterioration in the quality of first outcomes.
Globalisation, that is the progressive economic and financial integration of countries raises another major challenge for statisticians. There are several interrelated issues here. Notably, the increasing interdependency of economies is making statisticians’ work more difficult, as some data may become more demanding to compile in spite of technological progress in automated data collection. This is illustrated by the fact that the aggregate current account of the World does not bal-ance out — a fact that is increasingly bothersome for global economic analyses. Another example relates to the vertical integration of production within large multinational firms established in several countries; given their strategies of transfer pricing, it is increasingly difficult to identify precisely the geographic distribution of the value added of a number of goods. Moreover, policymakers are interested, not only in what is happening in their own countries’ economies, but also in their partners’ and competitors’. International organisations have a major responsibility to harmonise concepts, and to make data published by different countries comparable so that statistics are a public good not only within each country, but at a more global scale.
The pervasive impact of financial markets on modern economies is obliging policymakers to improve their knowledge of the financial assets and liabilities of the economies, including those liabilities which are contingent. Movements in the price of financial assets (and non-financial assets, such as housing) are also acquiring particular relevance. The financial turmoil initiated in the summer 2007 with the crisis in the subprime segment of the mortgage market in the US shows that our knowledge of the financial exposure of economic agents is not good enough, and that statistics have been at a loss to follow financial innovation.
In knowledge-based economies, the best assets of countries are no longer their natural resources, nor even their tangible infrastructure, but human capital and ability to change and innovate. Macroeconomic statisticians will have to consider the measurement of human capital and to widen the definition of investment to better measure spending with research and de-velopment. The measurement of human capital should also give a new impetus to better statistics on income distribution.
Services now represent a very significant share of value added in all advanced economies. As a result, indices of services output are gradually becoming more relevant for policymakers than data on manufacturing. However, for most countries, short-term business statistics are still excessively focused on manufacturing, though the latter keeps losing relevance in the economic structure of modern countries.
The ageing of the population is among the most significant challenges for economic policy in the coming decades. To mini-mise adverse consequences and promote favourable developments, policymakers need to react long in advance. Issues that were of secondary relevance in a stable demographic environment — such as pension spending and pension entitlements, healthcare costs, etc. — are attracting particular interest. In the EU, there have been discussions on these issues for some time. The regular publication of statistics on pension entitlements, which are currently under preparation, will be most welcomed by economists. Concerns on the quality of public finances are also requiring better statistics on the composition of government expenditure, better measurement of government output and other data that will allow us to assess value for money in government expenditure and the efficiency of tax systems.
19 For example, one of the recommendations of the so-called Allsopp review of 2004 in the UK was the compilation of monthly gross value added (Christopher Allsopp, Review of Statistics for Policy Making – Final Report to the Chancellor of the Exchequer, the Governor of the Bank of England and the National Statistician, 2004).
Editorial 1

16 European Economic Statistics
There is increasing interest in the environmental consequences of public policies. Environment issues are arguably the major challenge for policymakers in the coming decades; better integration of macroeconomic and environment statistics would contribute substantially to sustainable economic development. Moreover, the link between the environment and the economy will be a crucial step in the direction of a better measurement of economic well-being.
The EU has pioneered the use of statistics in a number of high-profile administrative and political uses. Macroeconomic statistics have a crucial role in the selection of countries to join the euro area, in the mechanism of fiscal discipline of the EU — the Stability and Growth Pact20 –, in establishing the percentage of each national central bank in the ECB share capital and therefore in the distribution of monetary income, in deciding how much each country contributes to the EU budget and even in selecting the regions eligible to receive financing from structural funds. These administrative and political uses are themselves part of policymaking processes. Yet, the peculiarity is that there is more of a univocal cause-and-effect relation between statistics and policy decisions. Once the data are revealed by the statistical authorities, one already knows what the decision is going to be and what the consequences are; the leeway for policymakers, if any, is very limited. Although the administrative use of statistics in the EU has been successful — they have helped to increase predictability in a number of decisions and to base key choices on objective criteria, thus avoiding fruitless discussions — they have put a heavy burden on the statisticians’ shoulders. Moreover, experience has shown that a number of political incentives — both good and bad — appear when a statistical indicator becomes a target or a high-profile reference value. To remain successful in the future, statisticians should explicitly consider these political incentives when identifying their priorities, defining their conven-tions and accounting rules and ultimately when compiling the data.
20 For the economic foundations and institutional procedure of the Stability and Growth Pact, see Anne Brunila, Marco Buti and Daniele Franco (eds.), The Stability and Growth Pact — The Architecture of Fiscal Policy in EMU, Basingstoke: Palgrave, 2001 and Marco Buti and Daniele Franco, Fiscal Policy in Economic and Monetary Union, Cheltenham: Edward Elgar, 2005 and references therein.
1 Editorial

17 European Economic Statistics
1.2 Global economic statistics: The example of purchasing power parities
Lars SvennebyeEurostat, National accounts: methodology and analysis
When preliminary results of the 2005 round of the International Comparison Programme (ICP) were released in December 2007, these were the first new global estimates of the size of economies and of countries’ price levels for nearly two decades. The development of the ICP and the successful implementation of the 2005 round can serve as an example of large-scale interna-tional statistical cooperation that goes beyond the mere harmonisation of existing national statistics.
International statistical cooperation
National Statistical Institutes (NSIs) were initially established to serve the nation state, in response to a demand from gov-ernments for data on their people and economies. Still today, the needs of domestic policymakers are, not surprisingly, an important guideline for NSIs in determining what statistics to produce and how to allocate resources.
However, policymaking is no longer the exclusive domain of the nation state. Increased interaction among nation states in fields like trade, investment and migration since the mid-20th century has created a number of global and regional political bodies, like the United Nations, the European Union, the World Bank and the International Monetary Fund. In an increas-ingly globalised and interdependent world, policymakers can no longer restrict themselves to their own countries. This has given rise to substantial demand for statistics that allow reliable comparisons of economic and demographic indicators across countries.
To this day, the standardisation and harmonisation of statistics initially produced by National Statistical Institutes remains perhaps the most dominant aspect of international statistical cooperation. The aim of these standardisation and harmoni-sation efforts is to allow international comparisons of national statistics. Typically, this form of cooperation involves har-monising concepts and definitions, developing common classifications, and unifying the format of dissemination, leaving each country in charge of the actual production of the statistics within the mutually agreed methodological framework.
Some fields of statistics, however, require not only a common conceptual framework, but also a high degree of centralised management and supervision. These are statistics that by their very nature are multilateral, that is, they are not or cannot be produced by each National Statistical Institute unilaterally. This may be so because the results for one country depend on the results for another, or because the predominant user community is located outside the nation state, for instance, in international organisations and agencies.
For the remainder of this article, a closer look will be taken at a very comprehensive and demanding statistical undertaking that serves as an example of global statistical cooperation in a field that cannot be appropriately surveyed within the context of national statistics. The International Comparison Programme (ICP) and its European counterpart, the Eurostat-OECD PPP Programme, are both aimed at producing price-level adjustment factors, or purchasing power parities (PPPs), applied primarily in international comparisons of national accounts (NA). The main task for the participating countries is to carry out price surveys for a regionally determined sample of consumer goods and services, and to provide the other input data required, notably expenditure weights, price data on non-market services and on investment goods. This requires highly harmonised methodologies and practices, and a substantial degree of overall coordination.
Special attention will be paid to the organisation of the recently completed 2005 round of the ICP, with some selected results of the exercise included for the sake of illustration. The Eurostat-OECD PPP Programme will also be discussed, focusing in particular on its internal structure and integration with the ICP.
The International Comparison Programme
The origins of international price and volume comparisons of GDP can be traced back to the experimental comparisons carried out by the Organisation for European Economic Cooperation (OEEC), the forerunner of the OECD, in the 1950s.
Editorial 1

18 European Economic Statistics
At first, this programme covered just five countries, but was later expanded to nine.
Building on the OEEC experience, the International Comparison Project (later to become the International Comparison Programme) was launched in the late 1960s. Begun as a research project, its goal was to create a framework for worldwide PPP-based comparisons to be carried out on a regular basis. The United Nations Statistics Division (UNSD) and the Univer-sity of Pennsylvania shared responsibility for the project, with the latter taking the lead role. However, the first three rounds of the ICP (1970, 1973 and 1975) remained essentially experimental in character.
Following the 1975 round, four major developments occurred. First, the ICP became a regular part of the work programme of the UNSD, with the University of Pennsylvania advising on methodological issues. Second, Eurostat started to play an increasingly important role, organising the comparisons for the EU Member States and providing technical and financial assistance with regional comparisons in Africa. Third, the OECD became involved in the work. Fourth, and most signifi-cantly, the ICP adopted a regionalised management structure.
Regionalisation placed a greater share of the work on the regional organisations of the United Nations, like the Economic Commission for Europe (UNECE) and similar agencies in other regions. This left UNSD at the centre to coordinate the regional comparisons and to ensure that they could be linked into a global comparison. Two rounds of the ICP were com-pleted after regionalisation. By 1985, 64 countries took part worldwide.
The subsequent round of the ICP was planned for the reference year 1993. Although some regions did eventually publish their regional results, the 1993 round was widely regarded as a failure. Poor management and insufficient resources at all levels — central, regional and national — were identified as the principal reasons for this lack of success. The ICP was judged unable to meet user demands, especially with regard to reliability and timeliness of the results. Under these circumstances, the main recommendation for future rounds was that the ICP, to improve its credibility, needed to undergo thorough or-ganisational reform.
The 2005 ICP round
In 2002, after several years of preparation, the United Nations Statistical Commission (UNSC) finally decided to re-launch the ICP. Following the failure of the 1993 round and based on professional recommendations, a very explicit organisational framework was created. At central level, a corporate-style management structure was adopted, with an Executive Board in charge of strategic decisionmaking, a secretariat (“Global Office”) with several full-time employees responsible for day-to-day coordination of the programme, both administrative and technical, and a Technical Advisory Group to advise on methodological and technical issues. The Executive Board included representatives of the World Bank, IMF, UNSD, Euro-stat, and OECD, plus all the Regional Coordination Offices, while the Technical Advisory Group consisted of highly quali-fied professionals in the field of PPPs and statistical methodology in general, appointed on individual merit.
At regional level, Regional Coordination Offices were established with existing agencies. These were the African Develop-ment Bank, the Asian Development Bank, the Interstate Statistical Committee of the Commonwealth of Independent States (CISSTAT) and the Federal State Statistical Service of the Russian Federation (ROSSTAT), the UN Economic Commission for Latin America and the Caribbean, Statistics Canada, and the UN Economic and Social Commission for Western Asia. The focal role of the Regional Coordinators was to coordinate and supervise the conduct of price surveys and the provision of other data in the participating countries, to lead the inter-country validation of the survey results, and to function as a link between the participating countries and the Global Office.
In addition, the ICP maintained close links with the Eurostat-OECD PPP Programme, which, while maintaining its status as a separate statistical undertaking, was simultaneously included as a region in the ICP.
The new management structure brought about considerable improvements over the previous rounds. In the organisation of surveys, the participating countries were involved in the whole process of planning and executing surveys, and validating the regional results in close cooperation with their Regional Coordinator. Furthermore, at regional level, several training workshops were held, while the Global Office provided handbooks, manuals and standardised software to assist countries and Regional Coordinators in the collection and validation of data. The Technical Advisory Group provided useful input on methodology, contributing substantially to increasing the reliability of the results.
1 Editorial

19 European Economic Statistics
The number of countries taking part in the exercise (146) was much higher than in any previous round. The lack of a sense of “ownership” of the ICP by the participating countries had previously been identified as a weakness, and the need for in-creased capacity building and coordination with other parts of countries’ national statistical programmes were thus given considerable attention. In particular, close integration with National Accounts and with the Consumer Price Index (CPI) data collection was encouraged in order to improve the quality of results while simultaneously incorporating the ICP into the regular work of National Statistical Institutes.
The countries participating in the Eurostat-OECD PPP Programme conducted their exercise independently, according to their established work plan. However, great efforts were made to ensure methodological consistency between the two programmes.
The Eurostat-OECD PPP Programme has a long history independent of the ICP. With advancing economic integration in Europe, the need gradually arose for reliable price and GDP volume measures for the member states of the European Com-munities. Eurostat undertook its first comparison of price levels and National Accounts in the then nine EC Member States in 1975. Since then, the Eurostat programme has expanded to include, as of 2008, a total of 37 countries: the 27 EU Member States, three EU candidate countries, three Member States of the European Free Trade Association (EFTA), and four further countries in South-Eastern Europe that are not included in any of these categories. The OECD coordinates eight further countries, most of them non-European OECD Member States. The Eurostat group and the OECD group of countries adhere to the same methodological framework, and, with a few minor exceptions, to the same practices.
As in the ICP, the main task facing the participating countries is the provision of national input data into the PPP calcula-tion. Until 1999, Eurostat itself undertook the task of preparing, coordinating and validating the surveys, in cooperation with the countries. With the number of countries in the programme steadily increasing, this task became more and more complex, and for this reason, it was decided to reorganise the price surveys for consumer goods and services. These surveys are now carried out relatively autonomously in three geographically defined country groups. Each of these regional groups has a group leader country, which leads and supervises the price surveys among the countries in the group, and coordinates the intra-group work undertaken with that of the other groups, in order to maintain comparability at the European level and secure the reliability of the overall European results.
An important advantage of this organisational model is that the group leaders are themselves participant countries in the process, and thus familiar with the challenges facing the NSIs in the process of providing the input data required. Another factor contributing to the quality of the survey results is that the regional sub-groups are in many ways more homogeneous with regard to consumption patterns than the entire group of 37 countries taken as a whole. In addition, group leaders have over time developed substantial knowledge of the product markets in “their” countries, knowledge that is of considerable value when it comes to establishing a comparable and representative product sample for each price survey.
PPPs are of great operational importance for the EU. This is particularly so in the field of regional policies, where the regions eligible for support from the Structural Funds are determined by the regional GDP of each region, expressed in Purchasing Power Standard (PPS)21. Furthermore, PPPs are used in analyses of price convergence in Europe, and in a variety of other, sector-specific analyses. Since the results of the Eurostat PPP programme have immediate budgetary consequences for the EU, it was deemed necessary to formalise the procedures of the PPP production process and clarify the rights and obliga-tions of all parties involved. For this reason, the methodology and procedures of the Eurostat PPP programme are laid down in a separate Regulation of the European Parliament and the Council.22
As stated above, the ICP is divided into six regions, each one responsible for the coordination of the price surveys conducted in the countries of the region, and for the provision of other input data. The Eurostat-OECD PPP Programme, while main-taining its status as a separate entity, is also one of the six regions in the ICP. However, the participation of the Eurostat-OECD region in the ICP does not affect the day-to-day operation of the Eurostat programme or cause more work for the countries. As pointed out in the previous sections, Eurostat and the OECD also plays an important role in the ICP in their capacity as members of the Executive Board, and by providing technical and practical support on a more informal basis, drawing on their experience from their own, long established PPP programme.
21 PPS is the technical term chosen by Eurostat for the common currency in which NA aggregates are expressed when they are adjusted for price level differences using PPPs. Thus, PPPs can be interpreted as the exchange rate of the PPS against the euro.
22 Regulation (EC) No 1445/2007 of the European Parliament and of the Council of 11 December 2007 establishing common rules for the provision of basic information on purchasing power parities and for their calculation and dissemination, OJ L 336, 20.12.2007.
Editorial 1

20 European Economic Statistics
Spatial comparisons of National Accounts
The availability of PPPs is of the utmost importance in global comparisons of income and expenditure levels. While the main focus of national accounts (NA) has traditionally been to measure the development of economic aggregates over time, there is substantial and increasing demand for indicators of the relative size of economies, and of per capita estimates of gross domestic product (GDP) and various NA sub-aggregates, like actual individual consumption (AIC). In comparing these indicators across countries, that is, in a spatial dimension, several factors must be taken into account.
First and foremost, strict adherence to the common rules and standards of NA is required of all countries that take part in the comparison. Specifically, the United Nations System of National Accounts (SNA) lays down a conceptual framework that must be adhered to by all countries. The development and implementation of the SNA and its European counterpart, the European System of Accounts (ESA), are prime examples of international statistical cooperation that aims at harmonis-ing existing practices and further developing statistics along a common methodological path.
Second, countries’ NA data needs to be expressed in a common currency. For example, it is fairly obvious that the GDP of the United States, expressed in US dollars, and the GDP of Germany, expressed in euros, are not directly comparable. In order to ensure formal comparability, one could choose to just convert the GDP figure for the United States into euros at the nominal exchange rate, and compare this figure with Germany’s.
However, the fact that countries have different price levels implies that a spatial comparison based on nominal exchange rates as outlined in the previous paragraph will systematically overestimate the GDP, or any other NA aggregate, of coun-tries with high price levels, relative to countries with low price levels — and vice versa. This is because a country’s GDP expressed in national currency can be seen as the product of a volume component and a price component. If the volume component is of identical magnitude in countries A and B, while the price component is substantially higher in country B, the latter will appear to have a higher GDP than the former, even though the real volumes are identical. PPPs are applied in lieu of nominal exchange rates in order to achieve comparability of real volumes across countries. In other words, PPPs are indicators of relative price levels that enable us to express each country’s GDP in a common currency and at a common price level. The following section illustrates the importance of applying PPP-based figures in comparisons of countries’ GDP.
Selected ICP results
In the end, 146 countries participated in the 2005 round of the ICP, including the 45 countries in the Eurostat-OECD PPP Programme. This represents a remarkable increase on the ICP rounds of the 1980s and 1990s. The price and other input data were validated in each region, and regional PPPs calculated. These regional results were then linked via a group of countries (the “Ring countries”) in order to achieve a set of PPPs for all countries in the global comparison.
The preliminary, global results of the 2005 ICP round were published in December 2007. Table 2.2.1 summarises the results for selected economies. These results deviate substantially from estimates previously published by the World Bank and the International Monetary Fund. For example, the size of India’s economy appears to have been grossly overestimated in previ-ous publications. This does not come as a big surprise, since the previous estimates were based on data that in many cases dated back to the 1980s. These estimates have long been acknowledged to be of questionable accuracy.
1 Editorial

21 European Economic Statistics
Table 2.2.1: ICP 2005 results for selected economies
GDP, bln GDP per CapitaPrice Level Index
GDP per Capita Indices (US=100)
Shares (WORLD=100)
EconomyBased on nominal
US$
Based on PPP
Based on nominal
US$
Based on PPP
US=100Based on nominal
US$
Based on PPP
GDP in nominal
US$
GDP in PPP
Popu-lation
EU27 13694 13018 27839 26465 105 66.7 63.4 31.1 23.9 8.0
United States 12376 12376 41674 41674 100 100.0 100.0 27.9 22.5 4.8
EA13 10042 9260 31798 29323 108 76.2 70.3 22.8 17.0 5.2
China 2244 5333 1721 4091 42 4.1 9.8 5.1 9.7 21.3
Japan 4549 3870 35604 30290 118 85.4 72.7 10.3 7.0 2.1
India 779 2341 707 2126 33 1.7 5.1 1.8 4.3 18.0
Russian Federation 763 1698 5328 11861 45 12.8 28.5 1.7 3.1 2.3
Brazil 882 1585 4791 8606 56 11.5 20.7 2.0 2.9 3.0
South Africa 242 398 5162 8477 61 12.4 20.3 0.5 0.7 0.8
Table 2.2.1 compares some major economies with respect to their GDP, GDP per capita, and comparative price levels, based on the 2005 ICP results. The table also provides a useful exercise for understanding the vital importance of using PPPs, and not nominal exchange rates, in international comparisons of this kind. For example, while the economy of the European Union (EU27) appears to be 6.1 times bigger than China’s at nominal exchange rates, it is only 2.4 times bigger when the price level difference between the two countries is taken into account: China’s price level is estimated at just 40 percent of Europe’s.
A similar effect can be seen for GDP per capita, a much-used indicator in international comparisons of the general popula-tion’s material standard of living. The GDP per capita indices based on nominal exchange rates, containing both a price and a volume component, tend to exaggerate the differences between relatively rich and relatively poor countries and regions. Still, unsurprisingly, the volume of GDP per capita in countries like India, China, South Africa and Brazil remain very substantially below the level of the United States, the EU or Japan, even when PPPs are applied.
Summary
Involving the active participation of the National Statistical Offices of 146 countries, a number of regional development agencies and other international organisations, and with its explicit management structure, the ICP 2005 is certainly one of the most comprehensive and complex exercises in international statistical cooperation ever undertaken.
Until the 2005 results were released, the only PPP data available for countries outside the Eurostat-OECD region were es-timates that, in some cases, were based on surveys carried out as much as twenty years earlier. Given the effort put into the re-launched ICP, both in terms of organisational and methodological development, there can be little doubt that the results of the 2005 ICP provide a major contribution to better, more reliable analyses of national accounts data across countries. It is obvious that without the extensive cooperation between the parties involved, this major step forward would not have come about.
Whereas the Eurostat-OECD PPP programme is well established, underpinned by EC legislation, and serves important operational needs of the European Commission, the 2005 round of the ICP was more of a pioneering effort. However, given the need for reliable economic indicators, especially in the major international and regional organisations, but also for re-search purposes, it seems clear that the 2005 round has established a sound organisational basis for further ICP rounds in the future. From the user communities’ viewpoint, there is an obvious need to establish the ICP as a permanent statistical undertaking, with data collection and new results calculations taking place at regular intervals.
All this does not mean, of course, that there are no challenges ahead. One of these challenges concerns country coverage. Even though far more countries took part in 2005 ICP than in any previous round, truly international statistics must cover
Editorial 1

22 European Economic Statistics
all countries in order to be of full value to the user communities. Another, probably even more demanding, challenge con-cerns the quality of countries’ national accounts data, which in many cases is acknowledged to be less than optimal. Since international comparisons of the kind undertaken by the ICP rest on two pillars, national accounts data and PPP data, ef-forts must be made to improve the quality of both data sources. So important is the quality of national accounts data for the ICP that synergies for national accounts can be expected to result from a country’s participation in the ICP, provided that the organisational framework promotes it. Positive synergies could also be achieved in relation to the consumer price index (CPI), where a potential for increased coordinated data collection certainly exists with the ICP consumer goods surveys.
The ICP 2005 provides an example of how statistics of vital importance to international economic comparisons come about through close international cooperation, in an interactive process with a multitude of parties involved. It seems clear from the experience of this and previous ICP rounds that these statistics cannot be produced at a sufficient level of quality unless careful attention is paid to the organisation and management of the exercise across countries.
1 Editorial

Statistical analysis


25 European Economic Statistics
2.1 Overview of statistical analysis
The following chapters provide a statistical analysis of the main aspects of economic data for European Union, EFTA and candidate countries, with an emphasis on data since the year 2002. They are based on the latest data which were available to Eurostat at end-April 2008. All data are published on the Eurostat public website23, and a selection of these data are repro-duced in the statistical annex to this publication.
Unless otherwise stated, in the following chapters “EU” means the European Union 27, and “EA” or “euro area” mean the euro area 1324. These are the compositions which were present in the last year of available data (2007). The term “new Mem-ber States” is sometimes used to denote those 12 countries which have joined the EU since 2004, with the term “EU15” used to denote those countries which were EU members by 2003.
The chapters should be seen as a coherent set of data which have many links with each other (commonly through the na-tional accounts framework). This is particularly appropriate for users. There are other detailed aspects of the economy in Europe which are not covered specifically in this publication (for example agricultural and business statistics), however these aspects are included in the aggregate data presented. Short summary of the main results for each chapter follows.
National Accounts
This chapter covers a set of indicators derived from non-financial national accounts. National accounts are a powerful tool for studying many aspects of the economy. GDP in current prices gives an indication of the size of the economy and just five Member States account for three quarters of the EU Economy. GDP per capita expressed in Purchasing Power Standards allows us to make cross country comparisons of income levels, although with some caveats for specific cases.
EU countries display very different income levels but a catching-up process has taken place in recent years and relatively poorer Member States are gradually approaching richer ones. The chapter considers in which industries value added is generated and concludes that the EU is a service-based economy where more than 70% of total value added corresponds to service industries. The incomes generated by production are mainly spent on private consumption and it may be noted that half of EU investment is made on construction related fixed assets.
By looking at how income is distributed between economic sectors, it is clear that the share of GDP devoted to compensa-tion of employees is steadily declining and that the average compensation per employee in the EU is around 30 thousand euros. By analyzing specific sectors of the economy, at the EU level around one tenth of the disposable income of households is saved and the share of business profits of non-financial corporations is slightly below 40%.
The EU had an average annual economic growth of 1.7% during the period 2000-2006, which translated, taking into ac-count the increase in population, into 1.4% per capita volume growth. Around two thirds of this 1.4% per capita volume growth originated in increases in labour productivity while the other third was due to the increase in the share of employed persons in the total population.
National accounts also provide information at the regional level. Member States are calculating a number of key variables in particular at the regional level NUTS-2, which subdivides the EU into 271 regional units. The divergences between GDP per inhabitant among the regions of the EU are still very high, but have been narrowing over recent years; at the level of Member States however this applies only to the EU15 countries, while regional discrepancies in new Member States are still widening.
Public Finance
There is a strong focus in the European Union on government finance statistics because of the constraints on governments’ fiscal policies in the Stability and Growth Pact (and more specifically the Excessive Deficit Procedure).
23 See the following link: http://epp.eurostat.ec.europa.eu/portal/page?_pageid=1090,30070682,1090_33076576&_dad=portal&_schema=PORTAL
24 Austria, Belgium, Finland, France, Germany, Greece, Ireland, Italy, Luxembourg, the Netherlands, Portugal, Slovenia and Spain.
Statistical analysis 2

26 European Economic Statistics
Government expenditure has fallen as a proportion of the economy in the EU27 and EA13 in recent years, to 45.8% and 46.3% of GDP respectively in 2007. This equated to EUR 11,400 per inhabitant of the EU. The average includes a wide di-versity amongst countries, with some countries over 50% and others below 40%. The structure of government expenditure by function has remained relatively stable over the years, with by far the largest proportion (40%) being spent on social protection (social security benefits).
Government revenue has risen significantly in recent years to reach 44.9% of GDP in the EU27 and 45.6% in the EA13. Most government revenue derives from taxes and social contributions, and at European level there is a rather even split between indirect taxes, direct taxes and social security contributions (though this marks a wide diversity at country level).
The difference between government revenue and expenditure (the government net position, or “public balance”) fell in 2007 to the lowest level in the EU since the 1970s, reaching 0.9% of GDP in the EU27 and 0.6% in the euro area. Eleven EU Member States recorded a government budgetary surplus. Government debt fell as a proportion of GDP to 58.7% and 66.3% at end-2007 for the EU27 and EA13 respectively.
Inflation, interest rates and exchange rates
Annual average consumer price inflation (as measured by the Harmonised Index of Consumer Prices, or HICP) was rela-tively stable over the 2000-2007 period, however for the EU the figure for 2007 (2.3%) was the highest in this period. In the euro area inflation was more moderate in 2007 at 2.1%. The most notable price increases have occurred in food (including restaurants), education, alcohol and tobacco, and hotels. Downward effects on inflation were present from communications and clothing, amongst others.
In 2007 the highest annual inflation rates among the EU Member States were observed in countries that joined the EU in 2004 and 2007, with three countries experiencing inflation above 7.5%. By contrast some countries had inflation of only 1.6%.
Interest rates generally fell over the period 2000-2005, before rising in recent years in the EA13 and other EU countries. This was reflected in both longer term and shorter term interest rates where in 2007 the average 10-year EU government bond yield was at 4.58%, and three-month money market rates in the EA13 were 4.28 % on average.
In terms of exchange rates, the euro has appreciated strongly against the US Dollar (by 44.9%) and Japanese Yen (by 36.6%) since 2002. By contrast there have only been relatively minor fluctuations between the euro and other European currencies.
External dimension of the economy
The European Union plays a major role in the world trade: it accounts for about one fifth of the international trade in goods and for about one forth of the global trade in services. Over recent years, despite its role of biggest world exporter, the EU showed increasing deficits for trade in goods, while it was a net creditor in the exchange of services. The greater relative size of commodity trade moved also the EU current account towards negative balances in recent years, as the other two components, income and current transfers, have more or less balanced. However, in relative terms (as a share of GDP) the EU current account deficit in 2007 was rather small, namely -0.6% of GDP.
Among the major product categories, the EU had in 2007 a surplus in ‘chemicals’ and ‘machinery and vehicles’, while showed deficits in all the other sectors and in particular for energy products; the category ‘petroleum and petroleum products’ was alone responsible for about one fifth of the total EU imports. In trade in services, in 2007 the EU recorded surpluses in most of the categories, and especially in financial services, transportation and ‘other business services’, the biggest deficit was registered for the travel sector. Both for goods and services, USA was the most important trading partner for the EU.
The relation of the EU with other economies can be also measured by the flow of foreign direct investments (FDI) made in and received from other countries. These investments have been growing over the last years and EU outflows have been considerably greater than investments received from abroad, making the European Union a net investor. The main EU partners for these flows are North America, other non-EU European countries and South and Central America, which
2 Statistical analysis

27 European Economic Statistics
together hosted more than three quarters of the EU outward FDI stocks at end-2006. Another way to measure the interna-tionalisation of EU economy is to consider the affiliates abroad controlled by EU businesses. Even if statistical data are still partial for this phenomenon, the results confirm that EU partners’ share are similar to those for EU direct investments, but with a greater role of Asia, in particular, as regards the increasing number of persons employed as a result of the outsourc-ing of production.
Labour market
This chapter describes the present situation and the changing patterns in the European labour market. The recent evolution of employment growth is positive and in line with the cycle of economic expansion. In 2007 employment grew by 1.6% in the EU27 and by 1.8% in the EA13, leaving the employment rates at 65.4% and 65.7% respectively. A sustained rise in the total actual hours worked reflects that the labour supply is maintained by an increase in the number of jobholders rather than by changes in the average hours per person.
Employment is moving from agriculture and manufacturing to services and construction. Employment growth in recent years was stimulated by higher participation of women in the labour market and, to a lower extent, of older workers too. In some countries immigrant workers also contributed significantly.
More part-time jobs and hours worked in part-time jobs also go in parallel with the increased involvement of women in labour market. More fixed-term contracts and a widening distribution of usual weekly hours of work per person point to more flexible work time arrangements, improvement of work organisation and better reconciliation of work and life.
The unemployment rate fell in 2007 in the EU27 to 7.1%, a fall from 8.9% in 2005. There was fall in unemployment in 2007 in every Member State, and also for unemployment of younger persons and the long-term unemployed.
Statistical analysis 2

28 European Economic Statistics
2.2 National accounts
2.2.1 Introduction
This chapter covers a set of indicators derived from non-financial national accounts. National accounts are a powerful tool for studying many aspects of the economy. GDP in current prices gives an indication of the size of the economy. It is worth noting that only five Member States account for three quarters of the EU Economy. GDP per capita expressed in Purchasing Power Standards allows making cross country comparisons of income levels, although with some caveats for specific cases. EU countries display very different income levels but some sort of catching-up process has taken place in recent years and relatively poorer Member States are gradually approaching richer ones. The chapter shows in which industries value added is generated and concludes that the EU is a service-based economy where more than 70% of total value added corresponds to service industries. Analyzing how GDP is used one can find out that is mainly spent on private consumption and that half of the EU investment is made on construction related fixed assets. By looking at how income is distributed between economic sectors it can be onserved that the share of GDP devoted to compensation of employees is steadily declining and that the average compensation per employee in the EU is around 30 thousand Euros. The EU had an average annual eco-nomic growth of 1.7% during the period 2000-2006, which translated, taking into account the increase in population, into 1.4% per capita volume growth. Around two thirds of this 1.4% per capita volume growth originated in increases in labour productivity while the other third was due to the increase in the share of employed persons in the total population. The next step will be to analyze specific sectors of the economy to find out that around one tenth of the disposable income of house-holds is saved and that the share of business profit of non-financial corporations is slightly below 40%. National accounts also provide information at the regional level. Member States are calculating a number of key variables in particular at the regional level NUTS-2, which subdivides the EU into 271 regional units. One can observe that the divergences between GDP per inhabitant among the regions of the EU are still very high, but have been narrowing over recent years; at the level of Member States however this applies only to the EU15 countries, while regional discrepancies in new Member States are still widening.
2.2.2 Nominal GDP and GDP per capita
The European Union (EU) economic data is the result of aggregating the data for the individual economies of 27 Member States. The 27 Member States are fairly heterogeneous in terms of size, income levels, economic structure, and recent eco-nomic performance. Table 2.2.1 below provides an overview of the relative size of the economy of the 27 Member States in 2000 and 2007 based on GDP measured at current prices and current exchange rates. Member States are sorted in descend-ing order according to their share in EU27 GDP in 2007. They have been classified into three groups. A first group of five large Member States accounted for almost three quarters of the EU27 economy in 2007 (72.5%). A second group of eleven medium-sized Member States accounted for almost one quarter (23.7%). Lastly, a group of eleven small Member States represented less than 5% (3.7%) of the EU economy.
2 Statistical analysis

29 European Economic Statistics
Table 2.2.1 Member States’ relative economic size
Country Share in EU27 GDP, 2000 Share in EU27 GDP, 2007
Large Member States, more than 5%
Germany 22.5 19.7
United Kingdom 17.1 16.5
France 15.7 15.2
Italy 13.0 12.5
Spain 6.9 8.6
Subtotal 75.2 72.5
Medium-sized Member States, between 1% and 5%
Netherlands 4.6 4.6
Sweden 2.9 2.7
Belgium 2.7 2.7
Poland 2.0 2.5
Austria 2.3 2.2
Greece 1.5 1.9
Denmark 1.9 1.9
Ireland 1.1 1.5
Finland 1.4 1.5
Portugal 1.3 1.3
Czech Republic 0.7 1.0
Subtotal 22.5 23.7
Small Member States, less than 1%
Romania 0.44 0.99
Hungary 0.57 0.82
Slovakia 0.24 0.45
Luxembourg 0.24 0.29
Slovenia 0.23 0.27
Bulgaria 0.15 0.24
Lithuania 0.13 0.23
Latvia 0.09 0.16
Cyprus 0.11 0.13
Estonia 0.07 0.13
Malta 0.05 0.04
Subtotal 2.3 3.7
The table provide some interesting facts. For example, the Member State with the largest economy (Germany) is more or less the same size as the combined economies of the twenty smaller Member States. It therefore follows that the main features of the EU economy will chiefly result from developments in a few Member States.
Table 2.2.1 provides also the same weights for the year 2000. Comparing 2007 with 2000, it is clear that all large Member States with the exception of Spain have lost relative weight, and that all medium-sized and small Member States have main-tained, and in most cases increased their weights, (the exceptions being Austria, Sweden and Malta).
Statistical analysis 2

30 European Economic Statistics
In Table 2.2.1 GDP is measured at current prices and market exchange rates. If one wants to obtain a proper measure of relative income levels (see Box 2.2.1) in different countries, one should use another indicator: GDP per capita expressed in Purchasing Power Standards. This indicator is the result of combining four elements. First, GDP is measured at cur-rent prices and exchange rates. Second, in order to allow per capita comparisons GDP levels are divided by population. Third, GDP per capita in Euros is converted into an artificial currency using Purchasing Power Parity (PPP) exchange rates. The reason is that the same amount of euros can buy a different amount of goods and services in different countries due to the existence of differences in price levels, especially for non-tradable items, such as haircuts, health and educa-tion. Finally the amounts expressed in PPP are scaled to euros, so that the aggregate for the EU as a whole is the same whether expressed in Euros or PPS.
Figure 2.2.1: GDP per capita in Purchasing Power Standards, EU27=100
0
40
20
80
60
120
100
160
140
200
180
240
220
280
260
300
2000 2006
LU NL AT DK IE SE BE DE FI UK IT FR EA13
EU27
ES CY GR MT SI PT CZ HU SK PL EE LT LV BG RO IS NO CH
Figure 2.2.1 shows the results, indexed to EU=100, for the years 2000 and 2006. In 2006, six countries had an index of over 20% above the EU average and eleven countries were more than 20% under the EU average. Although PPS are intended only for spatial comparisons and not for temporal ones, comparing the relative positions in 2000 and 2006 provides some interesting insights. It can be clearly seen that in a majority of cases (thirteen out of fifteen) countries that were below the EU average in 2000 improved their relative position in 2006. Consequently, the opposite is also true; ten out of the twelve countries that were above 100 in 2000 saw their relative position worsen. This provides some evidence of a convergence process within the EU in the period 2000-2006. The GDP per capita of countries that were relatively poorer in 2000 grew faster than the GDP per capita of countries that were relatively richer in 2000.
2 Statistical analysis

31 European Economic Statistics
BOX 2.2.1: GDP SHORTCOMINGS FOR MEASURING INCOME LEVELS IN LUXEMBOURG AND IRELAND
GDP is the standard measure for international comparisons of income levels. There are many reasons for that. It is very
timely, closely harmonised across countries and widely known by users. Nonetheless, in certain cases it may give a
misleading picture of relative income levels and other alternatives in the framework of National Accounts may be pref-
erable. Such as, for example, Gross National Income (GNI) which is the measure used to calculate a major part of the
contribution of EU Member States to the EU budget. The difference between GDP and GNI is mainly primary incomes
with the rest of the world (GNI = GDP + primary incomes with the rest of the world). Primary incomes comprise com-
pensation of employees and property income. In most EU countries the magnitude of the balance is relatively small,
and therefore GDP is very similar to GNI. Indeed for the EU as a whole GDP and GNI are almost the same amounts.
Nonetheless there are two countries, Luxembourg and Ireland, for which the difference is significant. In the case of Lux-
embourg the difference is partly due to the large daily influx of commuter workers coming from France, Belgium and
Germany. What they produce is taken into account in Luxembourg’s GDP, but the salaries are not included in its GNI. In
the case of Ireland, the difference is due to the major presence of foreign multinational corporations. Their profits are
included in Ireland’s GDP, but the dividends repatriated by the multinationals are not included in GNI.
The GNI of Ireland and Luxembourg in PPP shows that both countries are comparatively less rich than is indicated by
their GDP. Luxembourg would be 2.3 times richer than the EU average, instead of 2.8 times, and Ireland would be 25%
richer than the EU average instead of 45%.
2.2.3 The production side
This section analyses in which industries the gross value added was generated. Gross value added is the difference between output and intermediate consumption. It should not be confused with production (output). To calculate the gross value added of an industry one computes its total production and subtract the value of goods and services consumed or used as inputs in the production. For the EU, around 50% of output is used as intermediate consumption. Therefore Gross Value Added for the EU27 represents around 50% of the total production of goods and services.
Gross value added is also different from GDP. This is due to the fact that output is valued at basic prices25 and intermediate consumption is valued at purchasers’ prices. To obtain GDP at market prices it is necessary to adjust gross value added by adding taxes and subtracting subsidies on products. For the EU, taxes less subsidies on products represent around 11% of GDP. As the information regarding taxes less subsidies is only available for the total economy and not by industry, it is not possible to calculate the GDP of specific industries. That is why total gross value added is used to analyse the importance of different industries, and not GDP. In the interest of readability the economy has been broken down into six industries.
25 Because of transport costs, trade margins and taxes less subsidies on products, the producer and the user of a given product usually perceive its value differently. In order to keep as close as possible to the views of the transactors, the system records all uses at purchaser’s prices, which include transport costs, trade margins and taxes less subsidies on products, while output is recorded at basic prices, which exclude these elements.
Statistical analysis 2
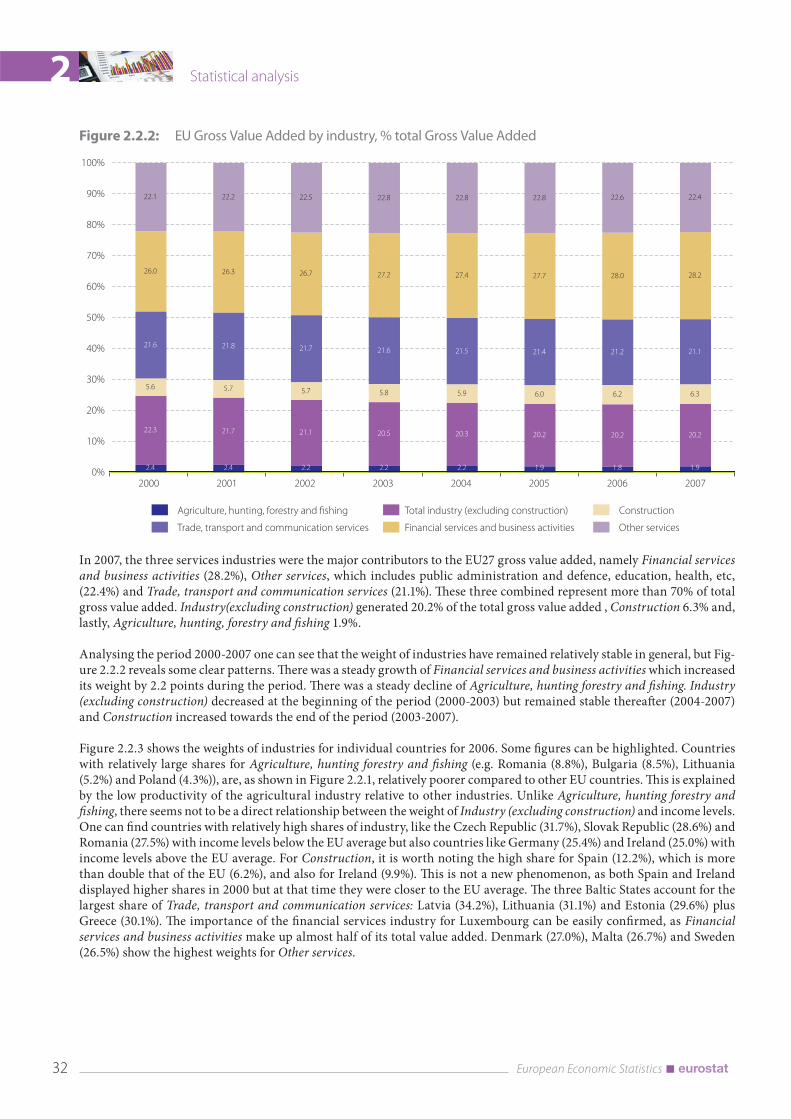
32 European Economic Statistics
Figure 2.2.2: EU Gross Value Added by industry, % total Gross Value Added
0%
10%
20%
30%
40%
50%
60%
70%
80%
90%
100%
Agriculture, hunting, forestry and fishing Total industry (excluding construction) Construction
Trade, transport and communication services Financial services and business activities Other services
2000 2001 2002 2003 2004 2005 2006 2007
2.4 2.4 2.2 2.2 2.2 1.9 1.8 1.9
22.3 21.7 21.1 20.5 20.3 20.2 20.2 20.2
5.6 5.7 5.7 5.8 5.9 6.0 6.2 6.3
21.6 21.8 21.7 21.6 21.5 21.4 21.2 21.1
26.0 26.3 26.7 27.2 27.4 27.7 28.0 28.2
22.1 22.2 22.5 22.8 22.8 22.8 22.6 22.4
In 2007, the three services industries were the major contributors to the EU27 gross value added, namely Financial services and business activities (28.2%), Other services, which includes public administration and defence, education, health, etc, (22.4%) and Trade, transport and communication services (21.1%). These three combined represent more than 70% of total gross value added. Industry(excluding construction) generated 20.2% of the total gross value added , Construction 6.3% and, lastly, Agriculture, hunting, forestry and fishing 1.9%.
Analysing the period 2000-2007 one can see that the weight of industries have remained relatively stable in general, but Fig-ure 2.2.2 reveals some clear patterns. There was a steady growth of Financial services and business activities which increased its weight by 2.2 points during the period. There was a steady decline of Agriculture, hunting forestry and fishing. Industry (excluding construction) decreased at the beginning of the period (2000-2003) but remained stable thereafter (2004-2007) and Construction increased towards the end of the period (2003-2007).
Figure 2.2.3 shows the weights of industries for individual countries for 2006. Some figures can be highlighted. Countries with relatively large shares for Agriculture, hunting forestry and fishing (e.g. Romania (8.8%), Bulgaria (8.5%), Lithuania (5.2%) and Poland (4.3%)), are, as shown in Figure 2.2.1, relatively poorer compared to other EU countries. This is explained by the low productivity of the agricultural industry relative to other industries. Unlike Agriculture, hunting forestry and fishing, there seems not to be a direct relationship between the weight of Industry (excluding construction) and income levels. One can find countries with relatively high shares of industry, like the Czech Republic (31.7%), Slovak Republic (28.6%) and Romania (27.5%) with income levels below the EU average but also countries like Germany (25.4%) and Ireland (25.0%) with income levels above the EU average. For Construction, it is worth noting the high share for Spain (12.2%), which is more than double that of the EU (6.2%), and also for Ireland (9.9%). This is not a new phenomenon, as both Spain and Ireland displayed higher shares in 2000 but at that time they were closer to the EU average. The three Baltic States account for the largest share of Trade, transport and communication services: Latvia (34.2%), Lithuania (31.1%) and Estonia (29.6%) plus Greece (30.1%). The importance of the financial services industry for Luxembourg can be easily confirmed, as Financial services and business activities make up almost half of its total value added. Denmark (27.0%), Malta (26.7%) and Sweden (26.5%) show the highest weights for Other services.
2 Statistical analysis

33 European Economic Statistics
Figure 2.2.3: Gross Value Added by industry, % total Gross Value Added, 2006.
Agriculture, hunting, forestry and fishing Total industry (excluding construction) Construction
Trade, transport and communication services Financial services and business activities Other services
0%
10%
20%
30%
40%
50%
60%
70%
80%
90%
100%
EU27
EA13
BE BG CZ DK DE EE IE GR ES FR IT CY LV LT LU HU MT NL AT PL PT RO SI SK FI SE UK IS NO CH
2.2.4 The expenditure side
This section focuses on the main expenditure components of GDP. Private final consumption is by far the largest category and includes the expenditure made by households and non-profit institutions serving households (NPISH26). Government final consumption comprises the value of goods and services produced by general government itself, other than own ac-count capital formation and sales, and purchases by general government of goods and services that are supplied to house-holds (see Box 2.2.2). Gross capital formation consists of Gross fixed capital formation, which measures resident producers’ acquisitions, less disposals, of fixed assets plus certain additions to the value of non-produced assets, and Changes in inven-tories, which measures the value of the entries into inventories less the value of withdrawals and the value of any recurrent losses of goods held in inventories. Finally, the External balance represents the difference between exports and imports of goods and services.27
Figure 3.2.4 shows the respective weights of each expenditure component in GDP for the years 2000-2007 for the EU. As stated earlier, Private final consumption is by far the most important component representing a little under 60% of GDP throughout the period. Its weight shows a slight downward trend during the period analysed. Both Government final con-sumption and Gross capital formation represent around 20% of GDP each. However, while no clear trend can be discerned for Government final consumption, the weight of Gross capital formation decreased between 2000-2003 and increased there-after, reaching a higher weight in 2007 (21.8%) than at the beginning of the period (21.3%).
26 NPISHs are private, non-market producers which are separate legal entities. Their principal resources, apart from those derived from occasional sales, are derived from voluntary contributions in cash or in kind from households, from payments made by general governments and from property income. Examples of NPISHs are churches, trade unions and political parties.
27 Exports and imports of goods and services are analyzed in detail in chapter 2.5
Statistical analysis 2

34 European Economic Statistics
Figure 2.2.4: EU expenditure components, % of GDP
0%
20%
40%
60%
80%
100%
Private Final Consumption Government Final Consumption
Gross Capital Formation External balance of goods and services
2000 2001 2002 2003 2004 2005 2006 2007
0.20.61.11.20.80.2 0.51.5
58.6 58.7 58.5 58.4 58.2 58.3 57.8 57.2
19.8 20.0 20.4 20.8 20.7 20.9 20.8 20.5
21.3 20.5 19.6 19.6 20.0 20.3 21.1 21.8
BOX 2.2.2: PRIVATE FINAL CONSUMPTION VERSUS ACTUAL INDIVIDUAL CONSUMPTION AND CROSS-COUNTRY COMPARISONS
There are some caveats to be taken into account before making cross-country comparisons of Private final consump-
tion. A part of Government final consumption is made up of purchases by general government of goods and services
produced by market producers that are supplied to households; this is called Government individual consumption. Im-
agine that we are comparing two countries, one in which the education is paid for directly by households and another
in which the government finances education and households do not make any direct payment, although they do
indirectly finance for education through the tax system. To make a proper comparison of consumption by households
between both countries this difference has to be taken into account. It is recommended to use the variable Actual in-
dividual consumption, which is the sum of Private final consumption and Government individual consumption. As stated
earlier, for a proper cross-country comparison of levels the unit chosen should be amounts converted into PPS. The
following table illustrates this situation by comparing the three different consumption items for Austria and Sweden
for the year 2006 in data expressed in PPS per capita:
Austria Sweden
Private final consumption 16 600 13 900
Government individual consumption 3 300 5 600
Actual individual consumption 19 900 19 500
This partly explains why Private final consumption in the United States accounts for a much bigger share of GDP (around
70%) than in the EU27 (around 60%), since in the United States some services which are financed by the government
sector in the EU are paid directly by households. However, not all of the difference can be attributed to this factor.
2 Statistical analysis

35 European Economic Statistics
At the level of individual Member States, there are sizeable differences in the weight of expenditure components. Luxem-bourg (36%) and Ireland (45%) show the lowest weights for Private final consumption. Part of the explanation is that for theses two countries GDP is not the most appropriate measure of their income levels (see Box 2.2.1). Also both countries have substantial positive external balances. This is partly explained, in the case of Luxembourg, by the significant purchases of fuel, cigarettes and alcohol by non-residents (which is counted as Exports of services) and by the strong export intensity of foreign multinationals located in Ireland. Sweden and the Netherlands (both on 47.4%) also have relatively lower shares, which are offset by a relatively higher share of Government final consumption. At the other end of the scale, Greece (71.0%), Bulgaria (70.4%) and Romania (68.9%) have the highest shares which are partly offset by relatively lower Government final consumption shares. Looking at Gross capital formation, Latvia (39.7%) and Estonia (38.2%) display the highest shares as might be expected of very fast growing economies, while Germany (17.8%) and the United Kingdom (18.0%) have the low-est shares.
Figure 2.2.5: Expenditure Components, % of GDP, 2006.
0%
20%
40%
60%
80%
100%
-20%
EU27
EA13
BE
BG
CZ DK DE
EE
IE
GR
ESFR IT
CY
LV
LT
LU HUMT
NL AT PL
PTRO
SISK
FI SEUK
IS
NO CH
Private Final Consumption Government Final Consumption
Gross Capital Formation External balance of goods and services
As other chapters will deal in more detail with some expenditure components (Chapter 2.4 for Private final consumption, Chapter 2.3 for Government final consumption and Chapter 2.5 for exports and imports of goods and services), the focus of this chapter is limited to Gross fixed capital formation.
Figure 2.2.6 shows the breakdown by fixed asset28 type for the EU for the years 2000 and 2007. In 2007, more than half of Gross fixed capital formation was devoted to construction related fixed assets, either to Other buildings and structures (28.6%) or Dwellings (25.7%). Other machinery and equipment represented around one quarter, while Intangible fixed assets and Transport equipment were around 10% of total Gross fixed capital formation. When compared with the year 2000, it can be observed that the weight of Other machinery and equipment fell by five percentage points while the weights of Dwellings
28 Fixed assets are tangible or intangible assets produced as outputs from processes of production that are themselves used repeatedly, or continuously, in processes of production for more than one year.
Statistical analysis 2

36 European Economic Statistics
and Other building and structures increased by 2.4 and 1.9 percentage points respectively. The share of Intangible fixed as-sets also increased marginally, by 0.8 percentage points, while for the other two assets, Transport equipment and Cultivated assets the respective shares in the total remained virtually unchanged.
Figure 2.2.6: EU, breakdown of Gross Fixed Formation by six fixed asset types
Cultivated assets
0.3% Other machinery
and equipment
30.4%
Dwellings
23.3%
Other buildings
and structures
26.7%
Intangible fixed assets
9.6%
Transport
equipment
9.7%
2000
Cultivated assets
0.2% Other machinery
and equipment
25.4%
Dwellings
25.7%
Other buildings
and structures
28.6%
Intangible fixed assets
10.4%
Transport
equipment
9.7%
2007
2.2.5 The income side
The income side shows how GDP is distributed among different participants in the production process. The relevant com-ponents are: Compensation of employees, which is the total remuneration, in cash or in kind, payable by an employer to an employee; Gross operating surplus and mixed income, which is the surplus (or deficit) on production activities before account has been taken of the interest, rents or charges paid or received for the use of assets; plus the remuneration for the work carried out by the owner (or by members of his/her family) of an unincorporated enterprise29; Taxes on production and imports less subsidies, which consist of compulsory (in the case of taxes) unrequited payments to or from general govern-ment or institutions of the EU, in respect of the production or import of goods and services, the employment of labour, and the ownership or use of land, buildings or other assets used in production taxes on production and imports less subsidies. Compensation of employees can be broken down into Wages and salaries and Employers’ social contributions.
Figure 2.2.7 illustrates a well known stylised fact which has been discussed at length in the economic literature: namely the steady decline of Compensation of employees as a share of GDP. The decrease is explained by the Wages and salaries compo-nent, as the weight of Employer’s social contributions did not change throughout the period. The decrease has been matched by a parallel increase in the share of Gross operating surplus and mixed income, while the share of Taxes on production and imports less subsidies has remained stable. The decline in the share of Compensation of employees contributes to explaining the decline in the share of Private final consumption commented in section 2.2.2. The evolution of Private final consump-tion is mainly driven by the change in Household disposable income, of which Wages and salaries are the most important component.
29 This is referred to as ’mixed income’ since it cannot be distinguished from the entrepreneurial profit of the owner.
2 Statistical analysis

37 European Economic Statistics
Figure 2.2.7: EU income components, change in their share of GDP (share in GDP for 2007 in the labels)
2000 2001 2002 2003 2004 2005 2006 2007-2.0
-1.5
-1.0
-0.5
0
0.5
1.0
1.5
2.0
Compensation of employees (48.4% in 2007) Wages and salaries (38.3% in 2007)
Employer's social contributions (10.1% in 2007) Gross operating surplus and mixed income (39.3% in 2007)
Taxes on production and imports less subsidies (12.4% in 2007)
By dividing Compensation of employees by the number of employees30 one obtains the average compensation per employee. In 2006, the EU average compensation per employee was 30.7 thousand euros. The highest values were recorded in relatively richer countries: Luxembourg (51.1), Denmark (44.2), Belgium (44.1) and Ireland (42.7), while the lowest were found in the relatively poorer countries: Bulgaria (3.1), Romania (6.1), Latvia (7.4) and Lithuania (8.1).
Figure 2.2.8: Compensation per employee in euros, 2006
0
10.000
20.000
30.000
40.000
50.000
60.000
LU DK BE IE UK FR SE FI AT NL EA13 DE IT EU27 ES GR CY SI PT MT HU CZ EE PL SK LT LV RO BG NO
30 See chapter 2.6 for more detailed information on employment figures.
Statistical analysis 2

38 European Economic Statistics
2.2.6 Economic growth
So far the analysis was restricted to figures in current prices or in Purchasing Power Standards, but in order to analyse the behavior of economies over time one needs to use volume changes which exclude price movements (see Box 2.2.3). As seen before, GDP per capita in PPS is a measure for calculating relative income levels but it is not the most suitable indica-tor available for observing the increase over time of the economic well-being of a country. The GDP per capita in PPS of a country is affected by many factors: exchange rates movements, evolution of domestic prices and population changes in that country, plus the same factors in all the other countries included in the comparison. To gauge the economic growth of a country the most used indicator is the volume change of GDP.
The EU and the euro area experienced healthy economic growth in 2007 confirming the upturn observed in 2006. The EU grew by 2.9% and the euro area by 2.6% in 2007, after 3.1% and 2.8% in 2006. These growth rates are substantially higher than those achieved in the 2001-2005 period. Slovakia (10.4%) and Latvia (10.3%) were the countries that grew faster in 2007. Lithuania (8.8%), Estonia (7.1%), the Czech Republic and Poland (6.5%), Bulgaria (6.2%) and Slovenia (6.1%) grew above 6%. Hungary (1.3%) and Italy (1.5%) grew more slowly. Denmark (1.8%), Portugal (1.9%) and France (1.9%) saw growth below 2%.
Figure 2.2.9: Volume GDP growth in 2007, percentage change on previous year
0.0 2.0 4.0 6.0 8.0 10.0 12.0
IS
NOCH
HU
ITDK
FRPT
DEEA
SE
BE
EUUK
AT
NL
ES
MT
GRCY
FI
IE
RO
SIBG
CZPL
EELT
LVSK
LU*
2 Statistical analysis

39 European Economic Statistics
The volume change of GDP is a rough indication for the short term evolution of living standards. But over longer periods the increase in volume GDP does not necessary translate into an improvement in living standards: changes in population should be taken into consideration. For short term economic analysis (quarter-on-quarter or year-on-year developments), population changes are relatively small and therefore the volume change of GDP is a very good approximation of the in-crease in living standards.
BOX 2.2.3: VOLUME MEASURES AND THE CALCULATION OF AGGREGATES AND CONTRIBUTIONS TO GDP GROWTH
Volume measures have traditionally been expressed in constant prices of a base year (commonly moved ahead every
five years). With a view to producing more accurate measures of volume growth, the price base is now updated every
year, giving data in previous year’s prices, which - together with data expressed at current prices - allow the calculation
of volume growth rates. Multiplying successive growth rates starting from a reference year level provides a chain-
linked volume time series.
Chain-linked volume of year t = Chain-linked volume of year t-1 x (Previous year prices of year t / Current prices of year t – 1)
A fundamental feature of chain-linking is the loss of additivity for all years except the reference year and the year
directly following. Consequently, it is not simply a matter of adding up chain-linked data to obtain aggregates, such
as GDP growth of Baltic States or the growth rate of industry plus construction, like it was done with constant prices.
Custom aggregations should be obtained by summing up the components of the desired aggregate at previous year’s
prices and current prices and subsequently chain link the series. Not all Member states provide data at previous year’s
prices, but these can be easily reconstructed from the available data at current prices and chain-linked volume series
by using the following reformulation of the above equation:
Previous year prices of year t = Chain-linked volume of year t x (Current prices of year t – 1/ Chain-linked volume of year t-1)
The lack of addtivity also prevents a direct use of chain linked data for the calculation of contributions to GDP growth of
individual variables, like Gross fixed capital formation (GFCF). It would be necessary to combine data at previous year’s
prices and current prices. For example, for calculation the contribution of GFCF to GDP growth the following expres-
sion should be used:
(GFCF at previous year’s prices for year t – GFCF at current prices for year t-1) / GDP at current prices for year t-1
Figure 2.2.10 shows the average annual growth of volume GDP per capita and average population changes for the period 2000-2006.
Statistical analysis 2

40 European Economic Statistics
Figure 2.2.10: Average annual growth of volume GDP for the period 2000-2006
GDP per person Population
-2.0
-1.0
0.0
1.0
2.0
3.0
4.0
5.0
6.0
7.0
8.0
9.0
LV EE LT RO IE SK BG GR HU CZ LU SI PL ES CY FI SE UK EU27 BE AT DK FR EA13 NL MT IT PT DE IS NO CH
As it can be seen, the EU experienced an average annual growth rate of volume GDP of 1.7% during the period 2000-2006 while the average annual growth rate of volume GDP per capita was 1.4%. The lower GDP per capita growth was due to a 0.3% average annual increase in population. Most of the new 10 Member States are at the top of the table, as they have experienced the highest GDP volume growth. As in many cases their population has decreased, GDP per capita growth has outstripped GDP growth in these countries. Most of the old 15 Member States are at the bottom of the table and, with the exception of Germany, GDP growth per capita has been lower than GDP growth, as the population has increased. Germany and Italy provide good examples of the shortcomings of focusing on GDP growth rate only. While Italy has experienced a slightly higher GDP growth rate, because Germany’s population has remained unchanged while Italy’s has increased, the growth in volume GDP per capita in Germany has been double that of Italy.
The following section will focus on the sources of the change in GDP volume per capita. This can be due to changes in the amount of labour input or to changes in labour productivity. We will measure labour input as the number of persons employed31 and labour productivity as GDP per person employed. During the past 200 years advanced economies’ higher living standards have mainly been the result of increased labour productivity. This also holds true for the foreseeable future, since employment cannot for prolonged periods be the engine of growth due to the existence of an upper limit to the labour input as defined by the maximum population. Labour productivity on the other hand can grow without bounds.
In equation 2.2.1 GDP in volume per person is decomposed into its components:
population
employment
employment
GDP
population
GDP×= (2.2.1)
31 Hours worked instead of persons employed can be considered a better variable to perform this analysis, but insufficient data coverage does not allow this calculation for many countries.
2 Statistical analysis

41 European Economic Statistics
In Figure 2.2.11 GDP in volume per person growth is thus further decomposed into the contributions of the growth of labour productivity per person employed and the growth of persons employed divided by the population for the period 2000-2006. It can be seen that more than two thirds of EU27 and EA13 growth stemmed from higher labour productivity.
In all EU member states – except Cyprus, Italy, Luxembourg and Spain – economic growth per person stemmed principally from labour productivity growth. The most impressive growth rates were displayed by the Baltic States and Poland (+5.5% to +5.8%). Slovakia’s labour productivity increased annually by 4.0%. Hungary, the Czech Republic, Bulgaria and Slovenia increased their labour productivity per person employed by 2.9 to 3.4 per cent per annum. The EU27 average growth rate was 1.0 per cent per year. The only country that experienced a negative labour productivity growth was Italy (-0.3%).
Latvia (+2.4%), Bulgaria (+2.4%), Estonia (+1.8%), Luxembourg (+1.7), Spain (+1.5%) and Lithuania (+1.3%) increased their employment ratios the most. One per cent increases were also seen in Ireland and Greece. The EU27 average growth rate was 0.4 per cent per year. The countries that experienced decreases in their employment ratios were Germany (-0.1%), Por-tugal (-0.2%) and Poland (-2.2%).
Figure 2.2.11: Average annual growth of GDP per capita for the period 2000-2006
Labour productivity per person employed Persons employed / Population
-4.0
-2.0
0.0
2.0
4.0
6.0
8.0
10.0
LV EE LH BG SK HU CZ GR SI PL IE LU FI SE UK ES EU27
CY DK BE AT FR NL EA13
DE MT IT PT IS NR CH
Employment and labour productivity for PL estimated. RO omitted.
2.2.7 Sector accounts
For about ten years, the annual sector accounts of the Member States of the European Union have been collected according to one common methodology described in the European System of Accounts 1995 (ESA 95)32.
Since 2006, the non-financial annual sector accounts of the euro area and of the European Union have been published by Eurostat, together with the sector accounts of most Member States. Since June 2007, quarterly series have also been released, for the euro area and the European Union but with no national breakdown. All these data are available, together with methodological information in English, French and German, at the following website: http://ec.europa.eu/eurostat/sectoraccounts. A synthesis of the methods used to compile European sector accounts on the basis of Member States data is also provided in the methodological part (chapter 3.2) of this publication.
Annual sector accounts represent a wealth of information that allows analysing the economic behaviour of each sector in the economy, mainly: non-financial corporations, financial corporations, general government and households. The trans-actions of the economy as a whole vis-à-vis third countries are recorded in the accounts of the “rest of the world”.
32 For more details, see http://forum.europa.eu.int/irc/dsis/nfaccount/info/data/esa95/en/titelen.htm).
Statistical analysis 2

42 European Economic Statistics
The behaviour of households and non-financial corporations is particularly relevant for economic analysis. Households are generally the main source of national saving which itself finances investment in the national economy or abroad. Non-financial corporations are the main driver of investment in productive assets which determines long-term growth to some extent. Considered together, household saving and business investment generally explain the main developments in the lending capacity or borrowing needs of an economy.
In addition, sector accounts also give valuable information for analysing the profitability of firms. One possible indicator for this purpose is the profit share defined as the portion of value added that remunerates capital. This profit share is the com-plement of wages costs that remunerate labour, plus net taxes on production that (partially) finances government services.
In the first sub-section, the saving rate of households is commented whereas the last sub-section focuses on the investment rate and profit share of non-financial corporations.
Household saving rate
The households sector covers individuals or groups of individuals as consumers and as entrepreneurs provided, in the latter case that their activities as market producers are not carried out by separate entities. In the following, this sector has been merged with the small sector of non profit institutions serving households (e.g. associations, charities etc…).
In national accounts terms, the gross household saving rate is defined as gross saving divided by gross disposable income. The latter has been adjusted to take into account the net increase/decrease in the equity of households in pension fund reserves.
The household saving rate is provided gross, which means before deducting the normal wear and tear of fixed assets, mainly dwellings in this case.
The figure below displays in descending order the saving rates of households as measured in 2006 for all Member States, for which data were available, the EA13 and the EU.
Figure 2.2.12: (Gross) household saving rates in the EU (%, 2006 data if available)
-2%
0%
2%
4%
6%
8%
10%
12%
14%
16%
18%
Ge
rman
y
Slo
ven
ia
Fran
ce
Ital
y
Au
stri
a
Eu
ro a
rea
13
Be
lgiu
m
Ne
the
rlan
ds
Hu
ng
ary
(20
05
)
Ire
lan
d
Spai
n
Swe
de
n
Port
ug
al (
20
05
)
Pola
nd
Slo
vaki
a
Fin
lan
d
Un
ite
d K
ing
do
m
Cze
ch R
ep
ub
lic
De
nm
ark
Gre
ece
Latv
ia (
20
05
)
Lith
uan
ia
Esto
nia
EU
27
euro area countries
2 Statistical analysis

43 European Economic Statistics
As shown in the figure above, the household saving rate in 2006 was more than 2 percentage points higher in the euro area (13.6 %) than in the EU (11.3 %). This gap is mainly explained by the low saving rates of Denmark (4.0 %), UK (5.0 %) and Poland (6.6 %).
In the euro area, saving rates are generally high and homogeneous. Only Finland and Greece have a low saving rate whereas the three largest economies of the euro area (Germany, Italy and France) rank in the first positions.
Member States that are not part of the euro area, Baltic countries in particular, have the lowest household saving rates (1.1% for Latvia, 0.7% for Lithuania, and even -0.7% for Estonia33).
Table 2.2.2: Changes in the gross household saving rates between 2000 and 2006
(Percentage points)
EU27 EA13 BE BG CZ DK DE EE IE EL ES FR IT CY LV *
-0.4% 0.2% -2.9% : -3.6% -0.9% 1.1% -4.8% : -1.4% -0.7% 0.4% 0.7% : -1.8%
LT LU HU * MT NL AT PL PT * RO SI SK FI SE UK
-6.6% : -2.9% : 0.4% 1.3% -4.2% -1.0% : 1.5% -4.6% -1.9% 3.0% -0.1%
* change calculated from 2000 to 2005
When analysing changes over the 2000-2006 period of time, as provided in the above table, only one significant increase can be observed, that with respect to Sweden (+ 3.0%).
On the contrary, several important decreases are recorded in particular for “new” Member-States like Poland (-4.2%), Slo-vakia (-4.6%), the Czech Republic (-3.6%) and Baltic countries (-6.6% for Latvia and -4.8% for Estonia). In these countries, households have increased their final consumption at a higher pace than their disposable income.
Among EU15 Member States, only Belgium (-2.9 %) and Finland (-1.9 %) show such important decreases in their household saving rates.
Non-financial corporations
The non-financial corporations sector covers enterprises whose principal activity is the production of goods and non-financial services to be sold on the market.
In order to analyse the propensity of this sector to invest (in buildings, machinery etc…) and to therefore contribute to the long-term growth of the economy, the investment rate can be used as an indicator. It is defined as gross investment (fixed capital formation) divided by gross value added. By gross, we mean that the amount of fixed assets used up during the year as a result of normal wear and tear is not deducted.
Business investment rate
In Figure 2.2.13, the investment rate of non-financial corporations is displayed for all available Member States, EA13 and the EU.
33 A negative saving rate means that the household sector as a whole has to borrow to finance part of its current expenditures.
Statistical analysis 2

44 European Economic Statistics
Figure 2.2.13: (Gross) investment rates of non-financial corporations in the EU (%, 2006 data if available)
0%
5%
10%
15%
20%
25%
30%
35%
40%
Ge
rman
y
Slo
ven
ia
Fran
ce
Ital
y
Au
stri
a
Eu
ro a
rea
13
Be
lgiu
m
Ne
the
rlan
ds
Hu
ng
ary
(20
05
)
Ire
lan
d
Spai
n
Swe
de
n
Port
ug
al (
20
05
)
Pola
nd
Slo
vaki
a
Fin
lan
d
Un
ite
d K
ing
do
m
Cze
ch R
ep
ub
lic
De
nm
ark
Gre
ece
Latv
ia (
20
05
)
Lith
uan
ia
Esto
nia
EU
27
euro area countries
The business investment rate in the EU is same as in the euro area (22.1%). Among non euro area countries, the Member-States that have joined the EU in 2004 generally have high investment rates. This is the case in particular for Slovakia (38.7 %), Latvia (37.1 %), Estonia (33.3 %) and Slovenia (29.8%).
On the contrary, only a few EU15 Member States still have high investment rates, notably Spain (35.3%) and, to a lesser extent, Greece (28.9 %), Portugal (28.2 %) and Austria (27.2 %).
Table 2.2.3: Changes in the business investment rates between 2000 and 2006
(in percentage points)
EU27 EA13 BE BG CZ DK DE EE IE EL ES FR IT CY LV *
-0.6% -0.6% -2.1% : -7.4% 1.5% -3.0% 1.9% : 5.5% 4.8% -0.2% 1.0% : 1.2%
LT LU HU * MT NL AT PL PT * RO SI SK FI SE UK
0.1% : -3.9% : -2.8% -2.9% -12.9% -4.8% : -1.8% 6.4% -1.9% -1.7% :
* change calculated from 2000 to 2005
When turning to the dynamics of investment rates, as provided in table 2.2.3, it can be observed that the same decrease was recorded in the euro area and in the EU (-0.6 %). At the country level, a fall is observed for Poland (-12.9 %) and in the Czech Republic (-7.4 %). Several countries record a more limited, but still sizeable, decrease: Portugal (-4.8%), Hungary (-3.9%), Germany (-3.0 %), Austria (- 2.9 %), the Netherlands (-2.8%) and Belgium (-2.1 %). An important surge in investment rates is observed in three countries only, namely: Slovakia (6.4 %), Greece (5.5%) and Spain (+4.8 %).
Business profit share
Another important variable derived from the sector accounts is the profit share of the non-financial corporations measured as their gross operating surplus divided by gross value added. This indicator measures the portion of value added that re-munerates the capital. When put in relation to investment rates, it helps us to understand whether the investment behaviour of firms is linked to their current/past profitability.
2 Statistical analysis

45 European Economic Statistics
Figure 2.2.14: (Gross) profit shares of non-financial corporations in the EU (%, 2006 data, if available)
Ge
rman
y
Slo
ven
ia
Fran
ce
Ital
y
Au
stri
a
Eu
ro a
rea
13
Be
lgiu
m
Ne
the
rlan
ds
Hu
ng
ary
(20
05
)
Ire
lan
d
Spai
n
Swe
de
n
Port
ug
al (
20
05
)
Pola
nd
Slo
vaki
a
Fin
lan
d
Un
ite
d K
ing
do
m
Cze
ch R
ep
ub
lic
De
nm
ark
Gre
ece
Latv
ia (
20
05
)
Lith
uan
ia
Esto
nia
EU
27
euro area countries
0%
10%
20%
30%
40%
50%
60%
The profit share of non-financial corporations is one percentage point higher in the euro area (39.1 %) than in the EU (38.1 %). Low rates are observed for France (30.7%), Slovenia (32.1%) and Sweden (33,3%). At the other extreme, the highest profit shares can be observed for Greece (56.3%), Lithuania (53.4%), Slovakia (53.2%) and Ireland (52.0%).
Table 2.2.4: Changes in the profit share of non-financial corporations between 2000 and 2006
(Percentage points)
EU27 EA13 BE BG CZ DK DE EE IE EL ES FR IT CY LV *
1.3% 1.4% 4.2% : 0.5% -2.1% 4.9% 3.5% : -2.2% 0.8% -0.6% -3.7% : -0.2%
LT LU HU * MT NL AT PL PT * RO SI SK FI SE UK
1.7% : -0.2% : 1.3% 2.8% 10.2% -0.8% : 3.2% 4.7% -0.4% 3.0% :
* change calculated from 2000 to 2005
Profit shares have increased by 1.3% in the EU and by 1.4% in the euro area between 2000 and 2006. The most noticeable increases concern Poland (+10.2 %), Germany (+4.9 %), Slovakia (+4.7 %) and Belgium (+4.2 %). Some sizeable decreases can be observed in Italy (-3.7 %), Greece (-2.2 %) and Denmark (-2.1%).
2.2.8 Regional GDP
Map 2.2.1 provides an overview of the regional distribution of per capita GDP for the year 2005 (as a percentage of the aver-age for EU of 22 400 expressed in PPS) for the European Union. It ranges from 24% of the EU average (PPS 5 430) per capita in north-east Romania to 303% (PPS 67 798) per capita in the UK capital region of Inner London. The difference between the two ends of the range is therefore 12.5 to 1. Luxemburg, at 264% (59 202 PPS) and Brussels at 241% (53 876 PPS) follow in second and third places, and Hamburg at 202% (45 271 PPS) and Vienna at 178% (39 774 PPS) take fourth and fifth places.
The most prosperous regions are situated in southern Germany, in the south of the UK, in northern Italy and in Belgium, Luxembourg, the Netherlands, Ireland and Scandinavia. The capital regions of Madrid, Paris and Prague also fall into this category. Most of the economically weaker regions are in the southern and south-western periphery of the EU, in eastern Germany and the new Member States.
Statistical analysis 2

46 European Economic Statistics
Map 2.2.1
0 600 km
GDP per inhabitant, in PPS,by NUTS 2 regions, 2005
Cartography: Eurostat - GISCO, 05/2008© EuroGeographics Association, for the administrative boundariesData source: Eurostat
<= 5050 - <= 7575 - <= 9090 - <= 110110 - <= 125> 125Data not available
In percentage of EU-27=100
Guadeloupe (FR)
0 25
Martinique (FR)
0 20
Guyane (FR)
0 100
Réunion (FR)
0 20
Açores (PT)
0 100
Madeira (PT)
0 20
Canarias (ES)
0 100
Malta
0 10
0 100
Ísland
2 Statistical analysis
47 European Economic Statistics
Prague (Czech Republic), the region with the highest GDP per inhabitant in the new Member States, has already risen to twelfth place with 160% of the EU average (PPS 35 901), and Bratislavský kraj (Slovakia) with 148% (PPS 33 124) has reached eighteenth place out of the 271 level-two regions of the EU27. However, these two regions are exceptions in the new Mem-ber States, as the next ones are lagging far behind: Közép-Magyarország (Hungary) at 105% (23 489 PPS) in 111th place, Zahodna Slovenija (Slovenia) also at 105% (23 453 PPS) in 112th place and Cyprus at 93% (20 753 PPS) in 157th place. With the exception of two other regions (Mazowieckie in Poland and Malta), all the remaining regions of the new Member States have a GDP per inhabitant of less than 75% of the EU27 average.
If the 271 regions are divided into classes according to their GDP (in PPS) per inhabitant, the following picture emerges: in 2005, GDP in 69 regions was less than 75% of the EU average. These 69 regions account for 24.9% of the population, of which three quarters are in the new Member States, and one quarter in EU15 countries. 12.1% of the population live in re-gions whose per capita GDP is less than 50% of the EU average; all of these regions are situated in the new Member States.
At the upper end of the spectrum, 43 regions have a per capita GDP of more than 125% of the EU average. 21.7% of the population live in these regions. A total of 53.4% of the population, i.e. the majority, live in regions with a per capita GDP between 75% and 125% of the EU average.
A comparison of the ranges between 2000 and 2005 shows that the gap between the most and the least prosperous regions of the EU is beginning to narrow. While the difference between the two ends of the range was 15.8 to 1 in 2000, it decreased to 12.5 to 1 for the year 2005.
There are also substantial regional differences within countries themselves. In 2005, the highest per capita GDP was more than twice the lowest in 12 of the 21 countries with more than one NUTS-2 region. This group includes 5 of the 7 new Member States but only 7 of the 14 EU15 Member States.
The largest regional differences are in the United Kingdom and Slovakia, where there is a factor of 3.9 and 3.4 respectively between the two extreme values. The lowest values can be found in Ireland and Sweden, with a corresponding factor of 1.5 and 1.6 respectively. Moderate regional disparities in per capita GDP (i.e. factors of less than 2 between the highest value and the lowest) are found only in the EU15 Member States and in Bulgaria and Slovenia.
In all the new Member States and Croatia, and in a number of the EU15 Member States, a substantial share of economic activity is concentrated in the capital regions. As a result, in 17 of the 21 countries included here in which there is more than one NUTS 2 region, the capital regions are also the regions with the highest GDP per inhabitant. For example, Map 2.2.1 clearly shows the prominent position of the regions of Brussels, Prague, Sofia, Madrid, Paris, Lisbon, as well as Budapest, Bratislava, London, Warsaw and Bucharest.
A comparison of the ranges between 2000 and 2005, however, shows that developments in the EU15 were significantly different to those in the new Member States. Whilst the ranges between the regional extremes in the new Member States tended to increase, they decreased in most of the EU15 countries.
Statistical analysis 2

48 European Economic Statistics
2.3 Public finances
Governments play an important role in economies, through their activities in providing public services and in re-distrib-uting income. The way in which they finance themselves (taxation, borrowing) and the size, pattern and function of their expenditure have major impacts on other economic actors. In Europe there is particular interest in government fiscal policy, owing to the Excessive Deficit Procedure (EDP – see box 2.3.5) which limits government deficits and debts, and a debate on the sustainability and quality of public finances. All of these aspects are monitored within the framework of the Stability and Growth Pact.
The following analysis examines the finances of EU governments over recent years. These data do not include public corpo-rations which sell their products on a market (for example, most Post Offices); see Box 2.3.1 for further details.
BOX 2.3.1. DEFINITION OF THE GENERAL GOVERNMENT SECTOR
In the European System of Accounts (ESA95; paragraph 2.68) the sector “general government” has been defined as
containing “all institutional units which are other non-market producers whose output is intended for individual
and collective consumption, and mainly financed by compulsory payments made by units belonging to other sec-
tors, and/or all institutional units principally engaged in the redistribution of national income and wealth”.
The main functions of general government units are therefore:
– to organize or redirect flows of money, goods and services or other assets among corporations, among house-
holds or between corporations and households for the purpose of social justice, increased efficiency or other aims
legitimated by the citizens (redistribution of national income and wealth), for example corporate income tax paid
by companies used for financing unemployment benefits, or social contributions of employees paid for financing
pension systems;
– to produce goods and services to satisfy households´ needs (e.g. state health care) or simultaneously meet needs
of the whole community (e.g. defence, public order and safety).
By convention, the general government sector includes all the public corporations that are not able to cover at least
50% of their costs by sales, and are thus considered non-market producers.
Government expenditure
a. general trends and structure
EU total government expenditure (as defined in box 2.3.2) reached 45.8% of GDP in 2007. This was the lowest level in the 2002-2007 period (see Figure 2.3.1). The downward trend started in the EU in 2003, with a brief interruption between 2004 and 2005 when total expenditure increased very slightly; euro area expenditure, on the other hand, decreased continuously from 2003 (by 1.8 percentage points of GDP to 2007).
2 Statistical analysis

49 European Economic Statistics
Figure 2.3.1: Total general government expenditure in European Union and euro area in years 2002-2007
2002 2003 2004 2005 2006 2007
48.0
48.5
45.5
46.0
46.5
47.0
% o
f G
DP
47.5
eu27 ea13
A major proportion of government expenditure (42% of the EU total) in 2007 was for the purpose of redistribution of income in the form of social transfers in cash and in kind. A further 37% was spent on government production of goods and services: compensation of employees (23%) and intermediate consumption (14%). The share of interest on borrowing and rents paid by government was 6% of the total, whereas public investment spending (acquisitions less disposals of fixed assets; gross of consumption of fixed capital) took another 5.5%. The remainder was for other current transfers (just below 5%) and other components such as subsidies, capital transfers and taxes paid (5.5%).
In the euro area the share of social transfers in total expenditure was around 4 percentage points larger than in the EU (see Figure 2.3.2).
Figure 2.3.2: Composition of total government expenditure in EU27 and euro area in 2007
eu27
ea13
0% 20% 40% 60% 80% 100%
Social transfers Compensation of employees Intermediate consumption
Property income paid (incl. interest) Public investment Other current transfers
Others
Statistical analysis 2

50 European Economic Statistics
As mentioned above, the main purpose of EU governments’ spending is social protection (40% of total government ex-penditure), followed by general public services and health (14% each), education (11%) and economic affairs (8%). For public order and safety, governments spend around 4% of their total expenditure, and the shares of other government functions are as follows:
– defence 3.4%,
– housing and community amenities 2.2%,
– recreation, culture and religion 2.2%,
– environmental protection 1.4%.
BOX 2.3.2. GOVERNMENT REVENUE AND EXPENDITURE
To ensure consistency between a national accounts logic expressed in the sequence of accounts (production, genera-
tion, distribution, redistribution and use of income, accumulation and financing) and a government budget perspec-
tive (government spending and receipts), two additional concepts are defined in ESA95 with reference to national
accounts categories:
government revenue as a sum of: government expenditure as a sum of:
– sales consisting of: market output, output for own
final use, payments for the other non-market out-
put,
– taxes on production and imports,
– other subsidies on production, receivable,
– property income,
– current taxes on income and wealth, etc,
– social contributions,
– other current transfers,
– capital transfers;
– intermediate consumption,
– gross capital formation,
– compensation of employees,
– other taxes on production,
– subsidies, payable,
– property income (including interest), payable,
– current taxes on income, wealth, etc.,
– social benefits other than social transfers in kind,
– social transfers in kind related to expenditure on prod-
ucts supplied to households via market producers,
– other current transfers, payable,
– adjustment for the change in net equity of households
in pension funds reserves,
– capital transfers, payable,
– acquisitions less disposals of non-financial non-pro-
duced assets.
By convention the internal transactions inside the general government sector, i.e. between different sub-sectors or
between different general government units belonging to the same sub-sector, related to property income, other cur-
rent transfers and capital transfers are excluded from government revenue and expenditure.
2 Statistical analysis

51 European Economic Statistics
BOX 2.3.3: CLASSIFICATION OF FUNCTIONS OF GOVERNMENT (COFOG)
COFOG was developed in its current version in 1999 by the Organization for Economic Cooperation and Development
(OECD) and published by the United Nations Statistical Division as a standard classifying the purposes of government
activities. The classification has three levels of detail:
– divisions: describing the broad objectives of government,
– groups and classes: defining the means by which these broad objectives are achieved.
Government broad objective (division) Sub-items
General public services Executive and legislative organs, financial and fiscal
affairs, external affairs foreign economic aid, basic re-
search, R&D related to general public services, public
debt services, transfers of a general character between
different levels of government
Defence Military and civil defence, foreign military aid, R&D re-
lated to defence
Public order and safety Police, fire-protection services, law courts, prisons, R&D
related to public order and safety
Economic affaires General economic, labour and commercial affairs, agri-
culture, forestry, fishing and hunting, fuel and energy,
mining, manufacturing and construction, transport,
communication, other industries, related R&D
Environmental protection Waste and water waste management, pollution abate-
ment, protection of biodiversity and landscape, re-
lated R&D
Housing and community amenities Housing development, community development, wa-
ter supply, street lighting, R&D related
Health Medical products, appliances and equipment, outpa-
tient, hospital and public health service, R&D related
to health
Recreation, culture and religion Recreational and sporting, cultural services, broadcast-
ing and publishing services, religious and other com-
munity services, R&D
Education Pre-primary, primary, secondary and tertiary education,
post-secondary non-tertiary education, education non-
definable by level, subsidiary services to education, R&D
Social protection Sickness and disability, old age, survivors, family and
children, unemployment, housing, R&D, social exclu-
sion, nec.
Statistical analysis 2

52 European Economic Statistics
Figure 2.3.3: EU and euro area government expenditure by COFOG functions
0% 20% 40% 60% 80% 100%
Social protection General public services Health
Education Economic affairs Public order and safety
Others
eu27*
ea13
Source: Eurostat. Data for EU27 for 2004 and EA13 for 2005.
b. inter-country comparisons
Nine Member States recorded total general government expenditure over the EU27 average in 2007, as a share of the econ-omy. The highest level, at 52.6% of GDP, was in Sweden and France, followed by Hungary and Denmark where total ex-penditure also exceeded 50% of GDP. The lowest general government expenditures in 2007 were in the Slovak Republic, Luxembourg, Romania, Bulgaria, Spain, Lithuania, Latvia and Ireland – all below 40% of GDP, and in particular in Estonia, where it was below 35%.
Compared to the situation in 2002, most Member States were able to stabilize or decrease the level of their government ex-penditure. The highest decrease, by 8 percentage points, was achieved by the Slovak Republic, whilst in Denmark, Sweden, Germany, the Czech Republic, Slovenia and Luxembourg the fall was close to or above 4 percentage points. Only in Italy, Lithuania, Portugal, the United Kingdom, Latvia, Ireland and Cyprus did total government expenditures increase between 2002 and 2007, in all cases by less than 4 percentage points of GDP.
Total government expenditure in Norway in 2007 was 40.9% of GDP, lower than the 2002 level by 6 percentage points. In Iceland, it was 40.5% of GDP in 2006 (the latest year available), as compared to 44.2% of GDP in 2002.
2 Statistical analysis

53 European Economic Statistics
Figure 2.3.4: Government expenditure in % of GDP in 2007 and its change since 2002
30
35
40
45
50
55
-8 -6 -4 -2 0 2 4
change in pp between 2002 and 2007
TE a
s %
of
GD
P in
20
07
ee
itie
lves
bgro
lusk
czsi
de
plgr
mt
uk cy
pt
it
nl
be
fiat
hudk
se fr
ea13eu27
Source: Eurostat.
Government expenditure per inhabitant was above 11,400 euro on average in the EU in 2007 and differed significantly between Member States. In Luxembourg, in 2007, the government spent almost 29,000 euro per inhabitant 34, the highest value in the EU, whereas for Bulgaria the equivalent value was below 1,500 euro. Government spending per inhabitant was below 10,000 euro in all the Member States that have joined the EU since 1 May 2004 (Central and Eastern European coun-tries, Malta and Cyprus) as well as in Spain, Greece and Portugal.
Of the EEA countries, Norway recorded government expenditure per inhabitant in 2007 of above 24,600 euro, and in Ice-land it amounted to 17,700 euro in 2006.
34 This figure for Luxembourg (and also the equivalent figure for revenue below) is inflated by the fact that around 45% of Luxembourgish labour force are non-residents.
Statistical analysis 2

54 European Economic Statistics
Figure 2.3.5: Government expenditure in euro per inhabitant in 2007.
0
5000
10000
15000
20000
25000
30000
35000
eu
ro
LU DK SE FI AT NL FR IE BE UK DE EA13 IT EU27 ES GR CY SI PT MT CZ HU EE SK PL LV LT RO BG
Source: Eurostat.
An analysis of the composition of total expenditure in individual Member States in 2007, gives rise to the following obser-vations35:
– Belgium, the Czech Republic, Germany, Greece, France, Italy, Luxembourg, the Netherlands, Austria, Portugal and the Slovak Republic spent at least two fifths of their total government expenditure on redistributive transactions (social transfers), with Germany the highest at over 56%, whereas in Cyprus, Latvia, Romania and Lithuania the share of social transfers was below 30%;
– the share of compensation of government employees was the greatest in Cyprus and Denmark (33%), and also exceeded 30% in Latvia and Malta. However, in the Czech Republic, Austria, the Slovak Republic, Luxembourg and Germany it was below 20%;
– intermediate consumption (purchases of non-capital goods and services) was a relatively less important form of gov-ernment spending in Belgium, Germany, France, Austria and Portugal, with a share of total expenditure below 10%, whereas in Bulgaria its share in 2007 was over 20%;
– interest payments (making up most of the component ‘property income, payable’) had a relatively high share of total government expenditure in countries with a high level of government debt, such as Italy and Greece (both around 10%) and Belgium (close to 8%), and a very low share in Member States with a low level of government debt: in particular the Baltic States and Luxembourg (with shares not exceeding 2%),
– the EU Member States dedicating the greatest share of government spending to investment were Romania, Latvia and Lithuania (all around 15%). The share of investment was below the EU weighted average (5.5%) in eight Member States: Belgium, Denmark, Germany, Italy, Portugal, the Slovak Republic, Finland and the United Kingdom, but only in Aus-tria was the share in 2007 below 3%,
35 The United Kingdom and Greece are excluded from the analysis of shares of social transfers and intermediate consumption in total government expenditure. For these countries, social transfers are underestimated and intermediate consumption is overestimated due to the statistical treatment of social transfers in kind related to expenditure on products supplied to households via market producers.
2 Statistical analysis

55 European Economic Statistics
– the share of other current transfers was relatively high in Latvia and Cyprus (above 10%), whereas the share of govern-ment spending on subsidies (amounting to over 7%) and on capital transfers (over 4%) explains the high expenditure component ‘others’ (see Figure 6) in Austria.
Figure 2.3.6: Main components of government expenditure in 2007
Social transfers Compensation of employees Intermediate consumption
Public investment Other current transfers Others
Property income paid
(incl. interest)
% o
f to
tal e
xpe
nd
itu
re
0%
20%
40%
60%
80%
100%
BE BG CZ DK DE EE IE GR ES FR IT CY LV LT LU HU MT NL AT PL PT RO SI SK FI SE UK
Source: Eurostat.
In Norway, the share of social transfers in total government expenditure in 2007 was 35%, compensation of employees amounted to 30% and intermediate consumption to 15%, followed by investment (7.4%), other current transfers (5%), sub-sidies (4.6%) and interest paid (3%). In Switzerland (2005 data) the importance of social transfers was similar to Norway (36%); however, the shares of compensation of employees, intermediate consumption and public investment were lower (23, 11 and 6.2%, respectively), whereas the share of subsidies was almost 7 percentage points higher (11.5%). In Iceland, com-pensation of employees was the dominant type of government expenditure (over 38% of total) in 2006.
There are also some interesting differences across countries in the purposes for which government spending was used. In most Member States, expenditure on social protection is dominant, with a share in total government expenditure in some cases of over 40% of GDP (in Denmark, Greece, France, Luxembourg, Austria, Finland and Sweden, with the largest share in Germany: almost 47%). However, in the Baltic States, Ireland, the Czech Republic and Romania, the share of this expenditure is below 30%. Cyprus is the only Member State that dedicates a comparable share of its total government ex-penditure to social protection and general public services: 24% and 23% respectively. Spending on general public services is also clearly the next most important function in Belgium, Greece, Italy, Hungary, the Netherlands and the Slovak Republic, which is mainly explained by the fact that, in Belgium, Hungary, Greece and Italy, over 40% of this expenditure is made in respect of interest payments on debt. By contrast, in Estonia and Romania the respective share of general public services is below 10%.
Ireland spent a higher proportion of its government expenditure on health (23%), followed by Czech Republic, Portugal, Romania and the United Kingdom (all with shares exceeding 15%). By contrast, Latvia and Cyprus dedicated just under 8% of total government expenditure to health.
Statistical analysis 2

56 European Economic Statistics
Estonia spent over 18% of its government expenditure on education. Shares over 15% were also observed for Cyprus, Latvia, Lithuania and Portugal, whereas for Greece it was just 5.5% - the lowest level in the EU; in Italy and Germany the propor-tion was close to 9%.
Economic affairs is also a relatively important function in many countries. Its share in total government expenditure was over 15% in the Czech Republic, Latvia and Romania. The EU Member States with the lowest shares – below 7% – were France, the United Kingdom and Denmark.
The share of expenditure on public order and safety ranged from 1.9% in Denmark to 7.5% in Bulgaria. Amongst other pur-poses of government spending, defence is quite important in the United Kingdom, Greece and Cyprus (making up over 5% of the total), with housing and community amenities relatively important in Romania and Cyprus, and recreation, culture and religion representing over 7% of government expenditure in Estonia. Malta is the EU Member State that dedicates the largest share of its government expenditure (close to 4%) to environmental protection.
In Norway, the main purpose of government expenditure is also social protection (over 38% of the total in 2006), followed by health (17%), education (13.5%) and general public services (almost 11%).
Figure 2.3.7: Government expenditure in EU Member States by COFOG functions (2005 and 2006 data36).
0%
20%
40%
60%
80%
100%
BE* BG** CZ DK DE EE IE GR ES FR* IT CY LV LT LU HU* MT NL* AT PL PT RO* SI* SK* FI SE* UK*
Social protection General public services Health
Economic affairs Public order and safety Others
Education
Source: Eurostat. Data for the Slovak Republic are provisional.
36 Where available, data for 2006 are presented. However for some Member States (marked with “*”) the figures shown relate to 2005 - and for BG (marked with “**”) there is a 2004-breakdown.
2 Statistical analysis

57 European Economic Statistics
Government revenue37
a. general trends and structure
Total revenue of general government in the EU amounted to 44.9% of GDP in 2007, the same level as in 2006. It was pre-ceded by a decrease between 2003 and 2004, and then by a rise of 1 percentage point of GDP between 2004 and 2006. The same trend can be observed for total general government revenue for the euro area, but at a level around one percentage point of GDP higher.
The evolution of total revenue in the EU and the euro area, as presented in Figure 2.3.8 can be explained by the behaviour of its main components over this period: taxes and social contributions (see Figure 2.3.13).
Figure 2.3.8: Total general government revenue in European Union and euro area in 2002-2007
2002 2003 2004 2005 2006 2007
% o
f G
DP
eu27 ea13
43.0
43.5
44.0
44.5
45.0
45.5
46.0
Source: Eurostat
EU governments collect most of their revenue (around 60% on average) in the form of taxes, and a further 30% as social contributions. The share of revenue from sales of products and services by government is around 5%, whereas around 2% of revenue comes from rents and interest received (property income) and another 2% from current and capital transfers.
Figure 2.3.9: Composition of total revenue in European Union and euro area in 2007
eu27
ea13
0% 20% 40% 60% 80% 100%
Government sales Taxes Social contributions Property income Others
% of total revenue
Source: Eurostat
37 For formal definition of government revenue and expenditure see box 2.3.2
Statistical analysis 2

58 European Economic Statistics
b. Inter-country comparison
Figure 2.3.10 presents total government revenue as a % of GDP in particular Member States, as recorded in 2007, and its change in percentage points of GDP compared to 2002. It groups Member States into four categories:
– countries where total revenue of general government as a % of GDP is higher than the EU average and where total rev-enue has fallen since 2002: Austria, Belgium and Finland;
– countries that recorded total government revenue in 2007 above the EU27 average and at a higher level than in 2002: Sweden (with the highest revenue as a % of GDP in the whole EU at 56% of GDP), Denmark, France, Italy, the Neth-erlands and Cyprus, the latter with the highest increase in government revenue of more than 10 pp between 2002 and 2007;
– countries with total revenue as a % of GDP lower than the EU average and where it has fallen since 2002: Germany, Slovenia, Luxembourg, the Slovak Republic and Romania;
– the remaining countries with total revenue as a % of GDP below the EU average in 2007 but at a higher level than in 2002.
The lowest level of total revenue, below 35% of GDP, was recorded in 2007 by Lithuania, Romania and the Slovak Republic.
In Iceland, total government revenue amounted to 45.7% in 2006, an increase of 4 percentage points since 2002, whereas in 2007 Norway recorded a higher level of government revenue than any EU Member State, at 58.3% of GDP, which is 2 percentage points higher than in 2002.
Figure 2.3.10: Government revenue in % of GDP in 2007 and its change since 2002
change in pp between 2002 and 2007
TE a
s %
of
GD
P in
20
07
30
35
40
45
50
55
60
-4 -2 0 2 4 6 8 10 12
se
dk
fi
be
at
fr
itnl
desi
lu
ro sk lt
ee
gr
pl
czuk bg
pt
hu
esmt
ie
lv
cy
ea13
eu27
Source: Eurostat.
2 Statistical analysis

59 European Economic Statistics
Looking at the relationship between the value of total revenue and the country’s total population, using total government rev-enue in euro per inhabitant as an indicator, it is clear that all the Member States that joined the EU since 1 May 2004 collect less revenue per inhabitant than the EU average (11,200 euro), with Spain, Portugal and Greece also below the EU average. By contrast, in Luxembourg, Denmark and Sweden, government revenue per inhabitant was above 20,000 euro in 2007.
In Norway, government revenue in euro per inhabitant was above 35,100 euro, more than three times the EU average in 2007, whereas in Iceland in 2006 it was just below 20,000 euro (having fallen by around 1,000 since 2005).
Figure 2.3.11: Government revenue per inhabitant in 2007.
0
5000
10000
15000
20000
25000
30000
35000
eu
ro
LU DK SE FI NL IE AT BE FR UK DE EA13 IT EU27 ES CY GR SI PT MT CZ HU EE SK LV PL LT RO BG
Source: Eurostat.
As mentioned above, 90% of EU government revenue is collected in the form of taxes and social contributions. Only in Bulgaria, Greece, Latvia, the Slovak Republic and Finland did the overall share of other types of revenue exceed 15% of the total in 2007. All these Member States except Finland relied more heavily than other EU Member States on transfers from other sectors of the economy – Bulgaria and the Slovak Republic collect over 7% of their total revenue from other current transfers, whereas in Greece other capital transfers were above 6%. In Bulgaria, Latvia and Finland, government sales were higher than the EU average by more than three percentage points. Property income was also relatively important in Finland with a share of close to 8%; in the Netherlands government collected 5% of its total revenue from property income.
Statistical analysis 2

60 European Economic Statistics
Figure 2.3.12: Main components of government revenue in 2007
0%
10%
20%
30%
40%
50%
60%
70%
80%
90%
100%
Taxes Social contributions Government sales
Property income Others
in %
of
tota
l go
vern
me
nt
reve
nu
e
BE BG CZ DK DE EE IE GR ES FR IT CY LV LT LU HU MT NL AT PL PT RO SI SK FI SE UK
Source: Eurostat
In Norway, most of government revenue also comes from taxes and social contributions: current taxes on income, wealth, etc. (over 37% of the total in 2007), taxes on production and imports (21%), social contributions (over 15%). However, what distinguishes this country from EU Member States is that over 20% of government revenue is collected in the form of property income (interest, rents received), largely relating to its “Government Pension Fund – Global” (oil fund). Iceland relies to the same extent on current taxes on income and wealth and taxes on production and imports (representing 40% in 2006), whereas it collects less social contributions (around 7%). Its government sales are above 7% and property income is around 5%. In Switzerland, the most important revenues are current taxes on income, wealth, etc (the share in government revenue was around 43% in 2005), followed by taxes on production and imports and social contributions (each above 20%) and government sales with a share of just over 10%.
Taxes and social contributions
a. general trends in EU and euro area
The evolution of the main tax revenue components over the period 2002-2007 is presented in the figure 2.3.13. Between 2002 and 2003 taxes on income and wealth began to fall, offset by increases in revenues from social contributions and capi-tal transfers38. In 2004 the fall in current taxes on income and wealth continued, accompanied by a fall in social contribu-tions (falling overall by 0.5 percentage point of GDP until 2007). In 2005 current taxes on income and wealth, etc. started to rise (by more than 1 percentage point to 2007), accompanied by a slow increase in taxes on production and imports between 2004 and 2006.
In 2007, the share of social contributions, taxes on production and imports and current taxes on income and wealth, etc. as revenue of general government (not including EU institutions) in terms of GDP amounted to 13.6, 13.5 and 13.4% in EU and to 15.2, 13.5 and 12.5% in euro area, respectively. The value of capital taxes levied at irregular and infrequent intervals
38 Capital taxes and other capital transfers are not presented in figure 2.3.13, since in general their value is very small (below 1% of GDP).
2 Statistical analysis

61 European Economic Statistics
on the value of assets and net worth, such as inheritance taxes, was 0.25% of GDP in the EU and 0.27% in the euro area. The remainder of this section will concentrate on 2006 data, as the detailed breakdown of taxes and data on tax revenue of EU institutions is only available for 2006.
Figure 2.3.13: Taxes and social contributions in European Union and euro area – evolution over 2002-2007
2002 2003 2004 2005 2006 2007
eu27_taxes on production and imports eu27_current taxes on income and wealth, etc
eu27_social contributions ea13_taxes on production and imports
ea13_current taxes on income and wealth, etc ea13_social contributions
% o
f G
DP
11.0
11.5
12.0
12.5
13.0
13.5
14.0
14.5
15.0
15.5
16.0
Source: Eurostat. The data do not allow for taxes on productions and imports collected for EU institutions that in 2006 for EU27 accounted for 0.3% of GDP.
Looking at the evolution of taxation by specific economic functions (labour, consumption and capital) in the EU, it can be noted that taxes on labour decreased by half a percentage point of GDP between 2003 and 2004 due to a fall in social contributions and personal income tax, and then remained stable at around 19.5% of GDP. Taxes on capital increased by 1.3 percentage points of GDP since 2003 to reach 9.4% of GDP in 2006 (mostly due to an increase of 0.8 percentage point in corporate income tax), whereas taxes on consumption remained stable over the whole period 2002-2006, at 11.1% of GDP.
Data for the euro area generally followed the same pattern; however, taxation on labour is around 1 percentage point higher and taxation on consumption and capital is slightly lower (by 0.2-0.4 percentage point) than in the EU.
Statistical analysis 2

62 European Economic Statistics
Figure 2.3.14: Taxation by economic structures – evolution in EU and euro area over 2002-2006
2002 2003 2004 2005 2006
eu27_cons ea15_cons
eu27_lab ea15_lab
ea15_cap
eu27_cap
% o
f G
DP
6.0
8.0
10.0
12.0
14.0
16.0
18.0
20.0
22.0
Source: Taxation trends in the EU. Data for the EU Member States and Norway; 2008 edition
Figure 2.3.15: Implicit tax rates in EU and euro area – evolution over 2002-2006
2002 2003 2004 2005 2006
%
15
20
25
30
35
40
eu27_cons ea15_cons
eu27_lab ea15_lab
ea15_cap
eu27_cap
Source: Taxation trends in the EU. Data for the EU Member States and Norway; 2008 edition
2 Statistical analysis

63 European Economic Statistics
Implicit tax rates show the relationship between taxes on specific economic functions and the size of their potential tax bases. In 2006, taxes on labour accounted in EU for 36.7% of the labour tax base (compensation of employees increased by payroll taxes and taxes on wage bill) and had remained fairly stable since 2002, with a small decrease (of 0.5 percentage point) between 2003 and 2004 and an equivalent increase between 2005 and 2006. Consumption taxes in EU are close to 20% of final consumption expenditure of resident households over the whole period. There has been a significant increase in the implicit tax rate on capital since 2003, up 4.4 percentage points to 33.3 % in 2006.
It is also interesting to examine the relationship between the implicit tax rates (ITRs) on capital and consumption. Whereas capital was taxed slightly less than consumption as a % of GDP, by taking into account the value of the potential tax bases it can be seen that taxation of capital is more than 10 percentage points higher than that of consumption, and this difference is increasing over time.
b. structure of taxation in EU and euro area in 2006
Looking at a more detailed breakdown of taxes, social contributions show up as the most significant source of tax revenue in EU, with a share of over 33%, followed by taxes on income (over 30%) and VAT and other taxes on products on produc-tion (close to 17% each).
Figure 2.3.16: Main components of tax revenue in EU and euro area in 2006.
eu27
ea13
0% 10% 20% 30% 40% 50% 60% 70% 80% 90% 100%
Social contributions Taxes on income Value added type taxes (VAT)
Other taxes on products and production Others
% of total tax revenues
Source: Eurostat. Component ‘Others’ includes: all current taxes on income and wealth, etc, but taxes on income and capital taxes reduced by amounts assessed but
unlikely to be collected, where applicable.
The economic function bringing in most tax revenue (at close to 50%) is labour. Taxes on consumption account for almost 28% of total taxation, whereas taxes on capital make up the remainder (over 23%).
Statistical analysis 2

64 European Economic Statistics
Figure 2.3.17: Composition of tax burden by economic functions in EU and euro area in 2006.
eu27
ea15
0% 10% 20% 30% 40% 50% 60% 70% 80% 90% 100%
Labour Consumption Capital
% o
f to
tal
Source: Taxation trends in the EU. Data for the EU Member States and Norway; 2008 edition
c. inter-country comparison
The share of social contributions is above the EU weighted average (33.5% of total tax revenue) in 14 Member States, com-ing close to 40% in Greece and France and higher in Czech Republic (which, at 44.8%, has the highest share in the whole EU), Germany and the Slovak Republic. In Denmark, which finances its social benefits mainly from taxes on income, social contributions make up just under 4%. The second lowest share of social contributions, at over 18%, was recorded by Ireland. Cyprus, Malta and the United Kingdom have shares below 22%.
Figure 2.3.18: Main types of taxes in EU Member States in 2006.
Social contributions Taxes on income Value added type taxes (VAT)
Other taxes on products and production Others
% o
f to
tal t
ax r
eve
nu
e
0%
10%
20%
30%
40%
50%
60%
70%
80%
90%
100%
BE BG CZ DK DE EE IE GR ES FR IT CY LV LT LU HU MT NL AT PL PT RO SI SK FI SE UK
Source: Eurostat
2 Statistical analysis

65 European Economic Statistics
Taxes on income are the most important source of tax revenue in Denmark, with a share close to 58% of the total. In Fin-land, Sweden, the United Kingdom and Ireland the respective share was over 38% and in Belgium and Luxembourg over 34%. In the Slovak Republic, Bulgaria and Romania this type of tax was relatively less important, generating no more than 20% of total tax revenues in 2006.
Value added tax was very important in the structure of taxation in Bulgaria (over 36% of the total in 2006). In the Baltic States, Romania, Cyprus and Slovak Republic its share was above 25%, whereas Italy, Belgium and Luxembourg raised less than or close to 15% of their tax revenues from VAT.
Looking at the components of other taxes on products and production, a relatively high level of taxes and duties on imports was reported by Bulgaria, Estonia, Ireland and Luxembourg (close to or over 2% of GDP). Domestic excise, consumption and sales taxes, stamp taxes and taxes on capital and financial transactions generate revenue amounting to 5% of GDP or more in Italy, Spain, Denmark, Hungary, Malta and Portugal. Italy, France and Sweden also have relatively high revenues (above 3% of GDP) from taxation of land and buildings used for production (especially France), of total wage bills and pay-roll taxes (especially Sweden) and from other taxes paid by enterprises as a result of engaging in production, where the taxes are independent of the quantity or value of goods and services produced or sold.
The United Kingdom and Denmark collect revenues of over 1% of GDP from other current taxes, especially from current taxes on capital (e.g. property taxes on buildings periodically paid by individuals) that are not seen at all in the tax systems of Estonia, Ireland, Malta and Bulgaria (in 2006).
Capital taxes levied at irregular and infrequent intervals are usually considered as inheritance taxes or gift taxes, rather than as taxes levied directly on the value of assets owned or net worth (so-called “wealth taxes”). Only in Belgium was the value of capital tax revenues in 2006 above 0.6% of GDP, although Estonia is the only Member State that does not collect this type of tax revenue at all.
Consumption is the economic function on which most tax revenues in Bulgaria (over 50%), Cyprus, Malta and Romania (over 40%) and Ireland (almost 38%) are levied, whereas in all the other Member States labour is the most common basis for taxation; only in the Slovak Republic and Poland did the difference between shares of both functions not exceed 2 per-centage points in 2006. In general, taxation on capital is the lowest in all countries; only in Spain, Italy, Luxembourg and the United Kingdom did taxation on capital raise more tax revenues than taxation of consumption, and in the latter two Member States its share of the total tax burden was over 30% in 2006.
Statistical analysis 2

66 European Economic Statistics
Figure 2.3.19: Taxes by economic functions in EU Member States in 2006
Labour Consumption Capital
0%
10%
20%
30%
40%
50%
60%
70%
80%
90%
100%
% o
f to
tal t
ax b
urd
en
BE BG CZ DK DE EE IE EL ES FR IT CY LV LT LU HU MT NL AT PL PT RO* SI SK FI SE UK
Source: Taxation trends in the EU. Data for the EU Member States and Norway; 2008 edition
Figures 2.3.20-2.3.22 present the implicit tax rates on consumption, labour and capital (where available) for individual EU Member States. The Member State that raises the most taxes on domestic final consumption of its households is Denmark (34% in 2006), whereas the respective ratio in Spain and Lithuania is less than half of this (16.4 and 16.7%, respectively).
Figure 2.3.20: Implicit tax rate on consumption in EU Member States in 2006
%
0
5
10
15
20
25
30
35
DK SE FI IE NL BG HU LU SI EE BE CZ PT AT CY PL SK FR LV MT UK DE RO EL IT LT ES
Source: Taxation trends in the EU. Data for the EU Member States and Norway; 2008 edition
2 Statistical analysis

67 European Economic Statistics
Taxes on labour in relation to the compensation of employees are the highest in Sweden (44.5%), with the lowest implicit tax rates on labour recorded in Malta (21.5%), Cyprus, Ireland and the United Kingdom (close to or just above 25%)
Figure 2.3.21: Implicit tax rate on labour in EU Member States in 2006
%
0
5
10
15
20
25
30
35
40
45
SE IT BE FR FI AT CZ DE HU EL SI DK PL LT EE LV NL ES BG SK LU RO* PT UK IE CY MT
Source: Taxation trends in the EU. Data for the EU Member States and Norway; 2008 edition. For Romania 2005 data.
Amongst the Member States for which data on ITR on capital are available, the highest levels were recorded in Ireland, France, Denmark and the United Kingdom (close to or over 40%), whereas in Estonia and Latvia its level was four times lower.
Statistical analysis 2

68 European Economic Statistics
Figure 2.3.22: Implicit tax rate on capital in EU Member States in 2006
%
0
5
10
15
20
25
30
35
40
45
IE FR DK UK ES CY IT BE PT* CZ FI DE AT PL* NL SK LT LV* EE
Source: Taxation trends in the EU. Data for the EU Member States and Norway; 2008 edition. For Portugal, Poland and Latvia 2005 data.
BOX 2.3.4. TAXATION
Total tax revenue is an aggregate comprising:
– taxes on production and imports, such as value added tax, import duties, excise duties and consumption taxes,
stamp taxes, payroll taxes, taxes on pollution, and others,
– current taxes on income, wealth, etc, such as corporate and personal income taxes, taxes on holding gains, pay-
ments for households for licence to own or use car, hunt or fish, current taxes on capital that are paid periodically,
and others,
– capital taxes, such as inheritance taxes, death duties and taxes on gifts and capital levies that are occasional or
exceptional,
– actual social contributions paid on a compulsory or voluntary basis by employers or employees or the self- or
non-employed to insure against social risks (sickness, invalidity, disability, old age, survivors, family, maternity),
– implicit social contributions payable under unfunded social insurance schemes (in which employers pay social
benefits to their employees, ex-employees or their dependants out of their own resources without creating special
reserve for the purpose).
reduced by the amount of taxes and social contributions assessed unlikely to be collected, where applicable.
The ESA95 category “taxes on production and imports” is also known under the economic term “indirect taxes”,
whereas “taxes on income, wealth, etc” and “capital taxes” are defined as “direct taxes”.
2 Statistical analysis
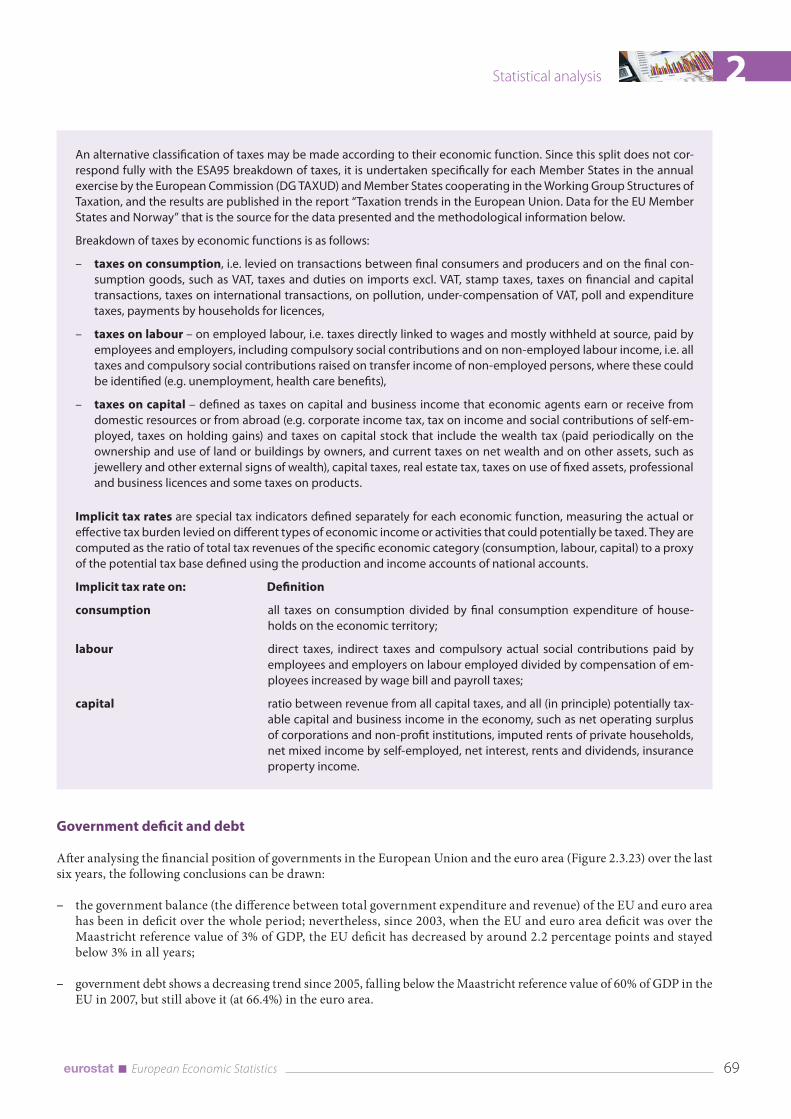
69 European Economic Statistics
An alternative classification of taxes may be made according to their economic function. Since this split does not cor-
respond fully with the ESA95 breakdown of taxes, it is undertaken specifically for each Member States in the annual
exercise by the European Commission (DG TAXUD) and Member States cooperating in the Working Group Structures of
Taxation, and the results are published in the report “Taxation trends in the European Union. Data for the EU Member
States and Norway” that is the source for the data presented and the methodological information below.
Breakdown of taxes by economic functions is as follows:
– taxes on consumption, i.e. levied on transactions between final consumers and producers and on the final con-
sumption goods, such as VAT, taxes and duties on imports excl. VAT, stamp taxes, taxes on financial and capital
transactions, taxes on international transactions, on pollution, under-compensation of VAT, poll and expenditure
taxes, payments by households for licences,
– taxes on labour – on employed labour, i.e. taxes directly linked to wages and mostly withheld at source, paid by
employees and employers, including compulsory social contributions and on non-employed labour income, i.e. all
taxes and compulsory social contributions raised on transfer income of non-employed persons, where these could
be identified (e.g. unemployment, health care benefits),
– taxes on capital – defined as taxes on capital and business income that economic agents earn or receive from
domestic resources or from abroad (e.g. corporate income tax, tax on income and social contributions of self-em-
ployed, taxes on holding gains) and taxes on capital stock that include the wealth tax (paid periodically on the
ownership and use of land or buildings by owners, and current taxes on net wealth and on other assets, such as
jewellery and other external signs of wealth), capital taxes, real estate tax, taxes on use of fixed assets, professional
and business licences and some taxes on products.
Implicit tax rates are special tax indicators defined separately for each economic function, measuring the actual or
effective tax burden levied on different types of economic income or activities that could potentially be taxed. They are
computed as the ratio of total tax revenues of the specific economic category (consumption, labour, capital) to a proxy
of the potential tax base defined using the production and income accounts of national accounts.
Implicit tax rate on: Definition
consumption all taxes on consumption divided by final consumption expenditure of house-
holds on the economic territory;
labour direct taxes, indirect taxes and compulsory actual social contributions paid by
employees and employers on labour employed divided by compensation of em-
ployees increased by wage bill and payroll taxes;
capital ratio between revenue from all capital taxes, and all (in principle) potentially tax-
able capital and business income in the economy, such as net operating surplus
of corporations and non-profit institutions, imputed rents of private households,
net mixed income by self-employed, net interest, rents and dividends, insurance
property income.
Government deficit and debt
After analysing the financial position of governments in the European Union and the euro area (Figure 2.3.23) over the last six years, the following conclusions can be drawn:
– the government balance (the difference between total government expenditure and revenue) of the EU and euro area has been in deficit over the whole period; nevertheless, since 2003, when the EU and euro area deficit was over the Maastricht reference value of 3% of GDP, the EU deficit has decreased by around 2.2 percentage points and stayed below 3% in all years;
– government debt shows a decreasing trend since 2005, falling below the Maastricht reference value of 60% of GDP in the EU in 2007, but still above it (at 66.4%) in the euro area.
Statistical analysis 2

70 European Economic Statistics
Figure 2.3.23: Evolution of EU27 and EA13 public balance (scale inverted) and debt over years 2002-2007
2002 2003 2004 2005 2006 2007
government deficit/surplus EA13 government deficit/surplus EU27
government debt EU27 government debt EA13
de
fici
t in
% o
f G
DP
de
bt
in %
of
GD
P
0
-1
-2
-3
-4
-5
-6
-7
-8
-9
-10
-11
-12
-13
58
60
62
64
66
68
70
Source: Eurostat
Looking at the budgetary position of individual countries in 2007, 11 out of 27 Member States recorded a government surplus, which for Finland reached 5.3% of GDP; there were also significant government surpluses in Denmark, Sweden, Bulgaria, Cyprus, Luxembourg and Estonia. Of the 16 countries recording a deficit, the worst performing country was Hungary (-5.5%), which was the only Member State that exceeded the Maastricht deficit threshold of 3% of GDP in 2007.
Compared to the situation in 2002, all but four Member States improved their government budgetary position as a percent-age of GDP. Cyprus achieved the biggest improvement, moving from a deficit of 4.4 % of GDP in 2002 to a surplus of 3.3% of GDP in 2007, mostly by increasing its tax revenues, especially from taxes on production and imports in this period. It was followed by the Slovak Republic and the Czech Republic, both with deficit reductions above 5 percentage points; in the Slovak Republic these reductions resulted from expenditure cuts significantly exceeding reductions in revenues and, in the Czech Republic, from a mixture of expenditure cuts and revenue rises. Austria returned in 2007 to its deficit level of the year 2002 and the government deficit rose between 2002 and 2007 in the United Kingdom, Romania and Belgium, albeit by one percentage point or less.
In Norway, the government balance stood at a surplus of 19% of GDP in 2006, which was 10 percentage points higher than the balance in 2002.
2 Statistical analysis

71 European Economic Statistics
BOX 2.3.5. THE EXCESSIVE DEFICIT PROCEDURE (EDP)
The fiscal framework of the European Monetary Union (the Protocol on the Excessive Deficit Procedure annexed to the
Maastricht Treaty) requires from euro area member and candidate countries a soundness of public finances, defined
on the basis of the following criteria:
– negative public balance (deficit) not exceeding 3% of GDP,
– public debt not exceeding 60% of GDP.
For sake of comparability between Member States these criteria are measured based on (though not fully identical to)
two economic categories from the national accounts framework:
– net lending(+)/ net borrowing (-) of general government,
– liabilities of general government, respectively.
In the framework of the EDP, all Member States are requested to report their data to Eurostat before 1 April and 1
October each year. Following the assessment, Eurostat shall, within three weeks after the deadline, provide the actual
government deficit and debt data through publication.
The respective definitions are presented in the following table:
National accounts (ESA95) Excessive deficit procedure (EDP)
Net lending (+)/ net borrowing (-)Government surplus / deficit (net lending/ borrow-
ing under EDP)
= net acquisition of financial assets less net incurrence
of liabilities or
= gross saving (defined as gross disposable income
less final consumption expenditure) corrected by net
capital transfers and gross acquisitions less disposals of
non-financial assets, or
= total revenue less total expenditure
= net lending (+)/ net borrowing (-)of General Govern-
ment (as defined in ESA95), plus net streams of interest
payments resulting from swaps arrangements and for-
ward rate agreements
LiabilitiesGovernment consolidated gross debt (“Maastricht
debt”)
six categories of liabilities:
– currency and deposits,
– securities other than shares,
– loans,
– shares and other equity,
– insurance technical reserves,
– other accounts, payable.
sum of government liabilities as defined in ESA95 in:
– currency and deposits,
– securities other than shares, excluding financial de-
rivatives and
– loans
outstanding at the end of the year, measured at nomi-
nal value and consolidated.
Statistical analysis 2
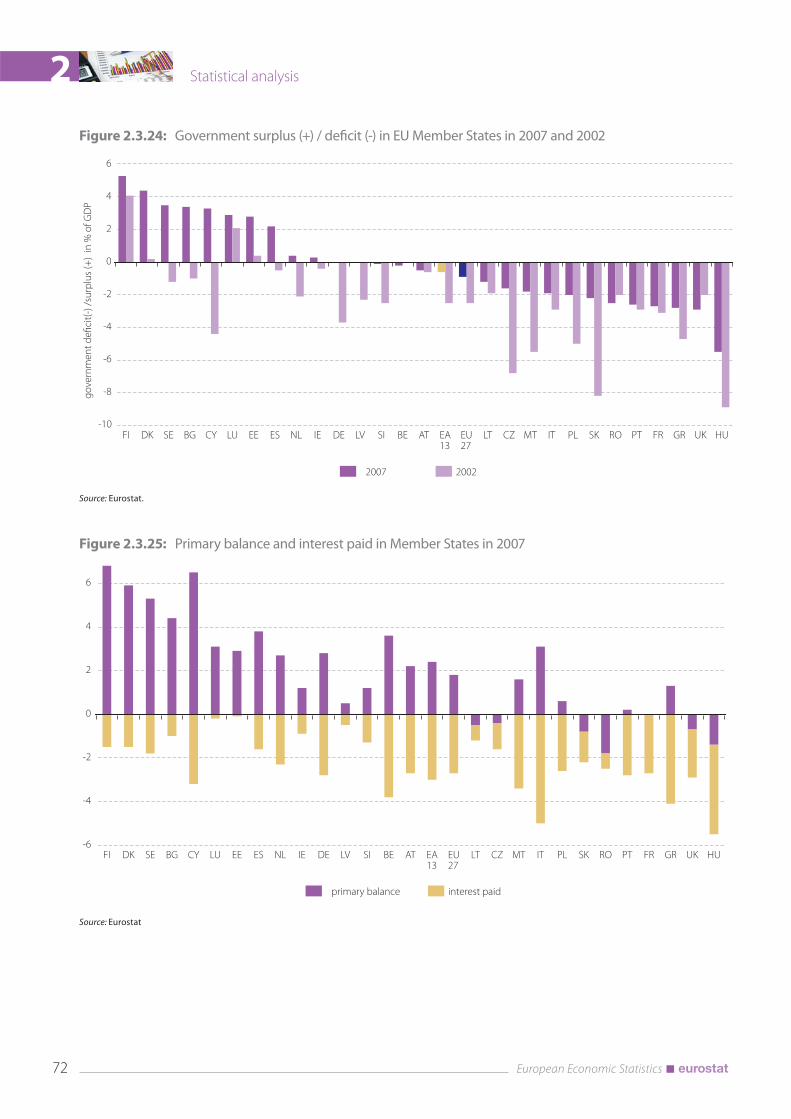
72 European Economic Statistics
Figure 2.3.24: Government surplus (+) / deficit (-) in EU Member States in 2007 and 2002
go
vern
me
nt
de
fici
t(-)
/su
rplu
s (+
) in
% o
f G
DP
-10
-8
-6
-4
-2
2
4
6
FI DK SE BG CY LU EE ES NL IE DE LV SI BE AT EA13
EU27
LT CZ MT IT PL SK RO PT FR GR UK HU
0
2007 2002
Source: Eurostat.
Figure 2.3.25: Primary balance and interest paid in Member States in 2007
primary balance interest paid
-6
-4
-2
0
2
4
6
FI DK SE BG CY LU EE ES NL IE DE LV SI BE AT EA13
EU27
LT CZ MT IT PL SK RO PT FR GR UK HU
Source: Eurostat
2 Statistical analysis

73 European Economic Statistics
The latest (2007) results can be broken down into two elements:
– primary government deficit/surplus,
– interest payable.
All Member States except Lithuania, Czech Republic, Slovak Republic, Romania, the United Kingdom and Hungary were able to cover all their government expenditure except interest on public debt from their revenues. In Bulgaria, Denmark, Spain, Cyprus, Finland and Sweden, the primary surplus was close to or above 4% of GDP, whereas the primary deficit in Hungary and Romania exceeded 1% of GDP.
For the assessment of the long-term sustainability of public finances, it is essential to measure the financial commitments the country will have to face in the future. Whilst this is largely determined by expected future cash flows, the starting point for governments is their accumulated commitments from the past, measured by convention as gross general government consolidated debt (“Maastricht debt”). In 2007, the highest levels of government debt in relation to GDP were recorded by Italy (104% of GDP), Greece (95%) and Belgium (85%). Hungary, Germany, France, Portugal and Malta also recorded government debt over 60% of GDP. Cyprus and Austria were just below the Maastricht debt threshold and above the EU weighted average debt (58.7% of GDP). Other Member States (Bulgaria, Czech Republic, Denmark, Baltic States, Ireland, Slovenia, Slovak Republic, Romania and Luxembourg) had much lower government debt to GDP ratios, close to or below 30%. In Estonia, Luxembourg and Romania, government debt was even below 10% of GDP.
Looking at the changes in government debt in relation to GDP between the years 2002 and 2007, 18 Member States were able to decrease or stabilize their debt levels, even though debt in absolute terms increased in almost all countries (the exceptions were Bulgaria, Denmark, Sweden and Spain). The most spectacular decrease was achieved by Bulgaria which, mostly due to a high increase in nominal GDP over the period, reduced its debt by 35 percentage points (pp) of GDP. Falls of over 10 per-centage points in government debt were seen in Denmark (22pp), Belgium (19pp), Spain (16pp), the Slovak Republic (14pp), Sweden (13pp) and Romania (12pp). Rises of 5 percentage points or more in the ratio of government debt as a proportion of GDP were observed in Germany, France, United Kingdom, Portugal and Hungary; on the other hand, smaller increases (no more than 3pp) were recorded in Poland, Malta, Luxembourg and Czech Republic.
In Norway, government debt at end-2006 was at 48.9%, almost 13 percentage points higher than in 2002, in spite of running large surpluses in all years. This situation is explained by operations of the “Pension fund global” (oil fund) in short-term loans.
While the government deficit/surplus in countries normally explains most of the change in government debt, there are also other contributing factors. The difference between the change in government debt and the government deficit/surplus for a given period is called the “stock-flow adjustment”. The stock-flow adjustment is made up of 15 different elements incorpo-rating the main groups: “net acquisition of financial assets” including financial transactions which are not contributing to the deficit but only to the change in debt, “net incurrence of liabilities in financial derivatives and other liabilities”, which are those liabilities excluded from the Maastricht debt, and a third group relating to effects of face valuation, appreciation/depreciation of foreign currency debt, other changes in volume (such as reclassification of units outside or inside govern-ment, etc) and statistical discrepancies, reflecting differences arising from the diversity of data sources39.
39 Eurostat publishes a twice yearly note on the stock-flow adjustment in government accounts in the context of the latest reporting of data in the framework of the excessive deficit procedure.
Statistical analysis 2

74 European Economic Statistics
Figure 2.3.26: Public debt at end-2007 and end-2002
in %
of
GD
P
0
20
40
60
80
100
120
IT GR BE EA13 HU DE FR PT MT CY AT EU27 NL PL UK SE ES FI SK CZ DK IE SI BG LT RO LV LU EE
2007 2002
Source: Eurostat
Most EU Member State governments finance themselves through the issue of securities other than shares, e.g. government bonds, treasury bills, etc, rather than through direct loans. In 2007, securities other than shares made up over 80% of EU and euro area government debt, whereas loans accounted for just above 15%. Additionally, governments tend to rely on long-term financing (maturity over one year) rather than on short-term financing, by a factor of around 10 to one.
Luxembourg is the only EU Member State that has not reported any debt securities at all in the structure of its government debt at end-2007. Other Member States that rely more on loans than debt securities are Estonia (76% of total government consolidated gross debt) and Romania (56%). In Bulgaria, Germany, Latvia and Cyprus, the share of loans in government debt is also relatively high (over 20%).
The share of currency and deposits in government debt in the EU is just below 5% and in euro area it is even smaller (3.3%). However, for some EU Member States, the share of this item is above 10%: in the United Kingdom and Ireland it accounted for over 16%, in Portugal 13%, whereas in Italy and Romania it reached 9% of total government debt in 2007.
In Norway, government debt was composed at end-2006 only of securities other than shares (24%, of which almost four fifths were long-term securities) and short-term loans (76%).
2 Statistical analysis

75 European Economic Statistics
Figure 2.3.27: Composition of government consolidated gross debt at end-2007
Currency and deposits Short-term securities other than shares* Long-term securities other than shares*
Short-term loans Long-term loans
% o
f to
tal
0%
20%
40%
60%
80%
100%
EU27
EA13
BE BG CZ DK DE EE IE GR ES FR IT CY LV LT LU HU MT NL AT PL PT RO SI SK FI SE UK
Source: Eurostat. *Securities other than shares exclude financial derivatives.
Statistical analysis 2

76 European Economic Statistics
2.4 Inflation, interest rates and exchange rates
Introduction
The Harmonised Indices of Consumer Prices (HICPs) provide the best measure for international comparisons of con-sumer price inflation in the EU and the euro area, and for assessing price convergence and stability in the context of monetary policy analysis. Annual average inflation for the euro area in the period 2000–2007 was relatively stable around the level of 2.2% and stood at 2.1% for 2007. In the EU as a whole, annual average inflation in 2007 stood at 2.3%, its highest level since 2000.
Long-term interest rates are a convergence criterion for European monetary union. Following the market turmoil that began in summer 2007 and central banks’ interventions to safeguard liquidity, the Maastricht criterion interest rates in the euro area decreased from 4.60% in July 2007 to 4.06% in March 2008.
Money market rates, also known as inter-bank rates, are interest rates used by banks for operations among themselves. In general the rates decreased between 2000 and 2004. Later, this important benchmark for short-term interest rates increased continuously and in December 2007 reached 4.85%.
The introduction of the euro eliminated exchange rates between an increasing number of EU Member States. In contrast to the moderate fluctuations between the majority of European currencies, the value of the euro increased against the cur-rencies of important trading partners between 2002 and 2007: the Swiss franc (+12.0%), the Japanese yen (+36.6%) and the US dollar (+44.9%).
2.4.1 Trends in consumer price inflation 2000–2007
Consumer price indices have a variety of potential uses, for example in indexing social benefits or contracts and as inputs into various types of economic analysis. The Harmonised Indices of Consumer Prices (HICPs) have been set up to provide the best measure for international comparisons of consumer price inflation in the EU and the euro area and for assessing price convergence and stability in monetary policy analysis. Since 1999, when the euro area was created, the European Cen-tral Bank’s main focus of interest has been assessing price stability in the euro area. Figure 2.4.1 shows that the Euro area annual average inflation varied around 2.2% during the period 2000-2007.
Figure 2.4.1: EU and euro area – HICP all-items, annual average inflation rates (in %)
European Union (EU) Euro area (EA)
1.8
1.9
2.0
2.1
2.2
2.3
2.4
2000 2001 2002 2003 2004 2005 2006 2007
2 Statistical analysis

77 European Economic Statistics
Annual average inflation for the euro area in the period 2000–2007 was relatively stable at a level of around 2.2%. The high-est value, 2.3%, was observed in 2001, compared with 2.1% in 2000. In 2003-2004 inflation fell to 2.1%, and then it rose to 2.2% for two consecutive years. In 2007, annual average inflation declined again to 2.1%.
In 2001, extraordinary inflation rates were recorded for food at 5.0%. This was significantly above the price increases meas-ured for these products in 2000 or between 2002 and 2007. These price increases in 2001 might be explained by the out-breaks of BSE and foot-and-mouth disease. Other main components with high annual average rates for the euro area in 2001 were restaurants and hotels (3.4%), miscellaneous goods and services (3.1%), and education (3.0%).
In 2007, the three main headings with the highest weights in household final monetary consumption expenditure for the euro area showed annual average rates above the overall inflation rate of 2.1%. These headings are food, housing (with rates of 2.7% each) and transport (2.4%). Other components with upward impacts on inflation were education (7.8%), alcohol and tobacco (3.4%), restaurants and hotels (3.2%), and ‘miscellaneous’ (2.3%). Downward impacts on overall inflation in the euro area came from communications (-1.9%), recreation and culture (0.2%), clothing (1.0%), household equipment and health (1.7% each).
Figure 2.4.2: Euro area - HICP main headings, annual average inflation rates (in %)
2.32.1
5.02.7
2.83.4
0.41.0
2.92.7
1.81.7
1.21.7
1.22.4
-4.1-1.9
1.40.2
3.07.8
3.43.2
3.12.3
-6 -4 -2 0 2 4 6 8 10
All-items
Food
Alcohol and tobacco
Clothing
Housing
Household equipment
Health
Transport
Communications
Recreation and culture
Education
Restaurants and hotels
Miscellaneous
2001 2007
In the EU as a whole, annual average inflation in 2007 was at its highest level since 2000. It had been below euro area infla-tion until 2004. Then in 2005 and 2006 both country groups showed the same annual average inflation rates and in 2007 EU inflation was higher than that in the euro area.
In 2000, when the inflation measured in the European Union was 1.9% and the EU had 15 Member States, the low-est annual average inflation rates were recorded for the United Kingdom (0.8%), Sweden (1.3%) and Germany (1.4%). The main headings with low rates in 2000 in the European Union were communications (-6.8%), clothing
Statistical analysis 2

78 European Economic Statistics
(-0.5%) and recreation and culture (0.1%), and those with the highest rates were transport (4.8%), education (3.8%) and housing (3.6%).
Figure 2.4.3: EU - HICP main headings, annual average inflation rates (in %)
2000 2007
HICP all-items
Food
Alcohol and tobacco
Clothing
Housing
Household equipment
Health
Transport
Communications
Recreation and culture
Education
Restaurants and hotels
Miscellaneous
1.92.3
1.03.5
2.73.8
-0.50.1
3.63.3
0.61.6
1.92.2
4.82.5
-6.8-2.0
0.1-0.1
3.88.6
2.93.4
2.12.3
-8 -6 -4 -2 0 2 4 6 8 10
In 2007, the seven highest annual average inflation rates among the 27 EU Member States were those of countries that had joined the EU in 2004 or 2007. The highest rate was recorded by Latvia (10.1%), followed by Hungary (7.9%) and Bul-garia (7.6%); the lowest rates were for Malta (0.7%), France, the Netherlands and Finland (1.6% each). The main headings with the highest annual average rates were education (8.6%), alcohol and tobacco (3.8%), food (3.5%), and restaurants and hotels (3.4%).
2 Statistical analysis

79 European Economic Statistics
Figure 2.4.4: HICP all-items, annual average inflation rates (in %), 2007
0
2
4
6
8
10
12
0.7
1.6 1.6 1.6 1.7 1.7 1.8 1.9 2.0 2.1 2.2 2.2 2.3 2.3 2.3 2.4 2.6 2.7 2.8 2.9 3.0 3.0
3.8
4.9
5.8
6.7
7.67.9
10.1
Malt
a
Fran
ce
Netherla
nds
Finlan
d
Denmar
k
Sweden
Belgiu
m
Slova
kia Italy
euro ar
ea
Cypru
s
Austria
German
y
United K
ingdom EU
Portugal
Poland
Luxe
mbourg
Spain
Irelan
d
Czech
Republic
Greece
Slove
nia
Roman
ia
Lithuan
ia
Estonia
Bulgar
ia
Hungary
Latv
ia
Looking at annual average inflation rates for all EU Member States during the period 2000–2007 and at the countries with the highest weights in the European Union (see information in Box 2.4.3), the highest inflation rates were those in Spain (3.6%) in 2002 and 2006 and the lowest in the United Kingdom (0.8%) in 2000.
Permanent versus transitory price changes
There are many prices that substantially affect the overall index and that may quickly reverse, so that such changes are transitory and volatile. Experts are always trying to construct inflation measures to be independent of these effects (short-term changes in energy prices, fresh fruit and vegetables) but to reflect that part of inflation caused by monetary effects or permanent price changes.
Special aggregates enable detection of the factors responsible for certain behaviours of inflation rates. In order to facilitate medium-term decisions by the European Central Bank, Eurostat releases a series of special aggregates, including:
– HICP all items excluding energy;– HICP all items excluding energy, food, alcohol and tobacco;– HICP all items excluding energy and unprocessed food;– HICP all items excluding energy and seasonal food;– HICP all items excluding tobacco;– Energy– Food, alcohol and tobacco.
When price changes are measured excluding energy, inflation rates in the EU turn out to be more volatile. In fact, the im-pact of changes in energy prices had a rather high upward impact on overall inflation in 2000, 2005 and 2006 ranging from 0.6 to 0.9 percentage points. This was due to inflation rates for energy of between 8% and 12% in these three years. In 2003 and 2004, inflation measured excluding energy was 1.8% and thus 0.2 percentage points below the headline HICP inflation rate. Only in 2002 did falling energy prices have a downward impact of 0.2 percentage points on overall inflation; in 2001 the impact of energy prices on all-items inflation was neutral.
Apart from energy prices, food40 prices were also more volatile than overall inflation. Increases in food prices had a substan-tial upward impact on headline inflation in the EU in 2001 and this phenomenon returned in 2006 with an upward impact of 0.3 percentage points in 2007.
40 including alcohol and tobacco
Statistical analysis 2

80 European Economic Statistics
Figure 2.4.5: EU - HICP all items & special aggregates, annual average inflation rates (in %)
HICP all-items HICP all items excluding energy
HICP all items excluding energy, food, alcohol and tobacco
2000 2001 2002 2003 2004 2005 2006 20070.5
1.0
1.5
2.0
2.5
BOX 2.4.1: CHANGING COMPOSITION OF COUNTRY AGGREGATES
The euro area HICP aggregate is compiled as a weighted average for the countries in the euro area. The country weights
are derived from national accounts data for household final monetary consumption expenditure (HFMCE), naturally
expressed in euro. The index is computed as an annual chain index allowing country weights to change each year and,
consequently, new Member States to be added as they join the euro area.
For the EU and EEA HICP aggregates, the euro area is treated as a single entity to which data for the other countries
is then added (the weights again use national accounts data, converted into purchasing power standards). Note that
for the EU enlargement in May 2004 chain-linking was also added in May to maintain the correct country coverage for
both the EU and EEA aggregates.
2 Statistical analysis

81 European Economic Statistics
BOX 2.4.2: HOUSEHOLD CONSUMPTION PATTERNS
The consumption patterns of households determine the relative importance (weight) of household monetary expendi-
ture that is attached to each of the categories of goods and services covered by the HICP. The impact on the all-items
index of any price change is proportional to the size of the corresponding weight. There is no uniform basket applying
to all Member States. The structure of the weights may vary considerably between the HICPs for individual Member
States as well as between the HICP for an individual Member State and the average weighting structure according to
the EU or the euro area. The HICP is computed as an annual chain-index, allowing weights to change each year.
In 2007, the three main headings food, housing and transport, each accounting for around 15% of consumption ex-
penditure, were those with the largest weights in both country groups: the EU and the euro area. A weight of around
one tenth is attached to recreation and culture, though it is a little more important for the whole EU than for the euro
area. Only just below are the weights for restaurants and hotels, which again are slightly higher for the EU.
Within the national HICPs the weight for food varies between 10–12% (the United Kingdom, Luxembourg, Germany
and Austria) and 36% (Romania). The share for transport in HFMCE ranges from 8–12% (Romania, Lithuania and Latvia)
to 19–22% (Slovenia, Portugal and Luxembourg). Consumption expenditure on recreation and culture ranges from 5%
(Romania, Portugal and Greece) to 12–15% (Sweden and the United Kingdom). The weight for housing ranges from
9% (Malta, Cyprus, Greece and Luxembourg) to 19–23% (Romania, Germany, Slovakia and Poland). In the housing cat-
egory, it should be noted that HICPs reflect only monetary expenditure; unlike national accounts or household budget
surveys, they do not cover services provided by owner occupied dwellings. This means that countries in which a larger
proportion of the population lives in rented dwellings tend to have a larger weight for housing than countries in which
a larger proportion of households live in their own dwellings.
Figure 2.4.6: Share of HICP main headings in HFMCE, 2007
0%
10%
20%
30%
40%
50%
60%
70%
80%
90%
100%
Food All items, excluding Food and Transport Transport
EU
euro ar
ea
Belgiu
m
Bulgar
ia
Czech
Republic
Denmar
k
German
y
Estonia
Irelan
d
Greece
Spain
Fran
ceIta
ly
Cypru
s
Latv
ia
Lithuan
ia
Luxe
mbourg
Hungary
Malt
a
Netherla
nds
Austria
Poland
Portugal
Rouman
ia
Slove
nia
Slova
kia
Finlan
d
Sweden
United K
ingdom
Statistical analysis 2
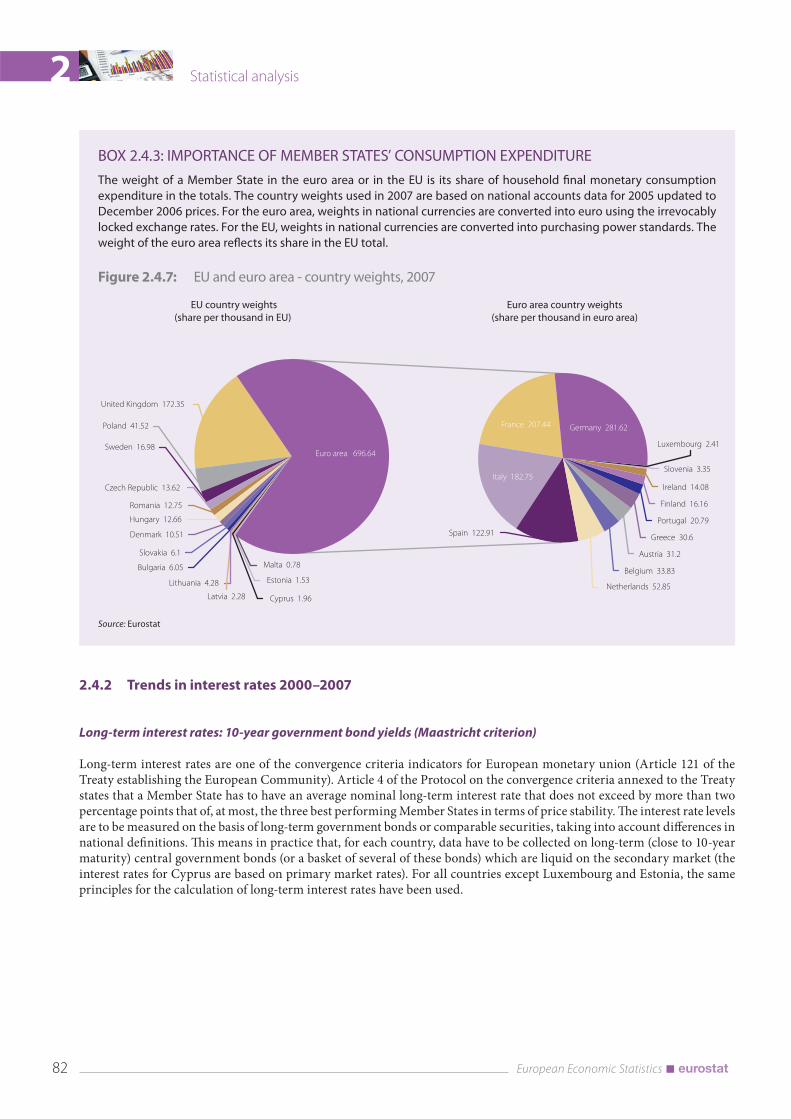
82 European Economic Statistics
BOX 2.4.3: IMPORTANCE OF MEMBER STATES’ CONSUMPTION EXPENDITURE
The weight of a Member State in the euro area or in the EU is its share of household final monetary consumption
expenditure in the totals. The country weights used in 2007 are based on national accounts data for 2005 updated to
December 2006 prices. For the euro area, weights in national currencies are converted into euro using the irrevocably
locked exchange rates. For the EU, weights in national currencies are converted into purchasing power standards. The
weight of the euro area reflects its share in the EU total.
Figure 2.4.7: EU and euro area - country weights, 2007
EU country weights
(share per thousand in EU)
Euro area country weights
(share per thousand in euro area)
Bulgaria 6.05
Lithuania 4.28
Latvia 2.28 Cyprus 1.96
Estonia 1.53
Malta 0.78
Slovakia 6.1
Denmark 10.51
Hungary 12.66
Romania 12.75
Czech Republic 13.62
Sweden 16.98
United Kingdom 172.35
Poland 41.52
Euro area 696.64
Germany 281.62France 207.44
Italy 182.75Slovenia 3.35
Ireland 14.08
Finland 16.16
Portugal 20.79
Greece 30.6
Austria 31.2
Belgium 33.83
Netherlands 52.85
Luxembourg 2.41
Spain 122.91
Source: Eurostat
2.4.2 Trends in interest rates 2000–2007
Long-term interest rates: 10-year government bond yields (Maastricht criterion)
Long-term interest rates are one of the convergence criteria indicators for European monetary union (Article 121 of the Treaty establishing the European Community). Article 4 of the Protocol on the convergence criteria annexed to the Treaty states that a Member State has to have an average nominal long-term interest rate that does not exceed by more than two percentage points that of, at most, the three best performing Member States in terms of price stability. The interest rate levels are to be measured on the basis of long-term government bonds or comparable securities, taking into account differences in national definitions. This means in practice that, for each country, data have to be collected on long-term (close to 10-year maturity) central government bonds (or a basket of several of these bonds) which are liquid on the secondary market (the interest rates for Cyprus are based on primary market rates). For all countries except Luxembourg and Estonia, the same principles for the calculation of long-term interest rates have been used.
2 Statistical analysis

83 European Economic Statistics
Long-term interest rates in the EU still vary across countries
In 2007, the gap between EU Member States’ rates remained significant. The lowest rates were recorded for Sweden (4.17%), Germany (4.22%) and the Czech Republic (4.28%), while the highest rates were found in Romania (7.15%) and Hungary (6.74%).
Figure 2.4.8: Maastricht criterion rates, annual average for 2007
3.0
3.5
4.0
4.5
5.0
5.5
6.0
6.5
7.0
7.5
4.17 4.22 4.28 4.29 4.29 4.29 4.29 4.3 4.31 4.31 4.334.42 4.48 4.49 4.49 4.5 4.52 4.54 4.55 4.56 4.58
4.72
5.06
5.28
5.48
5.69
6.74
7.15
Sweden
German
y
Czech
Republic
Austria
Denmar
k
Finlan
d
Netherla
nds
Fran
ce
Irelan
dSp
ain
Belgiu
m
Portugal
Cypru
sIta
ly
Slova
kia
Greece
Slove
nia
Bulgar
ia
Lithuan
ia
Luxe
mbourg
EU
Malt
a
United K
ingdom
Latv
ia
Poland
Estonia
Hungary
Roman
ia
Source: Eurostat, Economy and finance, Interest rates, Long term interest rates, Maastricht criterion interest rates (ECB).
Annex Table 4.27 shows changes in long-term interest rates for EU Member States, EU aggregates, the euro area and for some OECD countries. In 2000 and 2001 long-term interest rates were higher than in subsequent years. The lowest rate in 2001 was recorded for Germany (4.80%). EU and US 10-year government bond yields both stood at 5%. The highest value was recorded for Poland in 2001 (10.68%).Between 2000 and 2005, long-term interest rates decreased significantly in the euro area, by 202 basis points, to 3.42%. The lowest rate in 2005 was recorded for Ireland (3.33%), the highest in Hungary (6.60%).In 2006 and 2007 increasing long-term interest rates were reported by most of the Member States providing data, with the exception of Cyprus, Malta, the UK and Hungary. Following the market turmoil that began in summer 2007 and central banks’ interventions to safeguard liquidity, the Maastricht criterion interest rates in the euro area decreased from 4.60% in July 2007 to 4.06% in March 2008.
Statistical analysis 2

84 European Economic Statistics
Figure 2.4.9: Long term interest rates - euro area, US and Japan (annual average)
Euro area United States Japan
0
1
2
3
4
5
6
7
2000 2001 2002 2003 2004 2005 2006 2007
In 2007 annual average long term government bond yields stood at 4.32% in the euro area, 4.63% in the US and 1.68% in Japan.
Short-term rates: three-month money market rates (three-month EURIBOR)
Money market rates, also known as inter-bank rates, are interest rates used by banks for operations among themselves. In the money market, banks are able to trade their surpluses and deficits.
Annex Table 4.28 shows the change in three-month money market interest rates in the euro area (EURIBOR) and in other Member States that had not adopted the euro before 2007. For the period 2000 to 2007, to provide a global picture, data is given for the US and Japan.
In 2000 the three-month money market interest rates in the euro area, the US and Japan were higher than in subsequent years. The lowest rates were recorded for Sweden (4.06%) and the euro area (4.39%), the highest for Romania (50.71%) and Poland (18.77%).
In general the rates decreased between 2000 and 2004. In the euro area the three-month EURIBOR fell by 228 basis points to 2.11% in 2004 and remained below 2.20% until September 2005. Later this important benchmark for short-term interest rates rose continuously and in December 2007 reached 4.85%.
The lowest annual rates in 2007 were noted in the Czech Republic (3.10%) and in Sweden (3.89%), the highest in Latvia (8.68%) and in Hungary (7.86%).
2 Statistical analysis

85 European Economic Statistics
Figure 2.4.10: 3-month money market rates in the euro area, the US and Japan
Euro area United States Japan
0
1
2
3
4
5
6
7
2000 2001 2002 2003 2004 2005 2006 2007
In 2007, the three-month EURIBOR was 4.28%. The relevant short-term rate in the United States was 5.30% and in Japan only 0.79%.
The increase in three-month money market rates between 2005 and 2007 was a global phenomenon, not limited to the euro area (+209 basis points). It was felt in all the Member States outside the euro area with the exception of Cyprus, Poland and Romania.
However, in the United States three-month money market rates followed a slightly different pattern. Only the lowest rate was recorded for both in March 2004 (euro area 2.03%, US 1.11%). After that, US money market interest rates increased continuously — exceeding the euro area level in November 2004 — to 5.50% in July 2006. In that time the three-month EURIBOR rose only to 3.10%. However, the gap of 240 basis points closed in subsequent months. Since January 2008, US short-term interest rates have been lower than those of euro area.
On a global scale, Japanese interest rates were always the lowest. Japanese three-month interest rates remained below 0.1% until March 2006. Since then Japanese rates have increased significantly. However, even in December 2007 three-month interest rates were below 1%, which was still a moderate rate compared with European countries (lowest level in December 2007 in the Czech Republic (4.05%) and Slovakia (4.31%). In the euro area the three-month EURIBOR was 4.85% and in the US three-month interest rates stood at 4.97%.
In December 2007 the highest three-month interest rates were observed in Latvia (10.78%), Romania (7.93%) and Hungary (7.63%).
2.4.3 Trends in euro exchange rate developments 2000–2007
Exchange rate developments were less relevant in the last decade. The introduction of the euro eliminated exchange rates between an increasing number of EU Member States. At the outset, in 1999, the euro area covered 11 Member States (BE, DE, IE, ES, FR, IT, LU, NL, AT, PT, FI). Later several other Member States joined: Greece (2000), Slovenia (2007) and Cyprus and Malta (2008). In addition, many other European currencies have remained stable against the euro in recent years.
Especially in relation to two of the currencies of Member States that have not joined the euro area since its creation, the Swedish krona and the Danish krone, the euro maintained a reasonably stable exchange rate. However, taking into account recent de-velopments the euro appreciated significantly against the pound sterling, by 17.1% by the end of March 2008 (year-on-year).
Statistical analysis 2

86 European Economic Statistics
A small number of currencies appreciated against the euro during the period 2004–2007, measured by the annual average exchange rates in 2007 as against 2004 (see Annex Table 4.29). The most significant gains were for the Rumanian leu (17.7%), the Polish zloty (16.4%), the Slovak koruna (15.6%) and the Czech koruna (12.9%).
In contrast to the moderate fluctuations between the majority of European currencies, the value of the euro increased against the following currencies of important trading partners between 2002 and 2007: the Swiss franc (+ 12.0%), the Japanese yen (+36.6%) and the US dollar (+ 44.9%). At the end of March 2008 the value of the euro stood at USD 1.5812, i.e. +18.7% year-on-year.
Fluctuations upward and downward since 2000 against the euro were exceptional. They occurred for the Hungarian forint and the Icelandic koruna.
Figure 2.4.11: Euro exchange rates vs. US-Dollar and Yen
Yen (Japan) United States Dollar
2000 2001 2002 2003 2004 2005 2006 20070.8
1.2
1.0
1.4
1.6
1.8
2 Statistical analysis

87 European Economic Statistics
2.5 External dimension of the economy
2.5.1 Introduction
The EU has a common trade policy (known as the Common Commercial Policy). In other words, wherever trade issues, including issues related to the World Trade Organisation (WTO), are concerned, the EU acts as a single entity. In these cases, the European Commission negotiates trade agreements and represents Europe’s interests on behalf of the Union’s 27 Member States. The EC Treaty establishes the overall aims and objectives of EU trade policy: Article 2 sets the general aims, including promoting the development of economic activities, high employment and competitiveness, and environ-mental protection. Articles 131 explains how the common commercial policy must operate in principle: “to contribute, in the common interest, to the harmonious development of world trade, the progressive abolition of restrictions on interna-tional trade and the lowering of customs barriers”. Article 133 sets out the scope, instruments and decision-making pro-cedures. Article 300 establishes the current inter-institutional procedure for the conclusion of international agreements, principally by the Council.
The EU’s external trade policy contributes to Europe’s competitiveness in foreign markets. Being an open economy, the EU’s aim is to secure improved market access for its industries, services and investments, as well as to enforce the rules of free and fair trade. A coordinated foreign trade policy takes on even greater importance in an era of globalisation, when economies and borders are opening up, leading to an increase in trade and capital movements, and the spread of informa-tion, knowledge and technology, and involving a process of deregulation. The economic impacts of globalisation on the EU are obviously felt through trade in goods and services, financial flows ranging from foreign direct investment to more short-term forms, such as portfolio investment, as well as the movement of persons linked to cross-border economic activ-ity, ranging from workers’ remittances to the provision of services.
Globalisation becomes noticeable when it is measured by actual trade flows. According to World Development Indicators (published by the World Bank) trade grew, on average, almost twice as fast as GDP between 1990 and 2006. Global trade is expected to hit about US$ 16 trillion in 2007, equal to 31% of world GDP. At the same time, stocks of foreign direct invest-ment grew almost five times as fast as world GDP. The domestic sales of foreign affiliates are larger than world exports and are critically reliant on trade in intermediate goods, further underscoring the importance of the integration of trade in modern economic activity.
Within the EU, there are two main sources of statistics on international trade. One is external trade statistics (ETS), which provide information on trade in merchandise goods, collected on the basis of customs and VAT declarations. ETS pro-vide highly detailed information on the value and volumes (quantity) of international trade in goods as regards the type of commodity. The second main source is balance-of-payments statistics (BoP), which register all the transactions of an economy with the rest of the world. The purpose of this chapter is to give an overview of the EU’s trade in merchandise goods (within the ETS framework), as well as its trade in services, current account, and foreign direct investments (within the BoP framework).
2.5.2 Trade in goods
The European Union is one of the major players in international trade, accounting for about one fifth of world trade in goods; it is the world’s biggest exporter and its second biggest importer after the USA. The trade balance for EU27 has been persistently negative over recent years, with deficits rising from €45 bn in 2002 to €192 bn in 2006, and then falling back to €186 bn in 2007. However, the USA is the biggest net importer, with a trade deficit of about €700 bn in 2006, while the other main traders, China, Japan and Canada, recorded a surplus.
Statistical analysis 2

88 European Economic Statistics
Figure 2.5.1: Main world traders: exports, imports and trade balance, 2006 (EUR bn)
0
250
-250
-500
-750
500
750
1000
1250
1500
EU-27 USA China (1) Japan Canada
Exports Imports Balance
Source: Comtrade, Eurostat (EU27) (1) Excluding Hong Kong
An analysis by product can be made at aggregated level by using the first digit (section) of the Standard International Trade Classification (SITC). The EU’s main exports in 2007 were in Machinery & vehicles (SITC 7), Other manufactured articles (SITC 6+8) and Chemicals (SITC 5), while the main imports were Machinery & vehicles, Other manufactured articles and Energy products (SITC 3). The EU had a €130 bn surplus in the trade of Machinery & vehicles - a sector which showed a clear comparative advantage in international trade. The EU surplus in the trade in Chemicals amounted to €77 bn. In con-trast, the EU was a net importer of fossil fuels and it had a €270 bn deficit in the trade in Energy products in 2007, reflecting the EU’s comparative disadvantage in this sector.
Figure 2.5.2: EU27 imports, exports and balance, by SITC-1 product group, 2007 (EUR Bn)
-300 -100 0 100 300 500
Food products
Crude materials
Energy products
Chemical products
Other manufactured products
Machinery & vehicles
Exports Imports Balance
2 Statistical analysis
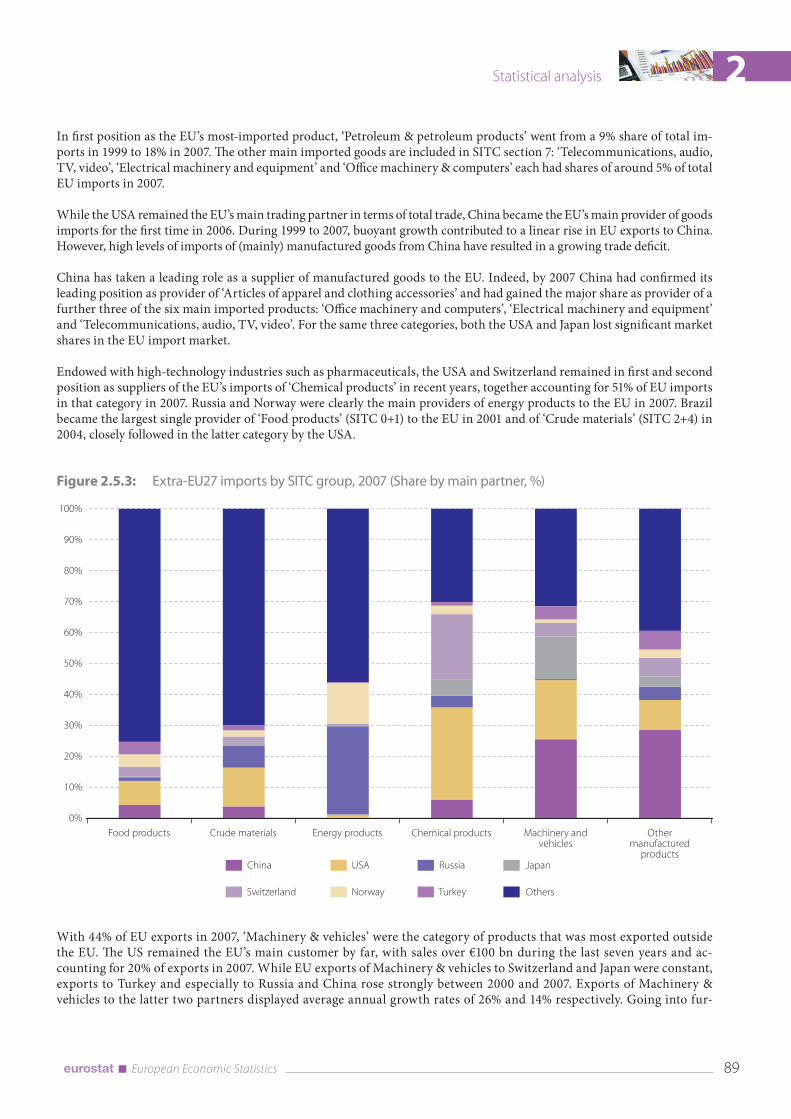
89 European Economic Statistics
In first position as the EU’s most-imported product, ‘Petroleum & petroleum products’ went from a 9% share of total im-ports in 1999 to 18% in 2007. The other main imported goods are included in SITC section 7: ‘Telecommunications, audio, TV, video’, ‘Electrical machinery and equipment’ and ‘Office machinery & computers’ each had shares of around 5% of total EU imports in 2007.
While the USA remained the EU’s main trading partner in terms of total trade, China became the EU’s main provider of goods imports for the first time in 2006. During 1999 to 2007, buoyant growth contributed to a linear rise in EU exports to China. However, high levels of imports of (mainly) manufactured goods from China have resulted in a growing trade deficit.
China has taken a leading role as a supplier of manufactured goods to the EU. Indeed, by 2007 China had confirmed its leading position as provider of ‘Articles of apparel and clothing accessories’ and had gained the major share as provider of a further three of the six main imported products: ‘Office machinery and computers’, ‘Electrical machinery and equipment’ and ‘Telecommunications, audio, TV, video’. For the same three categories, both the USA and Japan lost significant market shares in the EU import market.
Endowed with high-technology industries such as pharmaceuticals, the USA and Switzerland remained in first and second position as suppliers of the EU’s imports of ‘Chemical products’ in recent years, together accounting for 51% of EU imports in that category in 2007. Russia and Norway were clearly the main providers of energy products to the EU in 2007. Brazil became the largest single provider of ‘Food products’ (SITC 0+1) to the EU in 2001 and of ‘Crude materials’ (SITC 2+4) in 2004, closely followed in the latter category by the USA.
Figure 2.5.3: Extra-EU27 imports by SITC group, 2007 (Share by main partner, %)
0%
10%
20%
30%
40%
50%
60%
70%
80%
90%
100%
21.6 21.8 21.7 21.4 21.2
Food products Crude materials Energy products Chemical products Machinery andvehicles
Othermanufactured
products
OthersTurkeyNorwaySwitzerland
JapanRussiaUSAChina
With 44% of EU exports in 2007, ‘Machinery & vehicles’ were the category of products that was most exported outside the EU. The US remained the EU’s main customer by far, with sales over €100 bn during the last seven years and ac-counting for 20% of exports in 2007. While EU exports of Machinery & vehicles to Switzerland and Japan were constant, exports to Turkey and especially to Russia and China rose strongly between 2000 and 2007. Exports of Machinery & vehicles to the latter two partners displayed average annual growth rates of 26% and 14% respectively. Going into fur-
Statistical analysis 2

90 European Economic Statistics
ther detail, the most exported products in the SITC 7 section in 2007 were ‘Road vehicles’, ‘General-purpose industrial machinery’’ and Electrical machinery and equipment’ , while the most exported chemical products were the ‘Medicinal and pharmaceutical products’.
Making up 25% of EU exports in 2007, exports of ‘Other manufactured products’ to the EU’s top ten partners (mainly ‘Iron and steel’, ‘Professional, scientific and controlling instruments and apparatus’ and ‘Non-metallic mineral manufactures’) rose in all cases between 2000 and 2007, with the exception of the USA and Japan. The USA and Switzerland remained first and second respectively as the EU’s main export destinations in this product category, while sales to Russia and China grew at impressive annual rates of 19% and 18% respectively. Exports of Chemical products displayed robust growth throughout the same period, accounting for just under 16% of total EU exports in 2007, while around 50% of all Chemical product exports went to the USA, Switzerland, Russia and Turkey. While the USA developed its position as the leading destination for exports of Chemical products from the EU, with 28% of the total in 2007, exports to Russia and China grew strongly between 2000 and 2007, at annual rates of 21% and 17% respectively. In 2007, a large share of Energy exports went to the USA (29%), followed by Switzerland (8%), while China purchased the most of EU Crude materials exports (17%), followed by the USA (10%). Despite a period of stagnation in 2003 and 2004, exports of Food products grew over the entire period between 2000 and 2007. For this category the USA remained the EU27’s main export partner; over the same period, EU27 exports to China rose by 15% and to Russia by 13%, making Russia the destination of 11% of EU27 Food exports in 2007 and thus the EU27’s second-main partner for this product.
Figure 2.5.4: Extra-EU27 exports by SITC group, 2007 (Share by main partner, %)
0%
10%
20%
30%
40%
50%
60%
70%
80%
90%
100%
21.8 21.7 21.2
Food products Crude materials Energy products Chemical products Machinery andvehicles
Othermanufactured
products
OthersTurkeyNorwaySwitzerland
JapanRussiaUSAChina
Considering the extra-EU trade by individual Member State, Germany is the biggest trader in terms of both exports and imports, with a share of 27.5% and 18.8% respectively in 2007. The other biggest EU exporters are Italy, France and United Kingdom, with shares above 10% (but declining) over the entire period 2000-2007. In extra-EU imports, Germany is fol-lowed by United Kingdom, the Netherlands, Italy and France, with shares in 2007 ranging from 15% to 10%. However, imports into the Netherlands, and therefore its trade deficit, are over-estimated because of the so-called ‘Rotterdam effect’: that is goods bound for other EU countries arrive in Dutch ports and, according to Community rules, are recorded as extra-EU imports by the Netherlands (the country where goods are released for free circulation).
2 Statistical analysis

91 European Economic Statistics
Close to two thirds of the EU’s total external trade was carried out within the Union in 2007. The weight of intra-EU trade (dispatches plus arrivals) measured as a percentage of the individual Member States’ total trade ranged between 83% in the Czech Republic and 56% in the United Kingdom. The growth rates of imports and exports were slightly below the annual average growth rates displayed by intra-EU arrivals (5.8%) and dispatches (5.6%) over the period 2000-2007, reflecting the growing expansion of the EU internal market. Throughout, the share of intra-EU dispatches in total exports was higher than that of intra-EU arrivals in total imports; in 2007 these shares were 68.1% and 64.3% respectively. Dispatches are shown broken down by main exporting Member State, as well as by SITC-1 product group. With shares similar to those in total extra-EU exports, ‘Machinery & vehicles’ and ‘Other manufactured products’ together made up about two thirds of intra-EU dispatches in 2007.
Figure 2.5.5: Intra-EU27 dispatches by main declaring Member State, 2007 (%)
Figure 2.5.6: Intra-EU27 dispatches by SITC-1 product group, 2007 (%)
Energy producrs6%
Crude materials
3%
Food products8%
Other manufactured
products 28%
Machinery andvehicles
39%
Products n.e.s.1%
Chemicalproducts
15% Netherlands
12%
Germany 24%
Other18%
New MS 12 *12%
United Kingdom7%
Italy8%
France 10%
Belgium9%
* ‘New MS 12’ = Member States that joined the EU in the 2004 and 2007 enlargements
BOX 2.5.1: TRADE IN GOODS – INTRASTAT VS. EXTRASTAT
External trade statistics measure the value and quantity of goods traded between the Member States of the European
Union (Intrastat) as well as between Member States and third countries (Extrastat). Community legislation ensures that
the statistics provided to Eurostat are based on specific legal texts, and on definitions and procedures which, to a large
extent, have been harmonised.
Statistical information on extra-EU trade in goods is provided by declaring parties when completing the customs for-
malities, and is then collected by the Member States from the statistical copy of the customs declaration (Single Ad-
ministrative Document or ‘SAD’).
The Intrastat system came into operation on 1 January 1993 when the Single Market was set up, leading to the
disappearance of customs formalities within the EU. This system provides for direct collection of information from
companies and is closely linked to the VAT system. In order to reduce the burden on enterprises, the Intrastat system
is designed in such a way that the workload for providers of statistical information varies according to the amount
of trade in which they are engaged. To achieve this, each Member State applies a system of thresholds, expressed
in annual values of intra-EU trade that either exempts enterprises from providing statistical information or limits
the information collected. While Extra-EU trade statistics cover, in principle, all imports and exports, in the Intrastat
system Member States may exclude small scale transactions (of a value below 1000 Euro or a net mass of less than
1000 kg). Once the annual thresholds have been set, estimates must be made for the below- threshold trade in
order to have a complete coverage of trade. Similarly, trade data must be adjusted to compensate for any missing
information.
Statistical analysis 2

92 European Economic Statistics
Another important difference between Intrastat and Extrastat is the definition of the partner country in the case of
imports. For both extra-EU and intra-EU exports, the trading partner is the country (or Member State) of final destina-
tion of the goods. For extra-EU imports, the trading partner is the country of origin of the goods. For intra-EU imports
(arrivals), the trading partner is the Member State of consignment of the goods.
The method of trade allocation to a partner country is one major reason for the differences between national and Com-
munity figures. The valuation of the reference period can also be influenced by the different systems of data collection.
For Intrastat the reference period might be assigned by the Member States to a given month on the basis of the date
on which VAT becomes chargeable on intra-Community acquisitions. For Extrastat, information is generally assigned
to the month in which the customs authority accepts the declaration.
Last but not least, the deadlines for the transmission of detailed monthly data to Eurostat differ: they are 42 days for
Extrastat and 70 days for Intrastat. As a consequence, extra-EU detailed data are generally released within two months
after the end of the reference period. For intra-EU trade, as well as for intra- and extra-Euro area trade, detailed data
are released one month later.
2.5.3 Trade in Services
Whereas section 2.5.2 described trade in merchandise goods (within the External Trade Statistics framework) this section will concentrate on trade in services. Trade in services statistics are compiled within the balance of payments framework.
Services are increasingly important in modern economies. In 2007, their shares of EU27 gross value added and employment were 69.5% and 68.9% respectively. The strong and growing role of services is not, however, reflected in international trade. Due to the intangible nature of services, this sector is inherently subject to more constraints than trade in goods. Also, serv-ices are often difficult to separate from goods with which they may be associated or bundled to varying degrees, and trade in goods may indiscriminately include service charges such as insurance, maintenance contracts, transport charges, or royalty/licence payments. However, with the increasing tradability of large parts of the service economy, trade in services is now growing at a similar rate to trade in goods, and thus is growing at a substantially higher rate than GDP. The expansion of trade in services has continued to outpace the growth in service sector output by a sizeable margin.
Since the 1990s, growth in the export of goods and services in the EU has evolved in a broadly similar pattern, with both sectors growing by about 6% per year on average. Consequently, services maintained their roughly 22% share of overall international trade during this period. However, in 2007 – as figure 2.5.7 shows - after lagging behind for four consecutive years, services exports recorded a higher growth rate (6.8%) than that of goods (4.5%).
2 Statistical analysis

93 European Economic Statistics
Figure 2.5.7: EU GDP and exports of goods and services, annual variation (%) (1)
GDP Goods Services
2000 2001 2002 2003 2004 2005 2006 2007
An
nu
al p
erc
en
tag
e c
han
ge
0.0
2.0
4.0
6.0
8.0
10.0
12.0
14.0
(1) At 1995 prices and exchange rates
In 2007, the European Union remained the world’s largest exporter and importer of services. The EU27 accounted for about one quarter of global exports and imports (intra-EU transactions are excluded from this calculation since the EU is treated as a single entity). EU27 trade in services was marked by an increase of 13.6% in exports (credits) and 10.7% in imports (debits) over 2006 in value terms. As a result the surplus continued to grow, reaching €88.4bn in 2007.
Figure 2.5.8: EU27 trade in services, credit, debit and net (EUR bn)
Credit Debit Net
In b
illio
n E
uro
0
100
200
300
400
500
600
2004 2005 2006 2007
Figure 2.5.9 shows that transportation services, travel and other business (which covers merchanting and other trade-related services, operational leasing services and miscellaneous business, professional and technical services) made up 68% of total EU exports and 74% of total EU imports. The increased surplus in 2007 was mainly due to an improved balance in transportation services, construction services, financial services and computer and information services, and other busi-ness services. These numbers were partially offset by the growing deficit in travel.
Statistical analysis 2
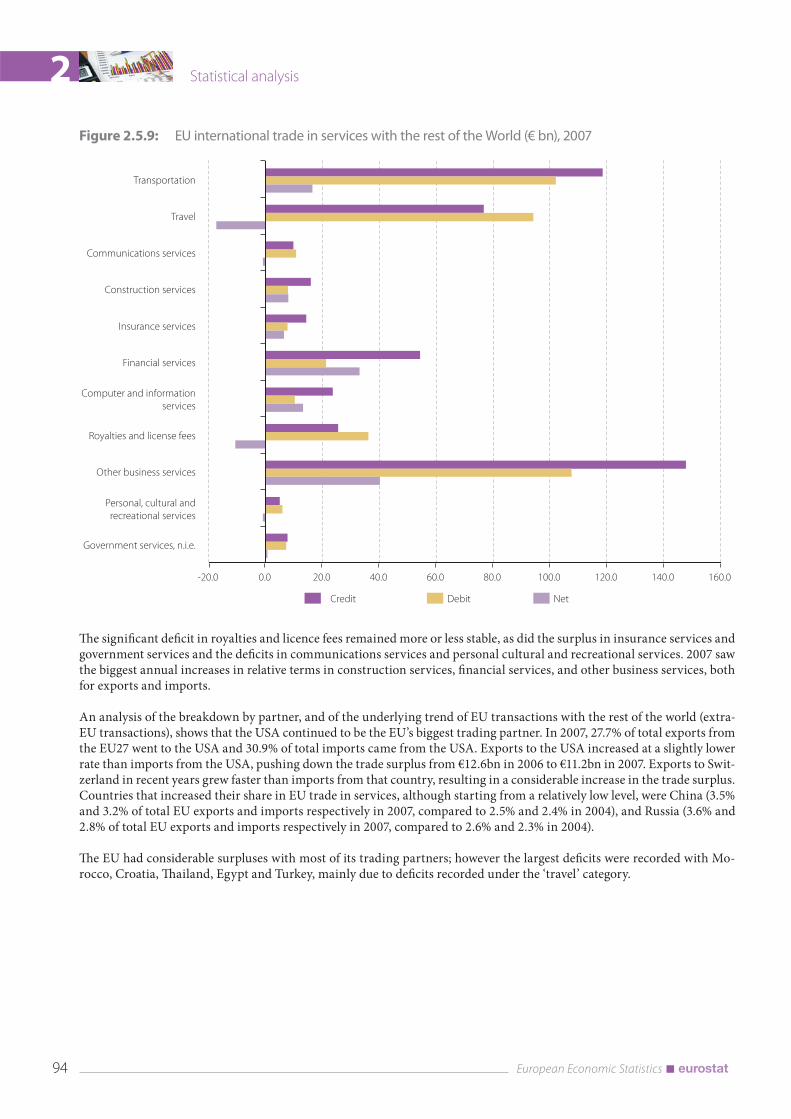
94 European Economic Statistics
Figure 2.5.9: EU international trade in services with the rest of the World (€ bn), 2007
Credit Debit Net
Government services, n.i.e.
Personal, cultural and
recreational services
Other business services
Royalties and license fees
Computer and information
services
Financial services
Insurance services
Construction services
Communications services
Travel
Transportation
-20.0 0.0 20.0 40.0 60.0 80.0 100.0 120.0 140.0 160.0
The significant deficit in royalties and licence fees remained more or less stable, as did the surplus in insurance services and government services and the deficits in communications services and personal cultural and recreational services. 2007 saw the biggest annual increases in relative terms in construction services, financial services, and other business services, both for exports and imports.
An analysis of the breakdown by partner, and of the underlying trend of EU transactions with the rest of the world (extra-EU transactions), shows that the USA continued to be the EU’s biggest trading partner. In 2007, 27.7% of total exports from the EU27 went to the USA and 30.9% of total imports came from the USA. Exports to the USA increased at a slightly lower rate than imports from the USA, pushing down the trade surplus from €12.6bn in 2006 to €11.2bn in 2007. Exports to Swit-zerland in recent years grew faster than imports from that country, resulting in a considerable increase in the trade surplus. Countries that increased their share in EU trade in services, although starting from a relatively low level, were China (3.5% and 3.2% of total EU exports and imports respectively in 2007, compared to 2.5% and 2.4% in 2004), and Russia (3.6% and 2.8% of total EU exports and imports respectively in 2007, compared to 2.6% and 2.3% in 2004).
The EU had considerable surpluses with most of its trading partners; however the largest deficits were recorded with Mo-rocco, Croatia, Thailand, Egypt and Turkey, mainly due to deficits recorded under the ‘travel’ category.
2 Statistical analysis

95 European Economic Statistics
Figure 2.5.10: Extra-EU trade in services, share by main partner (%)
2004 2007
US CH JP RU CN CA HK IN0.0
5.0
10.0
15.0
20.0
25.0
30.0
35.0
40.0
Shar
e in
EU
tra
de
in s
erv
ice
s
Credits
2004 2007
US CH JP RU CN CA HK IN0.0
5.0
10.0
15.0
20.0
25.0
30.0
35.0
40.0
Shar
e in
EU
tra
de
in s
erv
ice
s
Debits
The United Kingdom continued to be the largest exporter of services in 2007. Almost one quarter of all EU exports to the rest of the world came from the UK, followed by Germany and France. Germany was the biggest importer, accounting for more than 19% of total EU imports, followed by the UK and France. The United Kingdom also recorded the largest surplus in 2007 (€54.0bn), followed by Sweden (€9.2bn) and Greece (€ 8.2bn). The highest deficit in 2006 was recorded by Ireland (-€ 12.4bn), followed by Germany (-€ 3.8bn) and Italy (-€ 3.7 bn).
Figure 2.5.11: Member States’ share in total extra-EU ITS transactions (%), net (EUR bn), 2006
Net
MS
shar
e in
%
Ne
t in
bill
ion
Eu
ro
0.0
5.0
10.0
15.0
20.0
25.0
-20.0
-10.0
0.0
10.0
20.0
30.0
40.0
50.0
60.0
UK DE FR IT NL IE ES DK BE SE EL LU AT FI PL HU CZ PT RO CY SI BG LV LT SK EE MT
MS share (%)
Left-hand scale for MS share in percentage; Right-hand scale for balance in bn euro
It is noteworthy that about 57% of EU trade in services in 2007 was between EU Member States (intra-EU transactions). This share has remained more or less stable during the last decade.
Statistical analysis 2

96 European Economic Statistics
2.5.4 Current account
The current account measures a country’s economic position in the world, covering all transactions that occur between resi-dent and non-resident entities. Besides trade in goods and services, discussed in the two previous sections, it also includes income and current transfers. Economies with a current account deficit are net debtors to the world economy (this deficit is financed by the various items of the financial and capital account), while economies with a surplus are creditors.
The position of the EU economy can be weighed against that of other major world economies, comparing the current ac-count balance measured as a share of GDP. As figure 2.5.12 shows, in the most recent years the EU recorded values close to zero, though on the deficit side, whereas the USA ran a deficit which has grown steadily from -3.8% in 2001 to -5.3% in 2007. Japan, on the other hand, had a surplus, which rose from 2.1% in 2001 to 4.8% in 2007. However, the most significant change was recorded in China, where the current account surpluses soared from 1.3% in 2001 to 9.4% in 2006. India, on the other hand, has moved from a small surplus (in 2001 up to 2003) to a small deficit (since 2004). Russia, whose economy is dominated by raw materials and energy products exported to foreign markets, runs a significant current account surplus, which recorded its lowest value (6.1% of GDP) in 2007.
Figure 2.5.12: Current account balance as share of GDP (%)
2001 2002 2003 2004 2005 2006 2007-8.0%
-6.0%
-4.0%
-2.0%
0.0%
2.0%
4.0%
6.0%
8.0%
10.0%
12.0%
EU (*) China India Japan Russia USA
(*) 2001-2003: EU25; 2004-2007: EU27
A sharper picture of the economic situation can be provided by the contribution of the various components to the current account balance: international trade in goods, trade in services, income and current transfer. As shown in figure 2.5.13, based on yearly data for 2007, the EU current account was fairly well balanced among the four components, with a small deficit that was mainly due to a deficit in trade in goods. The small value, in terms of GDP, of the net trade in goods means that exports almost matched imports. The slight imbalance in favour of imports had a determining effect on the current account deficit.
2 Statistical analysis

97 European Economic Statistics
Trade in goods was also the main driver of the current account balance for Russia, China and the USA. In the first two cases it generated a significant surplus, whereas for the USA it led to a deficit. The situation in Japan and India was quite different. In Japan, a large surplus on income and, to a lesser extent, in trade in goods triggered the current account balance. In India, on the other hand, the surpluses in trade in services and in current transfers all but offset the considerable deficit in trade in goods, thus leading to a slight deficit in the current account.
Figure 2.5.13: Current account by component as share of GDP, 2007 (%)
Goods Services Income Current transfer Total current account
-8.0%
-6.0%
-4.0%
-2.0%
0.0%
2.0%
4.0%
6.0%
8.0%
10.0%
12.0%
EU USA India (*) Russia Japan (*) China (*)
(*) 2006 data
The contribution of the various components to the EU current account changed over time. As figure 2.5.14 shows, the cur-rent account has moved sharply from a surplus of about 10 bn EUR to a deficit of 72 bn EUR – that is from +0.1% to -0.6% as a share of GDP. The main driving force was trade in goods, where the deficit continued to worsen from 2003 to 2006, and improved only marginally in 2007. On the other hand, current transfers’ deficit remained fairly stable in the last few years, at around 50 bn EUR. The trend defined by trade in goods was partially offset by income and by trade in services. Whereas the surplus in income played a comparatively more important role in 2004 and 2005, trade in services was the item which recorded the largest surplus in 2006 and 2007 (65 bn EUR and 88 bn EUR, respectively).
Statistical analysis 2

98 European Economic Statistics
Figure 2.5.14: EU Current account by component (bn EUR)
Current account Goods Services Income Current transfers
-175
-150
-125
-100
-75
-50
-25
0
25
50
75
100
2004 2005 2006 2007
The analysis of the geographical breakdown of the EU current account, which can be found in figure 2.5.15 for 2007, shows that the net creditor position of the EU with the USA was more than counterbalanced by the debtor position with China. The deficit position with Russia and Japan further weakened the total current account deficit.
Figure 2.5.15: EU current account balance with main partners, 2007 (EUR bn)
-200
-150
-100
-50
0
50
100
150
Russia USA China India Japan Other
Countries
Total Extra
EU27
2 Statistical analysis

99 European Economic Statistics
BOX 2.5.2: DIFFERENCES BETWEEN ETS AND BOP IN DATA ON INTERNATIONAL TRADE IN GOODS
Balance of Payments (BOP) and External Trade Statistics (ETS) both provide data for the external trade in goods of a
given country. Although these statistics serve different purposes and address different users’ needs, users may never-
theless be puzzled to find that, for the same period, reporter and partner country, the two data sets generally do not
show the same figures. Different methodologies are the main reason for the differences between the two data sets.
The main conceptual differences between BOP and ETS data on goods originate from the different recommendations
on computing, as defined in the Balance of Payments Manual (BPM5) and International Merchandise Trade Statistics
(IMTS) respectively.
Coverage and time of recording
ETS data cover goods which add to or subtract from the stock of material resources of a country by entering (imports)
or leaving (exports) its economic territory. Consequently, trade statistics are recorded on the basis of customs docu-
ments reflecting physical movement of goods across the national or customs frontier of an economy, with the date of
lodgement of the customs declaration as a suitable approximation.
In contrast, goods in BOP statistics, in addition to general merchandise, also covers goods for processing, repairs on
goods, goods procured in ports by carriers, and non-monetary gold. Transactions involving general merchandise are
recorded at the time of the change of ownership of the goods, i.e. when the parties enter the goods in their books as a
real asset and make a corresponding change to their financial assets and liabilities.
Actual movement of the goods may not occur at the same time as the change of ownership of the goods. There are
a number of special transactions where the movement of goods does not reflect a change of ownership, e.g. goods
sent or received for processing, repair of goods, mobile equipments that change ownership outside the country of
residence of the original owner, etc. As ETS are the most common source for the goods component of the BOP, for the
purposes of balance of payments statistics source data coming from ETS should be adjusted by removing merchandise
movements recorded during the period that did not involve a change of ownership, and by adding merchandise that
changed ownership during the period but was recorded in the ETS in earlier or later periods.
Valuation
The principle of valuation of general merchandise in BOP is the market value of goods at the customs frontier of the
economy from which the goods are first exported, i.e. free on board (FOB). In contrast, IMTS use FOB-type valuation
as the statistical value of exports only. For imports, CIF-type valuations are used, including cost, insurance and freight
(CIF) at the border of the importing country. For BOP purposes, in order to convert imports from CIF to FOB valuation,
the value of freight and insurance premiums incurred from the frontier of the exporting country to the border of the
importing country should be deducted. When the customs point of the exporting and importing territory are contigu-
ous, the CIF and FOB values should be the same.
2.5.5 Foreign direct investments
Foreign direct investment (FDI) is playing a growing role in economic globalisation. For the investing firm, it means access to new markets and marketing channels, possibly cheaper production facilities, access to new technology, products, skills and financing. For a host country or the firm which receives the investment, it can provide a source of new technologies, capital, products and management skills, which can lead to higher competition and give an impetus to economic devel-opment. FDI complements and fuels the expansion of trade flows and is seen as an important cornerstone of economic globalisation.
Statistical analysis 2

100 European Economic Statistics
Figure 2.5.16: World FDI flows as a % of the world GDP, 1970-2006
% G
DP
0.0%
0.5%
1.0%
1.5%
2.0%
2.5%
3.0%
3.5%
4.0%
1970 1972 1974 1976 1978 1980 1982 1984 1986 1988 1990 1992 1994 1996 1998 2000 2002 2004 2006
Source: UNCTAD World Investment Report 2007 and UN statistics division.
The world FDI flows have increased six-fold since 1970. As a percentage of world GDP, the FDI flows remained below 1 % from 1970 until 1989. From 1994 they grew steeply, with 2000 being the peak year (3.9 % of GDP). The following three years were characterised by severe slumps; global FDI flows fell by 61 % between 2000 and 2003, dropping to 1.5 % of world GDP. Since then, increasing world FDI flows were recorded until 2006.
Figure 2.5.17: World FDI flows by origin, 2001-2006 (EUR bn)
EU27 for 2004-2006, EU-25 for 2001-2003
-250
0
250
500
750
1000
0
25
50
75
100
EU s
har
e (
%)
(EU
R b
n)
2001 2002 2003 2004 2005 2006
EU (to extra-EU) USA
Other developped countries Other countries
EU share (right-hand scale)
Source: Eurostat, UNCTAD.
2 Statistical analysis

101 European Economic Statistics
Figure 2.5.17 demonstrates the important role that the EU plays in world FDI flows. After the peak investment years at the beginning of this century when the EU had an almost 50 % share of world FDI outward flows, the EU continued to be the largest investor through the global decline in FDI flows and the following upturn; the exception was 2004, when the United States surpassed the EU in investments. In 2006, when world FDI flows grew by 85 %, the EU held the leading position amongst the principal investing countries, with a share of 34 % of the total world FDI flows.
Figure 2.5.18: EU FDI flows and stocks 2001-2007 (EUR bn) 41
EU27 for 2004-2007, EU25 for 2001-2003
flo
ws
sto
cks
Extra EU outward stocks Extra EU inward stocks
EU outflows to Extra EU EU inaflows from Extra EU
2001 2002 2003 2004 2005 2006 2007*0
500
1000
1500
2000
2500
3000
3500
0
100
200
300
400
500
* Estimated stock data for 2007.
The trend in EU FDI flows in extra-EU countries has been upwards since 2002. Especially since 2004, constant growth has been the major characteristic of EU outward flows throughout, reaching EUR 420 bn in 2007 and representing 3.4 % of the EU GDP.
EU FDI inflows followed a downward curve from 2001, reaching their lowest point in 2004 with EUR 58 bn; however, since then they have continued to expand, reaching the unprecedented amount of EUR 319 bn in 2007. The EU remained a net investor: in 2007; FDI outflows exceeded inflows by EUR 101 bn, which was a similar result to those of previous years.
EU FDI stocks in extra-EU countries amounted to EUR 3 126 bn in 2007, following a 16 % increase compared to 2006 (EUR 2 706 bn). These investments were highly diversified, but in terms of activities, services accounted for the major share. In 2007, EU FDI inward stocks (EUR 2 376 bn) increased by 83 % over 2001 (EUR 1 296 bn). The EU was a net investor, with EU FDI outward stocks exceeding EU FDI inward stocks by EUR 750 bn.
41 The FDI flow figures for 2007 are based on preliminary data from the Member States; FDI stock data for 2007 are estimated by Eurostat.
Statistical analysis 2

102 European Economic Statistics
Figure 2.5.19: EU27 FDI outward stocks by main destination (end-2006)
Africa
5%
Asia
13%
Oceania
2%
Central and
South America
17%
North American
countries
39%
Europe
(non-EU)
23%
not allocated
1%
North America continued to be by far the favourite destination of EU FDI, hosting EU FDI stocks of EUR 1 078 bn at the end of 2006. Its share of the total EU FDI outward stocks remained stable from 2004 to 2006, at around 40 %. The United States, with EUR 934 bn, attracted the lion’s share of the EU outward stocks targeting the Northern American countries, representing a share of 35 % of all EU FDI investments outside the EU. The United Kingdom was the biggest EU investor in the United States with FDI stocks of EUR 276 bn.
Non-EU Europe, with EUR 620 bn, was the second biggest extra-EU partner, as its stocks accounted for 23 % of EU outward stocks at end-2006. Switzerland, alone, attracted EUR 333 bn for the same period, accounting for 65 % of the total EU FDI stocks targeting the non-EU European countries and 12 % of all extra-EU investments. The Netherlands together with France were the most significant EU investors in Switzerland with cumulative investments of EUR 77 bn at end-2006.
The combined share of South and Central America increased marginally from 16 % at end-2004 to 17 % at end-2006. However, over the same period, EU FDI stocks invested in South America increased by 16 % and those in Central America by 36 %.
Asia, with EUR 368 bn at end-2006, saw its share of EU FDI outward stocks decrease slightly to 13 % (16 % at end-2004), although it remained the fourth biggest destination area. The main recipients of EU outward stocks in Asia were China, including Hong Kong, with a share of 32 % of the EU outward stocks targeting Asia (4 % of total EU FDI stocks held abroad). With EUR 76 bn, Japan was the second biggest destination of EU FDI outward stocks to Asia. France was the biggest EU investor with 35 % of the total EU FDI outward stocks targeting Japan.
From 2004 to 2006 the share of total extra-EU FDI stocks in Africa remained stable at 5 %, but investments grew by 14 % in absolute terms, from EU 110 bn at end-2004 to EUR 125 bn at end-2006. South Africa was the primary destination, receiv-ing 35 % of the total EU outward FDI stocks directed at Africa.
Oceania kept its share of total extra-EU FDI stocks at fairly stable levels of around 2 % from 2004 to 2006. The value of the EU outward stocks invested in Oceania dropped from EUR 67 bn at end-2004 to EUR 56 bn at end-2006. This fall was mainly due to decreased investments in Australia.
2 Statistical analysis

103 European Economic Statistics
Figure 2.5.20: EU27 FDI inward stocks by extra-EU main investor (end-2006)
Africa
1%
Asia
10%
Oceania
1%
Central and
South America
14%
North America
50%
Europe
(non-EU)
22%
not allocated
2%
At end-2006 the EU FDI inward stocks from extra-EU partner countries stood at EUR 2 057 bn - a 19 % increase from end-2004 levels. It is worth noting that, at end-2006, half of the EU inward stocks originated in North America, which con-tinued to be the biggest investor in the European Union throughout the period in question. The United States was the big-gest investor in the EU, with EUR 954 bn, and accounted for 94 % of the total EU inward stocks from Northern American countries and 46 % of all extra-EU investments. The United Kingdom, with EUR 265 bn, hosted 28 % of the total EU FDI inward stocks from the United States at the end of 2006.
The share of Europe (non-EU) rose from 20 % at the end-2004 to 22 % at end-2006, totalling EUR 457 bn. Switzerland was the main investor country into the EU, accounting for 54 % of the total EU inward stocks from European (non-EU) countries, and 12 % of all inward stocks. France, with EUR 44 bn, was the biggest EU recipient of FDI stocks coming from Switzerland.
EU FDI inward stocks coming from South and Central America remained steady at around 14 % throughout 2004-2006. Asia’s share increased slightly to 10 % at end-2006 from 9 % at end-2004. The shares of EU FDI inward stocks of other inves-tor zones remained unchanged at fairly low levels between 2004 and the end of 2006.
2.5.6 Outward Foreign affiliates statistics
The European Union is one of the world’s biggest investors, and foreign affiliates of European companies play a very impor-tant role in the global economy. Therefore, Outward Foreign Affiliates Statistics (FATS), which can be defined as statistics describing the activity of foreign affiliates abroad controlled by the compiling economy, are increasingly relevant to the for-mulation of the European Union economic policies, as they provide information on the role that European capital groups play in the world’s economy, especially in terms of sales and employment.
Reporting of outward FATS data in Europe still takes place on a voluntary basis only, and for most countries the variables covered are turnover and number of persons employed. For 2004, which is the most recent year for which figures are avail-able, seven Member States provided data.
Statistical analysis 2

104 European Economic Statistics
The scale of activities of EU-controlled foreign affiliates was bigger within the EU than outside it. For the reference year 2004, the intra EU27 share of the number of persons employed was 57.7% (the figures ranged from 34.5% for Portugal to 81.2% for Austria) and the share of turnover was 54.5% (ranging from 50.9% for Germany to 89.8% for Czech Republic). The only exception was in relation to the number of persons employed in Portuguese-controlled foreign affiliates, where the extra-EU share was 65.5%.
It should be noted that the most substantial activity by foreign affiliates takes place in the neighbouring countries (France for Belgium, Slovakia for Czech Republic, Cyprus for Greece, Germany for Austria, Spain for Portugal or Sweden for Fin-land). The United States was the principal destination in terms of both turnover and number of persons employed only for German foreign affiliates.
The activity of the European affiliates outside the EU was highest in North America, with shares of 38.6% for number of persons employed and 57% for turnover (USA counting for 91% of the total).
Figure 2.5.21: Number of persons employed and turnover in foreign affiliates located outside the EU27, 2004, shares by region (%) (1)
Oceania
2%
Africa
6%
Central
America
4%
Asia
23%
Other
European countries
15% North
America
39%
Number of persons employed Turnover
South America
11%
Oceania
3%
Africa
3%
Central America
4%
Asia
17%
Other
European countries
12% North
America
57%
South America
4%
(1) Reporting countries: Austria, Belgium, Czech Republic, Finland, Germany, Greece, Portugal
In terms of turnover, the services sector was the main field of activity for EU affiliates in 2004 with 54.7% of total, followed by manufacturing with 40.9%. Only in Finland did manufacturing take a higher share of total turnover than services. How-ever, the manufacturing sector accounted for 54.8% of the total number of persons employed in foreign affiliates, compared with 41% for services.
Among the activity categories of the services sector, ‘Trade and Repairs’ had the biggest share in terms of both number of persons employed and turnover (47.6% and 67.2% respectively). However, this share differed from country to country, rang-ing from 10.4% in Greece to 62.5% in Finland for number of persons employed and from 12.9% in Greece to 88.3% in Czech Republic for turnover. ‘Trade and Repairs’ was followed by ‘Transport and Communication’ in terms of employments and by Financial Intermediation in terms of turnover.
The impact of foreign affiliates on the labour market differs significantly from country to country, being substantial in some countries and almost negligible in others. German affiliates were by far the biggest employer abroad, but compared against total employment within the compiling country Finland had the highest ratio with the total number of persons employed in foreign affiliates accounting for 13.9% of total employment in the country. It was followed by Austria and Germany, both with a ratio of about 11%. On the other hand, the ratio for Czech Republic is only 0.3% and for Portugal 0.6%. Taking only affiliates outside the EU into account, these figures ranged from 5% for Finland and Germany to 0.1% for Czech Republic and 0.4% for Portugal.
2 Statistical analysis

105 European Economic Statistics
BOX 2.5.3: FDI VERSUS FATS
FDI and (outward) FATS are closely related statistical domains. Their subject of interest is the same – businesses inter-
nationalising by investing abroad in other business units, existing ones and/or newly founded ones. This similarity in
substance is also expressed in compilation practice, as outward FDI stock and outward FATS data are often compiled
with the help of the same survey. Yet, despite all these similarities there are a number of important methodological
differences between them. These differences limit the scope of comparability between the two datasets. The most
important methodological differences are:
50% (FATS) rule versus 10% (FDI) rule
FATS comprises all affiliates that are foreign-controlled (more than 50% of voting rights) while FDI statistics include all
foreign interests amounting to 10% or more of the voting power. Broadly speaking, it could be said that the outward
FATS population is a sub-group of the population of foreign direct investments relevant for FDI statistics.
The principle of the Ultimate Controlling unit (UCI) versus Immediate Counterparty Country
FATS, including outward FATS, are based on the concept of control when assigning statistical values to institutional
units. According to Eurostat’s FATS recommendations manual, control is defined as “the ability to determine the gen-
eral policy of an enterprise by choosing appropriate directors, if necessary.” Typically, equity-ownership is taken as a
proxy to determine control and, whilst cases of minority ownership are also acknowledged, the ownership of more
than 50% of the voting power or of the shares (directly or indirectly) is generally taken as an indication of effective
control over another institutional unit. As control and ownership chains often extend across a number of institutional
units, FATS statistics according to the FATS recommendations manual are always assigned to the Ultimate Control-
ling Institution (UCI), which is colloquially (although less accurately) referred to as the ‘parent company’. The core FDI
statistics, on the other hand, are based on the immediate counterparty country principle. FDI flows and positions are
attributed to the country of the immediate investor or recipient of the investment, even if the capital may be passing
through to a third country.
Statistical analysis 2

106 European Economic Statistics
2.6 Labour market
The labour market provides a complementary insight into analyses of economic performance and growth. This chapter describes the current situation and the changing patterns in the European labour force market. It starts by presenting the evolution of employment growth, its relationship with the economic cycle, the distribution of employment by industry and the pattern of actual hours worked. Other aspects relating to the composition of the labour force are also analysed, in particular the participation of women and other specific groups, such as immigrant workers. Job-related features of the European Union labour market, in particular whether people are working in full-time or part-time jobs and the relevance of fixed-term contracts, are also discussed. To complete the analysis of the active population, levels of unemployment and employment trends are reviewed.
2.6.1 Employment growth and employment rates
In 2007, employment42 grew by 1.6% in the EU27 and by 1.8% in the EA13. Employment growth in 2007 was equal to or stronger than that of any previous year since 2001, when the expansion during the period 1995-2000 came to end. The figures for 2007 underpin the recovery since 2003 after the slowdown in 2001-2002. This pattern of employment growth is broadly consistent with the evolution of real GDP in EU27. However, the employment cycle has a smaller amplitude than GDP (see also section in Chapter 2.1 on labour productivity). Employment growth - particularly since 2003 - was stronger in the EA13 countries than in the EU27, although only by a small margin.
Figure 2.6.1: Employment and GDP growth
GDP EU27 employment EU27 employment EA13
0.0%
1.0%
2.0%
3.0%
4.0%
2000 2001 2002 2003 2004 2005 2006 2007
Source: National Accounts
All Member States except one had positive employment growth in 2007. In general, small and medium-sized countries performed better. The Member States with the strongest growth were: Poland (+4.4%), Luxembourg (+4.1%), Latvia (+3.4%), Ireland (+3.4%), Cyprus (+3.2%) and Spain (+3.1%).
42 Unless otherwise stated, employment in this chapter is measured as the number of persons employed or (the equivalent number of) job holders. Employment can be measured in jobs or in full-time equivalents. One job holder could work in two or more jobs. Full-time and part-time jobs can be transformed into full-time equivalents. Hence these units are different yardsticks to measure employment.
2 Statistical analysis

107 European Economic Statistics
Figure 2.6.2: Employment growth, 2007
-1.0%
0.0%
1.0%
2.0%
3.0%
4.0%
5.0%
PL LU LV IE CY ES BG SI MT SE FI SK NL LT AT DK EA13
DE EU27
CZ BE GR RO IT FR EE UK PT HU HR TR IS NO CH
Source: National Accounts
On average, 223.4 million men and women worked in the EU27 during the year 2007. This represented a net increase43 of 14.0 million persons since 2000, or an overall 6.7% growth over the period 2000-2007. In the EA13 the increase was 10.6 million persons, making a total of 143.8 million persons in 2007, i.e. an overall growth for 2000-2007 of 7.9%. The Member States with the highest net employment creation over the period 2000-2007 were Spain (+4.2 million persons), Italy (+2.2), United Kingdom (+1.7) and France (+1.2). The development in Spain is even more remarkable if expressed in terms of em-ployment growth for the period 2000-2007. Spain increased employment by 25.6 percent, significantly ahead of other large Member States such as Italy (+9.7 %), United Kingdom (+6.3 %) and France (+4.9 %).
Figure 2.6.3: Employment growth, total 2000-2007
-15%
-10%
-5%
0%
5%
10%
15%
20%
25%
30%
LU ES IE CY LV BG EE GR IT FI LT MT EA13
SK EU27
UK SI BE AT NL SE FR PL CZ DK PT DE HU RO * HR TR IS NO CH
Source: National Accounts
* Note: Growth 2001-2007 for Romania
43 ‘Net increase’ means number of persons that entered in employment minus persons that abandoned employment.
Statistical analysis 2

108 European Economic Statistics
This growth went in parallel with increased overall employment rates and, in particular, with a stronger participation by women in the labour market. The employment rate in the EU27 measured by the Labour Force Survey (LFS) grew to reach 65.4% in 2007 (see definition in box 2.6.1). The positive result in 2007 follows numbers of 64.5% in 2006 and 63.5% in 2005. The increase by 0.9 percentage point in 2007 after 1.0 pp in 2006 maintains and reinforces the positive upward trend in the EU labour market. The EU27 employment rate was 62.2% in 2000. In the EA13 the employment rate reached 65.7% in 2007, slightly above the average for the EU27. This follows rates of 64.8% in 2006 and 61.5% in 2000.
Employment rates grew faster for women than men, although the levels for women still remain lower. The EU27 female employment rate in 2007 rose by 1.0 percentage point to 58.3%. The employment rate for men rose by 0.9 pp to reach 72.5%. The sustained stronger growth of the female employment rate in all recent years has narrowed the gender gap from 17.1pp in 2000 to 14.2pp in 2007. In the EA13, the gender gap stood at 15.4pp in 2007. The employment gender gap is smallest in Finland (3.6pp in 2007), Sweden (4.8pp) and Lithuania (5.7pp). On the other hand, few Member States present particularly high gender gap values: these include Malta (37.3pp in 2007), Greece (27.0pp) and Italy (24.1pp). Spain and Luxembourg are the two countries that show a significant reduction in the employment gender gap since 2000 - down 8.4pp and 8.0pp respectively - although they are still above the EU27 average in 2007 (21.5pp and 16.9pp respectively in 2007).
Figure 2.6.4: Employment rates by gender
Males Females
Mal
es
Fem
ale
s
60.0%
63.0%
66.0%
69.0%
72.0%
75.0%
50.0%
53.0%
56.0%
59.0%
62.0%
65.0%
2000 2001 2002 2003 2004 2005 2006 2007
Source: EU Labour Force Survey
Older workers also made a significant contribution to employment growth. The employment rate for older people (aged 55-64) reached 44.7% in 2007 in the EU27. This was an increase of 1.2 percentage points over the previous year and an overall increase of 7.8pp since 2000. Correspondingly, the average value in the EA13 is 43.3% in 2007, 1.5pp higher than 2006 and up 9.0pp since 2000. Among EU Member States, Sweden recorded the highest employment rate for older workers (70.0% in 2007), and the biggest improvement since 2000 was in Bulgaria (+21.8pp), now at 42.6%.
The improved employment rate in 2007 represents the biggest step so far towards reaching the overall employment target set by the Lisbon European Council of 2000 which was to raise the overall employment rate to as close to 70% as possible by 2010, and to raise the employment rate for women to more than 60% by the same year. The Stockholm European Council of 2001 set an additional target, namely to raise the average EU employment rate for older men and women (aged 55-64) to 50% by 2010. The target of 70% by 2010 remains very ambitious; in order to reach it, significantly stronger growth would be needed in the next few years. At present, Denmark (77.1%), the Netherlands (76.0%), Sweden (74.2%), Austria (71.4%), Unit-ed Kingdom (71.3%), Cyprus (71.0%) and Finland (70.3%) are the only countries to have reached the target, although many others are not far away. Compared to the Lisbon target, the record on female employment rate is better: 15 Member States have already reached the 60% target, namely: Denmark (73.2%), Sweden (71.8%), the Netherlands (69.6%), Finland (68.5%), Estonia (65.9%), United Kingdom (65.5%), Austria (64.4%), Latvia (64.4%), Germany (64.0%), Slovenia (62.6%), Cyprus (62.4%), Lithuania (62.2%), Portugal (61.9%), Ireland (60.6%) and France (60.0%). In addition Bulgaria, Czech Republic,
2 Statistical analysis

109 European Economic Statistics
Belgium and Luxembourg have rates above 55%. For the category of older workers, reaching the Stockholm 50% target for the EU remains a challenge, although it is worth pointing out that the countries of the EU15, for which the Stockholm target was originally set, should have a smaller gap to close, as the EU15 employment rate for older people in 2007 is 46.6%.
BOX 2.6.1: DEFINITIONS OF EMPLOYMENT AND UNEMPLOYMENT
For the sake of international comparability, labour market statistics from Eurostat use key definitions based on the
International Labour Organisation guidelines44 (ILO guidelines). The EU labour force survey (EU LFS) uses those guide-
lines and further improves comparability within the EU with a more precise definition of unemployment (stipulated
in Commission Regulation (EC) No 1897/2000), while remaining fully compatible with the ILO standards. Chapter 11 of
the European System of Accounts 1995 (ESA95) includes definitions of employment and unemployment that are fully
consistent with the ILO guidelines.
The EU LFS uses the following concepts:
– Employed persons are persons aged 15 and over (Spain, United Kingdom: 16 and over; Denmark, Estonia, Hungary,
Latvia, Sweden, Finland and Norway: 15-74; Iceland: 16-74) who during the reference week performed work, even
for just one hour per week, for pay, profit or family gain or were not at work but had a job or business from which
they were temporarily absent because of, e.g., illness, holidays, industrial dispute, education or training.
– Unemployed persons are persons aged 15-74 (in Spain, United Kingdom, Iceland: 16-74) who were without work
during the reference week, were currently available for work and were either actively seeking work in the past four
weeks or had already found a job to start within the next three months.
– The economically active population comprises employed and unemployed persons.
Those three concepts (employed, unemployed and active) plus the population are combined to compile three ratios,
as follows:
– Employment rate is the percentage of employed persons over the population.
– Unemployment rate is the percentage of unemployed persons over the active population.
– Activity rate is the percentage of active persons over the population.
Those rates are regularly calculated by gender and by age groups.
44
In some countries, it is not only female workers and older workers that account for employment growth, but also the in-creased contribution of foreign-born workers. Foreign-born workers are defined as persons who were born in a country other than the one in which they work, irrespective of their citizenship. According to the LFS, the number of foreign-born workers in Spain increased by +2.6 million during the period 2000-2007, while in the United Kingdom it rose by +1.2 mil-lion. In Spain, about 74% of these workers were born outside the EU27, the remainder being born in another EU Member State. The United Kingdom’s share was 64%.
The industries showing stronger growth in the EU27 during 2007 were NACE F (construction), recording +3.8%, and NACE J-K (financial intermediation; real estate, renting and business activities) at +3.5%. These were also the activities with stronger growth in the EA13 in 2007, both having growth rates of +3.8%. The employment trends by NACE in EU27 and EA13 are similar except in agriculture, where significant differences appear: the number of persons in agriculture, forestry and fishery fell by 0.1% in the EU27 and by 0.8% in the EA13. The difference was due to a growth rate of 0.4%in the non-EA13 countries. A similar situation had already been observed in 2006.
Indeed, since 2000 there was a net movement of workers from agriculture and manufacturing activities towards construc-tion and services. The EU27 saw a net decrease of 1.4 million persons working in agriculture and a reduction of 2.5 million persons in manufacturing (excluding construction), whereas there were net increases of 2.1 million persons in construction and 15.8 million in services.
44 More precisely those guidelines contained in the Recommendation of the 13th International Conference of Labour Statisticians, convened in 1982 by the ILO.
Statistical analysis 2

110 European Economic Statistics
Figure 2.6.5: EU27, 2000-2007
year 2000 year 2007
Mill
ion
job
ho
lde
rs
0
10
20
30
40
50
60
70
Agricultureand fishing
Industry(excl construction)
Construction Trade, hotels, restaurants,transport and
communication
Financial intermediation,real estate and business
activities
Public administration,health, education andother social services
Source: National Accounts
Those developments led to the following distribution of employment by activity in 2007: in the EU27, 68.9% of persons worked in service activities (+2.9 percentage points since 2000), 17.5% in manufacturing other than construction (-2.3pp since 2000), 7.4% in construction (+0.5pp) and the remaining 6.2% in agriculture, forestry and fishery (-1.1pp). Correspond-ingly, in the EA13, the share of services in 2007 was 71.1% (+2.8pp since 2000), 17.1% in manufacturing other than construc-tion (-2.3pp since 2000), 7.7% in construction (+0.3pp) and 4.1% in agriculture (-0.8pp)
However, those averages conceal significant differences in the distribution of employment by activities among Member States, which result from structural differences. The following table shows the Member States reporting the highest and lowest share of employment in each main activity group, in 2007:
Table 2.6.1: Employment distribution by NACE and Member State
EU27 average Lowest Highest
Agriculture, hunting, forestry and fishing6.2% Luxembourg
(1.6%)Romania
(33.3%)
Total industry (excluding construction)17.5% Cyprus
(10.4%)Czech Rep
(29.4%)
Construction7.4% Poland
(4.6%)Ireland (13.3%)
Wholesale and retail trade, repair of motor vehicles, motorcycles and personal and household goods; hotels and restaurants; transport, storage and communication
25.2% Romania (16.7%)
Cyprus (35.6%)
Financial intermediation; real estate, renting and business activities15.0% Romania
(4.5%)Luxembourg
(28.2%)
Public administration and defence, compulsory social security; education; health and social work; other community, social and personal service activities; private households with employed persons
28.8% Romania (15.7%)
Sweden (38.9%)
Total 100%
Note: CZ, LU and PL data for 2006. RO data for 2005
Source: National Accounts
2 Statistical analysis

111 European Economic Statistics
2.6.2 Professional status and main job features45
Most persons employed in Europe are employees rather than self-employed workers: at least 75% of non-agricultural job-holders in all Member States in 2007 are employees46. The share of employees in the EU27 was 87.7% and in the EA13 it was 86.9%. These shares are extremely stable over time, mostly because the number of employees dwarfs the number of self-employed, which means that the rates of growth of total employment and of employees follow very similar patterns.
Most employment consists of full-time jobs, even though the share of part-time jobs has shown a tendency to increase. In 2000, 16.2% of workers in the EU27 classified their main job as part-time; in 2007 this share rose to 18.2%. This upward trend is stronger in the EA13, rising from 15.9% in 2000 to 19.7% in 2007. The EU LFS gathers information on part-time and full-time jobs based on a spontaneous self-classification by respondents; by way of exception, in Germany, Ireland and the Netherlands this is done in terms of the number of hours worked reported by individuals.
While the growing trend in part-time employment is broadly similar for male and female workers, the proportion of part-time employment differs significantly by gender, as part-time employment is much more common among women than men. In 2007, female workers classifying their main job as part-time accounted for 31.2% of total female workers in the EU27, whereas the corresponding share for males was only 7.7%. In EA13 the gender gap was even wider, the shares being respectively 35.2% and 7.5% in 2007.
Figure 2.6.6: Part-time jobholders, as % of total jobholders
year 2000 year 2007
0%
5%
10%
15%
20%
25%
30%
35%
40%
EU27, females EU27, males EA13, females EA13, males
Source: EU LFS
The countries having the highest percentage of female part-time workers in 2007 were the Netherlands (75.0%), followed some way behind by Germany (45.8%) and the United Kingdom (42.3%).
45 All the information in this section refers only to main jobs, unless otherwise stated. This is because the LFS does not gather information on certain of the variables analysed here for secondary jobs. If secondary jobs are left out of consideration, the statistics for persons employed and jobs are the same. The wording of this section is focused on the jobholders (e.g. ‘the number of persons reporting their main job as full-time is XX’), but occasionally for the sake of simplicity and clarity it will refer to jobs (e.g. ‘the number of full-time jobs is XX’).
46 The shares in this paragraph exclude agriculture for the following reason: in a few EU Member States, a very significant percentage of self-employed persons work in agriculture – for example in Romania (90% of self-employed persons worked in agriculture, fisheries or forestry in 2005), Poland (70% in 2006), Bulgaria (65% in 2007), Lithuania (54%), Latvia (50%) and Slovenia (49%), whereas in all the other Member States this share is below 30%. Actually, in some countries these numbers reflect a large number of people spending a few hours raising agricultural products purely for own-consumption. Statistics record them as self-employed (or unpaid family workers) in agriculture, but this kind of labour clearly has a different economic significance from other self-employment in manufacturing and services.
Statistical analysis 2

112 European Economic Statistics
There is a consistent trend towards more part-time work in parallel with the increase in female participation in the labour force, which was noted above. During the period 2000-2007, the Member States showing the strongest increase in part-time female employment were Luxembourg (+13.5 percentage points increase to 38.6% in 2007), Italy (+10.4pp), Malta (+9.4pp), Austria (+9.0pp) and Germany (+7.9pp). The figure for the Netherlands – the leading country in female part-time work – was also up by +4.0pp from 71.0% in 2000. This rise was higher than in 18 Member States. In general, the countries with a stronger increase in part-time female employment during the period 2000-2007 are those which were already above the EU27 average in 2000 (see figure 2.6.7). This means that, according to this indicator, the gap between Member States has widened with the passage of time.
Figure 2.6.7: Female part-time jobholders, as a % of all female jobholders, 2007
-10%
0%
10%
20%
30%
40%
50%
60%
70%
80%
NL DE UK AT BE SE LU DK EA13 IE EU27 FR IT MT ES FI PT PL EE SI CY RO LT GR CZ LV HU SK TR NO
year 2000 Increase 2000-2007
Source: EU LFS
Some of the countries experiencing the strongest growth in female part-time work also report the highest increases in male part-time employment. These are: Germany (a +4.4pp increase from 5% in 2000), the Netherlands (+4.2pp), Sweden (+3.6pp) and Denmark (+3.3pp). The increases in male part-time work are generally less pronounced than for women, al-though there are exceptions, such as Denmark. All in all, part-time employment is becoming increasingly widespread, more so among women than among men, and is revealing a widening gender gap.
An important factor in part-time work is whether or not it is voluntary. Some 22.0% of EU2747 part-time workers in 2006 aspired to a full-time job, with men (at 28.4%) accounting for a higher share than women (20.1%). An analysis by Member State presents a mixed picture. Since 2000, the share of involuntary part-time workers fell in nine Member States, led by Lithuania (down 14.6 percentage points), but rose in another 16 Member States, principally in Poland (+14.1pp). However, Member States are also showing signs that they are slowly converging towards similar percentages of involuntary part-time workers, as the coefficient of variation among them fell from 1.5pp in 2000 to 1.3pp in 2006.
Fixed-term employment has shown a sustained rise in recent years. The EU27 average reached 14.5% of employees in 2007, up from 14.4% in 2006 and 14.0% in 2005. The upwards movement has been very consistent since 2000, when the figure was 12.3%. Similar trends were observed for the EA13, reporting 16.8% in 2007, the same as in 2006 and following on from 16.3% in 2005. The incidence of this phenomenon varies widely from country to country: in Spain one out of three employee jobs is fixed-term (31.7% in 2007, although down from 34.0% in 2006), with Poland coming second on 28.2% and Portugal third on 22.4%. Meanwhile, at the other end of the spectrum, in Romania and Estonia fewer than 3% of employees have fixed-term contracts. The evolution in recent years has been most noteworthy in Poland, which saw fixed-term work rise from 5.8% in 2000 to 28.2% in 2007 (i.e. by +22.4 percentage points). Other significant increases took place in Slovenia
47 Data not available for 2007. The EU27 aggregate for 2006 was calculated using 2004 figures for Ireland.
2 Statistical analysis

113 European Economic Statistics
(+4.8pp), the Netherlands (+4.4pp) and Italy (+3.1pp), while the biggest decreases in fixed-term contracts were in Latvia (-9.7pp since 2002) and Greece (-2.6pp since 2000). Most other Member States reported fairly stable results. Norway and Iceland recorded sustained increases in fixed-term contracts (+6.9pp since 2000 and +4.4pp since 2003, respectively).
Fixed-term contracts are more common among women than among men, although the difference is far smaller than for part-time work: the gender gap in 2007 was 1.3pp in the EU27 and 1.8pp in the EA13. In 2007, only a few Member States had a higher proportion of fixed-term contracts among men, and these are mostly the new Member States: Latvia, Lithuania, Estonia, Hungary, Poland, Romania and Germany.
Contract length and part-time/full-time job status are inter-related. Among the persons in the EU27 reporting their main job as part-time, 21.2% had fixed-term contracts in 2007 (the remaining 78.8% having permanent contracts), whereas for the full-time jobholders the share of fixed-term contracts is lower at 15.8%. Similarly, in the EA13, 21.4% of part-time job-holders had fixed-term contracts, whereas the share among full-time jobholders is 15.6%. Beyond this general statement, the profiles of Member States show a good deal of variation. A first group of countries, which includes most of the new Member States plus the United Kingdom, have very few (i.e. under 10%) fixed-term contracts among full-time jobs, whereas 10%-30% of part-time jobs are covered by fixed-term contracts. At the other extreme, a second group of countries, which includes Slovenia, Poland, Spain, Portugal, Greece and Czech Republic, report a large number of fixed-term contracts, more frequently among part-time jobs (45-65%) than among full-time jobs (some 10-30%). Finally, in the majority of Member States about 10-30% of part-time jobs and about 10-20% of full-time jobs are based on fixed-term contracts. This group also includes European aggregates. Austria and Germany are the only countries where fixed-term contracts are proportionally more frequent among full-time jobholders than among part-time jobholders. The figure below highlights the three groups that can be identified. This figure uses averaged data for the years 2004 to 2007 to enhance stability of the results.
Figure 2.6.8: Fixed-term contracts by full-time / part-time job status, average 2004-2007
Part-time fixed-term (% total part-time)
Full-
tim
e fi
xed
-te
rm (
% t
ota
l fu
ll-ti
me
)
0%
10%
20%
30%
40%
0% 10% 20% 30% 40% 50% 60% 70%
DE
AT
LU
EEUK
LTIE
BE
MT
DK
RO
LVHU
SE
FIEA-13
EA-27
NLIT
CYFR
BG
SK
CZ
EL
PT
PL
ES
SI
Source: EU LFS
2.6.3 Working time
Analyses of employment in terms of number of workers or jobs are usually supplemented by the numbers of hours worked. This is because actual working time is generally considered to be the most appropriate measure of labour input for econom-ic production. Working time arrangements are of interest in the social domain too. However, analysis of working time is not straightforward. Several concepts of working time co-exist (actual hours worked, usual hours of work, etc.) and several indicators are possible (total annual hours, average hours per person, weekly hours). This multitude of measures can create confusion. Another hurdle is that measuring actual hours worked is difficult and data availability is limited.
Statistical analysis 2
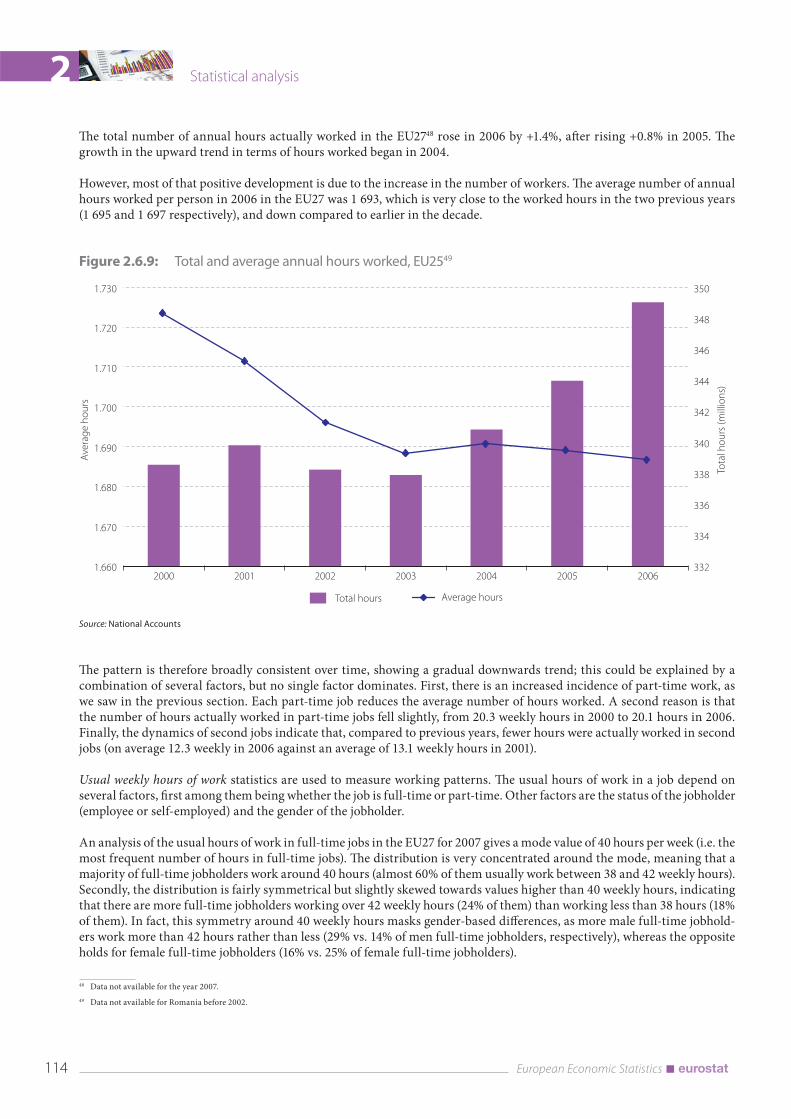
114 European Economic Statistics
The total number of annual hours actually worked in the EU2748 rose in 2006 by +1.4%, after rising +0.8% in 2005. The growth in the upward trend in terms of hours worked began in 2004.
However, most of that positive development is due to the increase in the number of workers. The average number of annual hours worked per person in 2006 in the EU27 was 1 693, which is very close to the worked hours in the two previous years (1 695 and 1 697 respectively), and down compared to earlier in the decade.
Figure 2.6.9: Total and average annual hours worked, EU2549
Total hours Average hours
Tota
l ho
urs
(m
illio
ns)
Ave
rag
e h
ou
rs
1.660
1.670
1.680
1.690
1.700
1.710
1.720
1.730
332
334
336
338
340
342
344
346
348
350
2000 2001 2002 2003 2004 2005 2006
Source: National Accounts
The pattern is therefore broadly consistent over time, showing a gradual downwards trend; this could be explained by a combination of several factors, but no single factor dominates. First, there is an increased incidence of part-time work, as we saw in the previous section. Each part-time job reduces the average number of hours worked. A second reason is that the number of hours actually worked in part-time jobs fell slightly, from 20.3 weekly hours in 2000 to 20.1 hours in 2006. Finally, the dynamics of second jobs indicate that, compared to previous years, fewer hours were actually worked in second jobs (on average 12.3 weekly in 2006 against an average of 13.1 weekly hours in 2001).
Usual weekly hours of work statistics are used to measure working patterns. The usual hours of work in a job depend on several factors, first among them being whether the job is full-time or part-time. Other factors are the status of the jobholder (employee or self-employed) and the gender of the jobholder.
An analysis of the usual hours of work in full-time jobs in the EU27 for 2007 gives a mode value of 40 hours per week (i.e. the most frequent number of hours in full-time jobs). The distribution is very concentrated around the mode, meaning that a majority of full-time jobholders work around 40 hours (almost 60% of them usually work between 38 and 42 weekly hours). Secondly, the distribution is fairly symmetrical but slightly skewed towards values higher than 40 weekly hours, indicating that there are more full-time jobholders working over 42 weekly hours (24% of them) than working less than 38 hours (18% of them). In fact, this symmetry around 40 weekly hours masks gender-based differences, as more male full-time jobhold-ers work more than 42 hours rather than less (29% vs. 14% of men full-time jobholders, respectively), whereas the opposite holds for female full-time jobholders (16% vs. 25% of female full-time jobholders).
48 Data not available for the year 2007.
49 Data not available for Romania before 2002.
2 Statistical analysis

115 European Economic Statistics
Figure 2.6.10: Usual weekly hours EU27, 2007
Part-time jobs Full-time jobs
0%
10%
20%
30%
40%
50%
60%
70%
<7 8-12 13-17 18-22 23-27 28-32 33-37 38-42 43-47 48-52 53-57 58-62 63-67 68-72 >73
Source: EU LFS
For part-time jobs, the most frequent number of usual weekly hours worked is 20 hours. Only 27% of part-time workers are in this mode group (i.e. those usually working 18-22 hours per week) whereas, in the case of full-time workers, 58% of workers are in the corresponding mode group of 38-42 hours per week. Linked to this, the distribution of hours worked in part-time jobs is in the form of a bell curve, with longer tails than the distribution of hours in full-time jobs, showing that proportionally more part-time jobholders work a few hours more or less than the mode value. This indicates a wide range of length of working time for part-time jobs compared to the mode for full-time jobs, where there is a much narrower spread. There are gender differences in the distribution of usual hours worked in part-time jobs too: more women part-time jobholders work more than 23 hours (39% of them) than less than 17 hours (33%). Note that the distribution above or below the mode is the opposite of that observed in full-time jobs. For men, the distribution of usual hours of work is fairly sym-metrical: 39% of male part-time jobholders work less than 17 hours, whereas 36% work more than 23 hours.
BOX 2.6.2: LABOUR FORCE SURVEY VS. NATIONAL ACCOUNTS
LFS and National Accounts are the two main sources of employment data. Although they use common definitions (see
previous box), LFS and National Accounts have their own aims and measurement approaches, which may lead to dif-
ferent results.
The LFS is a sample survey of households. The survey focuses on employment and unemployment, but another 100 or
so variables are also collected, including: gender, age, educational level attained, features of each job held, occupation,
hours worked etc. The LFS is unique in providing social breakdowns and interrelations of employment/unemployment
with other variables, mostly demographic and social.
National Accounts is a conceptual framework comprising definitions, classifications, variables and presentational ar-
rangements, compiled by comparing and combining all the relevant data sources available in the country. This is a key
feature of National Accounts: it enables the best to be taken from each source, increasing coherence and obtaining a
more comprehensive result. This integration is performed differently in each country. Whenever LFS is used in National
Accounts, some alignments of scope are needed prior to any integration, the main ones being:
– Different geographical coverage. Geographical coverage can either follow the domestic concept of employment
(i.e. employment in resident production units) or the national concept (i.e. resident workers). ESA95 uses more
Statistical analysis 2

116 European Economic Statistics
frequently the domestic concept of employment as this allows putting it in relation to GDP. For its part, LFS gives
information on the national concept. Adjustments for cross-border workers are needed in order to transform one
concept into the other.
– Other coverage issues: LFS excludes persons below 16 years old from the definition of employment. For their part,
National Accounts do not exclude individuals from employment on the basis of age. LFS leaves the following out
of its scope: persons living in institutional households, staff of national embassies working abroad and crews of
national fishing boats.
Because of those scope alignments, plus the integration of LFS with other sources (in countries where this is done),
National Accounts employment is different from LFS. The policies on revision of the two statistics may also highlight
the differences.
All in all, National Accounts are judged more suitable to measure employment levels, employment growth and in-
dustry breakdowns. LFS is more appropriate for measuring participation in the labour market (i.e. employment rates,
activity rates, flows between employment and unemployment, etc.), demographic or social breakdowns (e.g. by age,
gender or educational level) and it is more suitable for socio-demographic studies.
More details about differences between National Accounts employment and LFS can be found in the Eurostat LFS
metadata pages, under section 3 here:
http://circa.europa.eu/irc/dsis/employment/info/data/eu_lfs/LFS_MAIN/LFS/LFS_COMPARABILITY.htm
2.6.4 Unemployment rates
Consistent with the positive outlook for employment, 2007 was a good year for unemployment. The average EU27 unem-ployment rate dropped further to 7.1%, down from 8.1% in 2006 and 8.9% in 2005 (see definition of unemployment rate in box 2.6.1). Indeed, 2007 saw the strongest decrease in unemployment in Europe in recent years. Unemployment fell in every Member State, which is remarkable. The biggest shrinkage in unemployment was in Poland (falling by 4.2pp), Slovakia, Bul-garia and Czech Republic. Slovakia and Poland are still suffering from the highest unemployment rates in the EU, in spite of the improvement in 2007 and in previous years. Since 2002, when unemployment peaked in Europe, the best progress has been seen in Bulgaria (down from 18.1% to 6.9%) and in Poland (down from 19.9% to 9.6%).
Figure 2.6.11: Unemployment rates 2007
0.0%
2.0%
4.0%
6.0%
8.0%
10.0%
12.0%
NL DK CY LT AT IE EE LU SI UK CZ LV IT SE MT RO BG FI EU27
EA13
HU BE PT GR ES FR DE PL SK HR TR * NO
Source: EU LFS
2 Statistical analysis

117 European Economic Statistics
In 2007 the unemployment rate for women also showed a positive movement in the EU27, down to 7.8% from 8.9% in 2006. Poland reported the best improvements for female unemployment (which fell by 4.6pp), followed some way behind by Czech Republic, Bulgaria and Slovakia, all around 2pp. On average, the gender gap between unemployment of women and men decreased slightly to 1.2pp, from 1.3pp in 2006 (female unemployment was higher). It narrowed significantly in Lux-embourg, falling by 1.0pp in 2007, and also in Estonia (down 0.9pp) and Spain (down 0.8pp), although it widened in other Member States, mostly in Germany (+0.6pp) and Portugal (+0.5pp). Since 2002, the largest decreases in gender disparities in the unemployment rate were reported in Spain (-3.1pp), Italy (-1.8pp) and Greece (-1.2pp):
Table 2.6.2: Unemployment rates, gender differences (pp)
2002 2007 Improvement
Spain Men 8.1 6.4
Women 15.7 10.9
Difference 7.6 4.5 3.1
Italy Men 6.7 4.9
Women 11.5 7.9
Difference 4.8 3 1.8
Greece Men 6.8 5.2
Women 15.6 12.8
Difference 8.8 7.6 1.2
Source: EU LFS
In 2007, there were also improvements for young unemployed persons and the long-term unemployed. The EU27 average unemployment rate of young people (aged 15-24) fell sharply from 17.1% in 2006 to 15.4% in 2007. This is a remarkable im-provement after a peak of 18.4% in 2004. Long-term unemployment is also down to 3.0% from 3.7% and has seen a sustained improvement since 2004.
Figure 2.6.12: Unemployment of specific groups, EU27
Young persons (aged 15-24) Long-term (12-months or more)
You
ng
pe
rso
ns
Lon
g-t
erm
12.0%
13.0%
14.0%
15.0%
16.0%
17.0%
18.0%
19.0%
2.0%
3.0%
4.0%
5.0%
6.0%
7.0%
8.0%
9.0%
2000 2001 2002 2003 2004 2005 2006 2007
Source: EU LFS
Statistical analysis 2


Methodological articles


121 European Economic Statistics
3.1 Updating statistical methodology
One of the key attributes of economic statistics is that they are comparable across countries, and that these countries adopt best practices in statistical compilation. In this sense, the work of statisticians in defining, promulgating and maintaining common methodological standards across countries is of vital importance.
The following two articles describe the ongoing work of updating statistical methodology in two central macroeconomic datasets — national accounts (the System of National Accounts and the European System of Accounts) and Balance of Pay-ments and International Investment (BPM6). Both articles show the extensive investment and cross-country collaboration which is taking place to allow these reference texts to be renewed, so that they continue to be relevant and compilable in a changing world.
One might also draw attention to the interdependence between economic datasets. National accounts draw extensively on balance of payments as source data, as they draw on other economic databases (for example consumer prices). Datasets may be used together, as illustrated later in the article on European sector accounts for national accounts and balance of pay-ments statistics. The work on individual economic datasets cannot, and does not, take place in isolation — hence the close overlap between the exercises described below.
Statisticians must nevertheless take account of the impact of methodological revisions on the statistics available to users, notably on the comparability of data over time, and the articles seek to describe the main areas where planned revisions would impact the statistics.
Methodological articles 3

122 European Economic Statistics
3.1.1 Update of the SNA 1993 and revision of ESA 95
Christian RavetsEurostat, National accounts: methodology and analysis
The national accounts are a complete system of macroeconomic accounts and are a key input into economic analysis and policymaking. International comparability is extremely important for these statistics and therefore the development of related methodological standards, and their implementation, must proceed in a coordinated fashion. This is particularly relevant in Europe, where national accounts figures are also used for administrative purposes.
As one of the five international organisations in charge of the world-level System of National Accounts (SNA 1993), Eurostat is actively participating in its update process.
At the same time, Eurostat has started the process of revising the European System of Accounts (ESA 95), which is the European version of the SNA 1993.
Update of SNA 1993
Background and process of review
In 2003, the UN Statistical Commission called for an update of the SNA 1993 to bring the accounts into line with the new economic environment, advances in methodological research, and user needs. The Commission stipulated that the update not recommend fundamental or comprehensive changes to the SNA 1993, and identified consistency with related manuals such as the Balance of Payments Manual as an important consideration.
The Inter-secretariat Working Group on National Accounts (ISWGNA) — comprising Eurostat, the International Mon-etary Fund, the Organisation for Economic Cooperation and Development, the United Nations, and the World Bank — was mandated to coordinate and manage the update project.
The Statistical Commission emphasised the need for transparency in the update project and the broadest possible involve-ment of the global statistical community. In line with this emphasis, an Advisory Expert Group (AEG), including 20 coun-try experts from all regions of the world, was established in 2003 to take a key role in the update. Proposals for change, for the most part, have come from standing and short-term expert groups. The single most important tool to promote transpar-ency and wide involvement in the update is the project website at http://unstats.un.org/unsd/nationalaccount/snarev1.asp, maintained by the United Nations Statistics Division.
Reaching agreement on recommendations
The ISWGNA, with the help of the AEG, identified a list of 44 substantive issues to be considered, endorsed by the Statisti-cal Commission and posted on the project website. By its fourth meeting (January-February 2006), the AEG had agreed on recommendations on almost all points of the issues before it.
The ISWGNA then engaged in an in-depth review of country comments on these recommendations. This review provided input into the preparation of the full set of consolidated recommendations agreed by the UN Statistical Commission in early 2007.
Two volumes
The new SNA will be provided in two volumes. Volume 1, to be published in 2008, is the full set of chapters that represent the SNA framework in terms of accounting conventions, the accounts, and the integration of the accounts. Volume 2 will comprise mainly the interpretation of the accounts and various extensions such as satellite accounts, and will be published in March 2009.
3 Methodological articles

123 European Economic Statistics
Outcome of the UN Statistical Commission discussion on the SNA update (26-28 February 2008)
The Statistical Commission accepted the proposal in the ISWGNA report to the Commission that Volume 1 of the updated SNA be approved in principle, but with an extra two months being allowed for countries to comment on the revised draft chapters. As a result, the evaluation period for Volume 1 has been extended until 30 April.
The UNSC mandated the ISWGNA to proceed with the finalisation and publication of volume 1, after advising the Bureau of the Commission, in pre-edit electronic and paper versions, taking into account the substantive observations made during the two months review period.
The UNSC requested that the ISWGNA takes appropriate measures to ensure that volume 2 of the updated 1993 SNA is duly completed and presented for adoption to UNSC in 2009.
The UNSC also requested the ISWGNA to present a strategy for the implementation of the updated 1993 SNA, reflecting the need for regional and sub-regional coordination given the different levels of statistical development, and elaborate on the advocacy strategy to engage users, especially those engaged in policy formulation and analysis.
Preparation of Volume 2 of the updated 1993 SNA
Key points in the timetable for this year are:
Until July, drafts of the chapters of Volume 2 will progressively be posted for countries’ comments.
Mid-September will be the deadline for comments on the last draft chapter(s).
The revision of Volume 2 chapters will be finalised at the end of October.
In mid-December, the revised Volume 2 will be ready for submission to the UNSC meeting (24-27 February 2009).
Implementation of the SNA
From available information it is clear that most countries worldwide will implement the updated SNA 1993 between 2009 and 2014. In Europe (as described below) the revised ESA, based on the updated SNA 1993, will be implemented in 2014. Major countries outside Europe will generally implement the updated SNA 1993 a little earlier than this; in 2009, the US, Canada and Australia will be the first countries to implement the updated system.
Main recommendations
Changes in the structure and functioning of economies since the SNA 1993 was completed have led to the need to review certain important issues. It was also felt necessary to better harmonise the SNA 1993 with other macroeconomic manuals, and to deal with some questions left open when the SNA 1993 was finalised.
The update recommendations involved all parts of the SNA, in particular the treatment of non-financial assets, financial instruments, stocks and flows characteristics of economic globalisation, government and the public sector.
Major changes in the updated SNA 1993 are the following:
Pension schemes
Defined benefit schemes
Under the SNA 1993, the actual social contributions represent the amount actually paid into a pension fund. If the contri-bution is pre-defined, but not the pension payment (defined contribution scheme), this treatment is correct.
But if the contribution is not pre-defined, and the pension payment is pre-defined by a formula (defined benefit scheme), the amounts set aside by the employer in the scheme may not match the liability to the employees.
Methodological articles 3

124 European Economic Statistics
The revised SNA will take into account these particularities of defined benefit schemes, on the basis of actuarial calculations.
Unfunded government employer schemes
The case of unfunded government employer schemes was much debated, because countries have different institutional ar-rangements.
In 2005, the Advisory Expert Group supported the recommendation of the IMF Task Force on pensions to include the liabilities of unfunded pension schemes in the core accounts of the revised SNA, while recording the liabilities of social security pension schemes in supplementary tables outside the core accounts. This treatment would, in particular, entail a sharp increase in many countries’ government liabilities.
There have been some divergences of opinion between countries worldwide on the recommendation to include liabilities of all unfunded employer schemes in the “core” national accounts. In particular, the position of European countries was that the diversity of administrative arrangements means that it is difficult and not particularly meaningful to separate unfunded government employers’ pension schemes from social security schemes.
The international statistical organisations have formulated a compromise which involves introducing some flexibility as to which kind of pension liabilities are recorded in the core national accounts, whilst requesting all countries to complete a new supplementary table with full details of all pension schemes.
The updated SNA 1993 will recommend filling in a standard supplementary table, which has been defined by a Eurostat/ECB Task Force, which will show the pension entitlements of households for all pension schemes. Internationally agreed criteria will be developed to indicate whether the pension entitlements corresponding to unfunded government employer schemes have to be included or not in the core accounts.
Impacts on the accounts
The recording as liabilities of defined benefit pension schemes in the core accounts will generally lead to increased recorded assets of households and increased liabilities for the pension schemes (which are recorded as corporations, either separate financial corporation units or with the employer as non-financial corporations or non-profit institutions serving house-holds), with employers’ imputed social contributions (as part of employee compensation) increasing. For government data, the impact will depend on which defined benefit pension schemes’ liabilities are recorded in the core national accounts, but if some schemes are so classified the liabilities of government would increase and, generally, government compensation of employees and (by convention) government output would increase.
The standard supplementary table, to be implemented by all countries, is expected to provide a useful source for economic analysis of pensions and will provide the basis for deriving comparable data across countries, irrespective of the application in different countries of the flexibility of recording government pension schemes.
Cost of capital services
Capital services for assets used in market production are implicitly included in the SNA 1993 but are not separately iden-tified. Given the importance of identifying them for productivity measurement and other analysis, a new chapter will be added to the SNA 1993 Rev 1 explaining the role and appearance of capital services in the system and stressing the desir-ability of calculating capital services, capital stock and consumption of fixed capital in an integrated and consistent manner. No changes will be made to standard entries in the accounts to show capital services but an explanation will be provided of how supplementary items or tables could be derived and presented.
The AEG had recommended also including in the value of government output a return to capital on non-financial assets used in non-market production. The non-market output being valued at the sum of costs, this would have increased GDP. However, this recommendation was not approved by many countries, particularly in Europe. Given the difference between non-market and market production, this recommendation will not be included in the updated SNA 1993.
3 Methodological articles
125 European Economic Statistics
Impacts on the accounts
As it was considered inappropriate to price capital used by government in its production of goods and services by including the rate of return to capital in addition to depreciation, the core accounts will not be affected.
Research and development
The SNA 1993 does not recognise research and experimental development as capital formation, despite the fact that it is thought to make a major contribution to future economic growth. The result is that GDP is underestimated.
According to the AEG recommendation, the SNA 1993 should be changed to recognise the outputs of R&D as assets and the acquisition, disposal and depreciation of R&D fixed assets should be treated in the same way as other fixed assets. The recommendation, as reformulated by the ISGWNA, is the following: R&D should be treated as capital formation and its value should be determined in terms of the economic benefits it provides. In principle, R&D that does not provide an eco-nomic benefit to its owner does not constitute a fixed asset and should be treated as intermediate consumption. Because it is difficult to quantify the benefits of R&D, by convention, it may be valued at the sum of costs.
The AEG agreed to use the definition of R&D provided by the Frascati Manual (OECD Manual on Proposed Standard Practice for Surveys on Research and Experimental Development), with the clarifying explanation that this does not imply that human capital is treated as an asset in the SNA.
Some research is still needed in this context. In practice, research and development expenditure should be recognised as part of capital formation. However, recognising the difficulties to be overcome before this objective can be reached, satellite accounts will provide a useful way of working towards solutions that give the appropriate level of confidence in the resulting measures, and their international comparability.
The SNA 1993 Rev.1 will describe the objective and recognise that for many countries implementation in the core accounts will take time.
Impacts on the accounts
The capitalisation of research and development in the core accounts will be a major change from the point of view of quan-titative impact on GDP: as this expenditure will no longer be treated as intermediate consumption, it will no longer be deducted in the calculation of the value added of the corresponding sectors. The impact on GDP can be roughly estimated as between 1.5 and 2%.
Military expenditures
The present SNA distinguishes military acquisitions of offensive weapons and their means of delivery (treated as intermedi-ate consumption regardless of their life length) from other military acquisitions (treated as capital formation). This treat-ment does not correspond to the economic reality if weapons are used and even exported after several years.
Considering that destructive weapons have investment characteristics, the AEG recommendation is to treat as capital for-mation all expenditure by the military which meets the definition of being used in production over a period in excess of one year, regardless of the nature of the expenditure or the purpose intended for it. All equipment will be treated as fixed capital formation except for consumables, which will be treated as inventories. Separate items will identify weapons systems within fixed capital formation and military inventories apart from other inventories.
The required figures for national accounts purposes would be aggregate and not at a level of detail that would create prob-lems for military secrecy.
Impacts on the accounts
Since government output is measured, by convention, as the sum of costs (including consumption of fixed capital), govern-ment value added will increase by an amount equal to this consumption of fixed capital. The impact of the capitalisation
Methodological articles 3

126 European Economic Statistics
of destructive military weapons on GDP (equal to the consumption of fixed capital50 of these weapons) will differ greatly among countries; an average increase of around 0.5% of GDP is a first rough estimate.
Goods for processing
The SNA 1993 and the fifth edition of the Balance of Payments Manual treat goods that are sent abroad for processing and then returned to the country from which they were dispatched as exports for their full value when they leave the first coun-try and in imports when they return to it.
The fundamental question addressed by the review was whether recording of imports and exports should follow a change of ownership recording or that of physical movement. The recommendation is for the former; that is, for recording on a change-of-ownership basis. This is a change from the SNA 1993. This recommendation recognises that many goods move from one country to another without entailing a consequential payment from the recipient country to the sending country. In the revised SNA, net figures of processing services will be substituted to gross figures of export of goods for processing and subsequent re-import or vice-versa.
The consequences affect the recording of transactions both in the national economy and in international transactions. The decision to record on a pure change of ownership basis implies that no transactions will be recorded for intra-enterprise (in-ter-establishment) deliveries when goods are passed from one establishment to another for processing and then returned. Therefore, input-output tables will reflect what each unit contributes to the production process rather than the physical technology, as was previously the case.
Also, the physical movements of goods, captured in merchandise trade statistics, have to be reconciled with the interna-tional flows to be recorded in the balance of payments and the national accounts.
Impacts on the accounts
In the light of globalisation, goods for processing will no longer inflate both imports and exports figures, which is important for international trade analysis.
Some examples of other important recommendations
– Employee stock options: guidance is provided to permit further harmonisation with international business accounting standards;
– non-life insurance: the calculation of output is reconsidered to avoid its volatility;
– contracts, leases and licences: the updated SNA sets out the principles of appropriate treatment corresponding to the different possible arrangements;
– borderline between withdrawal of owner’s equity and dividends; concept of “super dividends”;
– exceptional payments between government and public corporations and quasi-corporations: treatment has been redefined.
Revision of ESA 95
Eurostat has started to revise the European System of Accounts (ESA 95), the European manual of national accounting based on the SNA 1993. The new ESA should continue to be the appropriate methodological reference for producing the high-quality national accounts data required to support economic policymaking and the implementation of major EU poli-cies. Revision will also provide an opportunity to further improve the standards of ESA 95 and target them more better to the various uses in the EU. A more integrated system will be developed, to the largest possible extent.
50 This is the national accounts term for a concept similar to depreciation in business accounting.
3 Methodological articles

127 European Economic Statistics
Specificities of ESA 95 and needs for change
The purpose of ESA 95 as defined in Article 1 of Council Regulation (EC) No 2223/96 of 25 June 1996 on the European system of national and regional accounts in the Community is to provide:
– a) a methodology on common standards, definitions, classifications and accounting rules intended to be used for com-piling accounts and tables on a comparable basis for the purposes of the Community;
– b) a programme for transmitting, for Community purposes and on precise dates, the accounts and tables according to ESA 95.
ESA 95 is an essential tool at European level, used for major administrative purposes (e.g. own resources, the excessive deficit procedure, structural funds) and for analysis of the coordination and convergence of Member States’ economic policies.
To achieve the objectives set by the Treaty on the European Union, in particular economic and monetary union, ESA pro-vides EU institutions, governments and economic and social operators with a set of harmonised and reliable statistics on which to base their decisions.
ESA 95 is broadly consistent with the current international System of National Accounts (SNA 1993) as regards definitions, accounting rules and classifications. There are nevertheless some differences, particularly in its presentation, which is more in line with its use with the European Union. This specific use in fact requires greater accuracy in definitions, classifications and accounting rules.
Unlike the SNA, the ESA is based on a Regulation laying down binding rules to ensure comparability at EU level and a compulsory data transmission programme. Where the SNA is flexible and offers several options, ESA generally chooses one particular option to achieve more consistency at EU level.
ESA 95 constitutes a version of the SNA adapted to the structures of the Member States’ economies and must follow the layout of the SNA to the greatest possible extent so that the European Union’s data are comparable with those compiled by its main international partners.
Scope of revision
The revision of ESA 95 will decide the national accounts standards and the ways in which key economic aggregates are calculated in the EU for many years.
The starting point will be the consolidated text, i.e. the text of (EC) Council Regulation No 2223/96 of 25 June 1996 as amended by several regulations concerning:
– the allocation of FISIM
– the definition of general government expenditure and revenue
– taxes and social contributions unlikely to be collected
– the reclassification of settlements under swaps and forward rate arrangements
– the revised classification of expenditure according to purpose
– the use of ESA95 in the determination of Member States’ payments to the VAT based own resources
– transmission of data.
The revision will also cover all the recommendations and clarifications agreed at international level and included in the updated SNA 1993.
Methodological articles 3

128 European Economic Statistics
The project will affect many statistical areas linked to national accounts, both at Eurostat and in each National Statistical Institute: research and development, environmental, agricultural and tourism accounts, population, labour and social pro-tection statistics, balance of payments, etc.
Presentation of ESA 95
The current presentation and clarifications of ESA will be kept:
a) In ESA, there are separate chapters on transactions in products, distributive transactions and financial transactions. By contrast, in the SNA these transactions are explained in several chapters arranged by account.
b) ESA describes a concept by providing a definition and a listing of what is included and what is excluded. The SNA de-scribes concepts in more general terms and endeavours also to explain the rationale behind the conventions.
c) ESA adds specific clarifications (e.g. 50% rule for the market/non-market split; method of allocating FISIM; thresholds for the GFCF/intermediate consumption split, etc.).
Two important issues
Research and Development
There is a consensus among EU countries that work should be continued by means of a Task Force and in close coopera-tion with the OECD. The objective of introducing compulsory supplementary tables on R&D in the new ESA Regulation is strongly supported; this will make it possible to address the difficulties and to create the necessary basis to achieve the long-term objective of including research and development in the core national accounts.
Pension schemes
The recommendations of the ECB/Eurostat Task Force on pensions will be implemented in such a way that comparability of Member States’ national accounts is ensured, including guidelines for the distinction between unfunded government pension schemes that should be recorded in the core accounts and those that should not.
Changes in existing chapters and new chapters
For most existing chapters, the structure of ESA 95 will be kept (or only slightly amended), as it will continue to follow the classification of sectors (Chapter 2), flows (Chapters 3 to 6), assets (Chapter 7), and accounts (Chapter 8), and to present the different types of leases, licences, contracts, insurance and pensions (Chapters 15, 16 and 17) or population concepts (Chapter 11). Chapter 14 on FISIM will present the details of the method of allocation.
Three existing chapters will be more detailed in the new ESA.
– The input/output framework (Chapter 9), whilst maintaining a structure similar to the current one, will be more de-tailed and cover the supply table, the use table, valuation, imports, the supply and use tables as an integral part of na-tional accounts, symmetric input/output tables and the price issue.
– The chapter on quarterly economic accounts (Chapter 12) will focus on the scope and coverage of quarterly economic accounts, compilation and sources, consistency with annual accounts (including revisions), volume measures in quar-terly economic accounts, seasonal adjustment and calendar effect correction.
– The chapter on regional accounts (Chapter 13) will cover the scope and coverage of regional accounts and will explore specific regional issues like the treatment of FISIM, the methodology for the transition from GVA to GDP, the method-ology for calculating real growth rates of regional GDP, clearer prioritisation of methods for regionalisation, and more details on specific industries and ancillary units.
3 Methodological articles

129 European Economic Statistics
The provisional structure for the new chapters is as follows.
– The chapter on fundamental principles of national accounts will be an introduction to the system with a general objec-tive of presenting the different basic concepts and structures of national accounts. This presentation will help users to understand how national accounts can give them a clear picture of what is happening in the economy.
– The chapter on links between business accounts and national accounts: the chapter will first present the main general principles of business accounts and of the transition between business accounts and national accounts, and then will explain how these principles can be applied in specific cases.
– The chapter on European accounts will introduce the objective and scope of European accounts and the particularities of their compilation including EU institutions, the treatment of the rest of the world, the aggregation and balancing is-sue, and consistency with sources and with other European macroeconomic statistics.
– The chapter on the rest of the world accounts will present the concept of residence, the general accounting rules, the external accounts of goods and services and of primary incomes and current transfers, external accumulation accounts and the relationship with balance of payments accounts.
– The chapter on government accounts will present the basic principles concerning the delimitation of the general govern-ment sector, the relations between the government and public corporations, accounting issues related to government and corporations, and government net lending/borrowing and its relationship with government debt.
– The chapter on satellite accounts will present a common framework for functionally oriented satellite accounts, with a particular focus on satellite accounts to be included in the core accounts in the medium or long term (research and development). Satellite accounts for which a fairly complete, agreed and operational methodological framework has already been developed will also be presented briefly, with a reference to the specialist manuals: Economic Accounts of Agriculture (EAA), Economic Environmental Accounts (SEEA 2003), and Social Protection (ESSPROS).
Review process
To ensure the success of such a project, an evaluation report on the implementation of ESA 95 in the EU is needed. The evaluation report would identify weaknesses and the improvements required to implement ESA95. This is a way to analyse what has to be done to ensure optimal implementation.
An impact assessment of the introduction of the new ESA will be carried out with respect to both resources and the impact on main aggregates, notably GDP, GNI and other key indicators such as government deficit and debt. The results of the im-pact assessment will help, at EU and at national level, to identify the human and financial resources needed to successfully complete the project.
National financial accountants from European countries (both from statistical institutes and central banks) will naturally be closely involved in the revision process. A publicly accessible website is being set up to provide a forum for comments from statisticians and also users of the accounts as the drafting process proceeds in 2008.
The current timetable for the revised ESA is that it will be completed and proposed (as a legal instrument) in 2009, with adoption of the final text expected in 2011. European countries are committed to implementing the revised ESA by 2014, when complete datasets including historical series will be available to users.
Methodological articles 3

130 European Economic Statistics
3.1.2 The Balance of Payments and International Investment Manual (BPM6)
Robert Heath and Robert DippelsmanStatistics Department, International Monetary Fund
Introduction
International standards for balance of payments statistics have been a priority for the Fund from its earliest days. The first edition of the Balance of Payments Manual was released by the Fund in January 1948. The latest is the fifth edition (BPM5), released in 1993.
Preparation of a sixth edition of the Balance of Payments and International Investment Position Manual (BPM6) is now well under way and is planned to be finalised by end-2008. Like its predecessors, it provides guidance for compilers on produc-ing statistics to internationally agreed standards. As a result, basic variables for the external sector such as the current ac-count balance and reserve assets can be reported by member countries in an internationally comparable way.
Background
The new manual is the culmination of several years work by the IMF’s Statistics Department in collaboration with compil-ers and other interested parties. The project was initiated in the early part of this decade by the IMF Committee on Balance of Payments Statistics (Committee), which meets annually, has broad geographic national representation, and was created by the Fund to advise it on balance of payments statistics. The project involved extensive consultation with data users, in-cluding those within the Fund. As well, national statistical compilers were involved with specialized expert groups51 and took advantage of opportunities to comment on disseminated papers and material on a dedicated internet site. An Anno-tated Outline, released in 2004, proposed general directions and sought feedback on a range of questions.
Guiding principles
There were three guiding principles in preparing BPM6.
First, the basic framework for the balance of payments data in BPM5 is retained in BPM6, and so the changeover to BPM6 is likely to be less significant for countries than from BPM4 to BPM5. Nonetheless, the new manual brings increased elabora-tion and some changes in concepts, presentation, and emphasis. The sixth edition will be about twice as long as BPM5, in response to requests for more conceptual explanation and more detail on specific cases.
Second, the revision was undertaken to coincide with the update of the System of National Accounts (SNA), thereby main-taining and enhancing the harmonisation with national accounts statistics that was introduced in BPM5.52
The work programmes of the Committee and of the relevant groups revising the SNA were closely coordinated, not least in the production of issues papers. So, for instance, a decision to regard research and development (R&D) output such as pat-ents and copyrights as produced assets means that sales of R&D are included in services in BPM6, rather than in the capital account as non-produced assets as in BPM5.
There are also some changes to bring BPM6 closer to the SNA. These include renaming the “income” and “current transfers” categories “primary income” and “secondary income,” replacing the monetary authorities sector with the central bank sec-tor, and introducing a new category of rent for use of natural resources. Similarly, there are to be some changes in the SNA to bring it into line with the BPM, such as taking closer account of reinvested earnings on direct investment. The relationship between the SNA and international accounts is set out in Chapter 2 of BPM6.
51 There were four technical expert groups: Direct Investment (DITEG), Reserve Assets (RESTEG), Currency Unions (CUTEG), and other balance of payments issues (BOPTEG). As well as national compilers, representatives from international agencies also participated. The issues and outcome papers produced by these groups are posted on the IMF’s external website.
52 The harmonization of macroeconomic statistics is elaborated in The System of Macroeconomic Accounts Statistics: An Overview (Statistics Department, IMF Pamphlet Series No. 56).
3 Methodological articles

131 European Economic Statistics
Third, BPM6 adopts advances since 1993 in methodology that were included in other guides and manuals, such as the Monetary and Financial Statistics Manual (2000), the Government Finance Statistics Manual (2001), the External Debt Guide (2003), and the Guidelines for a Data Template (2001). In turn, these manuals and guides will be revised to maintain harmonisation among the major macroeconomic datasets.
Presentation of BPM6
BPM6 has 14 chapters and a series of appendices. It states general principles that are intended to be applicable in a wide range of circumstances. It also applies the principles to some specific topics that have been identified as needing additional guidance.
After the introductory chapters, like BPM5, BPM6 starts with basic principles. Two chapters include a detailed discussion of accounting principles, economic territory, units, residence, and institutional sectors and sub-sectors—in particular, com-pared with BPM5, there is more discussion of the financial sector.
Thereafter the structure of BPM6 is significantly reorganized from BPM5 to take account of the increasing importance of financial flows and stocks in analyzing external stability, as highlighted in the 2007 Surveillance Decision adopted by the IMF Executive Board. There is greater prominence given to positions, as discussed ahead, and “other flows,” highlighting the relevance of analysing holding gains and losses. Chapters 5 to 9 and the title of the Manual reflect this emphasis.
The current account is covered in Chapters 10 to 12, covering the same ground as Chapters 10 to 15 in BPM5. On services, there was close cooperation with the Interagency Task Force on Trade in Services in developing the methodology. The capi-tal account is covered in Chapter 13 (Chapter 17 in BPM5), and Chapter 14 discusses selected issues in the analysis of the international accounts (Appendix V in BPM5).
The appendices bring more detail on exceptional financing and debt reorganization than in BPM5. Supplementary infor-mation showing the benefits arising from concessional debt as one-off transfers at the point of loan origination is included, calculated as the difference between the nominal value of the debt and its present value using a relevant market discount rate. Further, although arrears are to be recorded as part of the value of the instrument and not as a separate transaction in the financial account, an exception is made in the analytical presentation53 given the relevance of arrears to the concept of exceptional financing.
The topical summary appendices bring together in one place issues relating to direct investment, insurance, and financial leases that are discussed across different chapters of BPM6. Appendices on “multinational enterprises” and “remittances” explain datasets that are related to those set out in BPM6. Remittances include the new concept of personal transfers that is replacing “workers’ remittances” in the balance of payments.54
An appendix on currency and other economic unions is introduced. A currency union and its economic territory are defined, the currency union central bank is recognized as an institutional unit, and various aspects of recording that are special to currency and economic unions are described.
Another appendix sets out the detailed changes between BPM6 and BPM5, while the standard components and additional position data tables are provided as the final appendix, not least so that it is easy to find.
Major themes
BPM6 reflects changes that have occurred in the global economy since 1993. This period has been characterized by a sig-nificant growth in cross-border activity and policy challenges arising from increased financial flows. So consequently, globalization, financial innovation, and the balance sheet approach are major themes that underlay many of the detailed changes made in BPM6.
53 The analytical presentation includes the concept of exceptional financing, with the relevant transactions reclassified from that shown in the standard components.
54 Personal transfers comprise all transfers in cash or in kind made or received by resident households to or from other nonresident households.
Methodological articles 3
132 European Economic Statistics
Globalization
The statistical implications of globalization have been a major focus of BPM6, as global goods and financial flows have grown substantially in recent years.
After extensive discussion, there is a revised treatment of outsourced processing (so-called goods for processing), which will better reflect the actual flows and identify this activity separately. In BPM6, the fees received by economies for processing goods that have not changed ownership, and so are not owned by the entity undertaking the processing, are to be recorded as service earnings.55 For those economies that are very active in outsourced processing activity, there could be a significant change in their trade balances arising from the introduction of BPM6, and possibly the current account. This is because the inward and outward flow of processed goods recorded gross in the trade account in BPM5 are recorded at the value of the processing fee in services under BPM6.56 Also, repairs on goods are to be classified as a service not goods.
Using the same principles, merchanting activity, where a resident transacts in goods (buys then sells) with nonresidents outside of the domestic economy, is to be classified under goods transactions within exports; so imports of goods under merchanting are classified as negative exports. In BPM5 merchanting is recorded as a service transaction.
In a world of increasingly mobile individuals there are several modifications included in BPM6. The residence of households is to be based on “predominant center of economic interest,” while cross-border movements of personal effects during migration are no longer to be recorded as transactions but as reclassifications, given that no transaction takes place. High value goods acquired by travelers, such as occurs in the activity known as “shuttle trade,” are to be recorded as merchandise goods rather than under travel services.
Within direct investment, elaborations are provided to identify direct investment relationships in complex multi-country company structures, which are becoming increasingly common. More generally, the 10 percent level for establishing a di-rect investment relationship is maintained, but with a focus on voting power; direct investment positions and transactions are to be recorded on a gross basis as assets and liabilities.
Identification of the residence and activities of special purpose entities (SPEs) and similar corporate structures with little or no physical presence are dealt with in detail. SPEs are to be classified as separate institutional units in the economy in which they are incorporated, a clarification of the residence principles in BPM5. Further, reflecting that governments may create special rules for certain entities or zones, so restricting the free flow of capital, goods and services within an economy, the definition of economic territory is modified to a territory under the effective economic control of a single government.
Financial innovation
Many of the issues raised by compilers and users concerned developments on financial markets. There is additional discus-sion of a range of topics identified as of increasing importance such as financial derivatives and employee stock options, which are now included together as separate category in the financial account. Also, the financial instrument classification is set out explicitly in Chapter 5, whereas in BPM5 the discussion was mixed in with the functional categories.
There is guidance on the treatment of short positions, when a trader sells a borrowed security, and on the related fees for borrowing the security—to be classified as interest regardless of whether the security is debt or equity. When securities are lent or provided under reverse transactions, ownership in the balance of payments is assumed not to have changed, as the risk and rewards of ownership remain with the original owner. For this and for other cases like goods under financial leases, the concept of “change of ownership” in BPM5 is modified to “change in economic ownership.”
55 The specific item in the services account is entitled “manufacturing services on physical inputs owned by others.”
56 The BPM5 treatment of goods for processing differed depending upon where the goods were subsequently sold. If the goods were sold to a resident of the economy undertaking the processing or to a resident of a third party economy, the processing economy recorded a service earnings, otherwise all goods for processing were recorded under goods account on a gross basis.
3 Methodological articles

133 European Economic Statistics
For index-linked instruments, a distinction is to be drawn depending on whether indexation has a holding gain motive (usually when based on a narrow index), or not (usually when more broadly based, such as with a consumer price index). For the former, the rate of interest accrual is to be fixed at issuance with any subsequent changes in value classified as holding gains and losses. Foreign currency indexed-linked debt with both principal and coupons indexed to a foreign currency is to be classified and treated as being denominated in that foreign currency.
Implicit financial services (FISIM) previously included in interest are to be recorded in services, as in SNA. The treatment in BPM5 of buy-sell margins on foreign exchange transactions as service earnings of financial intermediaries is extended to transactions in securities. Also, the measurement of insurance services is improved by reducing the impact of volatile insurance claims on their calculation.
Loans continue to be valued at nominal value in the position data, but a memorandum item is included for the creditor to show the likely realizable value. So-called standardized guarantees are to be treated in the same way as insurance, and the treatment of “one-off” guarantees is clarified.
Research into the gold market revealed that gold is commonly traded in accounts whereby the dealer has a claim for a certain quantity of gold to be delivered without having ownership over specific gold bullion. Such accounts, known as unal-located gold accounts, are to be classified as a deposit (or monetary gold if held in reserves). The consequence of this change and of the SDR allocation decision noted below, is that only gold bullion held in reserves will be an financial asset in the system without a counterpart liability.
In BPM6, primary income of investment funds is to include reinvested earnings, like direct investment.
In the area of reserves, the definition of liquidity — including the ability to sell the asset without unduly affecting the value — has been clarified and guidance is given on the treatment in reserves of assets held in pooled funds and in special purpose government funds, usually known as sovereign wealth funds.
Balance sheet approach
In response to increasing interest in balance sheet analysis, as noted above there is more emphasis on the international in-vestment position (IIP). Over the past decade, user interest in issues such as external debt and vulnerability has increased, and a growing number of countries are reporting IIP data to the Fund. As the graph shows, the number of reporters has tripled in the last ten years to well over one hundred. As a result of the shift in emphasis, the contents and title of the new manual include a reference to the IIP (although it is still abbreviated as BPM6).
Compared with BPM5, more of a statistical explanation of balance sheet changes is given in BPM6, to show changes that arise outside of transactions—such as from exchange rate and other valuation changes, and write-offs. Furthermore, debt instruments are identified separately, and additional supplementary breakdowns of debt instruments by remaining matu-rity and particularly currency emphasised. A memorandum item on reserves-related liabilities is included to help analysis of reserve assets. And, in this context, SDR allocations are to be recognised as a liability. The analytical chapter in BPM6 includes a discussion of the balance sheet approach.
Methodological articles 3

134 European Economic Statistics
Figure 3.1.1: International Investment Position Reporters
nu
mb
er
0
20
40
60
80
100
120
37
113
1998 2007
Future developments
A new draft of BPM6 was available early in 2008 at http://www.imf.org/external/pubs/ft/bop/2007/bopman6.htm57 and was promoted in regional outreach seminars during the first half of 2008. A final version would be prepared for Committee’s agreement in October 2008, and then be posted as the final version, subject to editing, by end- 2008.
Countries are expected to update their data collections, methodologies, and procedures over the next several years, with 2012 or 2013 the most likely target dates for converting data for International Financial Statistics and the Balance of Pay-ments Statistics Yearbook to the new manual. The Fund will support countries undertaking conversion in its training, documentation, and technical assistance programs. The Balance of Payments Compilation Guide and Textbook will also be updated.
57 The website also has background materials, including the Annotated Outline and papers presented to various expert groups and the results of these discussions.
3 Methodological articles

135 European Economic Statistics
3.2 European Sector Accounts
Denis Leythienne and Béatrice Thiry58
Eurostat, National accounts: production
I. Introduction
The sector accounts are the part of the national accounts that records the economic flows and stocks of the institutional agents classified in “sectors” according to their economic behaviour and function in the economy.
They are necessary to answer questions such as: are households spending or saving a bigger share of their income? Are corporations investing more or do they prefer to retain their earnings? Is the economy financing its investments through its total savings or is it borrowing from abroad?
Among sector accounts, one generally distinguishes between the non-financial accounts, the financial accounts and the balance sheets. Non-financial sector accounts record flows according to their economic nature, such as output, wages, taxes, subsidies etc. The financial accounts record flows by financial instrument (e.g. currency, loans, shares etc.). The balance sheets record the stocks of non-financial assets (e.g. building, machinery) and financial assets and liabilities (e.g. currency, loans, shares, etc.)
For about ten years, the annual sector accounts of the Member States of the European Union have been compiled according to one common methodology described in the European System of Accounts 1995 (ESA 95)59.
With the start of the euro area, it was felt necessary to supplement national sector accounts as provided by the Member States with genuine European sector accounts that would reflect the economic situation of the euro area / European Union as a whole. In order to “consolidate” the accounts of the Member States across borders, Eurostat and the European Central Bank worked out a special methodology, in close cooperation with the national statistical institutes and national central banks.
This article provides methodological information on the compilation of European non-financial sector accounts. Section II outlines the basic features of sector accounts. Section III describes the methods used for the compilation of European aggregates.
II. Sector accounts
The European sector accounts aim to provide a comprehensive and comparable overview of the European economy as a whole. They record all “transactions” between economic agents grouped by “sector”. The system forms a sequence of inter-linked accounts.
2.1 Institutional sectors
The institutional sectors bring together economic agents with broadly similar behaviour: non-financial corporations, fi-nancial corporations, general government and households. Transactions between domestic economic agents and economic players residing abroad are recorded in the “rest of the world” accounts.
The sector accounts thus show the interactions between the different sectors of a given economy, and between them and the rest of the world.
58 With the help of Peeter Leetmaa, Hervé Rénnié and Tatjana Smokova (European Commission / Eurostat). Béatrice Thiry is on temporary leave from the National Bank of Belgium and Tatjana Smokova is on secondment from Statistics Estonia.
59 For more details, see http://forum.europa.eu.int/irc/dsis/nfaccount/info/data/esa95/en/titelen.htm.
Methodological articles 3

136 European Economic Statistics
2.2 Transactions
Transactions are classified according to their economic nature (e.g. payment and receipt of wages or taxes, consumption, granting of a loan, etc.).
They belong to two main categories: transactions in goods and services and distributive transactions.
Transactions in goods and services
All flows related to the supply and use of goods and services during the period considered are recorded as transactions in goods and services.
The supply of goods and services provided by each producing sector of the economy is recorded as “output”. Goods and services bought abroad are recorded as “imports” in the Rest of the World accounts.
The different uses of goods and services in the domestic economy are: “intermediate consumption”, “final consumption” and “gross capital formation” depending on their role in the economic process. “Intermediate consumption” is the value of goods and services consumed as inputs by a production process; “final consumption” stands for the goods and services used for satisfaction of individual needs (by households) or of collective needs (by general government); “gross capital formation” means investment in fixed assets (e.g. buildings, machinery, private dwellings, agricultural livestock, and intangible assets) and changes in inventories. Goods and services sold abroad are recorded as “exports” in the Rest of the World accounts.
For goods and services as a whole, total supply should equal total use, which leads to the following equation:
(1) Output + Imports = Intermediate Consumption + Final Consumption + Investment + Exports
Or:
GDP = Output — Intermediate Consumption = Final Consumption + Investment + Exports — Imports
Where GDP stands for Gross Domestic Product and measures the value of goods and services produced during the period considered.
Distributive transactions
Distributive transactions consist of economic flows that involve the (re-)distribution of income created by the production of goods and services.
For each distributive transaction, the amounts that are paid by a sector are recorded as “uses” whereas the amounts received are recorded as “resources”. For instance, the “uses” side of the transaction category “compensation of employees” records the amounts of wages and salaries and social contributions payable by all the country’s employers, namely non-financial corporations, financial corporations, government and households (as individual entrepreneurs), and employers residing abroad (rest of the world sector).
The resources side shows the compensation of employees receivable by the relevant sectors of the economy, namely:
– the household sector with respect to the households that reside in the country considered;
– the rest of the world sector for households that are paid in the country considered but reside abroad.
3 Methodological articles

137 European Economic Statistics
Table 3.2.1: Resources/uses balance for compensation of employees
(Billion euros, 2006 data for EU27)
USES RESOURCESN
on
-fin
an
cia
l co
rpo
rati
on
s
Fin
an
cia
l co
rpo
rati
on
s
Ge
ne
ral
go
ve
rnm
en
t
Ho
use
ho
lds
Re
st o
f th
e w
orl
d
TO
TAL-
US
ES
TO
TAL
RE
SO
UR
CE
S
No
n-fi
na
nci
al
corp
ora
tio
ns
Fin
an
cia
l co
rpo
rati
on
Ge
ne
ral
go
ve
rnm
en
t
Ho
use
ho
lds
Re
st o
f th
e w
orl
d
Compensation of employees
3583 287 1241 550 13 5674 5674 0 0 0 5668 6
As shown in the numerical example above, for each type of distributive transaction, total resources of all sectors and the rest of the world accounts equal total use. On the use side, two thirds of the total amount of compensation of employees is paid by non-financial corporations. The other third is paid either by general government, households (as individual entre-preneurs), financial corporations or non-residents (rest of the world sector). On the resources side, almost all compensation of employees is received by resident households.
Sequence of accounts
Transactions are grouped into a sequence of accounts covering a specific aspect of the economic process, ranging from production, generation and (re)distribution of income through consumption and investment to borrowing and lending. Each account is closed by a balancing item defined as total resources minus total use, and this is carried over to the next account.
Some balancing items are of great analytical interest, for example gross operating surplus, disposable income and saving. The final balancing item of the non-financial sector accounts is net lending/borrowing, which is equal to all flows received minus all flows paid by each institutional sector. It then reflects whether a given sector has increased/decreased its financial wealth through economic activities carried out during the period considered.
III. European sector accounts
The euro area/European Union accounts are based on, but are not the simple sum of, the national accounts of the Member States. First, the accounts of European institutions and bodies need to be added. Second, cross-border transactions between European countries have to be eliminated from the rest of the world accounts. Third, imbalances which are mainly caused by the removal of intra-flows, called “asymmetries”, are eliminated in order to re-balance the accounts.
In the diagram below, these transformations are presented using a simple example, assuming that Europe is made up of two countries, A and B. All economic flows are displayed with arrows.
In the first diagram, the European Union accounts are compiled as the mere sum of the national accounts of countries A and B. Both intra-flows between countries A and B and flows vis-à-vis third countries are taken into account. The EU insti-tutions are not part of the European aggregate.
Methodological articles 3

138 European Economic Statistics
Country A Country B
EU
institutions
Europe as sum of countries
In this second diagram, the European Union is considered as a single entity. Only flows vis-à-vis third countries are taken into account. The EU institutions are included in the European aggregate.
Country A Country B
EU
institutions
Europe as a single entity
Since 2006, European sector accounts at current prices have been compiled according to the single-entity principle. The other European aggregates, in particular volume data, are still compiled using the first approach.
The main steps in the compilation of European sector accounts are detailed below.
3.1 European Union institutions and other European bodies
The European Union institutions (EUI) and other European bodies are not considered to be part of the domestic economy in the national accounts compiled by the Member States. Consequently, the sector accounts provided by the Member States do not record the activities of institutions and bodies set up by European treaties as resident entities. By contrast, the Euro-pean institutions are part of the domestic sectors of the European Union economy (not the euro area).
3 Methodological articles

139 European Economic Statistics
With the exceptions of the European Central Bank and the European Investment Bank, which are both classified in the financial corporations sector, all European institutions are classified in the government sector.
For the general government sector, the EUI are the following:
– The Council– The European Commission– The European Parliament– The European Court of Justice– The European Court of Auditors– The Social and Economic Committee– The Committee of the Regions– European agencies whose accounts are part of the general budget of the European Union
Significant transactions, especially transfers, take place between the above institutions and Member States. This is particu-larly the case for the Commission, which administers European policies that involve financial transfers.
European institutions are not included in the euro area accounts because their administrative competence goes beyond the boundaries of the monetary union. The ECB is the only institution included in the financial corporations sector in both the euro area and the European Union accounts.
3.2 The rest of the world in the European accounts
The rest of the world accounts, as compiled by the Member States, record transactions between the national economies and all non-resident units, including those in other European Member States. For instance, imports/exports recorded in Mem-ber States’ national accounts include the goods and services bought from or sold abroad, whether from or to a resident of the euro area, of the European Union or of a third country.
To reflect appropriately the transactions between European areas and third countries, it is therefore necessary to re-move, from the sum of national rest of the world sectors, the economic flows within the area considered (“intra-European flows”).
There is insufficient data on the rest of the world sector breakdown into intra/extra euro area/European Union in the na-tional accounts data sets. Consequently, the European accounts draw on both the national and the European balance of payments statistics. In other words, the “intra flows” are estimated using the geographical breakdown provided by balance of payments (BoP) data.
Note that, because of different data revision policies and conceptual differences, it is not possible to ensure full consistency between the European rest of the world sector and BoP statistics at this stage.
Moreover, for “intra flows”, total resources should theoretically equal total uses. For instance, within the euro area, total “intra”-imports should equal total “intra”-exports. However, this is not the case in practice. The comparison of total intra-flows in resources and uses reveals imbalances called “asymmetries”.
As a consequence, European accounts cannot be derived by simply removing the intra-flows of each transaction. The result-ing discrepancies have to be allocated to the various resident sectors in order to re-balance the European accounts. Table 2 illustrates the removal of the “intra” European flows using interest flows as an example.
Methodological articles 3

140 European Economic Statistics
Table 3.2.2: Removal of intra-European flows of interest
(Billion euros, 2006 data for EU27)
USES RESOURCES
No
n-fi
na
nci
al
corp
ora
tio
ns
Fin
an
cia
l co
rpo
rati
on
s
Ge
ne
ral
go
ve
rnm
en
t
Ho
use
ho
lds
an
d N
PIS
H
Re
st o
f th
e w
orl
d —
Intr
a-fl
ow
s
Re
st o
f th
e w
orl
d —
Ex
tra
-flo
ws
Tota
l Use
s
RE
SO
UR
CE
S —
US
ES
Tota
l Re
sou
rce
s
Re
st o
f th
e w
orl
d —
Ex
tra
-flo
ws
Re
st o
f th
e w
orl
d —
Intr
a-fl
ow
s
No
n-fi
na
nci
al
corp
ora
tio
ns
Fin
an
cia
l co
rpo
rati
on
s
Ge
ne
ral
go
ve
rnm
en
t
Ho
use
ho
lds
an
d N
PIS
H
With intra-flows
383 1440 311 255 475 275 3139 0 3139 334 502 211 1709 44 339
“Intra-flows”
removed383 1440 311 255 275 2664 -27 2637 334 211 1709 44 339
In the case of the European Union, about two thirds of the cross-border flows of interest are paid to or received from other countries of the European Union. For example, on the use side of the Rest of the World accounts, EUR 475 (out of 750) bil-lion has been removed as “intra-European” flows of interest.
3.3 Balancing the European accounts
As illustrated in the example above, removing the intra-flows from the European Rest of the World accounts creates imbal-ances between total resources and total uses when conceptually they should be equal.
In the case of transactions in goods and services, these imbalances are created by the difference between intra-imports and intra-exports called “asymmetries”.
Goods and Services
Asymmetries in goods and services are, in absolute terms, the most important discrepancies in the European sector ac-counts. In 2006, they reached EUR 46 billion for the euro area and EUR 124 billion for the European Union. These amounts represent respectively 0.3% and 0.5% of the total supply of goods and services for the areas concerned. These asymmetries have to be allocated to the different transactions in goods and services so that total supply and total uses remain balanced in the European accounts [see equation 1) in §2.2 above].
To allocate asymmetries in goods, intra-community trade statistics collected under the Intrastat regulation60 are used. These data provide a breakdown of intra-flows of goods by final use categories. These proportions are used to allocate asymmetries in goods to the intermediate consumption and gross fixed capital formation (“investment”) of households and non-financial corporations.
60 Statistics relating to the trading of goods by the Community and its Member States with non-member countries are based on Council Regulation No 1172/95 and Commission Regulation (EC) No 1917/2000.
3 Methodological articles

141 European Economic Statistics
Asymmetries in services are allocated to the intermediate consumption of non-financial corporations and to the final con-sumption of households on a pro rata basis. This balancing process has an impact on goods and services transactions, and therefore on the level of the Gross Domestic Product of the areas concerned. As illustrated in the figure below, the GDP of the European Union is about 0.2% lower after balancing. In the euro area case, balancing caused a decrease of about 0.3% in the beginning of the period (1999 and 2000) whereas the impact decreased significantly in the recent years (-0.04% in 2006).
Figure 3.2.1: Adjustment of GDP due to the balancing process
(in percentage points)
EU27Euro area 13
-0.35%
-0.30%
-0.25%
-0.20%
-0.15%
-0.10%
-0.05%
0.00%
1999 2000 2001 2002 2003 2004 2005 2006
Distributive transactions
Total resources must also equal total uses for each distributive transaction, when summed over all institutional sectors and the rest of the world. For example, total interest revenue of all sectors and the rest of the world combined must be equal to total interest expenditure.
For distributive transactions as well, the removal of “intra” European flows creates imbalances as illustrated in Table 2 in the case of interest.
In order to balance distributive transactions, the method consists of identifying the items to which the discrepancies should be allocated.
In practice, the following rules are applied:
– For each transaction, discrepancies are allocated to the sectors whose data are deemed less reliable according to experts’ judgment;
– government data, which are considered more reliable, are not affected by the balancing procedure;
– rest of the world data are not affected by the balancing procedure either except where they conflict with government data (e.g. in the case of taxes and subsidies on products).
Methodological articles 3

142 European Economic Statistics
For compensation of employees, the discrepancy is totally allocated to the amounts received by the households sector. In-deed, in most Member States, this item is indirectly estimated as the sum of the compensation of employees paid by all other sectors. It is also the most important item for this transaction so that the impact of balancing is minimised.
The same kind of reasoning is applied to other transactions which are more or less directly related to salaries, i.e. social contributions, social benefits and the adjustment for the change in net equity of households in pension funds reserves.
In the case of interest, imbalances (total resources minus total use) are allocated on a pro rata basis as illustrated in Table 3 (follow-up of table 2).
Table 3.2.3: Balancing intra-European flows of interest
(Billion euros, 2006 data for EU27)
USES RESOURCES
No
n-fi
na
nci
al
corp
ora
tio
ns
Fin
an
cia
l co
rpo
rati
on
s
Ge
ne
ral
go
ve
rnm
en
t
Ho
use
ho
lds
an
d N
PIS
H
Re
st o
f th
e w
orl
d —
Intr
a-fl
ow
s
Re
st o
f th
e w
orl
d —
Ex
tra
-flo
ws
Tota
l Use
s
RE
SO
UR
CE
S —
US
ES
Tota
l Re
sou
rce
s
Re
st o
f th
e w
orl
d —
Ex
tra
-flo
ws
Re
st o
f th
e w
orl
d —
Intr
a-fl
ow
s
No
n-fi
na
nci
al
corp
ora
tio
ns
Fin
an
cia
l co
rpo
rati
on
s
Ge
ne
ral
go
ve
rnm
en
t
Ho
use
ho
lds
an
d N
PIS
H
“intra-flows” removed
383 1440 311 255 275 2664 -27 2637 334 211 1709 44 339
Allocation of imbalances
-2 -9 0 -2 0 -13 14 0 1 11 0 2
Balanced accounts
381 1431 311 253 275 2651 0 2651 334 212 1720 44 341
As was shown in Table 2, removing intra-European flows creates an imbalance of EUR -27 billion between total interest received and total interest paid. This imbalance between resources and use of interest has been distributed among the resi-dent sectors except general government as shown in Table 3. For example, the amounts recorded for the interest received by financial corporations were EUR 1709 billion before adjustment and EUR 1720 billion afterwards.
The same method is used for the other transactions related to property income and other current transfers, as there is no obvious single absorbing item. Consequently, imbalances are allocated to the domestic sectors (other than government) on a pro-rata basis.
For the transactions “net non-life insurance premiums” and “current taxes on income and wealth”, the discrepancy is proportionally allocated among the domestic sectors (other than government) on the use side. For the transaction “non-life insurance claims”, it is the opposite: the discrepancy is allocated among the non-government domestic sectors on the resources side.
For taxes and subsidies on products, as government data are considered more reliable and should not be affected by the balancing method, the adjustment falls on the rest of the world accounts. As regards other taxes and subsidies on produc-tion, the discrepancy is totally allocated to the non-financial corporations that represent by far the biggest amount for taxes paid and subsidies received.
3 Methodological articles

143 European Economic Statistics
For capital taxes, the most important taxpayer, namely the households sector, was chosen to absorb the discrepancy.
As regards the other capital transfers, the imbalance was allocated between the amount received by non-financial corpora-tions and households.
IV. Conclusion
With the start of the euro area and the successive enlargements of the European Union, new user needs have emerged for genuine European accounts.
In order to compile such accounts, it was necessary to include European institutions and consolidate cross-border flows within the areas considered. The removal of intra-flows has led to discrepancies between resources and uses that have been resolved by balancing the accounts, thus impacting on aggregates like the European GDP at current prices.
The result of the whole compilation process, from the individual country data to the final balancing procedure, gives a bal-anced and consistent set of sector accounts for the euro area and the European Union.
The European sector accounts are no longer the sum of national accounts transmitted by the Member States. They are also different from other euro area/European Union national accounts publications, in which cross-border flows within the area concerned have not yet been removed.
The methodology broadly described above has been used to compile the European sector accounts that were published for the first time in 2006 (annual accounts) and in 2007 (quarterly accounts). These data are available, together with methodo-logical information in English, French and German, on the following website: http://ec.europa.eu/eurostat/sectoraccounts.
Methodological articles 3

144 European Economic Statistics
3.3 Harmonised indices of consumer prices61
Christine WirtzEurostat, Price statistics
Introduction
The Harmonised Indices of Consumer Prices (HICPs) are a set of European Union consumer price indices (CPIs) calculated according to a harmonised approach and a single set of definitions. This article outlines the aims and methodology of the HICPs, summarises the main harmonised standards and notes some key items on the agenda for further harmonisation. The HICP development project is ongoing. This article describes the state of development of the HICPs at the end of 2007. The HICPs have a legal basis in that their production, and many elements of the specific methodology to be used, is laid down in a series of legally binding European Union Regulations.
The main HICPs
The HICPs on which most attention is focused are:
– the Monetary Union Index of Consumer Prices (MUICP) — an aggregate index covering the countries in the euro area;
– the European Index of Consumer Prices (EICP) — for the euro area plus the other European Union countries;
– the national HICPs — for each of the Member States of the European Union (EU).
Beyond these there are also the European Economic Area Index of Consumer Prices (EEAICP) and HICPs for the individu-al countries in the European Economic Area (EEA) and Switzerland. There are also interim HICPs for candidate countries. It is expected that once those countries accede to the EU their HICPs will be fully comparable with those of the existing Member States. The national HICPs are produced by the national statistical institutes, while the country-group aggregates are produced by Eurostat.
The official country-group aggregates reflect the evolution of European monetary union (EMU), the EU and the EEA. New Member States are chained into the index at the time of accession. In addition to these official aggregates, Eurostat computes also country aggregates with stable composition over time. For example, the aggregate EU27 shows price indices covering all current 27 Member States since 1997.
Uses of the HICPs
Consumer price indices have a variety of potential uses, for example for indexing social benefits or contracts, or as inputs into various types of economic analyses. Following the Maastricht Treaty, the main thrust of the harmonisation project has been the use of the HICPs as convergence criteria and the main measure for monitoring price stability in the euro area. The HICPs have been set up to provide the best measure for international comparisons of consumer price inflation in the EU and the euro area, and for assessing price convergence and stability in the context of monetary policy analysis.
In the early stages of the project until 1998, the main use of the HICPs was in assessing the price stability and price con-vergence required for entry into European monetary union. Since then, convergence in terms of price stability for new potential Members of the EMU has been assessed regularly by means of the HICP.
From 1999 onwards, the focus of interest shifted towards country-group aggregates — and in particular the euro area. This change of emphasis reflects the European Central Bank’s objective of price stability and the view that the HICPs are the
61 Comments on this paper by K. Hayes and C. Stewart (Eurostat) are gratefully acknowledged.
3 Methodological articles

145 European Economic Statistics
most appropriate price measure for assessing price stability. The focus of the HICPs on measuring price stability and con-vergence, and on international comparisons, does not mean that a wider range of users should not or cannot use HICPs for other purposes. Depending on the precise purpose the user has in mind, the HICPs may be the best available price statistics. All users of the HICPs should note, however, that the HICPs are revisable; the indices may change after the initial results are published.
A harmonised methodology for the HICP and minimum standards
On 23 October 1995, the European Union’s Council of Ministers adopted a Regulation providing the legal basis for the establishment of a harmonised methodology for compiling consumer price indices in the Member States and European Economic Area Countries. This Regulation62 (the HICP Framework Regulation) required that HICPs be produced and published, use a common reference base, provide common coverage of consumer goods and services, and share a common classification. A series of specific measures has been adopted to implement the HICP Framework Regulation.
The approach taken to harmonisation has been to build, as far as possible, on the EU Member States’ existing data sources and methodologies for their national CPIs. The legal standards typically take the form of minimum standards, whereby more than one solution to a harmonisation issue may usually be allowed so long as comparability is not jeopardised. Within this framework, by end-2007, a series of 17 legally binding standards and some additional guidelines had been drawn up and implemented.
Compliance monitoring
Given the importance accorded to the accuracy, reliability and comparability of the HICPs in the EU, Eurostat operates a system of compliance monitoring to ensure that the legal framework is adhered to. This includes compliance assessments on the basis of questionnaires and visits by Eurostat officials to the EU national statistical institutes to study their work on their HICPs in more detail.
Compliance monitoring is crucial in promoting confidence in HICP data and Eurostat needs to be assured that Member States are complying with the regulations in order to support the obvious need for high quality HICP Statistics. Recom-mendations are published and followed up by Eurostat. The follow-up process ensures that the recommendations are taken up. If required, further follow-up visits by Eurostat can be made.
Basic concepts and definitions
Aim and scope of the HICPs
The aim of the HICPs was stated to be to measure inflation on a comparable basis, taking into account differences in na-tional definitions. This, however, requires an operational definition of the term “inflation”.
Given the opinion and the needs of the HICPs’ main users, it was decided to compute the HICPs as Laspeyres-type price indices, based on the prices of goods and services available for purchase in the economic territory of each EU Member State for the purpose of directly satisfying consumer needs.
Based on this concept and by reference to national accounts, specifically the European System of Accounts (ESA 95), the coverage in practice of the HICPs was taken to be household final monetary consumption expenditure (HFMCE). This definition effectively prescribes the goods and services, the population and the geographic territory to be covered, as well as the prices and the weights to be used.
The HICP may thus be described as a Laspeyres-type “consumer inflation” or “pure price” index, which measures average price changes on the basis of changed expenditure on maintaining the consumption pattern of households and the compo-sition of the consumer population in the base or reference period.
62 Council Regulation (EC) No 2494/95.
Methodological articles 3

146 European Economic Statistics
The term “pure price index” indicates that it is only changes in prices that should be reflected in the HICP measure between the current and the base or reference period. The HICP is therefore not a cost of living index. That is, it is not intended to be a measure of the change in the minimum cost for achieving the same standard of living (i.e. constant utility) from two different consumption patterns realised in the two periods compared, and where factors other than pure price changes may enter the index.
Household final monetary consumption expenditure (HFMCE)
The coverage of the HICPs is delimited by HFMCE, and so concerns that part of final consumption expenditure which is:
– by households, irrespective of their nationality or residence status;– in monetary transactions;– on the economic territory of the EU Member State;– on goods and services that are used for the direct satisfaction of individual needs or wants;– in one or both of the time periods being compared.
The prices used in the HICP should be the prices paid by households to purchase individual goods and services in monetary transactions. The purchaser’s price is the price for the products that the purchaser actually pays at the time of purchase.
The weights of the HICP are the aggregate expenditures by households on any set of goods and services covered by the HICP, expressed as a proportion of the total expenditure on all goods and services within the coverage of the HICP.
The HICPs are classified according to the four-digit categories and sub-categories of the COICOP/HICP (Classification of Individual Consumption according to Purpose, adapted to the needs of HICPs).
The concept of HFMCE not only specifies the coverage, the prices and the weights for the HICP, but also establishes a link between HICPs and ESA 95 that has proved useful to analysts and policy-makers. HICP definitions follow ESA 95 wherever possible and when to do so is consistent with the aims and uses of the HICP. That said, there are some differences between the coverage of the HICPs and that of household final consumption expenditure (HFCE) as defined by national accounts, in particular the treatment of owner-occupied housing.
Some basic requirements for HICPs
The relative distribution of consumers’ expenditure on individual products varies from country to country. Hence, there is no uniform basket applying to all EU Member States. The weights used in the compilation of HICPs may relate to a reference period up to seven years prior to the current year. In practice, this results in a complete weight and sample revision of national HICPs in at least five-yearly intervals, taking into account that a period of about two years may be needed to incorporate the results of a full consumer expenditure survey. Adjustments must nevertheless be made each year for any especially large changes in expenditure patterns, to minimise any disparities that could arise from different update frequencies.
To keep the HICPs broadly in step with each other and up to date, new products must be included when they achieve a significant relative importance. HICPs must also be shown to be based on appropriate sampling procedures, taking into account national diversity in products and prices.
The samples must be kept up to date, in particular by banning the practice whereby missing prices are simply assumed to be equal to the last observed prices. In order to measure pure price changes, the prices included in HICPs need to be adjusted for changes in the quality of goods and services. Certain inappropriate quality adjustment practices, such as so-called au-tomatic linking, may not be used.
HICP aggregates for country groups are calculated as the weighted average of the national HICPs, using the weights of the countries and sub-indices concerned. The weight of a country is its share of HFMCE in the total.
3 Methodological articles

147 European Economic Statistics
Coverage
Goods and services
The coverage of goods and services in the HICPs has been expanded over time. The HICPs now cover virtually all of HFMCE. The main difference from the ESA 95 concept of HFCE is the exclusion of owner-occupied housing.
The initial coverage of goods and services in the HICPs, although fairly comprehensive, reflected for the most part what was common to the national consumer price indices. Since then, with considerable effort and cooperation by EU Member States, coverage has been extended to virtually all consumer expenditure, in the sense of HFMCE. In particular, the dif-ficult areas of health, education and social protection services are now covered, as are insurance and financial services. These are included in the HICPs according to agreed definitions, thus ensuring comparability despite major institutional differences.
Geographic and population coverage
The HICP Framework Regulation required the HICPs to be based on the prices of goods and services available for purchase on the economic territory of the EU Member State for the purposes of directly satisfying consumer needs. As regards the economic territory and the consumers concerned, a harmonised definition of the geographic and population coverage of the HICP was necessary both to achieve comparability and to avoid gaps or double counting when aggregating national HICPs.
HICP coverage includes expenditure by foreign visitors and expenditure by individuals living in institutions, but excludes expenditure by residents whilst in a foreign country (this is the so-called domestic concept). All private households are to be included, irrespective of the area in which they live or their position in income distribution. Expenditure incurred for business purposes should be excluded.
The choice of the domestic concept reflected the role of the MUICP in measuring price stability in the euro area. Price changes in the euro area are measured by aggregating price changes taking place within the individual EU Member States. Expenditure and price changes to be measured within the economic territory should include those affecting foreign visitors and exclude those affecting residents whilst in a foreign country.
It is an HICP requirement that HICPs should be compiled using weights which reflect the HFMCE of all households. HICPs which cover only a subset of households should nevertheless be regarded as comparable if this difference in practice ac-counts for less than one part per thousand of the total expenditure to be covered by the HICP.
Computation issues and price sampling
Weights for the HICP sub-indices
The weights for the HICP sub-indices are the aggregate expenditure by households on any set of goods and services covered by the HICP, expressed as a proportion of the total expenditure on all goods and services within the coverage of the HICP.
The quality requirements for HICP weights call for a minimum action of review and adjustment to ensure sufficient quality. A comparability threshold determines when weights must be reviewed and updated. Imposing the cost of high precision for all weights or frequent updating of weights was not considered justified at the outset of the project.
The review requirement involves checking each year those weights which are judged to be most critical for reliability and relevance and, hence, for the comparability of the overall HICP. These are primarily the weights for index components where significant market changes have accompanied atypical price movements. Where a weight is identified as deficient, EU Mem-ber States should make an improved estimate and introduce an appropriate adjustment, from the following January index, where this would exceed the threshold effect of 0.1 percentage points (on average for one year compared with the previous year). The aim is to ensure that the adjusted weights are the best estimates that can be made on the information available.
Methodological articles 3

148 European Economic Statistics
Index formulae
The choice of the index formula to be used for the HICP is made at two levels:
– the level of the macro-formula; that is, the choice between a chained index with annual links and a fixed base index with links up to five years;
– the level of the micro-formula; within each level there is the issue of reference period, both for prices and for weights.
Macro index formula
The HICP is required to be a Laspeyres-type index. Although the HICPs produced by the EU Member States differ in detail, they can all be broadly described as Laspeyres-type indices. They are all price indices in which the month-to-month move-ments in prices are measured as an average of price indices using expenditure weights which are an appropriate reflection of the consumption pattern of the consumer population in the weight reference period.
In practice, there are three types of common reference or base periods used in the construction of HICPs:
– the “weighting reference period” is defined as the 12-month period to which the volumes of the current expenditure weights refer;
– the “price reference period” is the period from which the current price change is measured and from which prices are used as denominators in the index calculations; it refers to the prices used for the volume valuation in the current weights;
– the “index reference period” is the period for which the index is set to 100 index points.
The HICP is, depending on the macro-formula applied in practice for its computation, potentially a chained index. It should be stressed that this is the equivalent chain form of the fixed base index which simply allows chained and fixed indices to be expressed by a common formula. The chaining becomes effective if and only if there are changes to the weights currently used, for instance on the grounds of the HICP review requirements for weights.
In practice, some EU Member States compile fixed base HICPs while others compute chain HICPs with annual weight updating. In order to obtain a set of HICPs with sub-indices allowing consistent aggregations, it is necessary to present the HICPs as if they were all computed with the same formula. Hence, it was necessary to apply a common price reference period and a common index reference period.
Since 2006, the index reference period has been set to 2005 = 100. In order to obtain a common price reference period, too, the weights for each year are “price updated” to December of the previous year.
Elementary aggregate indices
HICP methodology defines an elementary aggregate by reference to the expenditure or consumption covered by the most detailed level of stratification of the HICP. In practice, reliable expenditure information is normally not available for weight-ing purposes within an elementary aggregate. As a consequence, an elementary aggregate index is a price index for an el-ementary aggregate comprising only price data.
For the HICPs, elementary aggregate indices are computed as the ratio of geometric mean prices or the ratio of arithmetic mean prices. The arithmetic mean of price relatives may only be applied in exceptional cases and where it can be shown that it is comparable.
3 Methodological articles

149 European Economic Statistics
The level at which macro-aggregation changes into elementary aggregation
The level of elementary aggregation interacts with other design features such as sampling procedures and the availability of weighting information. Depending on the sources of the weights used, elementary aggregation may start at different levels in different countries in the product, geographic and outlet hierarchies.
Differences in national practices can affect the resulting HICPs but this issue was, in the first instance, not considered to be a priority for harmonisation and no action has been undertaken up until now. This issue is likely to be taken up again as the harmonisation process develops.
Computation of country aggregates
The HICP country group aggregates for the euro area, the EU and the EEA are calculated by Eurostat using the HICPs provided by the Member States.
The computation consists of three main steps. For all countries, price changes since December of the previous year are derived from the HICPs. Then the weighted average of these national price changes is computed, using the weights of the countries and sub-indices concerned. The weight of a country is its share of HFMCE in the total of the country group. The annual price change of the country group is then chain-linked to December of the previous year in order to provide a series with a common reference period.
The euro area aggregate, the MUICP, is compiled as a weighted average of the countries comprising the euro area. The coun-try weights are derived from national accounts data for HFMCE, naturally expressed in euro. The index is computed as an annual chain index allowing for country weights to change each year and, consequently, for adding new Member States as they join the euro area.
For the EU and EEA HICP aggregates, the euro area is treated as a single entity to which data for the other countries is then added (the weights again use national accounts data, converted into purchasing power standards). Note that for EU enlargement in May 2004, chain-linking was also added in May to maintain the correct country coverage for both the EU and EEA aggregates.
Sampling of prices
To achieve a reliable and comparable representation of the HICP target universe, each country should select a target sample, which is a set of products. Prices should then be observed for the selected products over time. Where products cease to be available on the market they should be replaced by comparable items from the same consumption segment.
There are three important sampling dimensions to take into account:
– the elementary product groups, defined as a set of products that are sampled in order to represent one or more consump-tion segments in the HICP;
– the outlet dimension;
– the regional dimension.
An elementary product group can be stratified, for instance by regions, cities or outlet types. The entity at the lowest level of stratification is referred to as an “elementary aggregate”.
Random sampling is not easily achieved when it comes to collecting prices for a CPI and in practice most EU Member States follow purposive sampling procedures for their HICPs. Sufficiently large sample sizes are necessary to ensure that comparability is achieved. HICPs which have enough elementary aggregates to represent the target universe and enough prices within each elementary aggregate to take account of the variation of price movements in the population are regarded as reliable and comparable.
Methodological articles 3

150 European Economic Statistics
Where no price observation is possible because the product offer is not available, estimated prices can be used for a maxi-mum of two consecutive months. From the third month onwards, the product offer needs to be replaced in the sample. Appropriate quality adjustment needs to be applied in this case.
In 2007, more than 2.7 million prices were collected for the HICP every month in the 27 EU Member States. Approximately 370 000 outlets are surveyed in more than 2 300 cities or municipalities.
Price collection and treatment of price observations
Timing of price collections and of entering prices into the HICP
Price collections for goods must take place across at least one working week period at, or near, the middle of the calendar month to which the index pertains. For products that are known to typically show sharp irregular price changes within the same month, prices are collected over a period of more than one working week. This holds in particular for energy products and for fresh food, such as fruit and vegetables.
While prices for goods are entered into the HICP for the month in which they are observed, prices for services are entered into the HICP for the month in which the consumption of the service at the observed prices can commence.
The treatment of price reductions
HICP methodology requires that price reductions must be: (i) attributable to the purchase of an individual good or service; (ii) available to all potential consumers with no special conditions attached; (iii) known to the buyer at the time when he or she entered into the agreement to buy the product concerned; and (iv) claimable at the time of purchase or within such a time period from the actual purchase that they might be expected to have a significant influence on the quantities buyers are willing to buy.
Specific guidelines advise on how various price reduction schemes should be treated, such as sales prices, credit and pay-ment arrangements, inducements, discounts, rebates or refunds.
Missing or rejected price observations
In order to ban practices which can lead to serious bias, EU Member States are asked to maintain and provide a statement of their target sample from month to month. Where prices are not observed, they must be estimated by an appropriate procedure.
In general, the prices reported by the price collectors should be accepted. Rejection or adjustment of reported prices, for example the correction of an unusually high or low price change, should not be carried out by automatic procedures, but only by reference to specific information on the individual price observation, such as a repeat observation. If, following a validation procedure, the reported price must nevertheless be rejected, the rejected price should be treated according to the rules for missing observations.
The guidelines leave it to EU Member States to apply methods other than those specified. Where an EU Member State does not use the methods specified, Eurostat may request it to show that the resulting HICP does not differ systematically from an HICP constructed in line with the specified methods by more than 0.1 percentage points on average, taking one year against the previous year.
Prices for new products
The HICP Framework Regulation requires HICPs to be kept relevant, meaning broadly in step with each other and up to date in terms of market developments. Neither the formulae used to calculate the index nor the frequency with which the basket of goods and services is renewed can fully address the basic problem: the risk of bias if the introduction of new prod-ucts is used as an opportunity to increase or decrease prices.
3 Methodological articles

151 European Economic Statistics
What is meant by the term “new product” is not always precise. In particular, there is no sharp dividing-line between new models and varieties of previously existing products and genuinely new innovative products which fulfil needs that could not be fulfilled before.
In the HICP, new varieties are mostly introduced as a replacement and the prices are then subject to quality adjustment, while new innovative products are introduced by addition.
Quality adjustment
For the HICPs, quality change is said to occur whenever the change in specification has resulted in a significant difference in utility (or functionality) to the consumer between a new variety or model of a good or service and the good or service previ-ously selected for pricing. A quality change does not arise when there is a comprehensive revision of the HICP sample.
Quality adjustment is defined as the procedure of making an allowance for a quality change by increasing or reducing the ob-served current or reference prices by a factor or an amount equivalent to the value of that quality change. Quality adjustments should be based on explicit estimates of the value of the quality change. Where no estimates are available, price changes should be estimated as the whole difference between the price of the substitute and that of the item it has replaced.
EU Member States are required to examine their quality adjustment procedures and to avoid the so-called automatic link-ing method, which is equivalent to the assumption that the difference in price between two successive models is wholly attributable to a difference in quality. They should monitor the incidence of quality changes and the adjustments made in order to demonstrate their compliance with HICP standards.
Despite the existing legal standards, differences between HICPs may arise because the same changes in the physical char-acteristics of an item are still perceived and treated in different ways in different countries. This is not to say that the same quality characteristic must be valued to the same extent in different EU Member States, only that the principles and pro-cedures for valuation should be harmonised. In practice, differences in quality adjustment procedures between countries may not average out across the goods and services covered by the indices. On the contrary, they are likely to cumulate to differences well in excess of 0.1 percentage points.
Quality adjustment is one of the most, if not the most, intractable harmonisation issues for the HICP. Eurostat and the EU Member States are currently involved in developing and rating quality adjustment methods. So far, standards have been agreed for clothing, footwear, books, recorded media, computer games, and for cars and other vehicles.
Newly significant goods and services
Newly significant products should be incorporated in the HICP as soon as they achieve a sales volume of one part per thou-sand of total consumer expenditure in the EU Member State.
Additions are brought into the index for two main reasons:
– a new product (e.g. MP3 player) was not represented in the index, and would not normally be considered as a replace-ment because it was radically different from the existing products;
– a product was previously available, but was not explicitly represented in the index because consumption of it was too low.
In the case of new products added, the price of the new product is collected in addition to the products already observed; weights for the relevant category of COICOP/HICP are adjusted.
Tariff prices
Many tariff prices faced by consumers relate to products which are or have been regulated by government, or are or have been provided in a monopoly or a monopoly-like situation. Changes are, however, taking place in many EU countries in
Methodological articles 3

152 European Economic Statistics
such markets, as the markets are opened up, and it is important that the impact on consumer inflation is appropriately captured in the HICPs since such products account for a large proportion of total expenditure.
HICP sub-indices involving tariff prices are, in practice, often obtained centrally or directly from suppliers such as major retail chains, or computed by the Member States based on data on tariff prices and their underlying consumption patterns provided by suppliers.
The requirement for the HICP is not only to ensure that EU Member States measure the same price change in a comparable and reliable way, but also to give such legal powers as are necessary to ensure that Member States are in position to have access to the data they need.
Insurance
Since January 2000, the HICPs have covered all insurance connected with a dwelling which is typically paid by the tenant, not only contents insurance, and private health, civil liability and travel insurance. Life insurance is excluded from the cov-erage of the HICP, as it is considered a household saving.
Weights and prices for insurance should be measured net of claims. However, a price index for gross premiums may be used as a proxy or estimate for changes in the “prices” of net premiums.
Health, education and social protection services
The purchaser prices of goods and services in the health, education and social protection sectors to be used in the HICP should, in accordance with ESA 95, be the amounts to be paid by consumers net of reimbursements.
Reimbursements are defined as payments to households by government units, social security administrations or non-profit institutions serving households, which are made as direct consequences of purchases of individually specified goods and services, initially paid for by households. Payments of claims to households by insurance companies do not constitute re-imbursements.
A specific legal standard clarifies the treatment of health care reforms in the HICP. In fact, changes in consumer prices should not be measured simply as a result of changes in the eligibility and access rules for social health insurance. Rather changes of the prices within one and the same scheme should be accounted for by means of adjusting the weights and chain-ing the price indices.
Financial services
EU Member States traditionally followed different practices in measuring prices of financial services in their national CPIs and applied different methods of defining the weights. There was scope for non-comparability in the exclusion of service charges expressed as a proportion of transaction values. A harmonised methodology for the treatment of such charges was thus considered necessary.
The harmonised methodology says that where service charges are defined as a proportion of the transaction value, the purchaser prices should be defined as the proportion itself, multiplied by the value of a representative unit transaction in the base or reference period. The HICP should include charges expressed as a flat fee or flat rate but exclude interest pay-ments and interest-like charges. Changes in purchaser prices which reflect changes in the rules determining them, as well as changes in the purchaser prices resulting from changes in the values of the representative unit transactions, should be shown as price changes in the HICP. The change in the values of the representative unit transactions may be estimated using the change in a price index which represents appropriately the unit transactions concerned.
3 Methodological articles

153 European Economic Statistics
Release and timeliness of the HICPs
Full HICPs
The full set of HICPs is published each month according to a pre-announced schedule — in general between 14 and 16 days after the end of the month in question. This schedule has advanced significantly since the HICP was first published, as a result of a series of improvements to timeliness made in both the EU Member States and at Eurostat.
Flash estimate of the MUICP
Eurostat also publishes a monthly flash estimate for the MUICP — the HICP for the euro area as a whole. This flash esti-mate is based on the results from the first countries to publish their national estimates and on energy price data. It gives an early indication of what the MUICP is likely to show when the full data set is available. The estimation procedure combines historical information with partial information on price developments in the most recent months to give a total index for the euro area. No detailed breakdown is available.
Over the two years up to December 2007, the flash estimate exactly anticipated the inflation rate 17 times, and seven times differed by 0.1. The MUICP flash estimate is generally released on the last working day of the month in question.
Data
The HICP data which are released each month cover the price indices themselves, annual average price indices and rates of change, monthly and annual rates of change, and 12 month moving rates of change. None of these are seasonally adjusted.
As well as the all-items HICPs, the full range of around 100 COICOP/HICP indices for different goods and services are made available. The main headings are as follows:
– food;– alcohol and tobacco;– clothing;– housing;– household equipment;– health;– transport;– communications;– recreation and culture;– education;– hotels and restaurants;– miscellaneous.
In addition, a series of special aggregates is released, for example:
– the HICP all items, excluding energy;– the HICP all items, excluding energy, food, alcohol and tobacco;– the HICP all items, excluding unprocessed food;– the HICP all items, excluding energy and seasonal goods;– the HICP all items, excluding tobacco.
The weights for the full range of indices including the special aggregates are made available for the individual countries and for all country groups. All of the HICPs, including the complete list of component indices and special aggregates, are accessible via the Eurostat website63.
63 http://ec.europa.eu/eurostat
Methodological articles 3
154 European Economic Statistics
Metadata
The HICP section64 on the Eurostat website provides access to a full range of HICP information. It gathers together in one place the explanations, reference documents and data already available on Eurostat’s website and will be progressively ex-tended to give further information on key projects, methods and data.
Revisions
Since the main purpose of the HICP is to inform ECB monetary policy for the euro area, and the HICP is a revisable index, clear and transparent policy on revisions is of paramount importance. Also, for the HICP harmonisation process, a deci-sion was needed on how to implement improvements whilst at the same time minimising the difficulties caused to users by introducing discontinuities into the published HICP series.
The published HICP series may be revised for mistakes, new or improved information, and changes in the system of har-monised rules. In particular:
– Mistakes should be corrected and any revisions that may result from such corrections should be implemented without unnecessary delay.
– New or improved information, for example a more up-to-date weighting structure, may result in revision, provided that Eurostat does not oppose the timing of the revisions to be made.
– Changes in the system of harmonised rules should not require revision of published HICPs unless otherwise stated in the particular implementing measure. The impact of such changes should be assessed. Only if the impact is likely to be significant should it then be estimated for each of the 12 following months, starting with the index for the January in which the change takes place.
Agenda for further harmonisation
The progress made on harmonising consumer price indices does not mean that development is at an end. There are several major issues where further harmonisation will still be necessary. Currently, work is in progress on:
– Quality adjustment: A HICP standard addressing this issue was adopted in 2007 and laid down the legal basis for im-plementing concrete methods. Eurostat and the EU Member States are following up an action plan to implement previ-ously agreed best practices for a range of specific goods and services, in particular for cars, consumer durables, books, recordable media, clothing, computers and telecommunications services. Further specific standards will be developed in close cooperation between Eurostat and the EU Member States.
– Sampling and weightings: Eurostat and the EU Member States plan to develop additional requirements for the HICP.
– Owner-occupied housing: services provided by owner-occupied housing are currently excluded from the HICPs. Pi-lot calculations are being carried out using an approach based on the acquisition prices of housing that is new to the household sector — mainly newly constructed dwellings. Indices will be compiled separately from the HICPs on an experimental basis before any decision is made to incorporate them in the HICPs.
– Assessment and follow up of Member States’ compliance with the legal framework and documentation of Member States’ methods: The implementation of the new strategy on HICP compliance monitoring started in the second half of 2006 and will be further developed in the coming years. This strategy has involved the introduction of a “Country Desk” approach which facilitates the development of country-specific expertise. This means that each country has a nominated Eurostat officer who is responsible for monitoring developments in each country and overseeing all aspects of compliance monitoring. This requires identification of issues, analysis of data, and follow-up and implementation of the recommendations emanating from the compliance monitoring exercises.
64 http://epp.eurostat.ec.europa.eu/pls/portal/url/page/PGP_DS_HICP.
3 Methodological articles

155 European Economic Statistics
– Impact of indirect taxes and administered prices on the HICP: Pilot work is ongoing for the definition and computation of experimental indices in order to describe the impact of taxes and administered prices on the HICPs.
Other issues currently on the agenda include:
– the need for more comprehensive quality assurance of the HICP compilation process in the widest sense;
– support for those countries seeking to join the EU to ensure that their HICPs are fully comparable;
– consolidation of the legal framework for HICPs, and the production in due course of a methodological manual to assist both compilers and users;
– treatment of seasonal items: Eurostat and the EU Member States plan to develop additional requirements.
Methodological articles 3


Statistical annex

159 European Economic Statistics
Statistical annex 4
Introduction
This statistical annex contains tables of the key data presented in the data analysis section of this publication. The tables are presented for the most recent time periods available, broken down by country and including European aggregates as appropriate. It is important to note that the data presented are those available at end-April 2008, and therefore readers are encouraged to visit the Eurostat public database (accessible through the Eurostat website www.ec.europa.eu\eurostat) for more recent data.
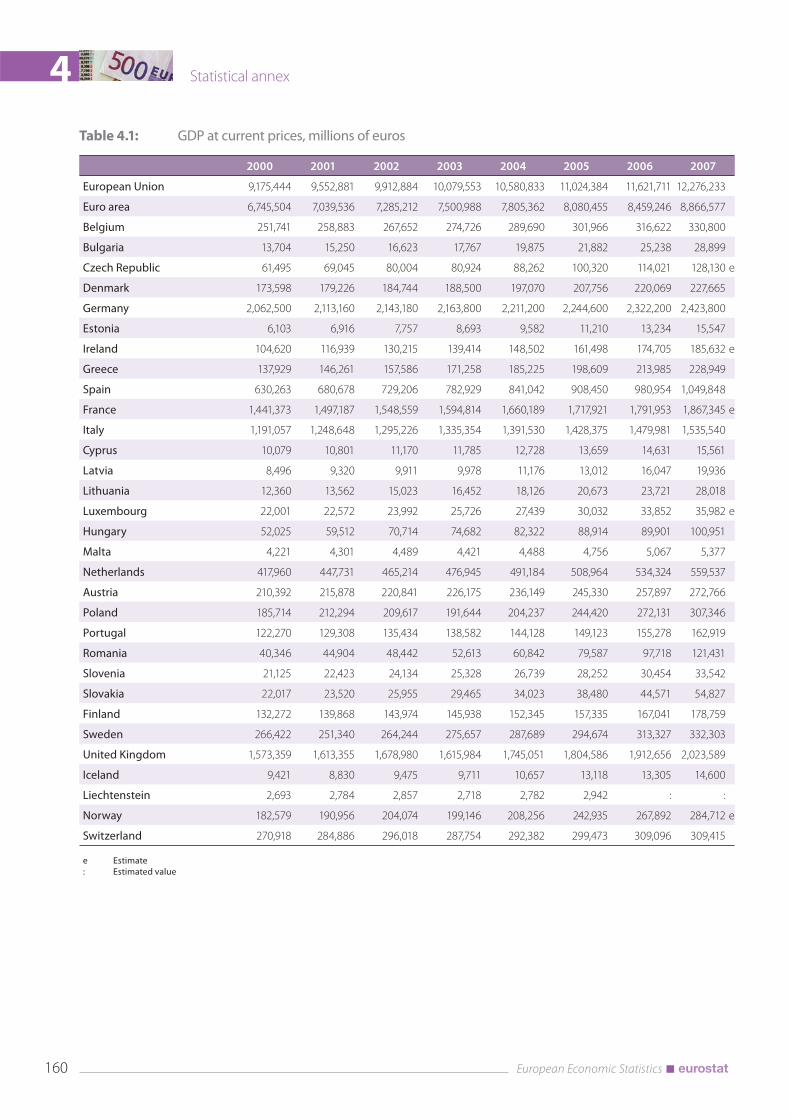
160 European Economic Statistics
4 Statistical annex
Table 4.1: GDP at current prices, millions of euros
2000 2001 2002 2003 2004 2005 2006 2007
European Union 9,175,444 9,552,881 9,912,884 10,079,553 10,580,833 11,024,384 11,621,711 12,276,233
Euro area 6,745,504 7,039,536 7,285,212 7,500,988 7,805,362 8,080,455 8,459,246 8,866,577
Belgium 251,741 258,883 267,652 274,726 289,690 301,966 316,622 330,800
Bulgaria 13,704 15,250 16,623 17,767 19,875 21,882 25,238 28,899
Czech Republic 61,495 69,045 80,004 80,924 88,262 100,320 114,021 128,130 e
Denmark 173,598 179,226 184,744 188,500 197,070 207,756 220,069 227,665
Germany 2,062,500 2,113,160 2,143,180 2,163,800 2,211,200 2,244,600 2,322,200 2,423,800
Estonia 6,103 6,916 7,757 8,693 9,582 11,210 13,234 15,547
Ireland 104,620 116,939 130,215 139,414 148,502 161,498 174,705 185,632 e
Greece 137,929 146,261 157,586 171,258 185,225 198,609 213,985 228,949
Spain 630,263 680,678 729,206 782,929 841,042 908,450 980,954 1,049,848
France 1,441,373 1,497,187 1,548,559 1,594,814 1,660,189 1,717,921 1,791,953 1,867,345 e
Italy 1,191,057 1,248,648 1,295,226 1,335,354 1,391,530 1,428,375 1,479,981 1,535,540
Cyprus 10,079 10,801 11,170 11,785 12,728 13,659 14,631 15,561
Latvia 8,496 9,320 9,911 9,978 11,176 13,012 16,047 19,936
Lithuania 12,360 13,562 15,023 16,452 18,126 20,673 23,721 28,018
Luxembourg 22,001 22,572 23,992 25,726 27,439 30,032 33,852 35,982 e
Hungary 52,025 59,512 70,714 74,682 82,322 88,914 89,901 100,951
Malta 4,221 4,301 4,489 4,421 4,488 4,756 5,067 5,377
Netherlands 417,960 447,731 465,214 476,945 491,184 508,964 534,324 559,537
Austria 210,392 215,878 220,841 226,175 236,149 245,330 257,897 272,766
Poland 185,714 212,294 209,617 191,644 204,237 244,420 272,131 307,346
Portugal 122,270 129,308 135,434 138,582 144,128 149,123 155,278 162,919
Romania 40,346 44,904 48,442 52,613 60,842 79,587 97,718 121,431
Slovenia 21,125 22,423 24,134 25,328 26,739 28,252 30,454 33,542
Slovakia 22,017 23,520 25,955 29,465 34,023 38,480 44,571 54,827
Finland 132,272 139,868 143,974 145,938 152,345 157,335 167,041 178,759
Sweden 266,422 251,340 264,244 275,657 287,689 294,674 313,327 332,303
United Kingdom 1,573,359 1,613,355 1,678,980 1,615,984 1,745,051 1,804,586 1,912,656 2,023,589
Iceland 9,421 8,830 9,475 9,711 10,657 13,118 13,305 14,600
Liechtenstein 2,693 2,784 2,857 2,718 2,782 2,942 : :
Norway 182,579 190,956 204,074 199,146 208,256 242,935 267,892 284,712 e
Switzerland 270,918 284,886 296,018 287,754 292,382 299,473 309,096 309,415
e Estimate
: Estimated value
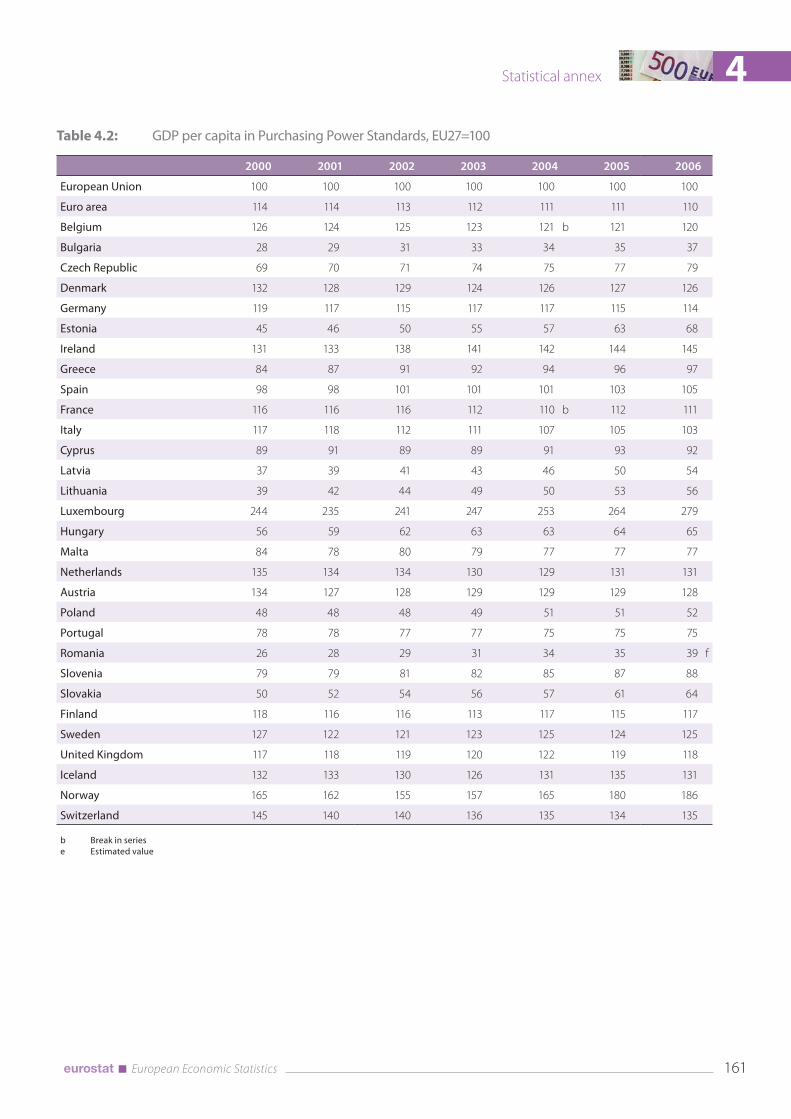
161 European Economic Statistics
Statistical annex 4
Table 4.2: GDP per capita in Purchasing Power Standards, EU27=100
2000 2001 2002 2003 2004 2005 2006
European Union 100 100 100 100 100 100 100
Euro area 114 114 113 112 111 111 110
Belgium 126 124 125 123 121 b 121 120
Bulgaria 28 29 31 33 34 35 37
Czech Republic 69 70 71 74 75 77 79
Denmark 132 128 129 124 126 127 126
Germany 119 117 115 117 117 115 114
Estonia 45 46 50 55 57 63 68
Ireland 131 133 138 141 142 144 145
Greece 84 87 91 92 94 96 97
Spain 98 98 101 101 101 103 105
France 116 116 116 112 110 b 112 111
Italy 117 118 112 111 107 105 103
Cyprus 89 91 89 89 91 93 92
Latvia 37 39 41 43 46 50 54
Lithuania 39 42 44 49 50 53 56
Luxembourg 244 235 241 247 253 264 279
Hungary 56 59 62 63 63 64 65
Malta 84 78 80 79 77 77 77
Netherlands 135 134 134 130 129 131 131
Austria 134 127 128 129 129 129 128
Poland 48 48 48 49 51 51 52
Portugal 78 78 77 77 75 75 75
Romania 26 28 29 31 34 35 39 f
Slovenia 79 79 81 82 85 87 88
Slovakia 50 52 54 56 57 61 64
Finland 118 116 116 113 117 115 117
Sweden 127 122 121 123 125 124 125
United Kingdom 117 118 119 120 122 119 118
Iceland 132 133 130 126 131 135 131
Norway 165 162 155 157 165 180 186
Switzerland 145 140 140 136 135 134 135
b Break in series
e Estimated value

162 European Economic Statistics
4 Statistical annex
Table 4.3: Gross Value Added by industry, % total Gross Value Added, 2006
Agriculture, hunting,
forestry and fishing
Total industry (excluding
construction)Construction
Trade, transport and
communication services
Financial services and
business activities
Other services
European Union 1.8 20.2 6.2 21.2 28 22.6
Euro area 1.8 20.3 6.4 20.8 27.9 22.8
Belgium 0.9 19.2 5 23.1 28.4 23.4
Bulgaria 8.5 24.1 6.8 23.8 21.5 15.3
Czech Republic 2.6 31.7 6.4 25.5 16.8 17
Denmark 1.6 20.5 5.5 21.5 24 27
Germany 0.9 25.4 4 17.9 29.5 22.3
Estonia 3.1 21 7.4 29.6 23.2 15.8
Ireland 1.7 25 9.9 16.8 26.4 20.2
Greece 3.7 15.7 8.6 30.1 18.2 23.7
Spain 2.9 18.2 12.2 24.6 21.3 20.9
France 2 14.4 6.3 18.6 32.8 25.8
Italy 2.1 20.7 6.1 22.8 27.2 21.1
Cyprus 2.6 10.8 8.3 27.5 26.4 24.4
Latvia 3.5 14.5 7.4 34.2 21.7 18.7
Lithuania 5.2 24.9 8.8 31.1 14.3 15.7
Luxembourg 0.4 9.3 5.3 21 48.5 15.6
Hungary 4.2 25.4 4.8 20.6 22.3 22.7
Malta 2.8 17.7 3.9 27.6 21.3 26.7
Netherlands 2.2 18.6 5.5 21.9 27.7 24.1
Austria 1.7 23 7.7 23.6 23.4 20.7
Poland 4.3 24.7 6.5 27.5 18.2 18.8
Portugal 2.9 17.8 6.5 24.4 22 26.3
Romania 8.8 27.5 8.4 25.4 17.6 12.2
Slovenia 2.3 27.4 6.2 22 21.7 20.3
Slovakia 3.9 28.6 6.9 26.6 18.7 15.2
Finland 2.5 26.4 6 22.1 21 22
Sweden 1.3 23.7 4.8 19.5 24.2 26.5
United Kingdom 0.9 17.5 5.4 21.3 32.7 22.3
Iceland 6.1 15.5 10.5 18.4 27.6 21.9
Norway 1.5 40.5 4.6 16 17.5 19.9
Switzerland 1.2 21.9 5.6 22.1 23 26.1

163 European Economic Statistics
Statistical annex 4
Table 4.4: Expenditure Components, % of GDP, 2006
Private final consumption
Government final consumption
Gross capital formation
External balance of goods and services
European Union 57.8 20.8 21.1 0.2
Euro area 57 20.3 21.6 1.1
Belgium 52.5 22.4 22 3.2
Bulgaria 70.4 16.6 31.7 -18.8
Czech Republic 48.8 21.2 26.9 3.1
Denmark 49.1 25.7 22.5 2.7
Germany 58.5 18.3 17.8 5.4
Estonia 54.1 16.4 38.2 -11.3
Ireland 45.5 16 27.2 10.7
Greece 71 15.8 25.7 -12.6
Spain 57.4 18.1 30.6 -6.1
France 56.7 23.6 21.1 -1.4
Italy 59.1 20.2 21.5 -0.8
Cyprus 64.5 18.6 20.5 -3.7
Latvia 65.2 16.6 39.7 -21.5
Lithuania 65.3 18 27 -10.4
Luxembourg 36 15.3 19 29.7
Hungary 53.6 22.9 22.9 0.6
Malta 63.3 19.9 20.7 -4
Netherlands 47.4 25.4 19.7 7.4
Austria 55.4 18 20.9 5.7
Poland 62 18.3 21.1 -1.4
Portugal 65 20.7 22.2 -8
Romania 68.9 16.6 26.5 -12
Slovenia 53.4 19.2 28.4 -1
Slovakia 56.8 19 28 -3.8
Finland 51.4 21.8 20.7 5
Sweden 47.4 26.3 18.1 8.2
United Kingdom 63.5 22 18 -3.6
Iceland 58.7 24.4 34.8 -18
Norway 40.8 19.3 21.7 18.2
Switzerland 59.2 11.1 22.1 7.5

164 European Economic Statistics
4 Statistical annex
Table 4.5: Income components, % of GDP, 2006
Compensation of employees
Wages and salaries
Employer’s social contributions
Gross operating surplus and
mixed income
Taxes on production and
imports less subsidies
European Union 48.7 38.4 10.3 38.9 12.4
Euro area 47.7 36.8 10.8 40.1 12.2
Belgium 50.0 37.0 12.9 38.2 11.8
Bulgaria 32.3 26.2 6.2 49.1 18.6
Czech Republic 42.8 32.3 10.5 48.2 9.0
Denmark 52.9 48.1 4.8 31.9 15.2
Germany 49.5 39.9 9.6 39.6 10.9
Estonia 44.5 33.8 10.7 43.4 12.1
Ireland 41.8 38.8 3.0 46.0 12.8
Greece 35.9 28.1 7.8 53.8 10.4
Spain 46.5 36.3 10.2 42.4 11.1
France 51.9 38.1 13.8 34.4 13.6
Italy 41.1 30.1 11.1 44.9 13.9
Cyprus 44.8 39.3 5.5 38.8 16.4
Latvia 43.9 37.0 7.0 44.4 11.7
Lithuania 42.7 33.7 9.0 47.4 9.9
Luxembourg 45.2 39.3 5.9 43.9 10.9
Hungary 47.8 : : 41.6 e 13.1
Malta 43.9 39.5 4.4 42.6 13.5
Netherlands 49.2 38.5 10.8 38.9 11.8
Austria 48.5 39.1 9.4 40.9 10.6
Poland 35.6 30.7 4.8 51.0 13.4
Portugal 50.2 : : : e :
Romania 40.7 : : : e :
Slovenia 51.4 44.1 7.3 35.2 13.4
Slovakia 36.8 28.5 8.3 53.5 9.7
Finland 48.3 38.7 9.6 39.7 12.0
Sweden 53.7 39.9 13.8 31.3 15.0
United Kingdom 55.5 46.6 8.9 32.4 12.2
Iceland 57.5 : : 24.8 17.7
Norway 40.6 33.2 7.4 49.1 10.4
Switzerland 62.1 : : 34.7 3.1
e Estimated value
: not available

165 European Economic Statistics
Statistical annex 4
Table 4.6: Volume GDP growth rate, percentage change on previous year
2000 2001 2002 2003 2004 2005 2006 2007
European Union 3.9 2 1.2 1.3 2.5 1.9 3.1 2.9
Euro area 3.8 1.9 0.9 0.8 2.1 1.6 2.8 2.6
Belgium 3.7 0.8 1.5 1 3 1.7 2.8 2.8
Bulgaria 5.4 4.1 4.5 5 6.6 6.2 6.3 6.2
Czech Republic 3.6 2.5 1.9 3.6 4.5 6.4 6.4 6.5 e
Denmark 3.5 0.7 0.5 0.4 2.3 2.5 3.9 1.8
Germany 3.2 1.2 0 -0.2 1.1 0.8 2.9 2.5
Estonia 9.6 7.7 8 7.2 8.3 10.2 11.2 7.1
Ireland 9.4 6.1 6.6 4.5 4.4 6 5.7 5.3 e
Greece 4.5 4.5 3.9 5 4.6 3.8 4.2 4
Spain 5 3.6 2.7 3.1 3.3 3.6 3.9 3.8
France 3.9 1.9 1 1.1 2.5 1.7 2 1.9 e
Italy 3.7 1.8 0.5 0 1.5 0.6 1.8 1.5
Cyprus 5 4 2.1 1.9 4.2 3.9 4 4.4
Latvia 6.9 8 6.5 7.2 8.7 10.6 12.2 10.3
Lithuania 4.1 6.6 6.9 10.3 7.3 7.9 7.7 8.8
Luxembourg 8.4 2.5 4.1 2.1 4.9 5 6.1 5.1 e
Hungary 5.2 4.1 4.4 4.2 4.8 4.1 3.9 1.3
Malta : -1.6 2.6 -0.3 0.2 3.4 3.4 3.8
Netherlands 3.9 1.9 0.1 0.3 2.2 1.5 3 3.5
Austria 3.4 0.8 0.9 1.2 2.3 2 3.3 3.4
Poland 4.3 1.2 1.4 3.9 5.3 3.6 6.2 6.5
Portugal 3.9 2 0.8 -0.8 1.5 0.9 1.3 1.9
Romania 2.1 5.7 5.1 5.2 8.5 4.2 7.9 6 e
Slovenia 4.1 3.1 3.7 2.8 4.4 4.1 5.7 6.1
Slovakia 1.4 3.4 4.8 4.8 5.2 6.6 8.5 10.4
Finland 5 2.6 1.6 1.8 3.7 2.8 4.9 4.4
Sweden 4.4 1.1 2.4 1.9 4.1 3.3 4.1 2.6
United Kingdom 3.8 2.4 2.1 2.8 3.3 1.8 2.9 3
Iceland 3.3 2 1.5 1 3.9 2.7 2.2 3.5 e
Norway 3.6 1.2 0.4 -0.2 2.5 2.4 3.2 3.1
Switzerland
e Estimated value

166 European Economic Statistics
4 Statistical annex
Table 4.7: Labour productivitity per person employed, % change
2000 2001 2002 2003 2004 2005 2006 2007
European Union 2.17 0.99 0.86 0.93 1.85 0.92 1.44 1.24
Euro area 1.38 0.37 0.19 0.34 1.34 0.67 1.16 0.82
Belgium 1.74 -0.64 1.66 0.94 2.28 0.45 1.57 1.07
Bulgaria 0.47 4.86 4.26 1.99 3.95 3.45 2.88 3.25
Czech Republic 3.83 1.99 1.33 5.02 4.13 5.35 4.4 4.61 e
Denmark 3 -0.2 0.43 1.48 2.93 1.61 2.24 -0.02
Germany 1.31 0.8 0.56 0.74 0.66 0.87 2.23 0.74
Estonia 11.21 6.77 6.63 5.7 8.29 8.02 5.51 6.31
Ireland 4.51 2.97 4.71 2.43 1.23 1.26 1.37 1.61 e
Greece 3.98 4.24 1.89 3.11 3.69 2.3 1.7 2.72
Spain -0.04 0.47 0.29 -0.02 -0.26 -0.44 0.11 0.66
France 1.2 0.08 0.4 0.96 2.36 1.26 1.23 0.64 e
Italy 1.72 -0.2 -1.23 -1.49 1.09 -0.02 -0.15 0.32
Cyprus 3.31 1.79 0.02 -1.8 0.4 0.34 2.26 1.08
Latvia 10.14 5.74 4.79 5.41 7.48 8.72 7.2 6.61
Lithuania 8.39 10.86 3.18 7.91 7.35 5.32 5.85 6.7
Luxembourg 2.73 -2.86 0.84 0.28 2.6 2.09 2.33 0.59 e
Hungary 3.87 3.81 4.33 2.84 5.52 4.14 3.19 1.47
Malta : -3.31 2.04 -1.32 0.82 2.01 2.21 1.07
Netherlands 1.65 -0.13 -0.42 0.83 3.13 1.27 1.13 1.07 e
Austria 2.25 0.25 0.85 0.97 1.67 0.68 2.28 1.41
Poland 5.92 e 3.48 e 4.57 e 5.13 e 3.99 e 1.26 e 2.77 e 2 e
Portugal 1.8 0.2 0.17 -0.24 1.62 1.24 0.62 e 1.69 e
Romania : : : 5.27 10.29 5.79 4.93 e 4.73 e
Slovenia 2.8 2.63 2.09 3.22 4.12 3.97 4.48 3.3
Slovakia 3.42 2.8 4.67 3.64 5.45 5.12 6.11 8.07
Finland 2.74 1.15 0.68 1.67 3.3 1.43 3.04 2.15
Sweden 1.9 -1.02 2.36 2.51 4.86 3.03 2.34 0.34
United Kingdom 2.6 1.53 1.27 1.8 2.19 0.82 2.04 2.32
Iceland 2.25 2.22 1.62 2.27 8.14 4.07 -0.68 e -0.67 e
Norway 2.67 1.63 1.12 2.07 3.38 1.5 -1.15 -0.29 e
Switzerland 2.51 -0.46 0 -0.03 2.25 1.99 0.95 1.44 e
e Estimated value

167 European Economic Statistics
Statistical annex 4
Table 4.8: Household saving rate
Calculated in % as: gross saving / gross disposable income
(adjusted for changes in the net equity of households in pension funds reserves)
2000 2001 2002 2003 2004 2005 2006
EU 27 11.7% 12.5% 12.4% 12.3% 11.9% 11.8% 11.4%
Euro area 13 13.5% 14.2% 14.8% 14.6% 14.5% 14.0% 13.8%
Belgium 15.4% 16.4% 15.8% 14.7% 13.3% 12.2% 12.5%
Bulgaria : : : : : : :
Czech Republic 8.5% 7.4% 8.1% 7.4% 4.9% 5.8% 4.9%
Denmark 4.9% 8.8% 8.8% 9.4% 5.8% 2.5% :
Germany 15.1% 15.2% 15.7% 16.0% 16.1% 16.3% 16.2%
Estonia 4.1% 3.1% 0.5% -1.1% -1.0% -0.8% -0.7%
Ireland : : 11.3% 12.2% 12.5% 13.0% 11.0%
Greece 10.5% 9.7% 8.3% 8.3% 8.9% : :
Spain 11.1% 11.1% 11.4% 11.9% 11.4% 10.6% 10.1%
France 14.9% 15.6% 16.7% 15.6% 15.6% 15.0% 15.3%
Italy 14.2% 16.0% 16.8% 16.0% 16.1% 15.9% 14.9%
Cyprus : : : : : : :
Latvia 2.9% -0.4% 1.2% 2.4% 2.5% 1.1% :
Lithuania 4.1% 3.7% 1.8% 0.9% 0.4% 1.5% :
Luxembourg : : : : : : :
Hungary : : : : 11.3% 11.0% :
Malta : : : : : : :
Netherlands 12.1% 14.7% 13.9% 13.1% 13.0% 12.1% 12.5%
Austria 12.8% 12.0% 12.1% 13.2% 13.3% 13.7% 14.1%
Poland 10.7% 12.1% 8.4% 7.8% 7.2% 7.7% :
Portugal 10.2% 10.9% 10.6% 10.5% 9.7% : :
Romania : : : : : : :
Slovenia 13.9% 15.4% 16.2% 13.5% 14.4% 14.2% :
Slovakia 11.1% 9.1% 8.9% 7.1% 6.2% 7.2% 6.5%
Finland 7.4% 7.6% 7.7% 8.3% 9.2% 7.7% 5.5%
Sweden 8.2% 12.7% 13.4% 13.2% 12.4% 11.8% :
United Kingdom 5.1% 6.4% 5.0% 4.9% 3.7% 5.6% 5.0%

168 European Economic Statistics
4 Statistical annex
Table 4.9: Investment rate of non-financial corporations
Calculated in % as: gross fixed capital formation / gross
value added of non-financial corporations
2000 2001 2002 2003 2004 2005 2006
EU 27 22.7% 22.2% 21.4% 21.1% 21.1% 21.9% 22.2%
Euro area 13 22.7% 22.1% 21.2% 20.9% 21.1% 21.6% 22.1%
Belgium 23.4% 22.5% 20.8% 20.8% 20.9% 21.4% 21.3%
Bulgaria : : : : : : :
Czech Republic 33.2% 33.6% 31.9% 30.6% 28.7% 26.8% 25.8%
Denmark 25.3% 24.7% 26.0% 25.7% 25.2% 26.2% :
Germany 21.1% 19.8% 17.9% 17.7% 17.5% 17.7% 18.1%
Estonia 31.4% 30.4% 33.7% 36.1% 34.5% 31.5% 33.3%
Ireland : : 16.1% 15.6% 15.6% 17.3% 16.0%
Greece 45.0% 49.5% 50.9% 54.5% 52.5% : :
Spain 30.5% 29.9% 29.8% 30.4% 31.5% 33.3% 34.3%
France 19.7% 19.8% 18.7% 18.2% 18.6% 18.9% 19.5%
Italy 23.8% 23.8% 24.8% 24.1% 24.0% 24.2% 24.9%
Cyprus : : : : : : :
Latvia 35.9% 36.0% 34.8% 34.8% 37.6% 37.1% :
Lithuania 24.2% 25.5% 23.8% 24.0% 24.0% 23.1% :
Luxembourg : : : : : : :
Hungary : : : : 25.1% 17.6% :
Malta : : : : : : :
Netherlands 18.2% 17.4% 16.8% 15.2% 15.1% 15.0% 15.4%
Austria 30.2% 29.1% 26.5% 28.2% 27.5% 27.0% 27.2%
Poland 38.2% 29.4% 25.2% 23.8% 22.4% 22.3% :
Portugal 33.0% 31.8% 29.7% 28.4% 27.0% : :
Romania : : : : : : :
Slovenia 30.8% 27.9% 26.3% 27.5% 28.1% 28.0% :
Slovakia 32.3% 40.0% 38.0% 36.6% 35.4% 40.9% 38.7%
Finland 19.8% 20.4% 17.6% 17.1% 16.8% 17.6% 17.9%
Sweden 23.6% 22.8% 21.0% 20.0% 20.1% 21.6% :
United Kingdom 18.3% 18.0% 17.7% 16.7% 16.2% : :
Table 4.10: Profit share of non-financial corporations
Calculated in % as: gross
operating surplus / gross value
added of non-financial corporations
2000 2001 2002 2003 2004 2005 2006
36.7% 36.7% 36.6% 36.9% 37.6% 37.6% 38.0%
37.6% 38.2% 38.1% 38.2% 38.6% 38.7% 39.0%
35.2% 33.9% 34.1% 35.2% 37.1% 38.8% 39.4%
: : : : : : :
47.6% 48.1% 47.2% 45.7% 46.7% 47.6% 48.1%
40.7% 38.1% 37.4% 37.3% 37.9% 39.3% :
36.3% 37.2% 37.5% 37.7% 38.7% 40.0% 41.1%
44.7% 46.1% 46.8% 48.0% 48.6% 49.5% 48.2%
: : 58.9% 57.3% 55.4% 54.4% 52.0%
53.1% 54.3% 54.9% 56.3% 56.1% : :
35.8% 35.8% 36.0% 36.0% 36.6% 36.6% 36.9%
31.2% 31.3% 30.7% 31.0% 30.8% 30.3% 30.7%
46.9% 47.0% 46.3% 45.6% 45.7% 44.3% 43.2%
: : : : : : :
49.8% 52.7% 55.7% 54.1% 52.8% 49.6% :
51.7% 56.8% 56.7% 56.6% 55.9% 56.3% :
: : : : : : :
: : : : 41.4% 43.8% :
: : : : : : :
39.2% 38.8% 38.9% 38.1% 38.5% 39.9% 40.5%
40.3% 39.6% 39.7% 40.2% 41.8% 42.2% 43.0%
36.7% 33.8% 38.0% 42.1% 47.4% 46.6% :
36.7% 37.2% 37.0% 35.5% 36.9% : :
: : : : : : :
28.4% 29.1% 29.8% 31.8% 31.6% 31.4% :
48.5% 49.9% 47.3% 49.6% 54.4% 51.5% 53.2%
45.7% 45.8% 45.5% 45.0% 45.2% 43.8% 45.2%
29.3% 25.8% 26.3% 26.8% 28.2% 29.4% :
34.6% 33.6% 33.4% 34.1% 34.8% : :
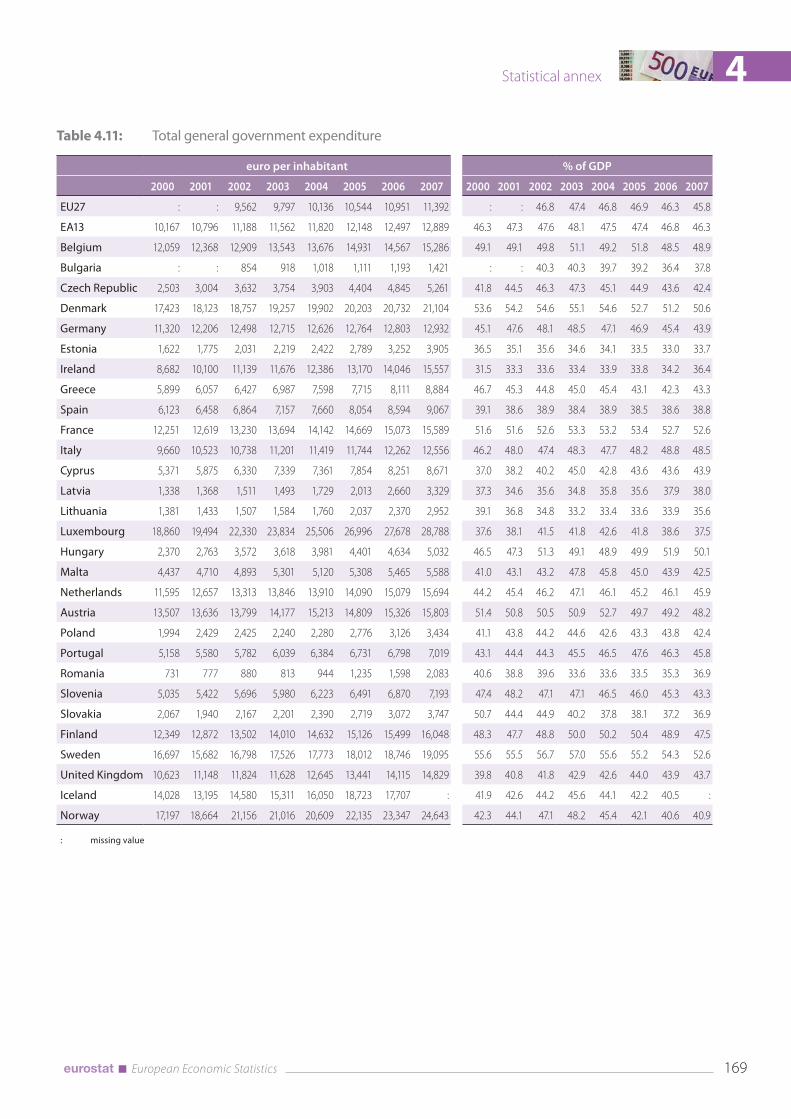
169 European Economic Statistics
Statistical annex 4
Table 4.11: Total general government expenditure
euro per inhabitant % of GDP
2000 2001 2002 2003 2004 2005 2006 2007 2000 2001 2002 2003 2004 2005 2006 2007
EU27 : : 9,562 9,797 10,136 10,544 10,951 11,392 : : 46.8 47.4 46.8 46.9 46.3 45.8
EA13 10,167 10,796 11,188 11,562 11,820 12,148 12,497 12,889 46.3 47.3 47.6 48.1 47.5 47.4 46.8 46.3
Belgium 12,059 12,368 12,909 13,543 13,676 14,931 14,567 15,286 49.1 49.1 49.8 51.1 49.2 51.8 48.5 48.9
Bulgaria : : 854 918 1,018 1,111 1,193 1,421 : : 40.3 40.3 39.7 39.2 36.4 37.8
Czech Republic 2,503 3,004 3,632 3,754 3,903 4,404 4,845 5,261 41.8 44.5 46.3 47.3 45.1 44.9 43.6 42.4
Denmark 17,423 18,123 18,757 19,257 19,902 20,203 20,732 21,104 53.6 54.2 54.6 55.1 54.6 52.7 51.2 50.6
Germany 11,320 12,206 12,498 12,715 12,626 12,764 12,803 12,932 45.1 47.6 48.1 48.5 47.1 46.9 45.4 43.9
Estonia 1,622 1,775 2,031 2,219 2,422 2,789 3,252 3,905 36.5 35.1 35.6 34.6 34.1 33.5 33.0 33.7
Ireland 8,682 10,100 11,139 11,676 12,386 13,170 14,046 15,557 31.5 33.3 33.6 33.4 33.9 33.8 34.2 36.4
Greece 5,899 6,057 6,427 6,987 7,598 7,715 8,111 8,884 46.7 45.3 44.8 45.0 45.4 43.1 42.3 43.3
Spain 6,123 6,458 6,864 7,157 7,660 8,054 8,594 9,067 39.1 38.6 38.9 38.4 38.9 38.5 38.6 38.8
France 12,251 12,619 13,230 13,694 14,142 14,669 15,073 15,589 51.6 51.6 52.6 53.3 53.2 53.4 52.7 52.6
Italy 9,660 10,523 10,738 11,201 11,419 11,744 12,262 12,556 46.2 48.0 47.4 48.3 47.7 48.2 48.8 48.5
Cyprus 5,371 5,875 6,330 7,339 7,361 7,854 8,251 8,671 37.0 38.2 40.2 45.0 42.8 43.6 43.6 43.9
Latvia 1,338 1,368 1,511 1,493 1,729 2,013 2,660 3,329 37.3 34.6 35.6 34.8 35.8 35.6 37.9 38.0
Lithuania 1,381 1,433 1,507 1,584 1,760 2,037 2,370 2,952 39.1 36.8 34.8 33.2 33.4 33.6 33.9 35.6
Luxembourg 18,860 19,494 22,330 23,834 25,506 26,996 27,678 28,788 37.6 38.1 41.5 41.8 42.6 41.8 38.6 37.5
Hungary 2,370 2,763 3,572 3,618 3,981 4,401 4,634 5,032 46.5 47.3 51.3 49.1 48.9 49.9 51.9 50.1
Malta 4,437 4,710 4,893 5,301 5,120 5,308 5,465 5,588 41.0 43.1 43.2 47.8 45.8 45.0 43.9 42.5
Netherlands 11,595 12,657 13,313 13,846 13,910 14,090 15,079 15,694 44.2 45.4 46.2 47.1 46.1 45.2 46.1 45.9
Austria 13,507 13,636 13,799 14,177 15,213 14,809 15,326 15,803 51.4 50.8 50.5 50.9 52.7 49.7 49.2 48.2
Poland 1,994 2,429 2,425 2,240 2,280 2,776 3,126 3,434 41.1 43.8 44.2 44.6 42.6 43.3 43.8 42.4
Portugal 5,158 5,580 5,782 6,039 6,384 6,731 6,798 7,019 43.1 44.4 44.3 45.5 46.5 47.6 46.3 45.8
Romania 731 777 880 813 944 1,235 1,598 2,083 40.6 38.8 39.6 33.6 33.6 33.5 35.3 36.9
Slovenia 5,035 5,422 5,696 5,980 6,223 6,491 6,870 7,193 47.4 48.2 47.1 47.1 46.5 46.0 45.3 43.3
Slovakia 2,067 1,940 2,167 2,201 2,390 2,719 3,072 3,747 50.7 44.4 44.9 40.2 37.8 38.1 37.2 36.9
Finland 12,349 12,872 13,502 14,010 14,632 15,126 15,499 16,048 48.3 47.7 48.8 50.0 50.2 50.4 48.9 47.5
Sweden 16,697 15,682 16,798 17,526 17,773 18,012 18,746 19,095 55.6 55.5 56.7 57.0 55.6 55.2 54.3 52.6
United Kingdom 10,623 11,148 11,824 11,628 12,645 13,441 14,115 14,829 39.8 40.8 41.8 42.9 42.6 44.0 43.9 43.7
Iceland 14,028 13,195 14,580 15,311 16,050 18,723 17,707 : 41.9 42.6 44.2 45.6 44.1 42.2 40.5 :
Norway 17,197 18,664 21,156 21,016 20,609 22,135 23,347 24,643 42.3 44.1 47.1 48.2 45.4 42.1 40.6 40.9
: missing value

170 European Economic Statistics
4 Statistical annex
Table 4.12: Total general government expenditure; millions of euro
2000 2001 2002 2003 2004 2005 2006 2007
EU27 : : 4,642,714 4,777,071 4,964,412 5,186,503 5,407,046 5,645,777
EA13 3,119,942 3,328,487 3,469,021 3,607,282 3,711,263 3,836,235 3,966,013 4,110,916
Belgium 123,554 127,150 133,354 140,477 142,458 156,385 153,582 161,486
Bulgaria : : 6,697 7,160 7,898 8,576 9,186 10,937
Czech Republic 25,715 30,717 37,047 38,292 39,838 45,070 49,737 54,282
Denmark 93,002 97,084 100,839 103,793 107,531 109,477 112,718 115,229
Germany 930,400 1,005,060 1,030,840 1,049,210 1,041,690 1,052,590 1,054,490 1,063,770
Estonia 2,225 2,426 2,764 3,009 3,272 3,758 4,374 5,242
Ireland 32,990 38,975 43,735 46,598 50,276 54,639 59,743 67,558
Greece 64,406 66,318 70,614 77,016 84,044 85,662 90,424 99,249
Spain 246,542 262,982 283,597 300,643 327,015 349,524 378,725 406,883
France 744,253 772,060 815,144 849,587 883,073 921,454 952,516 991,049
Italy 550,032 599,587 613,734 645,251 664,303 688,254 722,751 744,817
Cyprus 3,728 4,121 4,496 5,305 5,445 5,952 6,375 6,829
Latvia 3,172 3,222 3,533 3,471 3,998 4,631 6,086 7,575
Lithuania 4,834 4,987 5,226 5,470 6,048 6,955 8,043 9,965
Luxembourg 8,270 8,607 9,964 10,766 11,684 12,559 13,083 13,743
Hungary 24,203 28,144 36,284 36,650 40,234 44,393 46,668 50,601
Malta 1,730 1,851 1,937 2,112 2,054 2,141 2,223 2,287
Netherlands 184,612 203,063 214,960 224,621 226,403 229,905 246,410 257,026
Austria 108,210 109,676 111,544 115,085 124,365 121,929 126,926 131,411
Poland 76,293 92,913 92,703 85,561 87,053 105,937 119,186 130,871
Portugal 52,740 57,432 59,945 63,057 67,040 71,009 71,947 74,538
Romania 16,390 17,417 19,171 17,659 20,460 26,698 34,489 44,819
Slovenia 10,016 10,800 11,365 11,938 12,428 12,987 13,793 14,520
Slovakia 11,165 10,436 11,657 11,838 12,864 14,649 16,559 20,222
Finland 63,917 66,778 70,226 73,035 76,484 79,339 81,623 84,865
Sweden 148,132 139,508 149,923 156,998 159,849 162,646 170,235 174,683
United Kingdom 625,566 658,985 701,417 692,471 756,606 809,386 855,157 901,320
Iceland 3,944 3,761 4,193 4,429 4,696 5,539 5,389 :
Norway 77,232 84,230 96,029 95,939 94,616 102,310 108,822 115,779
: missing value

171 European Economic Statistics
Statistical annex 4
Table 4.13: Main components of total general government expenditure; millions of euro; 2007
Social transfers
Compen-sation of
employees
Intermedi-ate con-
sumption
Property income, incl.
interest
Public in-vestments
Other current
transfersOthers
Total ex-penditure
EU27 2,359,050 1,282,168 784,456 336,589 314,505 261,437 307,572 5,645,777
EA13 1,877,041 893,715 441,327 264,976 226,637 169,715 237,505 4,110,916
Belgium 74,594 39,063 12,049 12,803 5,579 7,004 10,395 161,486
Bulgaria 3,512 2,597 2,311 297 1,393 367 460 10,937
Czech Republic 23,040 9,662 7,783 1,454 6,166 1,637 4,540 54,282
Denmark 37,411 38,074 19,966 3,413 4,181 5,811 6,372 115,229
Germany 597,940 168,400 101,490 67,140 36,210 36,270 56,320 1,063,770
Estonia 1,662 1,428 1,012 23 685 264 168 5,242
Ireland 21,510 18,438 10,121 1,766 7,768 4,163 3,793 67,558
Greece 39,666 25,300 11,624 9,940 6,876 3,769 2,074 99,249
Spain 148,398 107,361 54,176 16,664 39,481 15,696 25,107 406,883
France 436,097 243,236 95,786 51,789 61,764 52,875 49,502 991,049
Italy 307,006 164,645 79,738 76,180 36,134 23,810 57,304 744,817
Cyprus 1,903 2,266 792 505 479 701 183 6,829
Latvia 1,609 2,295 1,377 107 1,134 801 253 7,575
Lithuania 2,972 2,828 1,517 200 1,469 464 515 9,965
Luxembourg 6,488 2,658 1,093 79 1,388 980 1,057 13,743
Hungary 18,364 11,543 6,502 4,135 3,632 3,007 3,418 50,601
Malta 704 703 293 182 218 88 99 2,287
Netherlands 114,631 52,180 38,657 13,014 19,122 10,034 9,388 257,026
Austria 62,609 24,644 11,761 7,713 2,768 6,618 15,299 131,411
Poland 50,988 29,482 18,192 7,945 12,699 7,180 4,386 130,871
Portugal 31,308 21,006 6,670 4,676 3,920 3,350 3,608 74,538
Romania 11,645 11,739 7,362 903 6,731 3,501 2,938 44,819
Slovenia 5,595 3,640 2,056 441 1,238 656 893 14,520
Slovakia 8,695 3,754 2,488 760 1,029 1,704 1,793 20,222
Finland 31,199 23,145 16,106 2,770 4,389 4,491 2,765 84,865
Sweden 60,602 50,055 31,086 6,187 10,377 7,220 9,157 174,683
United Kingdom 258,905 222,027 242,448 45,502 37,674 58,977 35,786 901,320
Norway 40,417 34,725 17,439 3,551 8,527 5,748 5,372 115,779

172 European Economic Statistics
4 Statistical annex
Table 4.14: Total government expenditure by COFOG functions; % of GDP; 2006
General public
servicesDefence
Public order and
safety
Econom-ic affairs
Environ-ment pro-
tection
Housing and com-
munity amenities
HealthRecreation, culture and
religion
Educa-tion
Social protec-
tion
EU27** 6.5 1.6 1.8 3.9 0.7 1.0 6.4 1.0 5.2 18.7
EA13* 7.0 1.4 1.6 3.9 0.7 1.0 6.5 1.0 5.0 19.3
Belgium* 9.0 1.1 1.6 4.8 0.6 0.4 7.0 1.3 6.0 17.7
Bulgaria** 5.1 1.9 2.9 5.1 0.8 0.6 4.2 0.8 4.2 13.0
Czech Republic 4.9 1.2 2.1 6.9 1.1 1.2 7.2 1.3 4.9 12.7
Denmark 6.0 1.6 1.0 3.5 0.5 0.5 7.0 1.6 7.7 21.8
Germany 6.0 1.1 1.6 3.3 0.5 0.9 6.2 0.6 4.0 21.2
Estonia 2.6 1.4 2.1 4.2 0.7 0.0 4.0 2.4 6.0 9.5
Ireland 3.6 0.5 1.4 4.5 0.6 1.3 7.8 0.6 4.2 9.7
Greece 8.1 2.3 1.1 4.5 0.6 0.4 4.7 0.3 2.3 17.9
Spain 4.6 1.1 1.8 5.0 0.9 0.9 5.6 1.5 4.3 12.8
France* 7.3 1.9 1.4 3.0 0.9 1.8 7.4 1.5 6.1 22.3
Italy 8.7 1.4 1.9 5.9 0.8 0.7 7.0 0.8 4.5 18.2
Cyprus 9.9 2.3 2.2 4.4 0.3 2.5 3.1 1.2 7.2 10.4
Latvia 6.1 1.4 2.2 6.0 1.0 0.8 2.9 1.3 6.3 9.6
Lithuania 4.2 1.6 1.8 4.0 0.8 0.4 4.7 1.0 5.5 10.0
Luxembourg 4.0 0.2 0.9 4.5 1.0 0.6 4.6 1.7 4.5 16.4
Hungary 9.6 1.4 2.2 6.3 0.7 1.1 5.5 1.7 5.8 17.7
Malta 6.7 0.8 1.5 5.7 1.7 0.8 6.4 0.6 5.5 14.0
Netherlands 7.3 1.5 1.8 4.7 0.8 1.0 5.9 1.4 5.1 16.5
Austria 7.0 0.9 1.4 4.8 0.4 0.6 6.9 1.0 5.9 20.4
Poland 5.9 1.2 1.8 4.4 0.6 1.2 4.7 1.1 6.0 16.9
Portugal 6.9 1.3 1.9 3.8 0.6 0.6 7.2 1.0 7.1 16.0
Romania* 3.4 1.7 2.4 6.7 0.2 2.1 5.8 0.9 4.1 10.8
Slovenia 6.2 1.4 1.7 4.1 0.4 0.6 6.2 1.2 6.4 17.1
Slovakia* 6.4 p 1.6 p 2.0 p 3.8 p 0.7 p 0.8 p 5.0 p 0.9 p 4.0 p 11.6 p
Finland 6.5 1.5 1.5 4.5 0.3 0.3 6.8 1.1 5.8 20.4
Sweden 7.7 1.7 1.3 4.8 0.4 0.7 6.8 1.1 7.1 22.7
United Kingdom* 4.8 2.5 2.5 2.7 1.0 0.9 6.9 0.9 5.7 15.6
Norway 4.3 1.6 0.9 3.6 0.6 0.6 6.9 1.0 5.5 15.6
* 2005 data
** 2004 data

173 European Economic Statistics
Statistical annex 4
Table 4.15: Total general government revenue
euro per inhabitant % of GDP
2000 2001 2002 2003 2004 2005 2006 2007 2000 2001 2002 2003 2004 2005 2006 2007
EU27 : : 9,047 9,154 9,516 9,985 10,607 11,171 : : 44.3 44.3 43.9 44.4 44.9 44.9
EA13 10,166 10,375 10,583 10,822 11,093 11,494 12,137 12,711 46.2 45.4 45.0 45.0 44.6 44.9 45.5 45.6
Belgium 12,072 12,496 12,900 13,534 13,655 14,236 14,652 15,220 49.1 49.6 49.8 51.1 49.1 49.4 48.8 48.7
Bulgaria : : 833 907 1,054 1,162 1,291 1,548 : : 39.3 39.8 41.2 41.0 39.4 41.2
Czech Republic 2,281 2,617 3,101 3,230 3,649 4,054 4,551 5,068 38.1 38.7 39.5 40.7 42.2 41.4 41.0 40.8
Denmark 18,161 18,518 18,838 19,221 20,582 22,118 22,703 22,962 55.8 55.3 54.8 55.0 56.4 57.7 56.1 55.1
Germany 11,650 11,482 11,548 11,657 11,614 11,848 12,350 12,934 46.4 44.7 44.4 44.5 43.3 43.5 43.8 43.9
Estonia 1,611 1,772 2,052 2,337 2,543 2,941 3,602 4,277 36.2 35.0 36.0 36.4 35.9 35.4 36.6 36.9
Ireland 9,987 10,398 11,014 11,827 12,899 13,809 15,276 15,684 36.3 34.3 33.2 33.9 35.3 35.5 37.2 36.7
Greece 5,428 5,463 5,738 6,104 6,380 6,767 7,554 8,243 43.0 40.9 40.0 39.3 38.1 37.8 39.4 40.2
Spain 5,967 6,348 6,780 7,115 7,590 8,256 8,992 9,584 38.1 38.0 38.4 38.2 38.5 39.4 40.4 41.0
France 11,901 12,239 12,434 12,635 13,177 13,855 14,386 14,792 50.2 50.0 49.5 49.2 49.6 50.4 50.3 49.9
Italy 9,479 9,843 10,055 10,380 10,568 10,672 11,411 12,074 45.3 44.9 44.4 44.8 44.2 43.8 45.4 46.6
Cyprus 5,035 5,531 5,637 6,281 6,660 7,418 8,024 9,315 34.7 35.9 35.8 38.5 38.7 41.2 42.4 47.2
Latvia 1,239 1,286 1,414 1,423 1,679 1,993 2,645 3,326 34.6 32.5 33.4 33.2 34.7 35.2 37.7 38.0
Lithuania 1,268 1,294 1,425 1,523 1,679 2,006 2,338 2,850 35.9 33.2 32.9 32.0 31.8 33.1 33.4 34.3
Luxembourg 21,855 22,616 23,459 24,129 24,769 26,924 28,607 31,034 43.6 44.2 43.6 42.4 41.4 41.7 39.9 40.5
Hungary 2,220 2,525 2,949 3,091 3,457 3,714 3,806 4,480 43.6 43.2 42.4 41.9 42.4 42.1 42.6 44.6
Malta 3,769 4,007 4,274 4,208 4,600 4,959 5,148 5,354 34.8 36.6 37.7 37.9 41.1 42.1 41.3 40.7
Netherlands 12,113 12,586 12,706 12,919 13,377 13,999 15,239 15,823 46.1 45.1 44.1 43.9 44.3 44.9 46.6 46.3
Austria 13,026 13,595 13,574 13,757 14,100 14,339 14,820 15,585 49.6 50.7 49.7 49.4 48.8 48.1 47.6 47.5
Poland 1,847 2,145 2,150 1,926 1,975 2,499 2,855 3,270 38.1 38.6 39.2 38.4 36.9 39.0 40.0 40.4
Portugal 4,803 5,037 5,404 5,647 5,919 5,876 6,227 6,612 40.2 40.1 41.4 42.5 43.1 41.6 42.4 43.1
Romania 788 736 835 776 910 1,189 1,498 1,944 43.8 36.7 37.6 32.1 32.4 32.3 33.1 34.4
Slovenia 4,634 4,969 5,395 5,635 5,921 6,285 6,682 7,181 43.6 44.1 44.6 44.4 44.2 44.5 44.1 43.2
Slovakia 1,569 1,656 1,772 2,051 2,241 2,519 2,773 3,528 38.5 37.9 36.7 37.4 35.4 35.3 33.5 34.7
Finland 14,121 14,225 14,650 14,684 15,266 15,927 16,770 17,821 55.3 52.8 52.9 52.5 52.4 53.1 52.9 52.7
Sweden 17,822 16,157 16,378 17,170 17,955 18,662 19,501 20,339 59.3 57.2 55.3 55.8 56.1 57.2 56.5 56.0
United Kingdom 10,995 11,331 11,283 10,730 11,657 12,422 13,308 13,875 41.2 41.5 39.9 39.5 39.2 40.7 41.4 40.9
Iceland 14,596 12,982 13,740 14,373 16,113 21,039 19,981 : 43.6 41.9 41.7 42.8 44.2 47.4 45.7 :
Norway 23,447 24,299 25,297 24,198 25,661 30,065 33,983 35,158 57.7 57.4 56.3 55.5 56.6 57.2 59.1 58.3
: missing value

174 European Economic Statistics
4 Statistical annex
Table 4.16: Total general government revenue; millions of euro
2000 2001 2002 2003 2004 2005 2006 2007
EU27 : : 4,392,958 4,463,560 4,660,683 4,911,693 5,236,911 5,536,165
EA13 3,119,617 3,198,773 3,281,359 3,376,411 3,483,125 3,629,702 3,851,830 4,054,168
Belgium 123,686 128,469 133,254 140,390 142,244 149,103 154,480 160,791
Bulgaria : : 6,533 7,074 8,183 8,971 9,942 11,918
Czech Republic 23,426 26,753 31,633 32,954 37,243 41,491 46,722 52,288
Denmark 96,941 99,199 101,273 103,602 111,204 119,859 123,435 125,370
Germany 957,490 945,450 952,500 961,930 958,130 977,020 1,017,230 1,064,000
Estonia 2,211 2,422 2,793 3,168 3,436 3,963 4,844 5,741
Ireland 37,949 40,125 43,245 47,200 52,359 57,289 64,975 68,108
Greece 59,255 59,816 63,041 67,290 70,578 75,140 84,214 92,085
Spain 240,259 258,490 280,121 298,850 324,030 358,276 396,280 430,052
France 723,013 748,775 766,134 783,903 822,858 870,325 909,129 940,406
Italy 539,744 560,854 574,725 597,932 614,802 625,439 672,606 716,234
Cyprus 3,495 3,880 4,004 4,540 4,927 5,622 6,199 7,337
Latvia 2,937 3,027 3,308 3,309 3,883 4,585 6,052 7,567
Lithuania 4,436 4,504 4,945 5,259 5,769 6,850 7,935 9,619
Luxembourg 9,583 9,985 10,467 10,899 11,347 12,525 13,523 14,815
Hungary 22,670 25,727 29,954 31,313 34,939 37,467 38,329 45,048
Malta 1,470 1,575 1,692 1,677 1,845 2,000 2,094 2,191
Netherlands 192,856 201,922 205,155 209,580 217,724 228,426 249,014 259,128
Austria 104,361 109,348 109,729 111,680 115,262 118,057 122,737 129,600
Poland 70,669 82,034 82,207 73,552 75,413 95,370 108,879 124,624
Portugal 49,114 51,844 56,032 58,964 62,164 61,986 65,912 70,213
Romania 17,674 16,490 18,197 16,872 19,716 25,719 32,320 41,820
Slovenia 9,218 9,898 10,763 11,249 11,826 12,575 13,416 14,496
Slovakia 8,472 8,910 9,533 11,033 12,061 13,570 14,949 19,037
Finland 73,088 73,797 76,193 76,545 79,802 83,541 88,315 94,241
Sweden 158,113 143,728 146,176 153,812 161,486 168,514 177,084 186,057
United Kingdom 647,450 669,802 669,351 638,983 697,454 748,010 806,300 843,379
Iceland 4,104 3,701 3,951 4,158 4,714 6,225 6,081 :
Norway 105,300 109,660 114,824 110,463 117,810 138,961 158,393 165,183
: missing value
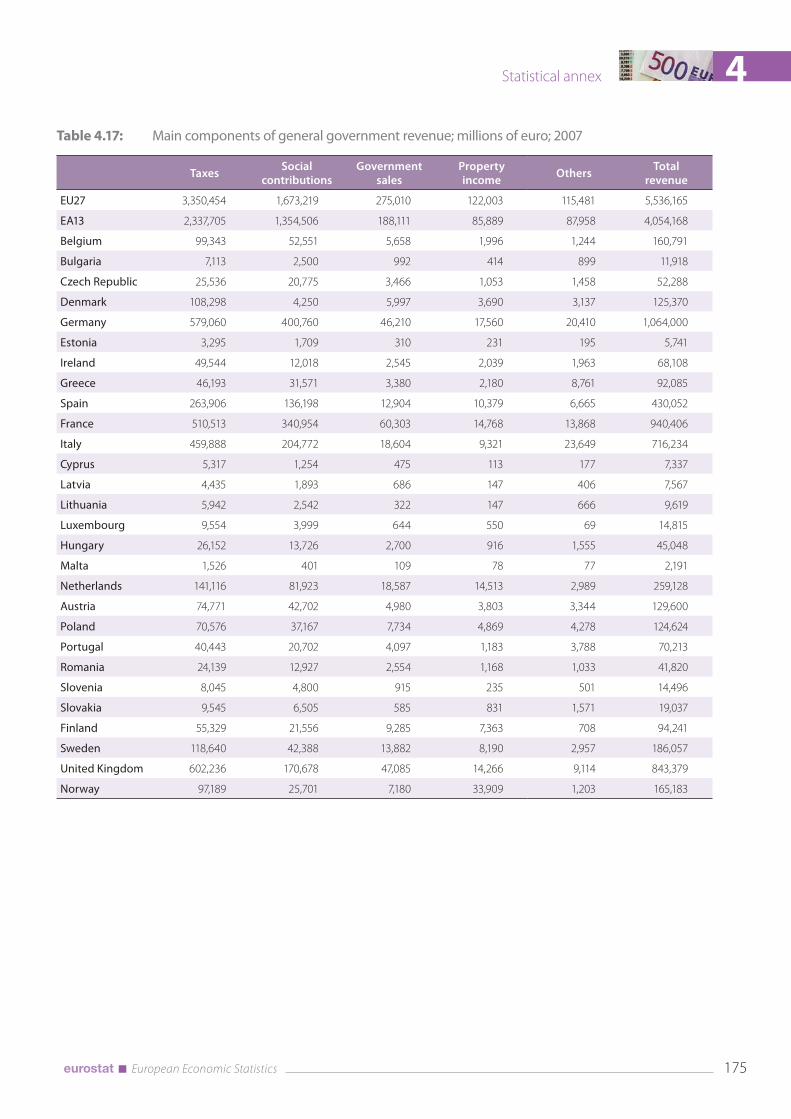
175 European Economic Statistics
Statistical annex 4
Table 4.17: Main components of general government revenue; millions of euro; 2007
TaxesSocial
contributionsGovernment
salesProperty income
OthersTotal
revenue
EU27 3,350,454 1,673,219 275,010 122,003 115,481 5,536,165
EA13 2,337,705 1,354,506 188,111 85,889 87,958 4,054,168
Belgium 99,343 52,551 5,658 1,996 1,244 160,791
Bulgaria 7,113 2,500 992 414 899 11,918
Czech Republic 25,536 20,775 3,466 1,053 1,458 52,288
Denmark 108,298 4,250 5,997 3,690 3,137 125,370
Germany 579,060 400,760 46,210 17,560 20,410 1,064,000
Estonia 3,295 1,709 310 231 195 5,741
Ireland 49,544 12,018 2,545 2,039 1,963 68,108
Greece 46,193 31,571 3,380 2,180 8,761 92,085
Spain 263,906 136,198 12,904 10,379 6,665 430,052
France 510,513 340,954 60,303 14,768 13,868 940,406
Italy 459,888 204,772 18,604 9,321 23,649 716,234
Cyprus 5,317 1,254 475 113 177 7,337
Latvia 4,435 1,893 686 147 406 7,567
Lithuania 5,942 2,542 322 147 666 9,619
Luxembourg 9,554 3,999 644 550 69 14,815
Hungary 26,152 13,726 2,700 916 1,555 45,048
Malta 1,526 401 109 78 77 2,191
Netherlands 141,116 81,923 18,587 14,513 2,989 259,128
Austria 74,771 42,702 4,980 3,803 3,344 129,600
Poland 70,576 37,167 7,734 4,869 4,278 124,624
Portugal 40,443 20,702 4,097 1,183 3,788 70,213
Romania 24,139 12,927 2,554 1,168 1,033 41,820
Slovenia 8,045 4,800 915 235 501 14,496
Slovakia 9,545 6,505 585 831 1,571 19,037
Finland 55,329 21,556 9,285 7,363 708 94,241
Sweden 118,640 42,388 13,882 8,190 2,957 186,057
United Kingdom 602,236 170,678 47,085 14,266 9,114 843,379
Norway 97,189 25,701 7,180 33,909 1,203 165,183

176 European Economic Statistics
4 Statistical annex
Table 4.18: Main types of tax revenues of general government and EU institutions; % of GDP; 2006
VATOther taxes on products and
production
Taxes on income
Social contributions
OthersTotal tax revenues
EU27 7.0 6.9 12.3 13.7 1.0 40.9
EA13 6.8 7.1 11.6 15.4 0.7 41.6
Belgium 7.1 6.7 16.0 15.7 1.2 46.8
Bulgaria 12.4 6.9 6.3 8.7 -0.2 34.2
Czech Republic 6.6 4.6 8.7 16.2 0.1 36.3
Denmark 10.3 7.7 28.8 1.9 1.3 50.0
Germany 6.3 6.1 10.4 17.2 0.6 40.6
Estonia 9.2 4.5 7.1 10.3 0.0 31.1
Ireland 7.9 6.4 12.9 6.3 0.5 34.0
Greece 7.1 5.1 7.5 13.2 0.5 33.5
Spain 6.4 6.3 11.3 12.9 0.4 37.3
France 7.2 8.3 10.8 18.1 1.2 45.7
Italy 6.3 8.7 14.0 12.9 0.4 42.4
Cyprus 10.4 7.5 10.1 7.8 0.7 36.6
Latvia 8.6 4.5 8.3 9.1 0.2 30.6
Lithuania 7.7 3.9 9.7 8.8 -0.1 30.0
Luxembourg 5.5 7.0 12.5 10.8 0.6 36.4
Hungary 7.6 7.7 9.1 12.6 0.3 37.3
Malta 8.1 7.3 11.3 7.7 0.8 35.2
Netherlands 7.5 5.8 10.7 15.1 1.3 40.4
Austria 7.7 6.6 12.4 16.0 0.7 43.4
Poland 8.1 6.3 7.0 12.2 0.1 33.8
Portugal 8.9 6.8 8.5 12.5 0.3 37.0
Romania 7.9 4.8 5.8 10.4 0.3 29.2
Slovenia 8.7 6.8 9.0 14.5 0.3 39.3
Slovakia 7.4 4.2 5.6 11.9 0.4 29.5
Finland 8.7 5.2 16.6 12.2 0.9 43.6
Sweden 9.1 7.9 19.3 12.8 0.5 49.7
United Kingdom 6.6 6.3 14.5 8.2 2.6 38.2
Norway 8.0 4.3 22.1 8.7 0.9 44.0

177 European Economic Statistics
Statistical annex 4
Table 4.19: Taxes on consumption
% of GDP implicit tax rate (%)% of total
taxation
2000 2001 2002 2003 2004 2005 2006 2000 2001 2002 2003 2004 2005 2006 2006
EU27 11.4 11.2 11.1 11.1 11.1 11.1 11.1 20.1 19.7 19.7 19.7 19.7 19.7 19.9 27.8
EA15 11.1 10.8 10.8 10.7 10.7 10.7 10.8 19.7 19.2 19.3 19.1 19.2 19.2 19.4 26.7
Belgium 11.4 11.0 11.0 11.0 11.2 11.2 11.3 21.8 21.0 21.4 21.3 22.0 22.2 22.4 25.3
Bulgaria 14.4 14.0 13.7 15.1 16.8 18.1 18.9 19.7 18.9 18.7 20.7 23.2 24.4 25.9 54.8
Czech Republic 10.6 10.2 10.1 10.4 11.2 11.3 10.7 19.4 18.9 19.3 19.6 21.8 22.2 21.2 29.4
Denmark 15.7 15.7 15.8 15.6 15.8 16.1 16.2 33.4 33.5 33.7 33.3 33.3 33.6 34.0 32.9
Germany 10.5 10.5 10.4 10.5 10.2 10.1 10.1 18.9 18.5 18.5 18.6 18.1 18.0 18.2 25.8
Estonia 11.8 11.8 11.9 11.6 11.8 12.8 13.1 19.8 19.9 20.0 19.9 20.3 22.8 23.6 42.3
Ireland 12.2 10.9 11.0 10.9 11.2 11.5 11.6 26.1 24.1 25.0 24.9 25.9 26.5 26.9 35.7
Greece 12.4 12.6 12.3 11.5 11.3 10.9 11.3 19.0 19.5 18.8 17.9 17.6 17.0 17.6 36.0
Spain 9.9 9.5 9.4 9.6 9.7 9.8 9.8 15.7 15.2 15.4 15.8 16.0 16.3 16.4 26.7
France 11.6 11.3 11.3 11.1 11.2 11.3 11.2 20.9 20.3 20.3 20.0 20.1 20.1 20.0 25.3
Italy 10.9 10.4 10.2 9.9 10.0 10.0 10.3 17.9 17.3 17.1 16.6 16.8 16.8 17.2 24.5
Cyprus 10.6 11.8 12.4 14.7 15.2 15.2 15.4 12.7 14.3 15.4 18.9 20.0 20.0 20.4 42.2
Latvia 11.3 10.6 10.6 11.4 11.3 12.2 12.6 18.7 17.5 17.4 18.6 18.5 20.2 20.0 41.8
Lithuania 11.8 11.5 11.7 11.1 10.6 10.9 11.0 17.8 17.4 17.8 17.0 16.0 16.5 16.7 36.9
Luxembourg 10.8 10.6 10.8 10.6 11.2 11.0 9.8 23.1 22.7 22.8 23.6 25.1 25.5 25.1 27.6
Hungary 15.3 14.5 14.1 14.6 15.0 14.5 13.9 27.5 25.6 25.4 26.0 27.6 26.4 25.8 37.4
Malta 12.1 12.7 13.4 12.4 13.2 14.1 14.1 15.9 16.5 18.1 16.5 17.3 19.1 19.8 41.7
Netherlands 11.7 11.9 11.6 11.8 11.9 12.0 12.3 23.7 24.4 23.8 24.2 24.9 25.3 26.9 31.2
Austria 12.1 12.3 12.5 12.3 12.3 12.1 11.7 21.3 21.4 21.9 21.5 21.5 21.2 20.9 28.1
Poland 11.3 11.1 11.8 11.9 11.8 12.2 12.5 17.8 17.2 17.9 18.3 18.5 19.6 20.2 36.8
Portugal 12.4 12.4 12.7 12.7 12.7 13.5 13.8 19.2 19.3 19.9 19.8 19.7 20.6 21.1 38.4
Romania : : 11.3 11.5 11.3 12.4 12.0 : : 16.6 17.6 16.5 18.0 17.7 41.9
Slovenia 14.1 13.6 14.0 14.0 13.8 13.7 13.4 24.0 23.5 24.6 24.7 24.5 24.2 24.2 34.4
Slovakia 12.0 10.9 11.1 11.8 12.1 12.5 11.3 21.3 18.5 19.1 21.0 21.5 22.2 20.2 38.6
Finland 13.6 13.1 13.4 13.9 13.6 13.7 13.5 28.6 27.6 27.7 28.1 27.7 27.6 27.3 31.0
Sweden 12.4 12.5 12.7 12.7 12.6 12.7 12.5 26.5 26.9 27.4 27.5 27.6 28.1 28.1 25.6
United Kingdom 12.0 11.8 11.7 11.8 11.6 11.3 11.1 19.4 19.0 18.9 19.2 19.1 18.7 18.5 29.7
Norway 12.7 12.6 12.8 12.4 12.2 11.7 11.8 31.1 30.6 29.7 28.5 28.9 29.7 31.1 26.7
: missing value

178 European Economic Statistics
4 Statistical annex
Table 4.20: Taxes on labour
% of GDP implicit tax rate (%)% of total
taxation
2000 2001 2002 2003 2004 2005 2006 2000 2001 2002 2003 2004 2005 2006 2006
EU27 20.4 20.2 19.9 20.0 19.5 19.5 19.6 37.2 36.9 36.5 36.6 36.1 36.2 36.7 49.1
EA15 21.5 21.3 21.2 21.2 20.6 20.5 20.7 39.6 39.2 39.0 39.0 38.4 38.4 39.0 51.2
Belgium 24.3 24.9 25.0 24.7 24.2 23.9 23.1 43.9 43.6 43.7 43.5 44.1 43.9 42.8 51.8
Bulgaria 13.5 12.1 11.3 12.4 12.2 11.6 10.0 38.8 34.4 33.0 35.5 36.3 34.7 30.9 29.1
Czech Republic 17.1 17.0 17.8 18.1 17.8 17.9 17.6 40.7 40.3 41.2 41.4 41.8 41.7 41.0 48.4
Denmark 26.6 26.9 26.1 26.0 25.2 25.1 24.7 41.0 40.8 38.8 38.1 37.4 37.5 37.0 50.3
Germany 24.3 24.0 23.9 23.8 22.8 22.2 22.3 40.7 40.5 40.4 40.3 39.1 38.6 39.6 56.8
Estonia 17.4 16.9 16.9 16.6 16.4 15.2 15.4 37.8 37.3 37.8 36.9 36.1 34.1 33.9 49.6
Ireland 11.5 11.0 10.0 9.8 10.5 10.4 10.5 28.5 27.4 25.9 24.7 25.7 25.1 25.1 32.4
Greece 12.4 12.1 13.0 13.2 12.7 12.8 12.9 38.2 37.7 40.0 41.2 38.0 37.8 38.1 41.1
Spain 15.9 16.2 16.3 16.2 16.0 16.2 16.6 28.7 29.5 29.8 30.0 29.9 30.6 31.6 45.4
France 23.2 23.1 22.9 23.1 22.7 23.0 23.2 42.1 41.7 41.2 41.5 41.1 41.7 42.1 52.5
Italy 19.7 20.0 20.0 20.1 19.9 20.3 20.6 43.4 43.5 43.3 43.3 42.8 42.8 43.0 48.6
Cyprus 9.8 10.3 10.3 11.0 10.5 11.3 11.1 22.3 23.6 23.0 23.4 22.8 24.5 24.2 30.4
Latvia 15.3 14.6 14.6 14.6 14.6 14.0 14.5 36.7 36.5 37.8 36.6 36.7 33.2 33.5 48.2
Lithuania 16.3 15.4 14.9 14.6 14.7 14.6 14.8 41.2 40.3 38.1 36.9 36.0 34.9 34.1 49.8
Luxembourg 15.3 15.9 15.3 15.2 15.4 15.5 14.7 29.9 29.5 28.3 28.8 29.2 30.0 29.6 41.3
Hungary 19.1 19.3 19.4 18.7 18.2 18.5 18.6 41.8 41.0 40.6 38.8 37.7 37.8 39.0 50.0
Malta 9.7 10.7 10.2 10.3 10.7 10.6 10.3 20.6 21.3 20.8 20.3 21.3 21.9 21.5 30.6
Netherlands 20.3 17.8 18.1 18.4 18.0 17.6 19.1 34.3 30.3 30.4 30.8 30.4 30.5 33.5 48.3
Austria 23.7 24.0 24.0 24.1 23.6 23.3 23.3 40.2 40.7 40.8 40.9 41.1 41.0 41.2 55.8
Poland 14.2 14.4 13.4 13.2 12.5 12.6 13.0 33.6 33.2 32.4 32.7 32.7 33.1 34.4 38.5
Portugal 14.1 14.3 14.5 14.7 14.7 15.0 15.1 27.0 27.4 27.6 27.8 27.9 28.4 28.5 42.1
Romania : : 12.3 11.2 10.8 10.9 : : : 31.2 30.1 29.2 29.1 : :
Slovenia 21.0 21.3 21.1 21.1 21.1 21.0 20.7 37.7 37.5 37.7 37.8 37.5 37.5 37.6 53.0
Slovakia 15.1 15.1 15.1 14.5 13.0 12.6 11.5 36.3 37.1 37.0 36.3 34.3 32.9 30.3 39.4
Finland 23.7 23.6 23.6 23.3 22.7 23.2 22.8 44.1 44.1 43.8 42.5 41.6 41.5 41.5 52.5
Sweden 31.0 31.2 30.0 30.3 30.0 29.7 29.3 47.2 46.3 44.8 44.7 44.7 44.7 44.5 59.8
United Kingdom 14.2 14.2 13.6 13.6 13.8 14.2 14.3 25.3 25.0 24.1 24.3 24.8 25.3 25.5 38.3
Norway 17.5 18.0 19.0 18.8 18.2 17.0 16.4 38.3 38.4 38.7 39.0 39.2 38.5 38.0 37.2
: missing value

179 European Economic Statistics
Statistical annex 4
Table 4.21: Taxes on capital
% of GDP implicit tax rate (%)% of total
taxation
2000 2001 2002 2003 2004 2005 2006 2000 2001 2002 2003 2004 2005 2006 2006
EU27 9.0 8.6 8.2 8.1 8.4 8.8 9.4 32.468 30.694 29.521 28.949 29.808 31.391 33.329 23.4
EA15 8.8 8.3 8.0 8.0 8.2 8.5 9.0 30.577 28.534 28.113 28.262 28.923 30.264 31.897 22.3
Belgium 9.5 9.3 9.3 9.2 9.7 9.9 10.2 29.333 29.357 30.688 31.745 32.697 32.146 32.326 22.8
Bulgaria 5.3 6.0 5.8 5.8 5.6 5.6 6.3 11.401 13.184 : : : : : 18.2
Czech Republic 6.2 6.7 6.9 7.2 8.4 7.9 8.0 20.906 22.310 23.765 24.849 28.072 25.501 24.922 22.2
Denmark 7.2 6.0 6.1 6.6 8.1 9.7 8.4 35.987 30.828 30.676 36.730 45.519 47.728 40.911 17.1
Germany 7.0 5.5 5.2 5.4 5.8 6.4 6.8 29.157 22.722 21.174 21.436 21.599 22.887 23.406 17.3
Estonia 2.1 1.7 2.2 2.6 2.7 2.5 2.5 6.579 5.377 6.871 8.211 8.589 7.940 8.399 8.2
Ireland 8.0 7.8 7.4 8.4 8.7 8.9 10.4 32.199 33.213 32.339 35.968 38.301 37.532 42.508 32.0
Greece 9.8 8.3 8.2 7.6 7.4 7.6 7.2 20.338 17.365 17.283 15.864 15.499 - - 22.9
Spain 8.7 8.3 8.8 8.7 9.3 10.1 10.7 29.759 28.338 29.966 30.299 32.695 36.012 38.691 29.2
France 9.6 9.8 9.1 8.8 9.4 9.6 10.0 37.469 37.865 36.591 35.644 38.457 40.028 41.452 22.6
Italy 11.1 11.1 10.7 11.3 10.7 10.3 11.4 29.939 29.372 29.510 31.901 30.311 30.391 34.378 26.9
Cyprus 9.6 8.9 8.5 7.3 7.7 9.0 10.0 26.200 24.335 25.195 24.352 26.248 31.013 36.590 27.4
Latvia 2.9 3.3 3.0 2.5 2.6 2.8 3.0 11.209 11.542 9.276 8.006 7.799 9.620 : 10.0
Lithuania 2.3 2.0 2.0 2.5 3.1 3.3 4.0 10.612 8.069 7.527 9.227 10.780 11.549 14.137 13.5
Luxembourg 13.1 13.2 13.2 12.4 10.7 11.3 10.9 : : : : : : : 30.6
Hungary 4.1 4.4 4.4 4.4 4.4 4.4 4.7 : : : : : : : 12.6
Malta 6.3 6.9 7.9 8.7 9.3 9.0 9.4 : : : : : : : 27.7
Netherlands 8.0 8.6 8.0 7.3 7.6 8.3 8.1 20.549 22.950 25.244 22.342 22.201 20.672 19.977 20.5
Austria 6.9 8.4 7.2 6.8 7.0 6.7 6.8 26.018 33.001 27.934 25.636 25.303 23.187 23.364 16.2
Poland 7.2 7.0 7.8 7.4 7.5 8.4 8.7 20.618 20.810 22.787 20.961 18.494 22.188 : 25.8
Portugal 7.8 7.2 7.4 7.4 6.7 6.6 7.0 32.665 30.635 32.190 31.613 27.940 28.057 : 19.5
Romania : : 4.5 5.0 5.3 4.7 : : : : : : : : :
Slovenia 3.0 3.3 3.5 3.6 4.0 4.8 5.0 : : : : : : : 12.7
Slovakia 6.9 7.1 7.0 6.8 6.5 6.3 6.4 23.018 21.821 22.297 22.245 21.478 19.097 18.094 21.9
Finland 9.9 7.8 7.6 6.8 7.1 7.1 7.2 36.375 25.658 27.433 25.777 26.306 27.548 24.587 16.5
Sweden 8.4 6.2 5.2 5.3 6.1 7.1 7.1 42.790 33.688 29.529 : : : : 14.6
United Kingdom 11.1 11.1 10.3 10.0 10.3 11.0 11.9 40.952 41.957 37.118 32.927 33.999 36.769 39.741 32.0
Norway 12.2 12.1 11.3 11.0 12.9 14.8 15.9 : : : : : : : 36.1
: missing value

180 European Economic Statistics
4 Statistical annex
government surplus (+)/ government deficit (-)primary balance
interest paid
% of GDP
2000 2001 2002 2003 2004 2005 2006 2007 2007
EU27 0.6 -1.4 -2.5 -3.1 -2.8 -2.5 -1.4 -0.9 1.8 2.7
EA13 0.0 -1.8 -2.5 -3.0 -2.9 -2.5 -1.3 -0.6 2.4 3.0
Belgium 0.1 0.6 0.0 0.0 0.0 -2.3 0.3 -0.2 3.6 3.8
Bulgaria : 0.4 -1.0 -0.5 1.4 1.8 3.0 3.4 4.4 1.0
Czech Republic -3.7 -5.7 -6.8 -6.6 -3.0 -3.6 -2.7 -1.6 -0.4 1.2
Denmark 2.2 1.3 0.2 -0.1 1.9 5.0 4.8 4.4 5.9 1.5
Germany 1.3 -2.8 -3.7 -4.0 -3.8 -3.4 -1.6 0.0 2.8 2.8
Estonia -0.2 -0.1 0.4 1.8 1.6 1.8 3.4 2.8 2.9 0.1
Ireland 4.7 0.9 -0.4 0.4 1.4 1.6 3.0 0.3 1.2 0.9
Greece : : -4.7 -5.6 -7.4 -5.1 -2.6 -2.8 1.3 4.1
Spain -1.0 -0.6 -0.5 -0.2 -0.3 1.0 1.8 2.2 3.8 1.6
France -1.5 -1.5 -3.1 -4.1 -3.6 -2.9 -2.4 -2.7 0.0 2.7
Italy -0.8 -3.1 -2.9 -3.5 -3.5 -4.2 -3.4 -1.9 3.1 5.0
Cyprus -2.3 -2.2 -4.4 -6.5 -4.1 -2.4 -1.2 3.3 6.5 3.2
Latvia -2.8 -2.1 -2.3 -1.6 -1.0 -0.4 -0.2 0.0 0.5 0.5
Lithuania -3.2 -3.6 -1.9 -1.3 -1.5 -0.5 -0.5 -1.2 -0.5 0.7
Luxembourg 6.0 6.1 2.1 0.5 -1.2 -0.1 1.3 2.9 3.1 0.2
Hungary -2.9 -4.0 -8.9 -7.2 -6.5 -7.8 -9.2 -5.5 -1.4 4.1
Malta -6.2 -6.4 -5.5 -9.9 -4.6 -3.0 -2.6 -1.8 1.6 3.4
Netherlands 2.0 -0.2 -2.1 -3.1 -1.7 -0.3 0.5 0.4 2.7 2.3
Austria -1.7 0.0 -0.6 -1.4 -3.7 -1.5 -1.5 -0.5 2.2 2.7
Poland -3.0 -5.1 -5.0 -6.3 -5.7 -4.3 -3.8 -2.0 0.6 2.6
Portugal -2.9 -4.3 -2.9 -2.9 -3.4 -6.1 -3.9 -2.6 0.2 2.8
Romania -4.4 -3.5 -2.0 -1.5 -1.2 -1.2 -2.2 -2.5 -1.8 0.7
Slovenia -3.8 -4.0 -2.5 -2.7 -2.3 -1.5 -1.2 -0.1 1.2 1.3
Slovakia -12.2 -6.5 -8.2 -2.7 -2.4 -2.8 -3.6 -2.2 -0.8 1.4
Finland 6.9 5.0 4.1 2.6 2.4 2.9 4.1 5.3 6.8 1.5
Sweden 3.8 1.6 -1.2 -0.9 0.8 2.2 2.3 3.5 5.3 1.8
United Kingdom 3.6 0.5 -2.0 -3.3 -3.4 -3.4 -2.6 -2.9 -0.7 2.2
Norway : 13.5 9.3 7.3 11.1 15.2 19.3 : : :
: missing value

181 European Economic Statistics
Statistical annex 4
Table 4.22: Government consolidated gross debt; % of GDP
2000 2001 2002 2003 2004 2005 2006 2007
EU27 : 61.0 60.3 61.8 62.1 62.6 61.3 58.7
EA13 : 68.2 68.0 69.1 69.6 70.2 68.5 66.4
Belgium 107.8 106.5 103.4 98.6 94.2 92.1 88.2 84.9
Bulgaria 74.3 67.3 53.6 45.9 37.9 29.2 22.7 18.2
Czech Republic 18.5 25.1 28.5 30.1 30.4 29.7 29.4 28.7
Denmark 51.5 48.7 48.3 45.8 43.8 36.4 30.4 26.0
Germany 59.7 58.8 60.3 63.8 65.6 67.8 67.6 65.0
Estonia 5.2 4.8 5.6 5.5 5.1 4.5 4.2 3.4
Ireland 37.9 35.6 32.2 31.1 29.5 27.4 25.1 25.4
Greece 103.2 103.6 100.6 97.9 98.6 98.0 95.3 94.5
Spain 59.3 55.5 52.5 48.7 46.2 43.0 39.7 36.2
France 57.3 56.9 58.8 62.9 64.9 66.4 63.6 64.2
Italy 109.1 108.7 105.6 104.3 103.8 105.8 106.5 104.0
Cyprus 58.8 60.7 64.7 68.9 70.2 69.1 64.8 59.8
Latvia 12.3 14.0 13.5 14.6 14.9 12.4 10.7 9.7
Lithuania 23.7 23.1 22.4 21.2 19.4 18.6 18.2 17.3
Luxembourg 6.2 6.3 6.3 6.1 6.3 6.1 6.6 6.8
Hungary 54.3 52.1 55.7 58.0 59.4 61.6 65.6 66.0
Malta 55.9 62.1 60.1 69.3 72.6 70.4 64.2 62.6
Netherlands 53.8 50.7 50.5 52.0 52.4 52.3 47.9 45.4
Austria 65.6 66.1 65.9 64.7 63.8 63.5 61.8 59.1
Poland 36.8 37.6 42.2 47.1 45.7 47.1 47.6 45.2
Portugal 50.5 52.9 55.6 56.9 58.3 63.6 64.7 63.6
Romania 24.7 26.0 25.0 21.5 18.8 15.8 12.4 13.0
Slovenia : 27.2 28.4 27.9 27.6 27.5 27.2 24.1
Slovakia 50.4 49.0 43.4 42.4 41.4 34.2 30.4 29.4
Finland 43.8 42.3 41.3 44.3 44.1 41.3 39.2 35.4
Sweden 54.4 55.3 53.7 53.5 51.2 50.9 45.9 40.6
United Kingdom 41.0 37.7 37.5 38.7 40.4 42.1 43.1 43.8
Norway : 29.2 36.1 44.3 45.6 43.8 48.9 :
: missing value

182 European Economic Statistics
4 Statistical annex
Table 4.23: Structure of government consolidated gross debt; millions of euro; 2007
TotalCurrency and
deposits
Short term securities other
than shares*
Long-term securities other
than shares*
Short-term loans
Long-term loans
EU27 7,240,784 341,641 450,315 5,355,760 159,802 933,268
EA13 5,898,832 196,318 382,840 4,364,584 103,113 851,979
Belgium 280,507 1,116 27,782 220,571 1,957 29,081
Bulgaria 5,257 : 0 3,278 1 1,978
Czech Republic 38,284 0 2,955 29,539 276 5,513
Denmark 59,115 1,783 2,615 43,093 148 11,477
Germany 1,576,305 6,934 40,273 1,102,936 54,477 371,685
Estonia 531 0 0 126 5 400
Ireland 47,199 7,727 6,121 31,775 222 1,354
Greece 216,362 674 57 196,226 43 19,362
Spain 379,742 3,307 33,366 279,780 4,419 58,871
France 1,209,497 18,661 112,240 891,497 21,789 165,310
Italy 1,596,762 143,029 127,869 1,189,972 9,182 126,711
Cyprus 9,262 0 202 6,363 0 2,697
Latvia 1,948 35 65 1,091 51 706
Lithuania 4,836 0 109 4,368 10 349
Luxembourg 2,493 161 0 0 336 1,996
Hungary 65,958 32 8,489 50,777 304 6,356
Malta 3,368 : 355 2,753 25 235
Netherlands 253,818 573 16,749 191,644 6,054 38,798
Austria 161,328 : 2,185 135,290 1,109 22,744
Poland 146,798 0 6,522 124,044 154 16,079
Portugal 103,552 13,679 9,287 72,535 3,051 5,000
Romania 14,528 1,303 470 4,458 0 8,297
Slovenia 8,071 40 134 6,967 138 793
Slovakia 16,194 30 0 14,476 3 1,686
Finland 63,196 417 6,778 45,390 337 10,274
Sweden 132,042 3,709 21,238 85,755 8,380 12,960
United Kingdom 843,832 138,432 24,455 621,055 47,334 12,556
* excluding derivatives
: missing value
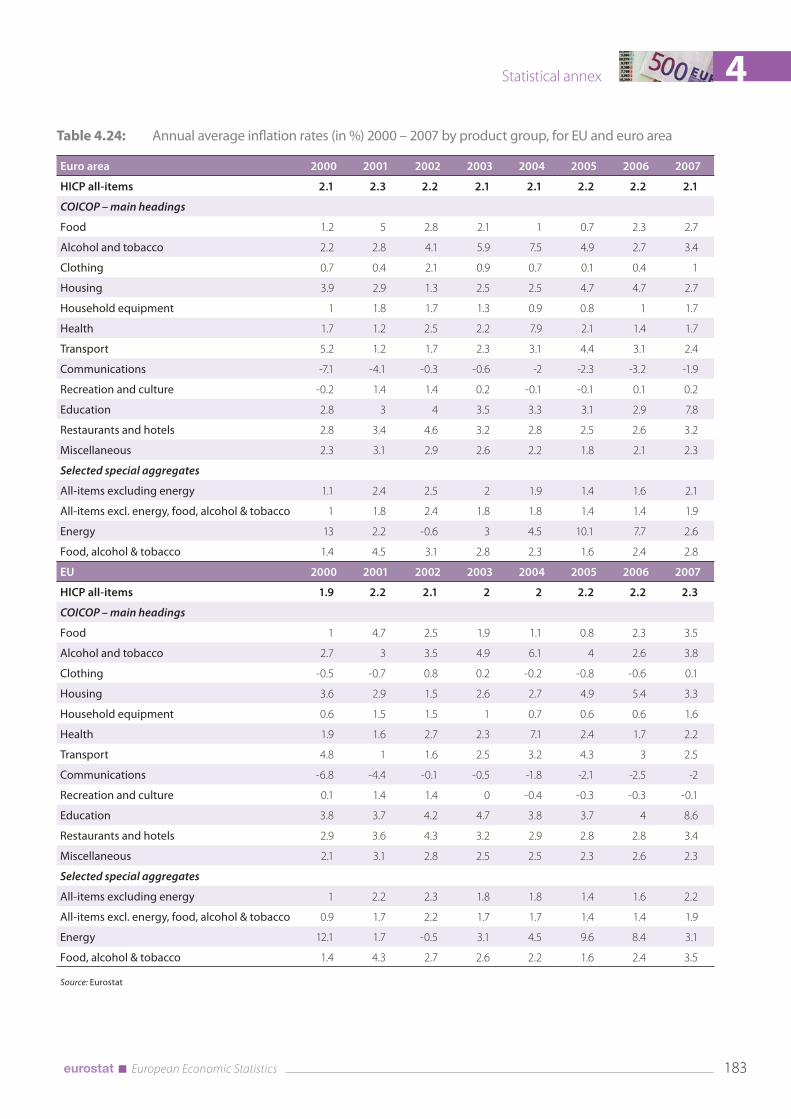
183 European Economic Statistics
Statistical annex 4
Table 4.24: Annual average inflation rates (in %) 2000 – 2007 by product group, for EU and euro area
Euro area 2000 2001 2002 2003 2004 2005 2006 2007
HICP all-items 2.1 2.3 2.2 2.1 2.1 2.2 2.2 2.1
COICOP – main headings
Food 1.2 5 2.8 2.1 1 0.7 2.3 2.7
Alcohol and tobacco 2.2 2.8 4.1 5.9 7.5 4.9 2.7 3.4
Clothing 0.7 0.4 2.1 0.9 0.7 0.1 0.4 1
Housing 3.9 2.9 1.3 2.5 2.5 4.7 4.7 2.7
Household equipment 1 1.8 1.7 1.3 0.9 0.8 1 1.7
Health 1.7 1.2 2.5 2.2 7.9 2.1 1.4 1.7
Transport 5.2 1.2 1.7 2.3 3.1 4.4 3.1 2.4
Communications -7.1 -4.1 -0.3 -0.6 -2 -2.3 -3.2 -1.9
Recreation and culture -0.2 1.4 1.4 0.2 -0.1 -0.1 0.1 0.2
Education 2.8 3 4 3.5 3.3 3.1 2.9 7.8
Restaurants and hotels 2.8 3.4 4.6 3.2 2.8 2.5 2.6 3.2
Miscellaneous 2.3 3.1 2.9 2.6 2.2 1.8 2.1 2.3
Selected special aggregates
All-items excluding energy 1.1 2.4 2.5 2 1.9 1.4 1.6 2.1
All-items excl. energy, food, alcohol & tobacco 1 1.8 2.4 1.8 1.8 1.4 1.4 1.9
Energy 13 2.2 -0.6 3 4.5 10.1 7.7 2.6
Food, alcohol & tobacco 1.4 4.5 3.1 2.8 2.3 1.6 2.4 2.8
EU 2000 2001 2002 2003 2004 2005 2006 2007
HICP all-items 1.9 2.2 2.1 2 2 2.2 2.2 2.3
COICOP – main headings
Food 1 4.7 2.5 1.9 1.1 0.8 2.3 3.5
Alcohol and tobacco 2.7 3 3.5 4.9 6.1 4 2.6 3.8
Clothing -0.5 -0.7 0.8 0.2 -0.2 -0.8 -0.6 0.1
Housing 3.6 2.9 1.5 2.6 2.7 4.9 5.4 3.3
Household equipment 0.6 1.5 1.5 1 0.7 0.6 0.6 1.6
Health 1.9 1.6 2.7 2.3 7.1 2.4 1.7 2.2
Transport 4.8 1 1.6 2.5 3.2 4.3 3 2.5
Communications -6.8 -4.4 -0.1 -0.5 -1.8 -2.1 -2.5 -2
Recreation and culture 0.1 1.4 1.4 0 -0.4 -0.3 -0.3 -0.1
Education 3.8 3.7 4.2 4.7 3.8 3.7 4 8.6
Restaurants and hotels 2.9 3.6 4.3 3.2 2.9 2.8 2.8 3.4
Miscellaneous 2.1 3.1 2.8 2.5 2.5 2.3 2.6 2.3
Selected special aggregates
All-items excluding energy 1 2.2 2.3 1.8 1.8 1.4 1.6 2.2
All-items excl. energy, food, alcohol & tobacco 0.9 1.7 2.2 1.7 1.7 1.4 1.4 1.9
Energy 12.1 1.7 -0.5 3.1 4.5 9.6 8.4 3.1
Food, alcohol & tobacco 1.4 4.3 2.7 2.6 2.2 1.6 2.4 3.5
Source: Eurostat

184 European Economic Statistics
4 Statistical annex
Table 4.25: Annual average inflation rates 2000-2007 - by MS
2000 2001 2002 2003 2004 2005 2006 2007
EU 1.9 2.2 2.1 2.0 2.0 2.2 2.2 2.3
Euro area 2.1 2.3 2.2 2.1 2.1 2.2 2.2 2.1
Belgium 2.7 2.4 1.6 1.5 1.9 2.5 2.3 1.8
Bulgaria 10.3 7.4 5.8 2.3 6.1 6.0 7.4 7.6
Czech Republic 3.9 4.5 1.4 -0.1 2.6 1.6 2.1 3.0
Denmark 2.7 2.3 2.4 2.0 0.9 1.7 1.9 1.7
Germany 1.4 1.9 1.4 1.0 1.8 1.9 1.8 2.3
Estonia 3.9 5.6 3.6 1.4 3.0 4.1 4.4 6.7
Ireland 5.3 4.0 4.7 4.0 2.3 2.2 2.7 2.9
Greece 2.9 3.7 3.9 3.4 3.0 3.5 3.3 3.0
Spain 3.5 2.8 3.6 3.1 3.1 3.4 3.6 2.8
France 1.8 1.8 1.9 2.2 2.3 1.9 1.9 1.6
Italy 2.6 2.3 2.6 2.8 2.3 2.2 2.2 2.0
Cyprus 4.9 2.0 2.8 4.0 1.9 2.0 2.2 2.2
Latvia 2.6 2.5 2.0 2.9 6.2 6.9 6.6 10.1
Lithuania 1.1 1.6 0.3 -1.1 1.2 2.7 3.8 5.8
Luxembourg 3.8 2.4 2.1 2.5 3.2 3.8 3.0 2.7
Hungary 10.0 9.1 5.2 4.7 6.8 3.5 4.0 7.9
Malta 3.0 2.5 2.6 1.9 2.7 2.5 2.6 0.7
Netherlands 2.3 5.1 3.9 2.2 1.4 1.5 1.7 1.6
Austria 2.0 2.3 1.7 1.3 2.0 2.1 1.7 2.2
Poland 10.1 5.3 1.9 0.7 3.6 2.2 1.3 2.6
Portugal 2.8 4.4 3.7 3.3 2.5 2.1 3.0 2.4
Roumania 45.7 34.5 22.5 15.3 11.9 9.1 6.6 4.9
Slovenia 8.9 8.6 7.5 5.7 3.7 2.5 2.5 3.8
Slovakia 12.2 7.2 3.5 8.4 7.5 2.8 4.3 1.9
Finland 2.9 2.7 2.0 1.3 0.1 0.8 1.3 1.6
Sweden 1.3 2.7 1.9 2.3 1.0 0.8 1.5 1.7
United Kingdom 0.8 1.2 1.3 1.4 1.3 2.1 2.3 2.3
Iceland 4.4 6.6 5.3 1.4 2.3 1.4 4.6 3.6
Norway 3.0 2.7 0.8 2.0 0.6 1.5 2.5 0.7
EEA 1.9 2.2 2.1 2.0 2.0 2.2 2.2 2.3
Switzerland 1.0 0.8
Source: Eurostat

185 European Economic Statistics
Statistical annex 4
Table 4.26: Household consumption pattern used for the HICP 2007 - by main heading, by MS
EU Euro area BE BG CZ DK DE EE IE EL ES
All-items 1000 1000 1000 1000 1000 1000 1000 1000 1000 1000 1000
Food 152.97 155.72 172.47 232.54 177.67 148.63 114.71 198.32 131.29 171.88 219.45
Alcohol and tobacco 43.79 39.86 29.51 55.43 89.91 51.40 51.97 85.80 67.63 45.21 28.32
Clothing 66.18 69.34 59.17 41.80 52.67 58.30 55.79 80.42 60.55 94.76 90.60
Housing 151.74 154.67 162.39 103.20 157.67 189.76 226.58 128.00 101.32 88.65 105.18
Household equipment 69.76 72.74 67.32 46.91 61.39 69.90 72.04 48.93 49.44 70.47 60.74
Health 37.77 40.59 40.79 51.11 24.44 31.80 45.97 33.67 35.26 57.06 28.38
Transport 152.24 157.95 145.90 175.28 127.35 138.69 155.31 137.39 139.26 130.91 141.92
Communications 31.10 30.83 32.20 73.81 41.13 24.48 23.51 43.83 38.22 38.15 35.01
Recreation and culture 102.97 94.37 125.54 53.48 107.17 116.37 111.42 76.45 112.97 52.89 72.35
Education 11.39 9.55 5.60 11.05 7.18 9.65 8.00 16.54 22.84 22.69 16.00
Restaurants and hotels 95.51 91.77 90.02 119.47 83.93 54.20 54.53 89.65 172.46 163.62 143.77
Miscellaneous 84.60 82.63 69.10 35.93 69.49 106.82 80.17 60.99 68.77 63.72 58.28
FR IT CY LV LT LU HU MT NL AT PL
All-items 1000 1000 1000 1000 1000 1000 1000 1000 1000 1000 1000
Food 163.16 172.90 181.87 250.04 255.23 109.70 195.82 171.26 131.29 124.74 198.99
Alcohol and tobacco 36.29 32.02 30.92 67.94 79.37 143.40 71.45 50.18 37.16 30.04 71.98
Clothing 56.36 94.34 88.31 71.27 83.44 44.60 51.16 59.61 66.11 55.81 42.26
Housing 148.30 103.29 85.90 128.37 116.18 92.70 142.66 85.09 174.27 142.30 227.26
Household equipment 65.52 91.52 64.64 54.35 64.10 94.60 68.81 92.41 76.32 79.85 49.38
Health 42.45 35.99 48.84 41.87 48.21 16.10 40.93 31.43 25.95 52.75 53.14
Transport 177.22 159.81 153.80 123.49 109.36 218.70 146.46 146.33 139.20 148.27 104.08
Communications 32.12 29.72 36.99 50.93 43.28 16.00 52.57 26.11 54.45 24.35 38.34
Recreation and culture 98.30 72.05 67.83 71.68 61.48 84.70 89.68 97.02 114.73 117.92 66.34
Education 5.57 9.85 28.02 13.49 13.61 4.00 12.26 10.12 6.75 10.34 17.48
Restaurants and hotels 71.34 114.27 125.09 78.91 79.31 85.30 81.12 174.43 63.44 146.50 33.39
Miscellaneous 103.36 84.24 87.79 47.64 46.44 90.20 47.08 56.00 110.33 67.14 97.38
PT RO SI SK FI SE UK IS NO EEA CH
All-items 1000 1000 1000 1000 1000 1000 1000 1000 1000 1000 1000
Food 187.78 364.46 169.18 168.28 153.98 146.03 103.00 155.60 133.57 152.77 108.13
Alcohol and tobacco 31.47 63.57 51.51 55.69 58.95 43.85 43.00 36.18 34.40 43.69 16.91
Clothing 63.74 72.18 67.82 42.04 56.19 68.94 62.00 59.87 68.11 66.20 44.94
Housing 97.41 194.58 106.44 227.07 148.60 181.33 115.00 115.61 170.16 151.90 194.23
Household equipment 73.57 41.21 69.57 58.23 63.30 61.24 68.00 64.72 75.93 69.82 45.65
Health 52.47 30.06 35.12 36.73 54.42 33.81 24.00 42.63 33.94 37.73 163.49
Transport 201.27 75.54 185.94 102.73 159.61 153.85 152.00 198.26 202.49 152.79 110.48
Communications 28.54 49.88 36.50 43.97 38.66 35.01 24.00 32.65 31.75 31.10 27.54
Recreation and culture 47.30 45.48 94.36 85.14 113.64 124.19 153.00 132.18 142.66 103.40 88.79
Education 16.65 9.54 11.85 17.47 5.85 4.70 18.00 9.30 3.68 11.31 7.32
Restaurants and hotels 137.79 23.05 83.75 87.50 80.41 64.09 138.00 82.73 43.26 94.96 96.29
Miscellaneous 62.01 30.46 87.97 75.15 66.39 82.95 100.00 70.26 60.04 84.33 96.23
Source: Eurostat

186 European Economic Statistics
4 Statistical annex
Table 4.27: Long term interest rates for EU Member States, US, and JP, 10 y government bond yields - EMU convergence criterion
Annual averages from 2000 to 2007
time 2000 2001 2002 2003 2004 2005 2006 2007
European Union 5.44 5.01 4.93 4.24 4.39 3.70 4.03 4.58
Euro area 5.44 5.00 4.91 4.14 4.12 3.42 3.84 4.32
Belgium 5.59 5.13 4.99 4.18 4.15 3.43 3.82 4.33
Bulgaria : : : 6.45 5.36 3.87 4.18 4.54
Czech Republic : 6.31 4.88 4.12 4.75 3.51 3.78 4.28
Denmark 5.64 5.08 5.06 4.31 4.30 3.40 3.81 4.29
Germany 5.26 4.80 4.78 4.07 4.04 3.35 3.76 4.22
Estonia (1) 10.48 10.15 8.42 5.25 4.39 3.98 4.30 5.69
Ireland 5.51 5.01 5.01 4.13 4.08 3.33 3.77 4.31
Greece 6.10 5.30 5.12 4.27 4.26 3.59 4.07 4.50
Spain 5.53 5.12 4.96 4.12 4.10 3.39 3.78 4.31
France 5.39 4.94 4.86 4.13 4.10 3.41 3.80 4.30
Italy 5.58 5.19 5.03 4.25 4.26 3.56 4.05 4.49
Cyprus : 7.63 5.70 4.74 5.80 5.16 4.13 4.48
Latvia : 7.57 5.41 4.90 4.86 3.88 4.13 5.28
Lithuania : 8.15 6.06 5.32 4.50 3.70 4.08 4.55
Luxembourg (2) 5.52 4.86 4.70 4.03 4.18 3.37 3.92 4.56
Hungary : 7.95 7.09 6.82 8.19 6.60 7.12 6.74
Malta : 6.19 5.82 5.04 4.69 4.56 4.32 4.72
Netherlands 5.40 4.96 4.89 4.12 4.10 3.37 3.78 4.29
Austria 5.56 5.07 4.97 4.15 4.15 3.39 3.80 4.29
Poland : 10.68 7.36 5.78 6.90 5.22 5.23 5.48
Portugal 5.59 5.16 5.01 4.18 4.14 3.44 3.91 4.42
Romania : : : : : : 7.23 7.15
Slovenia : : 8.71 6.40 4.68 3.81 3.85 4.52
Slovakia : 8.04 6.94 4.99 5.03 3.52 4.41 4.49
Finland 5.48 5.04 4.98 4.13 4.11 3.35 3.78 4.29
Sweden 5.37 5.11 5.30 4.64 4.43 3.38 3.71 4.17
United Kingdom 5.33 5.01 4.91 4.58 4.93 4.46 4.37 5.06
United States (3) 6.33 5.01 4.60 4.00 4.26 4.28 4.79 4.63
Japan (3) 1.76 1.34 1.27 0.99 1.50 1.39 1.74 1.68

187 European Economic Statistics
Statistical annex 4
Table 4.28: 3-month money market interest rates - Annual averages
time 2000 2001 2002 2003 2004 2005 2006 2007
European Union 4,78 4,40 3,48 2,60 2,64 2,72 3,50 4,62
Euro area 4,39 4,26 3,32 2,33 2,11 2,19 3,08 4,28
Bulgaria 4,63 5,06 4,91 3,68 3,74 3,62 3,69 4,90
Czech Republic 5,37 5,17 3,54 2,27 2,36 2,01 2,30 3,10
Denmark 5,00 4,70 3,54 2,42 2,20 2,22 3,18 4,44
Estonia 5,68 5,31 3,88 2,92 2,50 2,38 3,16 4,66
Cyprus 6,44 5,93 4,40 3,90 4,74 4,25 3,37 4,15
Latvia 5,40 6,86 4,35 3,84 4,23 3,07 4,38 8,68
Lithuania 8,64 5,93 3,74 2,84 2,68 2,43 3,11 5,11
Hungary 11,39 10,87 9,21 8,51 11,53 6,70 7,23 7,86
Malta 4,89 4,93 4,01 3,29 2,94 3,18 3,49 4,26
Poland 18,77 16,07 8,98 5,68 6,20 5,28 4,21 4,74
Romania 50,71 41,28 27,31 17,73 19,14 8,35 8,09 7,20
Slovenia (1) 10,94 10,87 8,03 6,78 4,66 4,03 3,58 :
Slovakia 8,57 7,77 7,77 6,18 4,68 2,93 4,33 4,34
Sweden 4,06 4,12 4,27 3,24 2,31 1,89 2,57 3,89
United Kingdom 6,19 5,04 4,06 3,73 4,64 4,76 4,85 6,00
United States 6,53 3,77 1,79 1,22 1,62 3,56 5,20 5,30
Japan 0,28 0,15 0,08 0,06 0,05 0,06 0,30 0,79
Source: ECB

188 European Economic Statistics
4 Statistical annex
Table 4.29: Euro exchange rates - Annual averages 2000 - 2007
unit National currency
time 2000 2001 2002 2003 2004 2005 2006 2007
currency
CZK Czech Koruna 35,599 34,068 30,804 31,846 31,891 29,782 28,342 27,766
DKK Danish Krone 7,4538 7,4521 7,4305 7,4307 7,4399 7,4518 7,4591 7,4506
EEK Estonian Kroon 15,647 15,647 15,647 15,647 15,647 15,647 15,647 15,647
CYP Cyprus Pound 0,5739 0,5759 0,5753 0,5841 0,5819 0,5768 0,5758 0,5826
LVL Latvian Lats 0,5592 0,5601 0,5810 0,6407 0,6652 0,6962 0,6962 0,7001
LTL Lithuanian Litas 3,6952 3,5823 3,4594 3,4527 3,4529 3,4528 3,4528 3,4528
HUF Hungarian forint 260,04 256,59 242,96 253,62 251,66 248,05 264,26 251,35
MTL Malta lira 0,4041 0,4030 0,4089 0,4261 0,4280 0,4299 0,4293 0,4293
PLN New Polish Zloty 4,0082 3,6721 3,8574 4,3996 4,5268 4,0230 3,8959 3,7837
SKK Slovak Koruna 42,602 43,300 42,694 41,489 40,022 38,599 37,234 33,775
SEK Swedish Krona 8,4452 9,2551 9,1611 9,1242 9,1243 9,2822 9,2544 9,2501
GBP Pound Sterling 0,6095 0,6219 0,6288 0,6920 0,6787 0,6838 0,6817 0,6843
ISK Iceland Krona 72,58 87,42 86,18 86,65 87,14 78,23 87,76 87,63
NOK Norwegian Krone 8,1129 8,0484 7,5086 8,0033 8,3697 8,0092 8,0472 8,0165
CHF Swiss Franc 1,5579 1,5105 1,4670 1,5212 1,5438 1,5483 1,5729 1,6427
BGN New Bulgarian Lev 1,9522 1,9482 1,9492 1,9490 1,9533 1,9558 1,9558 1,9558
RON New Romanian leu 1,9922 2,6004 3,1270 3,7551 4,0510 3,6209 3,5258 3,3328
JPY Yen (Japan) 99,47 108,68 118,06 130,97 134,44 136,85 146,02 161,25
USD United States Dollar 0,9236 0,8956 0,9456 1,1312 1,2439 1,2441 1,2556 1,3705
Source: ECB
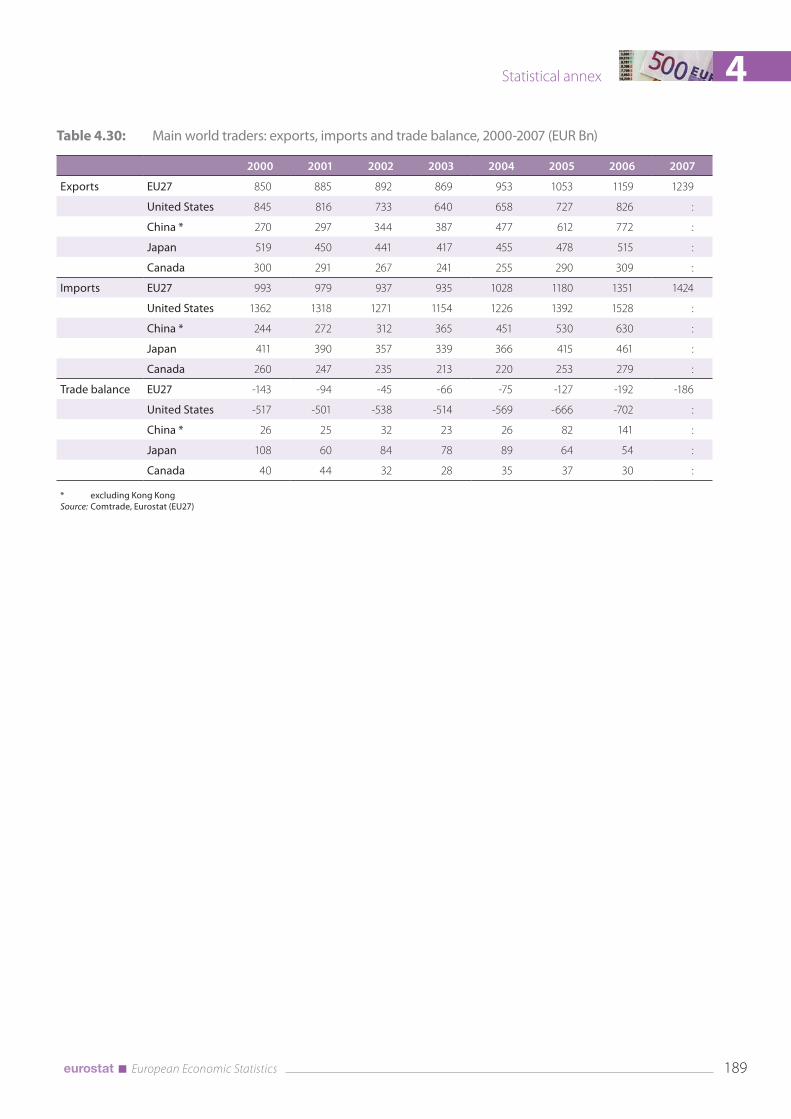
189 European Economic Statistics
Statistical annex 4
Table 4.30: Main world traders: exports, imports and trade balance, 2000-2007 (EUR Bn)
2000 2001 2002 2003 2004 2005 2006 2007
Exports EU27 850 885 892 869 953 1053 1159 1239
United States 845 816 733 640 658 727 826 :
China * 270 297 344 387 477 612 772 :
Japan 519 450 441 417 455 478 515 :
Canada 300 291 267 241 255 290 309 :
Imports EU27 993 979 937 935 1028 1180 1351 1424
United States 1362 1318 1271 1154 1226 1392 1528 :
China * 244 272 312 365 451 530 630 :
Japan 411 390 357 339 366 415 461 :
Canada 260 247 235 213 220 253 279 :
Trade balance EU27 -143 -94 -45 -66 -75 -127 -192 -186
United States -517 -501 -538 -514 -569 -666 -702 :
China * 26 25 32 23 26 82 141 :
Japan 108 60 84 78 89 64 54 :
Canada 40 44 32 28 35 37 30 :
* excluding Kong Kong
Source: Comtrade, Eurostat (EU27)

190 European Economic Statistics
4 Statistical annex
Table 4.31: Extra-EU-27 imports, exports and balance, by SITC-1 product group, 2000-2007 (EUR Bn)
sitc flow 2000 2001 2002 2003 2004 2005 2006 2007
Food products Exports 47.7 49.3 50.1 48.5 48.5 52.0 57.9 61.8
Imports 54.8 58.1 58.1 57.3 58.9 63.0 67.9 75.2
Trade balance -7.1 -8.8 -8.0 -8.8 -10.3 -11.0 -10.0 -13.4
Crude materials Exports 17.8 17.0 18.5 18.3 21.0 23.8 28.6 30.4
Imports 49.2 48.0 44.5 43.1 48.5 52.7 63.2 70.2
Trade balance -31.4 -31.1 -26.1 -24.8 -27.5 -28.9 -34.7 -39.8
Energy products Exports 29.1 24.9 26.2 27.4 32.9 45.9 58.7 61.8
Imports 161.1 157.8 149.1 157.9 183.6 272.5 339.5 331.5
Trade balance -132.0 -132.8 -122.9 -130.4 -150.6 -226.7 -280.8 -269.8
Chemical products Exports 118.9 130.2 141.1 141.1 152.6 164.8 184.6 197.5
Imports 70.5 76.9 80.8 80.5 88.6 96.4 109.0 120.3
Trade balance 48.4 53.3 60.4 60.6 64.0 68.4 75.6 77.2
Other manufactured products Exports 224.1 232.7 234.7 223.9 246.2 265.8 293.6 309.9
Imports 250.5 253.5 244.3 238.5 262.5 290.2 340.8 381.6
Trade balance -26.4 -20.8 -9.6 -14.7 -16.3 -24.4 -47.2 -71.7
Machinery and vehicles Exports 393.5 412.0 401.5 391.6 430.1 470.9 504.0 543.5
Imports 371.5 352.0 329.1 326.7 354.6 379.1 402.5 413.7
Trade balance 21.9 59.9 72.4 64.9 75.5 91.8 101.5 129.8
Total - All products Exports 849.7 884.7 891.9 869.2 952.9 1053.2 1159.2 1238.7
Imports 992.7 979.1 937.0 935.3 1027.5 1179.9 1351.4 1424.2
Trade balance -143.0 -94.4 -45.1 -66.0 -74.6 -126.7 -192.2 -185.5

191 European Economic Statistics
Statistical annex 4
Table 4.32: Extra-EU-27 imports, exports and balance, by main partners, 2000-2007 (EUR Bn)
partner flow 2000 2001 2002 2003 2004 2005 2006 2007
United States Exports 238.2 245.6 247.9 227.3 235.5 252.9 269.0 261.3
Imports 206.3 203.3 182.6 158.1 159.4 163.8 175.2 180.9
Trade balance 31.9 42.3 65.3 69.2 76.1 89.1 93.8 80.4
China * Exports 25.9 30.7 35.1 41.5 48.4 51.9 63.8 71.7
Imports 74.6 82.0 90.2 106.2 128.7 160.4 194.8 231.3
Trade balance -48.8 -51.3 -55.1 -64.8 -80.3 -108.5 -131.0 -159.5
Russian Federation Exports 22.7 31.6 34.4 37.2 46.0 56.9 72.3 89.1
Imports 63.8 65.9 64.5 70.7 84.0 112.6 140.8 143.5
Trade balance -41.0 -34.3 -30.1 -33.5 -37.9 -55.7 -68.6 -54.5
Switzerland Exports 72.5 76.5 72.8 71.4 75.2 82.6 87.7 92.7
Imports 62.6 63.6 61.7 59.1 62.0 66.6 71.6 76.8
Trade balance 10.0 12.9 11.1 12.3 13.2 16.0 16.1 15.9
Japan Exports 45.5 45.5 43.5 41.0 43.4 43.7 44.7 43.7
Imports 92.1 81.1 73.7 72.4 74.7 74.1 77.3 77.9
Trade balance -46.6 -35.6 -30.2 -31.4 -31.3 -30.4 -32.5 -34.2
Norway Exports 26.4 27.2 28.2 27.7 30.8 33.9 38.5 43.4
Imports 47.2 46.4 48.0 51.0 55.3 67.2 79.2 76.6
Trade balance -20.8 -19.2 -19.9 -23.4 -24.5 -33.3 -40.7 -33.3
Turkey Exports 31.9 21.9 26.6 30.9 40.1 44.6 50.0 52.6
Imports 18.7 22.1 24.6 27.3 32.7 36.1 41.7 46.9
Trade balance 13.2 -0.2 2.0 3.6 7.4 8.6 8.3 5.7
South Korea Exports 16.7 15.8 17.7 16.5 17.9 20.2 22.9 24.8
Imports 27.0 23.3 24.6 26.0 30.7 34.4 40.8 39.4
Trade balance -10.2 -7.4 -6.9 -9.6 -12.7 -14.2 -17.9 -14.6
India Exports 13.7 13.0 14.3 14.6 17.2 21.3 24.4 29.4
Imports 12.9 13.5 13.7 14.1 16.4 19.1 22.6 26.2
Trade balance 0.8 -0.5 0.7 0.5 0.8 2.2 1.8 3.2
Brazil Exports 16.9 18.6 15.7 12.4 14.2 16.1 17.7 21.3
Imports 18.7 19.6 18.4 19.1 21.7 24.1 27.2 32.6
Trade balance -1.8 -1.0 -2.6 -6.7 -7.6 -8.0 -9.4 -11.3
* excluding Kong Kong

192 European Economic Statistics
4 Statistical annex
Table 4.33: Member States’ contribution to the extra-EU27 trade
2000 2001 2002 2003 2004 2005 2006 2007
Share in the EU imports (%)
EU (27 countries) 100.0 100.0 100.0 100.0 100.0 100.0 100.0 100.0
Belgium 5.6 5.7 6.1 5.9 6.1 6.1 5.8 6.1
Bulgaria 0.3 0.4 0.4 0.4 0.5 0.4 0.4 0.6
Czech Republic 0.9 1.1 1.3 1.4 1.1 1.0 1.1 1.2
Denmark 1.4 1.4 1.4 1.4 1.6 1.5 1.4 1.4
Germany 20.0 19.6 19.0 19.4 19.2 18.8 19.4 18.8
Estonia 0.1 0.2 0.2 0.2 0.2 0.2 0.2 0.2
Ireland 2.0 1.9 2.0 1.9 1.7 1.6 1.4 1.3
Greece 1.3 1.3 1.6 1.8 1.6 1.5 1.6 1.6
Spain 5.5 5.5 5.7 6.0 6.5 7.0 7.4 7.4
France 12.1 12.2 11.7 11.2 11.2 11.1 9.8 9.7
Italy 10.2 10.3 10.4 10.3 10.5 10.6 11.1 11.1
Cyprus 0.1 0.2 0.2 0.2 0.1 0.1 0.1 0.1
Latvia 0.1 0.1 0.1 0.1 0.1 0.1 0.2 0.2
Lithuania 0.3 0.3 0.4 0.4 0.4 0.4 0.4 0.4
Luxembourg 0.2 0.3 0.2 0.3 0.4 0.4 0.5 0.4
Hungary 1.2 1.3 1.5 1.6 1.5 1.4 1.4 1.5
Malta 0.1 0.1 0.1 0.1 0.1 0.1 0.1 0.1
Netherlands 11.1 11.0 11.1 11.3 11.7 12.5 12.3 12.5
Austria 1.6 1.7 1.7 1.7 1.6 1.7 1.6 1.7
Poland 1.7 1.7 1.9 2.0 1.7 1.7 2.0 2.3
Portugal 1.0 1.0 0.9 0.9 1.0 1.0 1.0 1.0
Romania 0.5 0.6 0.6 0.7 0.9 1.0 1.1 1.0
Slovenia 0.3 0.3 0.3 0.3 0.2 0.3 0.3 0.4
Slovakia 0.4 0.5 0.5 0.5 0.5 0.5 0.7 0.8
Finland 1.2 1.1 1.2 1.3 1.3 1.4 1.5 1.5
Sweden 2.5 2.2 2.2 2.2 2.2 2.2 2.3 2.3
United Kingdom 18.3 18.2 17.6 16.3 16.2 15.3 15.0 14.5
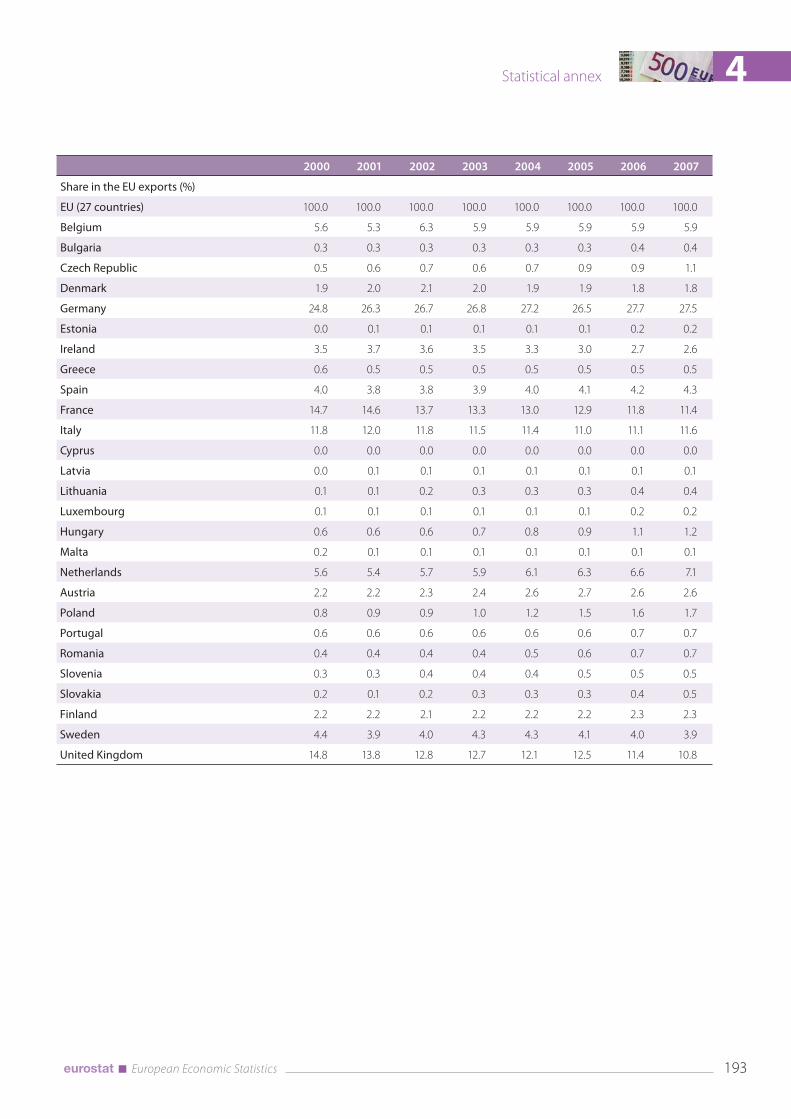
193 European Economic Statistics
Statistical annex 4
2000 2001 2002 2003 2004 2005 2006 2007
Share in the EU exports (%)
EU (27 countries) 100.0 100.0 100.0 100.0 100.0 100.0 100.0 100.0
Belgium 5.6 5.3 6.3 5.9 5.9 5.9 5.9 5.9
Bulgaria 0.3 0.3 0.3 0.3 0.3 0.3 0.4 0.4
Czech Republic 0.5 0.6 0.7 0.6 0.7 0.9 0.9 1.1
Denmark 1.9 2.0 2.1 2.0 1.9 1.9 1.8 1.8
Germany 24.8 26.3 26.7 26.8 27.2 26.5 27.7 27.5
Estonia 0.0 0.1 0.1 0.1 0.1 0.1 0.2 0.2
Ireland 3.5 3.7 3.6 3.5 3.3 3.0 2.7 2.6
Greece 0.6 0.5 0.5 0.5 0.5 0.5 0.5 0.5
Spain 4.0 3.8 3.8 3.9 4.0 4.1 4.2 4.3
France 14.7 14.6 13.7 13.3 13.0 12.9 11.8 11.4
Italy 11.8 12.0 11.8 11.5 11.4 11.0 11.1 11.6
Cyprus 0.0 0.0 0.0 0.0 0.0 0.0 0.0 0.0
Latvia 0.0 0.1 0.1 0.1 0.1 0.1 0.1 0.1
Lithuania 0.1 0.1 0.2 0.3 0.3 0.3 0.4 0.4
Luxembourg 0.1 0.1 0.1 0.1 0.1 0.1 0.2 0.2
Hungary 0.6 0.6 0.6 0.7 0.8 0.9 1.1 1.2
Malta 0.2 0.1 0.1 0.1 0.1 0.1 0.1 0.1
Netherlands 5.6 5.4 5.7 5.9 6.1 6.3 6.6 7.1
Austria 2.2 2.2 2.3 2.4 2.6 2.7 2.6 2.6
Poland 0.8 0.9 0.9 1.0 1.2 1.5 1.6 1.7
Portugal 0.6 0.6 0.6 0.6 0.6 0.6 0.7 0.7
Romania 0.4 0.4 0.4 0.4 0.5 0.6 0.7 0.7
Slovenia 0.3 0.3 0.4 0.4 0.4 0.5 0.5 0.5
Slovakia 0.2 0.1 0.2 0.3 0.3 0.3 0.4 0.5
Finland 2.2 2.2 2.1 2.2 2.2 2.2 2.3 2.3
Sweden 4.4 3.9 4.0 4.3 4.3 4.1 4.0 3.9
United Kingdom 14.8 13.8 12.8 12.7 12.1 12.5 11.4 10.8
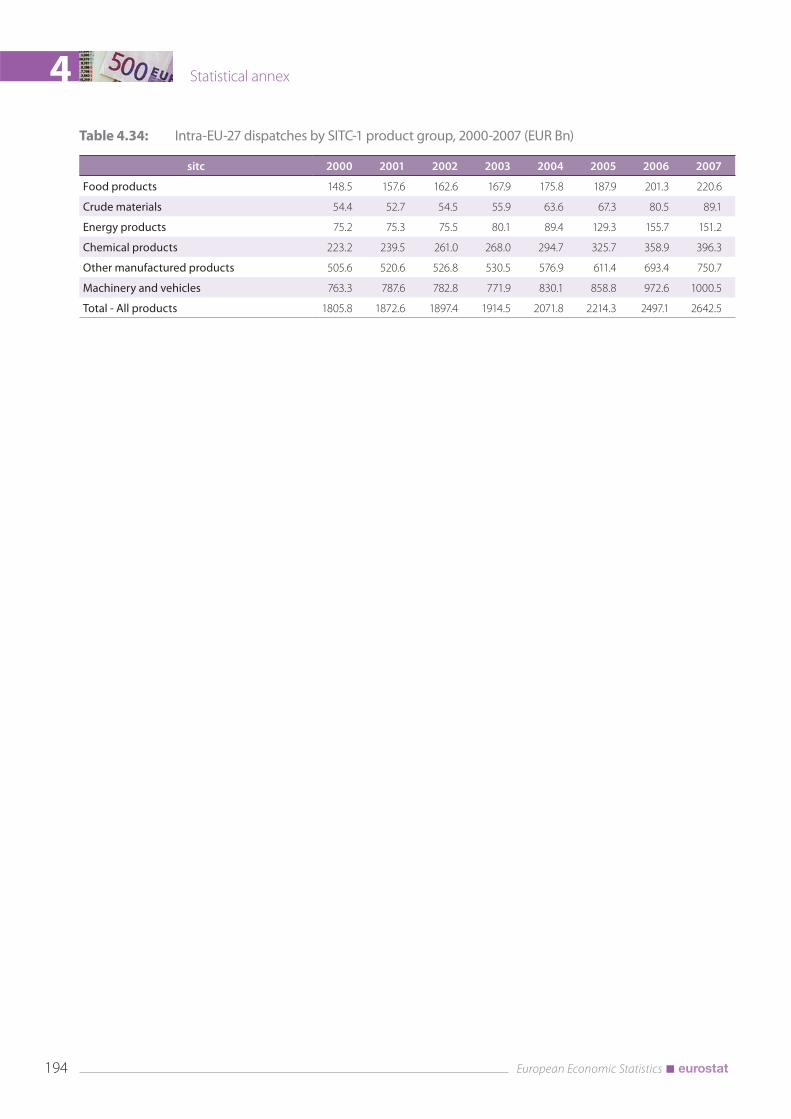
194 European Economic Statistics
4 Statistical annex
Table 4.34: Intra-EU-27 dispatches by SITC-1 product group, 2000-2007 (EUR Bn)
sitc 2000 2001 2002 2003 2004 2005 2006 2007
Food products 148.5 157.6 162.6 167.9 175.8 187.9 201.3 220.6
Crude materials 54.4 52.7 54.5 55.9 63.6 67.3 80.5 89.1
Energy products 75.2 75.3 75.5 80.1 89.4 129.3 155.7 151.2
Chemical products 223.2 239.5 261.0 268.0 294.7 325.7 358.9 396.3
Other manufactured products 505.6 520.6 526.8 530.5 576.9 611.4 693.4 750.7
Machinery and vehicles 763.3 787.6 782.8 771.9 830.1 858.8 972.6 1000.5
Total - All products 1805.8 1872.6 1897.4 1914.5 2071.8 2214.3 2497.1 2642.5

195 European Economic Statistics
Statistical annex 4
Table 4.35: Member States’ contribution to the Intra-EU27 trade
2000 2001 2002 2003 2004 2005 2006 2007
Intra-EU dispatches (EUR Bn)
EU (27 countries) 1805.8 1872.6 1897.4 1914.5 2071.8 2214.3 2497.1 2642.5
Belgium 156.6 165.6 172.4 174.4 190.1 206.2 224.1 240.9
Bulgaria 3.0 3.5 3.8 4.2 5.0 5.5 7.1 8.2
Czech Republic 27.1 32.2 34.9 37.6 48.3 53.7 64.8 76.1
Denmark 39.2 40.1 42.4 41.3 43.8 48.4 52.4 52.9
Germany 386.6 406.0 412.7 431.1 472.3 501.6 561.4 627.5
Estonia 3.0 3.0 3.0 3.3 3.8 4.8 5.1 5.6
Ireland 54.3 59.4 61.6 51.2 53.0 56.2 54.8 56.3
Greece 7.9 8.1 6.7 7.7 7.9 8.5 10.6 11.0
Spain 91.1 96.9 99.4 103.9 109.2 112.1 121.1 123.0
France 230.0 231.9 228.4 231.1 239.8 236.5 258.7 262.7
Italy 160.2 166.6 163.9 165.0 176.0 183.7 203.1 215.4
Cyprus 0.3 0.3 0.3 0.3 0.5 0.9 0.8 0.7
Latvia 1.6 1.8 1.9 2.0 2.5 3.2 3.6 4.4
Lithuania 2.9 3.5 3.8 3.9 5.0 6.2 7.2 8.1
Luxembourg 7.9 9.6 9.5 10.5 11.8 13.6 16.3 14.5
Hungary 25.5 28.5 30.8 32.1 37.1 40.9 47.5 54.3
Malta 0.9 1.1 1.0 1.0 1.0 1.0 1.1 1.1
Netherlands 205.3 210.0 207.5 210.4 229.5 260.7 292.3 313.7
Austria 54.8 59.2 62.3 64.7 70.0 72.3 78.4 86.2
Poland 27.9 32.6 35.3 38.9 48.5 56.5 69.7 79.7
Portugal 21.5 21.9 22.3 22.8 23.0 24.5 26.7 28.7
Romania 8.1 9.6 10.8 11.8 14.1 15.6 18.2 21.1
Slovenia 6.9 7.3 7.5 7.7 8.9 10.5 12.7 15.2
Slovakia 11.5 12.7 13.6 16.6 19.3 22.5 29.0 36.8
Finland 31.5 29.2 29.2 28.3 28.7 29.9 35.2 37.2
Sweden 56.9 49.8 50.5 53.0 58.5 61.5 70.8 75.7
United Kingdom 183.5 182.4 181.9 160.0 164.2 177.4 224.9 185.5

196 European Economic Statistics
4 Statistical annex
2000 2001 2002 2003 2004 2005 2006 2007
Share in the intra-EU dispatches (%)
EU (27 countries) 100.0 100.0 100.0 100.0 100.0 100.0 100.0 100.0
Belgium 8.7 8.8 9.1 9.1 9.2 9.3 9.0 9.1
Bulgaria 0.2 0.2 0.2 0.2 0.2 0.3 0.3 0.3
Czech Republic 1.5 1.7 1.8 2.0 2.3 2.4 2.6 2.9
Denmark 2.2 2.1 2.2 2.2 2.1 2.2 2.1 2.0
Germany 21.4 21.7 21.8 22.5 22.8 22.7 22.5 23.7
Estonia 0.2 0.2 0.2 0.2 0.2 0.2 0.2 0.2
Ireland 3.0 3.2 3.2 2.7 2.6 2.5 2.2 2.1
Greece 0.4 0.4 0.4 0.4 0.4 0.4 0.4 0.4
Spain 5.0 5.2 5.2 5.4 5.3 5.1 4.9 4.7
France 12.7 12.4 12.0 12.1 11.6 10.7 10.4 9.9
Italy 8.9 8.9 8.6 8.6 8.5 8.3 8.1 8.2
Cyprus 0.0 0.0 0.0 0.0 0.0 0.0 0.0 0.0
Latvia 0.1 0.1 0.1 0.1 0.1 0.1 0.1 0.2
Lithuania 0.2 0.2 0.2 0.2 0.2 0.3 0.3 0.3
Luxembourg 0.4 0.5 0.5 0.5 0.6 0.6 0.7 0.5
Hungary 1.4 1.5 1.6 1.7 1.8 1.8 1.9 2.1
Malta 0.0 0.1 0.1 0.1 0.0 0.0 0.0 0.0
Netherlands 11.4 11.2 10.9 11.0 11.1 11.8 11.7 11.9
Austria 3.0 3.2 3.3 3.4 3.4 3.3 3.1 3.3
Poland 1.5 1.7 1.9 2.0 2.3 2.6 2.8 3.0
Portugal 1.2 1.2 1.2 1.2 1.1 1.1 1.1 1.1
Romania 0.5 0.5 0.6 0.6 0.7 0.7 0.7 0.8
Slovenia 0.4 0.4 0.4 0.4 0.4 0.5 0.5 0.6
Slovakia 0.6 0.7 0.7 0.9 0.9 1.0 1.2 1.4
Finland 1.7 1.6 1.5 1.5 1.4 1.3 1.4 1.4
Sweden 3.2 2.7 2.7 2.8 2.8 2.8 2.8 2.9
United Kingdom 10.2 9.7 9.6 8.4 7.9 8.0 9.0 7.0

197 European Economic Statistics
Statistical annex 4
Table 4.36: Trade in services with rest of the world, in € billion
2004 2005 2006 2007
Credit Debit Net Credit Debit Net Credit Debit Net Credit Debit Net
Belgium 42.4 39.5 2.9 45.2 41.2 4.0 47.4 42.2 5.1 56.5 51.6 4.9
Bulgaria 3.3 2.6 0.7 3.6 2.7 0.8 4.1 3.2 1.0 4.6 3.5 1.1
Czech Republic 7.7 7.2 0.5 9.5 8.2 1.2 10.6 9.4 1.2 12.3 10.3 2.0
Denmark 29.4 26.8 2.7 35.4 30.3 5.1 41.8 36.6 5.2 45.0 39.5 5.4
Germany 117.4 157.2 -39.8 126.9 166.9 -40.0 139.1 175.0 -35.9 158.2 188.6 -30.4
Estonia 2.3 1.4 0.9 2.6 1.7 0.8 2.8 2.0 0.8 3.2 2.2 1.0
Ireland 42.4 52.6 -10.2 48.2 57.5 -9.3 55.1 62.5 -7.4 64.8 68.7 -4.0
Greece 26.7 11.3 15.5 27.6 11.9 15.7 28.4 13.0 15.3 0.0 0.0 0.0
Spain 69.4 47.6 21.8 76.2 54.0 22.2 84.5 62.3 22.1 94.1 72.0 22.1
France 90.9 79.2 11.7 95.6 85.0 10.6 94.2 86.0 8.3 100.3 91.4 8.9
Italy 68.2 67.0 1.2 71.9 72.4 -0.5 78.4 79.9 -1.5 83.3 89.5 -6.2
Cyprus 5.0 2.1 2.9 5.2 2.2 3.1 5.8 2.4 3.4 6.4 2.7 3.7
Latvia 1.4 1.0 0.5 1.8 1.3 0.5 2.1 1.6 0.5 2.7 2.0 0.7
Lithuania 2.0 1.3 0.7 2.5 1.7 0.8 2.9 2.0 0.9 3.0 2.4 0.6
Luxembourg 27.1 16.7 10.4 32.9 19.8 13.1 40.6 24.0 16.6 45.7 26.3 19.4
Hungary 8.8 8.5 0.2 10.3 9.2 1.1 10.6 9.3 1.3 12.2 11.1 1.1
Malta 1.4 0.8 0.5 1.6 1.0 0.6 2.1 1.3 0.8 2.3 1.5 0.8
Netherlands 68.3 64.1 4.2 74.0 67.9 6.1 75.0 72.4 2.6 65.4 63.8 1.7
Austria 39.5 37.6 1.9 40.6 36.4 4.1 37.0 25.9 11.1 40.7 28.4 12.3
Poland 10.8 10.0 0.8 13.1 11.5 1.6 16.3 14.6 1.7 20.9 18.0 2.9
Portugal 11.9 7.8 4.0 12.3 8.4 3.8 14.1 9.2 4.9 16.3 10.1 6.2
Romania 2.9 3.1 -0.2 4.1 4.4 -0.3 5.5 5.5 0.0 7.6 7.4 0.2
Slovenia 2.8 2.1 0.7 3.1 2.3 0.8 3.5 2.6 0.9 4.1 3.1 1.0
Slovak Republic 3.0 2.8 0.2 3.5 3.3 0.3 4.3 3.8 0.5 5.2 4.7 0.5
Finland 12.2 9.9 2.3 13.7 12.2 1.4 12.8 12.4 0.4 15.1 15.2 -0.1
Sweden 31.3 26.6 4.7 34.5 26.2 8.4 39.4 29.0 10.4 45.4 35.0 10.4
United Kingdom 158.9 120.7 38.2 168.4 132.5 36.0 182.8 139.9 42.8 202.3 146.2 56.1

198 European Economic Statistics
4 Statistical annex
Table 4.37: EU trade in services, in € billion
Item Breakdown2004 2005 2006 2007
Credit Debit Net Credit Debit Net Credit Debit Net Credit Debit Net
Total Services 368.1 321.7 46.4 402.9 350.0 52.9 441.6 373.1 68.5 501.4 413.0 88.4
Transportation 93.5 79.5 14.0 104.4 87.7 16.8 109.7 96.2 13.6 118.5 102.0 16.5
Travel 62.1 79.5 -17.4 65.4 83.8 -18.4 71.1 85.1 -14.0 76.7 94.1 -17.3
Communications services 6.4 7.1 -0.7 7.4 8.3 -0.9 8.7 9.8 -1.2 9.8 10.7 -0.9
Construction services 9.6 5.8 3.8 11.2 6.1 5.1 12.1 6.6 5.5 15.9 7.9 8.0
Insurance services 10.7 8.4 2.3 6.1 8.4 -2.2 14.2 7.2 7.0 14.3 7.7 6.5
Financial services 29.6 11.9 17.7 35.2 14.4 20.8 41.9 17.4 24.5 54.3 21.3 33.0
Computer and information services
16.3 8.1 8.2 17.3 8.7 8.6 21.0 9.7 11.3 23.6 10.3 13.2
Royalties and license fees 20.4 29.4 -9.0 23.7 32.1 -8.4 23.4 32.6 -9.2 25.5 36.1 -10.6
Other business services 102.4 77.5 24.9 117.1 85.8 31.3 126.9 95.7 31.2 147.8 107.6 40.2
Personal, cultural and recreational services
5.1 6.3 -1.2 4.9 6.3 -1.4 4.6 5.8 -1.2 5.0 5.9 -0.9
Government services, n.i.e. 9.1 5.5 3.7 7.9 6.1 1.8 7.9 6.9 1.1 7.7 7.2 0.7
Services not allocated 2.9 2.9 0.1 2.3 2.4 -0.1 0.0 0.0 0.0 2.5 2.2 0.3
Partner breakdown2004 2005 2006 2007
Credit Debit Net Credit Debit Net Credit Debit Net Credit Debit Net
Switzerland 46.9 34.2 12.7 49.4 38.1 11.3 52.7 37.8 15.0 60.6 41.8 18.9
Russia 9.4 7.4 2.0 12.3 9.1 3.2 14.2 10.8 3.4 18.1 11.5 6.7
Canada 8.3 7.1 1.2 9.0 7.6 1.3 10.2 8.2 2.0 11.3 9.5 1.8
United States of America 117.9 109.3 8.6 123.2 118.2 4.9 134.7 122.1 12.6 139.0 127.8 11.2
Brazil 3.7 3.5 0.3 4.6 4.0 0.6 5.2 4.6 0.5 6.6 4.8 1.8
China 9.3 7.7 1.7 12.3 9.6 2.7 12.8 11.3 1.4 17.7 13.1 4.6
Hong Kong 7.1 5.2 1.9 8.3 5.6 2.6 6.9 6.7 0.2 8.3 7.8 0.7
India 3.9 3.9 -0.1 5.4 4.8 0.6 7.0 5.5 1.4 9.0 6.6 2.4
Japan 18.4 11.1 7.3 19.6 12.3 7.3 18.9 12.9 6.0 19.3 13.3 6.0
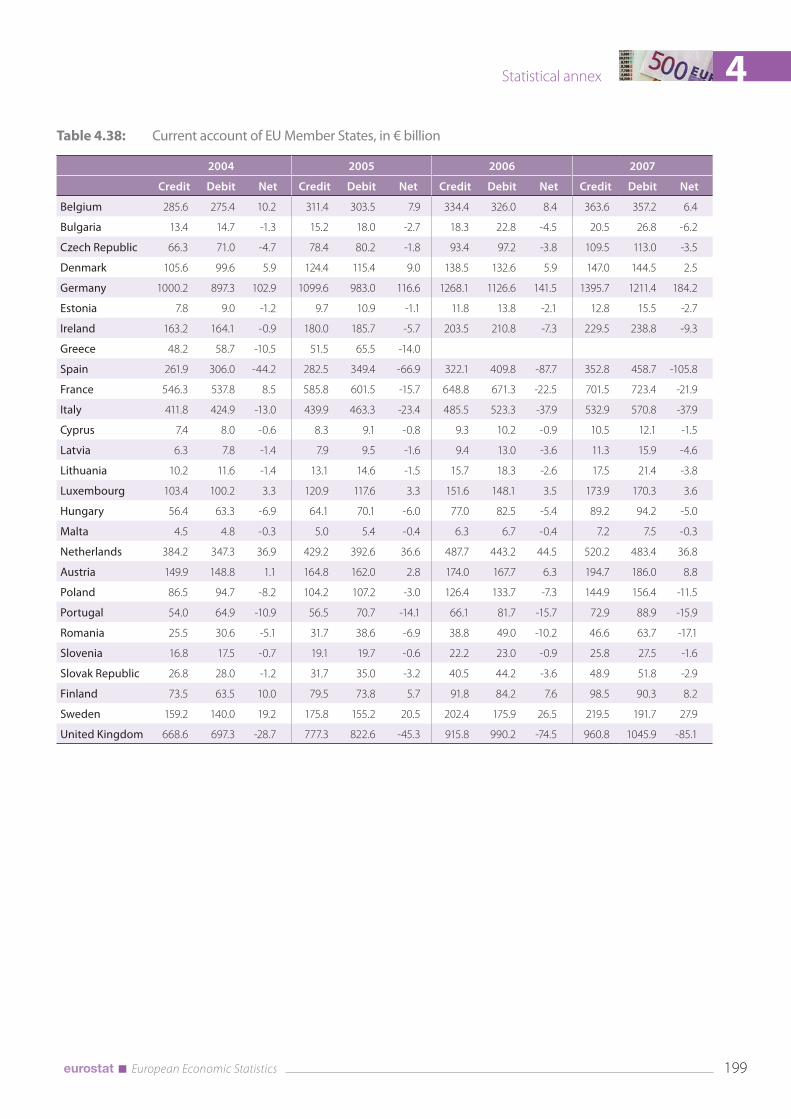
199 European Economic Statistics
Statistical annex 4
Table 4.38: Current account of EU Member States, in € billion
2004 2005 2006 2007
Credit Debit Net Credit Debit Net Credit Debit Net Credit Debit Net
Belgium 285.6 275.4 10.2 311.4 303.5 7.9 334.4 326.0 8.4 363.6 357.2 6.4
Bulgaria 13.4 14.7 -1.3 15.2 18.0 -2.7 18.3 22.8 -4.5 20.5 26.8 -6.2
Czech Republic 66.3 71.0 -4.7 78.4 80.2 -1.8 93.4 97.2 -3.8 109.5 113.0 -3.5
Denmark 105.6 99.6 5.9 124.4 115.4 9.0 138.5 132.6 5.9 147.0 144.5 2.5
Germany 1000.2 897.3 102.9 1099.6 983.0 116.6 1268.1 1126.6 141.5 1395.7 1211.4 184.2
Estonia 7.8 9.0 -1.2 9.7 10.9 -1.1 11.8 13.8 -2.1 12.8 15.5 -2.7
Ireland 163.2 164.1 -0.9 180.0 185.7 -5.7 203.5 210.8 -7.3 229.5 238.8 -9.3
Greece 48.2 58.7 -10.5 51.5 65.5 -14.0
Spain 261.9 306.0 -44.2 282.5 349.4 -66.9 322.1 409.8 -87.7 352.8 458.7 -105.8
France 546.3 537.8 8.5 585.8 601.5 -15.7 648.8 671.3 -22.5 701.5 723.4 -21.9
Italy 411.8 424.9 -13.0 439.9 463.3 -23.4 485.5 523.3 -37.9 532.9 570.8 -37.9
Cyprus 7.4 8.0 -0.6 8.3 9.1 -0.8 9.3 10.2 -0.9 10.5 12.1 -1.5
Latvia 6.3 7.8 -1.4 7.9 9.5 -1.6 9.4 13.0 -3.6 11.3 15.9 -4.6
Lithuania 10.2 11.6 -1.4 13.1 14.6 -1.5 15.7 18.3 -2.6 17.5 21.4 -3.8
Luxembourg 103.4 100.2 3.3 120.9 117.6 3.3 151.6 148.1 3.5 173.9 170.3 3.6
Hungary 56.4 63.3 -6.9 64.1 70.1 -6.0 77.0 82.5 -5.4 89.2 94.2 -5.0
Malta 4.5 4.8 -0.3 5.0 5.4 -0.4 6.3 6.7 -0.4 7.2 7.5 -0.3
Netherlands 384.2 347.3 36.9 429.2 392.6 36.6 487.7 443.2 44.5 520.2 483.4 36.8
Austria 149.9 148.8 1.1 164.8 162.0 2.8 174.0 167.7 6.3 194.7 186.0 8.8
Poland 86.5 94.7 -8.2 104.2 107.2 -3.0 126.4 133.7 -7.3 144.9 156.4 -11.5
Portugal 54.0 64.9 -10.9 56.5 70.7 -14.1 66.1 81.7 -15.7 72.9 88.9 -15.9
Romania 25.5 30.6 -5.1 31.7 38.6 -6.9 38.8 49.0 -10.2 46.6 63.7 -17.1
Slovenia 16.8 17.5 -0.7 19.1 19.7 -0.6 22.2 23.0 -0.9 25.8 27.5 -1.6
Slovak Republic 26.8 28.0 -1.2 31.7 35.0 -3.2 40.5 44.2 -3.6 48.9 51.8 -2.9
Finland 73.5 63.5 10.0 79.5 73.8 5.7 91.8 84.2 7.6 98.5 90.3 8.2
Sweden 159.2 140.0 19.2 175.8 155.2 20.5 202.4 175.9 26.5 219.5 191.7 27.9
United Kingdom 668.6 697.3 -28.7 777.3 822.6 -45.3 915.8 990.2 -74.5 960.8 1045.9 -85.1

200 European Economic Statistics
4 Statistical annex
Table 4.39: EU outward and inward FDI stocks by economic activity at end-2005 in € million
EU FDI stocks held outside
the EU% share
Investments from abroad
held in the EU% share
Net assets abroad
Total 2 435 244 100% 1 823 203 100% 612 041
Agriculture, hunting and fishing 1 229 0% 1 103 0% 126
Mining and quarrying 84 020 3% 42 137 2% 41 883
Manufacturing 508 190 21% 317 396 17% 190 794
- Food products 57 936 2% 45 329 2% 12 607
- Textiles and wood activities 41 826 2% 44 221 2% - 2 395
- Petroleum, chemical, rubber, plastic products 196 541 8% 105 250 6% 91 291
- Metal and mechanical products 99 201 4% 47 090 3% 52 111
- Machinery, computers, RTV, communication 17 649 1% 20 989 1% - 3 340
- Vehicles and other transport equipment 53 196 2% 21 586 1% 31 610
- Other manufacturing 41 841 2% 32 931 2% 8 910
Electricity, gas and water 47 463 2% 13 901 1% 33 562
Construction 25 906 1% 6 053 0% 19 853
Services 1 662 892 68% 1 359 059 75% 303 833
- Trade and repairs 102 691 4% 86 245 5% 16 446
- Hotels & restaurants 15 929 1% 14 189 1% 1 740
- Transport and communication 126 792 5% 46 449 3% 80 343
- Financial intermediation 1 049 069 43% 766 030 42% 283 039
- Business services 284 900 12% 410 661 23% - 125 761
- Other services 83 506 3% 35 472 2% 48 034
Other sectors 105 544 4% 83 554 5% 21 990

201 European Economic Statistics
Statistical annex 4
Table 4.40: Geographical distribution of EU FDI stocks 2004-2006*
Outward stocks at end (EUR bn) Share (%) in 2006
Inward stocks at end (EUR bn) Share (%) in 20062004 2005 2006 2004 2005 2006
Extra EU27 2 199.9 2 435.2 2 706.2 100% 1 732.5 1 823.2 2 057.3 100%
Europe (non-EU) 406.5 509.5 619.8 23% 339.4 402.4 457.4 22%
EFTA 297.7 352.3 376.8 14% 269.8 298.8 324.7 16%
Switzerland 250.4 310.8 333.2 12% 233.5 240.1 247.8 12%
Norway 45.0 39.4 41.5 2% 28.6 45.9 63.0 3%
Russia 21.6 33.3 52.2 2% 5.8 12.3 12.7 1%
Africa 110.2 119.2 125.1 5% 14.7 19.5 23.5 1%
North African countries 23.0 26.1 32.9 1% 3.1 3.6 4.4 0%
Other African countries 87.2 93.1 92.1 3% 11.6 15.9 19.2 1%
Republic of South Africa 43.5 47.1 44.0 2% 4.5 4.2 4.0 0%
America 1 252.5 1 370.4 1 533.6 57% 1 143.9 1 180.6 1 306.2 63%
North American countries 895.8 947.2 1 078.5 40% 907.7 937.3 1019.9 50%
Canada 80.5 97.0 119.6 4% 70.9 76.8 81.0 4%
United States 815.8 850.4 934.3 35% 842.2 874.5 953.7 46%
Central American countries 211.6 255.4 287.1 11% 224.2 229.2 261.3 13%
Mexico 40.3 44.8 43.2 2% 8.1 8.8 8.4 0%
South American countries 145.1 167.8 168.0 6% 11.9 14.1 25.0 1%
Brazil 72.8 84.4 88.0 3% 3.3 6.2 10.5 1%
Asia 345.5 368.4 367.7 14% 160.9 162.6 208.7 10%
Near and Middle East countries 22.1 26.0 27.3 1% 18.6 21.5 35.2 2%
Other Asian countries 323.4 342.4 340.5 13% 142.3 141.1 173.5 8%
China 22.5 28.2 32.7 1% 1.8 1.1 3.6 0%
Hong Kong 97.7 85.4 83.4 3% 16.9 16.8 16.4 1%
India 9.1 11.1 13.4 0% 0.7 2.5 3.2 -0%
Indonesia 7.1 10.9 9.5 0% 0.4 -2.6 -3.3 0%
Japan 79.5 90.2 75.5 3% 89.2 82.7 99.3 5%
South Korea 20.6 28.9 29.2 1% 5.5 6.1 7.6 0%
Singapore 45.8 48.8 54.3 2% 17.7 28.2 40.0 2%
Taiwan 7.1 10.4 9.3 0% 0.8 0.6 0.8 0%
Oceania and Polar regions 67.2 58.7 55.7 2% 37.9 23.5 17.8 1%
Australia 60.3 52.8 50.6 2% 37.1 22.8 17.3 1%
New Zealand 6.5 5.8 5.2 0% 0.7 1.0 1.8 0%
* The sum of continents does not always equal total extra-EU because of not allocated flows.
Parts may be higher than totals because of disinvestment.

202 European Economic Statistics
4 Statistical annex
Table 4.41: Foreign Direct investment flows with rest of the world, in € billion
2004 2005 2006 2007
Outward Inward Net Outward Inward Net Outward Inward Net Outward Inward Net
EU27(1) 142.3 58.3 84.0 234.5 127.0 107.5 275.0 168.9 106.1 419.9 319.2 100.8
Belgium 27.4 35.1 -7.7 26.3 27.6 -1.4 44.8 50.9 -6.2 37.9 28.5 9.3
Bulgaria -0.2 2.7 -2.9 0.2 3.1 -2.9 0.1 6.0 -5.8 0.2 6.1 -5.9
Czech Republic 0.8 4.0 -3.2 -0.0 9.4 -9.4 1.2 4.8 -3.6 1.0 6.7 -5.7
Denmark : : : 13.0 10.4 2.7 6.8 2.9 3.9 11.9 8.3 3.6
Germany 11.9 -7.4 19.3 44.6 28.8 15.8 75.5 44.0 31.5 122.3 37.2 85.1
Estonia 0.2 0.8 -0.6 0.5 2.3 -1.7 0.9 1.3 -0.5 1.1 1.8 -0.7
Ireland 14.6 -8.5 23.1 11.5 -25.5 37.0 11.7 -0.7 12.5 12.1 18.9 -6.8
Greece : : : : : : : : : : : :
Spain 48.8 19.9 28.8 33.6 20.1 13.5 79.9 21.4 58.5 87.4 39.0 48.4
France 45.7 26.2 19.5 97.3 65.2 32.1 91.7 64.6 27.1 159.3 109.5 49.8
Italy 15.5 13.6 2.0 33.6 16.0 17.6 33.5 31.2 2.3 64.2 22.7 41.5
Cyprus 0.6 0.9 -0.3 0.4 1.0 -0.5 0.7 1.2 -0.5 0.8 1.5 -0.7
Latvia 0.1 0.5 -0.4 0.1 0.6 -0.5 0.1 1.3 -1.2 0.2 1.6 -1.4
Lithuania 0.2 0.6 -0.4 0.3 0.8 -0.5 0.2 1.4 -1.2 0.4 1.4 -1.0
Luxembourg 67.7 63.7 4.0 99.7 93.6 6.2 88.2 99.6 -11.4 132.9 86.8 46.1
Hungary (2) 0.9 3.6 -2.7 1.8 6.2 -4.4 15.0 15.8 -0.7 25.8 26.8 -1.0
Malta 0.0 0.3 -0.3 -0.0 0.5 -0.6 0.0 1.5 -1.5 0.0 0.7 -0.7
Netherlands (3) 23.5 3.7 19.8 109.2 38.4 70.9 37.5 6.4 31.2 22.8 72.7 -49.9
Austria (3) 6.7 3.1 3.6 9.3 9.0 0.4 7.9 4.5 3.4 23.2 22.6 0.5
Poland 0.6 10.1 -9.4 2.7 8.3 -5.6 7.1 15.2 -8.1 2.4 12.8 -10.4
Portugal 6.3 1.9 4.4 : : : 5.6 9.0 -3.5 4.5 4.1 0.4
Romania : : : 0.0 5.2 : 0.3 9.1 : -0.0 7.3 :
Slovenia 0.4 0.6 -0.2 0.5 0.7 -0.1 0.7 0.5 0.2 1.2 1.1 0.1
Slovakia -0.0 2.4 -2.5 0.1 2.0 -1.8 0.3 3.3 -3.0 0.2 2.2 -2.0
Finland -0.9 2.3 -3.1 3.4 3.8 -0.4 2.5 4.4 -1.8 6.3 6.2 0.1
Sweden 16.7 9.4 7.3 21.4 8.2 13.2 17.5 18.3 -0.8 26.8 13.7 13.1
United Kingdom 73.3 45.0 28.2 65.0 141.6 -76.6 72.4 117.7 -45.3 165.4 135.7 29.7
Net = Outward minus inward investment flows
Negative values denote disinvestment
: missing or confidential data
(1) EU27 investments with extra EU27
(2) Special purpose entities as included from 2006 onwards
(3) Special purpose entities are not included

203 European Economic Statistics
Statistical annex 4
Table 4.42: Employment levels (thousand persons)
2000 2005 2006 2007
European Union (27 countries) 209,426 216,464 219,913 223,448
Euro area 15 133,686 139,664 141,870 144,370
Euro area 13 133,237 139,146 141,343 143,827
Belgium 4,091 4,225 4,278 4,337 f
Bulgaria 3,239 3,495 3,612 3,714
Czech Republic 4,940 4,988 5,082 5,161 f
Denmark 2,760 2,762 2,807 2,858
Germany 39,144 38,846 39,088 39,737
Estonia 572 604 637 642
Ireland 1,696 1,958 2,042 2,111 f
Greece 4,255 4,536 4,647 4,705
Spain 16,412 19,264 19,985 20,614
France 24,332 25,089 25,278 25,530 f
Italy 22,930 24,396 24,882 25,165
Cyprus 315 366 373 385
Latvia 944 1,026 1,074 1,111
Lithuania 1,399 1,461 1,486 1,515
Luxembourg 264 308 319 332 f
Hungary 3,844 3,879 3,905 3,899
Malta 146 152 154 158
Netherlands 8,115 8,231 8,383 8,548 f
Austria 3,766 3,873 3,912 3,988
Poland 14,526 e 14,116 e 14,577 e 15,218 f
Portugal 5,030 5,100 5,137 f 5,150 f
Romania : 9,267 9,526 f 9,643 f
Slovenia 905 924 935 960
Slovakia 2,025 2,084 2,132 2,177
Finland 2,297 2,398 2,440 2,494
Sweden 4,301 4,349 4,423 4,522
United Kingdom 27,477 28,769 29,018 29,219
Croatia 1,549 1,573 f 1,586 f 1,627 f
Turkey 21,970 f 22,103 f 22,378 f 22,718 f
Iceland 156 161 170 f 171 f
Norway 2,320 2,352 2,430 2,488 f
Switzerland 4,089 4,196 4,291 4,323 f
f Forecast
e Estimated value
Source: National accounts

204 European Economic Statistics
4 Statistical annex
Table 4.43: Employment growth (% over previous year)
2000 2005 2006 2007
European Union (27 countries) 1.7 0.9 1.6 1.6
Euro area 15 2.4 0.9 1.6 1.8
Euro area 13 2.4 0.9 1.6 1.8
Belgium 2.0 1.2 1.3 1.4 f
Bulgaria 4.9 2.7 3.3 2.8
Czech Republic -0.2 1.0 1.9 1.6 f
Denmark 0.5 0.8 1.6 1.8
Germany 1.9 -0.1 0.6 1.7
Estonia -1.5 1.9 5.5 0.8
Ireland 4.6 4.7 4.3 3.4 f
Greece 0.5 1.5 2.4 1.2
Spain 5.1 4.1 3.7 3.1
France 2.7 0.4 0.8 1.0 f
Italy 1.9 0.6 2.0 1.1
Cyprus 1.6 3.4 1.9 3.2
Latvia -3.0 1.8 4.7 3.4
Lithuania -4.0 2.5 1.7 2.0
Luxembourg 5.6 3.0 3.6 4.1 f
Hungary 1.3 0.0 0.7 -0.2
Malta : 1.3 1.3 2.6
Netherlands 2.2 0.2 1.8 2.0 f
Austria 1.1 1.4 1.0 1.9
Poland -1.6 e 2.3 e 3.3 e 4.4 f
Portugal 2.1 -0.3 0.7 f 0.3 f
Romania : -1.5 2.8 f 1.2 f
Slovenia 1.3 0.2 1.2 2.7
Slovakia -1.9 1.4 2.3 2.1
Finland 2.2 1.4 1.8 2.2
Sweden 2.5 0.3 1.7 2.2
United Kingdom 1.2 1.0 0.9 0.7
Croatia 4.0 0.8 f 0.8 f 2.6 f
Turkey -0.4 f 1.4 f 1.2 f 1.5 f
Iceland 2.0 3.2 5.6 f 0.6 f
Norway 0.6 1.2 3.3 2.4 f
Switzerland 1.1 0.4 2.3 0.7 f
f Forecast
e Estimated value
Source: National accounts

205 European Economic Statistics
Statistical annex 4
Table 4.44: Employment rates (15-64 years old), males plus females
2000 2005 2006 2007
European Union (27 countries) 62.2 63.5 64.5 65.4
Euro area 15 61.5 63.8 64.8 65.7
Euro area 13 61.5 63.8 64.8 65.7
Belgium 60.5 61.1 61.0 62.0
Bulgaria 50.4 55.8 58.6 61.7
Czech Republic 65.0 64.8 65.3 66.1
Denmark 76.3 75.9 77.4 77.1
Germany 65.6 66.0 b 67.5 69.4
Estonia 60.4 64.4 68.1 69.4
Ireland 65.2 67.6 68.6 69.1
Greece 56.5 60.1 61.0 61.4
Spain 56.3 63.3 b 64.8 65.6
France 62.1 63.9 63.8 64.6
Italy 53.7 57.6 58.4 58.7
Cyprus 65.7 68.5 69.6 71.0
Latvia 57.5 63.3 66.3 68.3
Lithuania 59.1 62.6 63.6 64.9
Luxembourg 62.7 63.6 63.6 63.6
Hungary 56.3 56.9 57.3 57.3
Malta 54.2 53.9 54.8 55.7
Netherlands 72.9 73.2 74.3 76.0
Austria 68.5 68.6 70.2 71.4
Poland 55.0 52.8 54.5 57.0
Portugal 68.4 67.5 67.9 67.8
Romania 63.0 57.6 58.8 58.8
Slovenia 62.8 66.0 66.6 67.8
Slovakia 56.8 57.7 59.4 60.7
Finland 67.2 68.4 69.3 70.3
Sweden 73.0 72.5 b 73.1 74.2
United Kingdom 71.2 b 71.7 71.5 71.3
Croatia : 55.0 55.6 :
Turkey 48.8 i 46.0 i 45.9 :
Iceland : 83.8 84.6 85.1 p
Norway 77.5 74.8 75.4 76.8
Switzerland 78.3 i 77.2 i 77.9 i 78.6 i
b Break in series
p Provisional value
i Explanatory text:
Turkey – data source: national Labour Force Survey
Switzerland – data refers to quarter 2
Source: EU LFS

206 European Economic Statistics
4 Statistical annex
Table 4.45: Employment rates (15 to 64 years old), females
2000 2005 2006 2007
European Union (27 countries) 53.7 56.3 57.3 58.3
Euro area 15 51.4 55.7 56.8 58.0
Euro area 13 51.4 55.7 56.9 58.0
Belgium 51.5 53.8 54.0 55.3
Bulgaria 46.3 51.7 54.6 57.6
Czech Republic 56.9 56.3 56.8 57.3
Denmark 71.6 71.9 73.4 73.2
Germany 58.1 60.6 b 62.2 64.0
Estonia 56.9 62.1 65.3 65.9
Ireland 53.9 58.3 59.3 60.6
Greece 41.7 46.1 47.4 47.9
Spain 41.3 51.2 b 53.2 54.7
France 55.2 58.5 58.8 60.0
Italy 39.6 45.3 46.3 46.6
Cyprus 53.5 58.4 60.3 62.4
Latvia 53.8 59.3 62.4 64.4
Lithuania 57.7 59.4 61.0 62.2
Luxembourg 50.1 53.7 54.6 55.0
Hungary 49.7 51.0 51.1 50.9
Malta 33.1 33.7 34.9 36.9
Netherlands 63.5 66.4 67.7 69.6
Austria 59.6 62.0 63.5 64.4
Poland 48.9 46.8 48.2 50.6
Portugal 60.5 61.7 62.0 61.9
Romania 57.5 51.5 53.0 52.8
Slovenia 58.4 61.3 61.8 62.6
Slovakia 51.5 50.9 51.9 53.0
Finland 64.2 66.5 67.3 68.5
Sweden 70.9 70.4 b 70.7 71.8
United Kingdom 64.7 b 65.9 65.8 65.5
Croatia : 48.6 49.4 :
Turkey 25.8 i 23.8 i 23.9 :
Iceland : 80.5 80.8 80.8 p
Norway 73.6 71.7 72.2 74.0
Switzerland 69.3 i 70.4 i 71.1 i 71.6 i
b Break in series
p Provisional value
i Explanatory text:
Turkey – data source: national Labour Force Survey
Switzerland – data refers to quarter 2
Source: EU LFS

207 European Economic Statistics
Statistical annex 4
Table 4.46: Employment rates (15 to 64 years old), males
2000 2005 2006 2007
European Union (27 countries) 70.8 70.8 71.6 72.5
Euro area 15 71.6 71.9 72.7 73.4
Euro area 13 71.6 71.9 72.7 73.4
Belgium 69.5 68.3 67.9 68.7
Bulgaria 54.7 60.0 62.8 66.0
Czech Republic 73.2 73.3 73.7 74.8
Denmark 80.8 79.8 81.2 81.0
Germany 72.9 71.3 b 72.8 74.7
Estonia 64.3 67.0 71.0 73.2
Ireland 76.3 76.9 77.7 77.4
Greece 71.5 74.2 74.6 74.9
Spain 71.2 75.2 b 76.1 76.2
France 69.2 69.3 69.0 69.3
Italy 68.0 69.9 70.5 70.7
Cyprus 78.7 79.2 79.4 80.0
Latvia 61.5 67.6 70.4 72.5
Lithuania 60.5 66.1 66.3 67.9
Luxembourg 75.0 73.3 72.6 71.9
Hungary 63.1 63.1 63.8 64.0
Malta 75.0 73.8 74.5 74.2
Netherlands 82.1 79.9 80.9 82.2
Austria 77.3 75.4 76.9 78.4
Poland 61.2 58.9 60.9 63.6
Portugal 76.5 73.4 73.9 73.8
Romania 68.6 63.7 64.6 64.8
Slovenia 67.2 70.4 71.1 72.7
Slovakia 62.2 64.6 67.0 68.4
Finland 70.1 70.3 71.4 72.1
Sweden 75.1 74.4 b 75.5 76.5
United Kingdom 77.8 b 77.6 77.3 77.3
Croatia : 61.7 62.0 :
Turkey 71.8 i 68.2 i 68.1 :
Iceland : 86.9 88.1 89.1 p
Norway 81.3 77.8 78.4 79.5
Switzerland 87.3 i 83.9 i 84.7 i 85.6 i
b Break in series
p Provisional value
i Explanatory text:
Turkey – data source: national Labour Force Survey
Switzerland – data refers to quarter 2
Source: EU LFS

208 European Economic Statistics
4 Statistical annex
Table 4.47: Employment rates, older workers (aged 55-64), males plus females
2000 2005 2006 2007
European Union (27 countries) 36.9 42.4 43.5 44.7
Euro area 15 34.4 40.5 41.8 43.3
Euro area 13 34.3 40.5 41.8 43.3
Belgium 26.3 31.8 32.0 34.4
Bulgaria 20.8 34.7 39.6 42.6
Czech Republic 36.3 44.5 45.2 46.0
Denmark 55.7 59.5 60.7 58.6
Germany 37.6 45.4 b 48.4 51.5
Estonia 46.3 56.1 58.5 60.0
Ireland 45.3 51.6 53.1 53.8
Greece 39.0 41.6 42.3 42.4
Spain 37.0 43.1 b 44.1 44.6
France 29.9 38.7 38.1 38.3
Italy 27.7 31.4 32.5 33.8
Cyprus 49.4 50.6 53.6 55.9
Latvia 36.0 49.5 53.3 57.7
Lithuania 40.4 49.2 49.6 53.4
Luxembourg 26.7 31.7 33.2 32.9
Hungary 22.2 33.0 33.6 33.1
Malta 28.5 30.8 30.0 28.3
Netherlands 38.2 46.1 47.7 50.9
Austria 28.8 31.8 35.5 38.6
Poland 28.4 27.2 28.1 29.7
Portugal 50.7 50.5 50.1 50.9
Romania 49.5 39.4 41.7 41.4
Slovenia 22.7 30.7 32.6 33.5
Slovakia 21.3 30.3 33.1 35.6
Finland 41.6 52.7 54.5 55.0
Sweden 64.9 69.4 b 69.6 70.0
United Kingdom 50.7 b 56.9 57.4 57.4
Croatia : 32.6 34.3 :
Turkey 36.3 i 31.0 i 30.1 :
Iceland : 84.3 84.3 84.7 p
Norway 65.2 65.5 67.4 69.0
Switzerland 63.3 i 65.1 i 65.7 i 67.2 i
b Break in series
p Provisional value
i Explanatory text:
Turkey – data source: national Labour Force Survey
Switzerland – data refers to quarter 2
Source: EU LFS

209 European Economic Statistics
Statistical annex 4
Table 4.48: Employment by NACE (thousands persons)
2007
NACE A-B NACE C-E NACE F NACE G-I NACE J-K NACE L-P Total
European Union (27 countries) 13,902 39,093 16,433 56,290 33,436 64,293 223,448
Euro area 15 5,852 24,720 11,180 36,659 22,677 43,281 144,370
Euro area 13 5,832 24,638 11,130 36,477 22,622 43,128 143,827
Belgium : : : : : : 4,349 f
Bulgaria 732 821 231 910 252 768 3,714
Czech Republic : : : : : : 5,172 f
Denmark 84 407 187 745 434 1,001 2,858
Germany 850 7,905 2,199 9,909 6,876 11,998 39,737
Estonia 30 148 74 166 58 165 642
Ireland : : : : : : 2,116 f
Greece 534 534 395 1,511 413 1,318 4,705
Spain 923 3,226 2,695 5,761 2,390 5,619 20,614
France : : : : : : 25,581 f
Italy 1,016 5,245 1,930 6,122 3,719 7,134 25,165
Cyprus 18 40 38 137 43 110 385
Latvia 110 186 128 321 99 268 1,111
Lithuania 164 293 165 396 97 400 1,515
Luxembourg : : : : : : 333 f
Hungary 180 945 325 1,045 369 1,035 3,899
Malta : : : : : : 158
Netherlands : : : : : : 8,583 f
Austria : : : : : : 3,988
Poland : : : : : : 15,240 f
Portugal : : : : : : 5,147 f
Romania : : : : : : 9,645 f
Slovenia 87 253 80 209 132 199 960
Slovakia 79 577 169 625 219 507 2,177
Finland 120 460 185 574 328 826 2,494
Sweden 99 755 271 975 663 1,759 4,522
United Kingdom : : : : : : 29,219
Croatia : : : : : : 1,618 f
Turkey : : : : : : 22,651 f
Iceland : : : : : : 177 f
Norway : : : : : : 2,523 f
Switzerland : : : : : : 4,361 f

210 European Economic Statistics
4 Statistical annex
2000
NACE A-B NACE C-E NACE F NACE G-I NACE J-K NACE L-P Total
European Union (27 countries) 15,283 41,552 14,322 52,118 27,822 58,328 209,426
Euro area 15 6,536 25,926 9,949 33,645 18,788 38,841 133,686
Euro area 13 6,514 25,851 9,913 33,493 18,745 38,721 133,237
Belgium 95 687 240 1,001 739 1,329 4,091
Bulgaria 789 761 132 699 154 704 3,239
Czech Republic 238 1,503 431 1,254 513 1,002 4,940
Denmark 95 468 167 702 358 970 2,760
Germany 936 8,534 2,769 9,824 5,802 11,279 39,144
Estonia 41 151 39 155 47 139 572
Ireland 131 317 171 455 213 409 1,696
Greece 722 540 300 1,360 309 1,023 4,255
Spain 1,037 3,088 1,821 4,466 1,640 4,359 16,412
France 961 3,866 1,464 5,560 4,189 8,291 24,332
Italy 1,103 5,190 1,554 5,632 2,950 6,502 22,930
Cyprus 19 39 26 114 33 84 315
Latvia 136 189 56 246 70 249 944
Lithuania 261 290 83 317 58 390 1,399
Luxembourg 4 35 26 71 71 58 264
Hungary 245 1,035 267 1,003 289 1,005 3,844
Malta 3 36 10 39 10 36 146
Netherlands 280 1,082 493 2,153 1,658 2,450 8,115
Austria : : : : : : 3,766
Poland 2,794 e 3,231 e 671 e 3,245 e 1,337 e 3,248 e 14,526 e
Portugal 634 1,075 581 1,223 363 1,153 5,030
Romania : : : : : : :
Slovenia 107 274 67 194 88 176 905
Slovakia 116 573 135 493 175 533 2,025
Finland 137 483 154 532 251 739 2,297
Sweden 127 827 219 928 569 1,631 4,301
United Kingdom : : : : : : 27,477
Croatia 225 348 100 407 105 364 1,549
Turkey : : : : : : 21,970 f
Iceland : : : : : : 156
Norway 96 347 140 611 278 848 2,320
Switzerland 185 754 296 1,151 631 1,071 4,089
f Forecast
e Estimated value
Source: National accounts

211 European Economic Statistics
Statistical annex 4
Table 4.49: Part-time jobholders, males plus females (% total jobholders)
2000 2005 2006 2007
European Union (27 countries) 16.2 17.8 18.1 18.2
Euro area 15 15.8 18.9 19.5 19.6
Euro area 13 15.9 18.9 19.5 19.7
Belgium 18.9 22.0 22.2 22.1
Bulgaria : 2.1 2.0 1.7
Czech Republic 5.3 4.9 5.0 5.0
Denmark 21.3 22.1 23.6 24.1
Germany 19.4 24.0 b 25.8 26.0
Estonia 8.1 7.8 7.8 8.2
Ireland 16.4 : : :
Greece 4.5 5.0 5.7 5.6
Spain 7.9 12.4 b 12.0 11.8
France 16.7 17.1 17.2 17.2
Italy 8.4 12.8 13.3 13.6
Cyprus 8.4 8.9 7.7 7.3
Latvia 11.3 8.3 6.5 6.4
Lithuania 10.2 7.1 9.9 8.6
Luxembourg 10.4 17.4 17.1 18.0
Hungary 3.5 4.1 4.0 4.1
Malta 6.8 9.6 10.1 11.1
Netherlands 41.5 46.1 46.2 46.8
Austria 16.3 21.1 21.8 22.6
Poland 10.5 10.8 9.8 9.2
Portugal 10.9 11.2 11.3 12.1
Romania 16.5 10.2 9.7 9.7
Slovenia 6.5 9.0 9.2 9.3
Slovakia 2.1 2.5 2.8 2.6
Finland 12.3 13.7 14.0 14.1
Sweden 19.5 24.7 b 25.1 25.0
United Kingdom 25.2 b 25.4 25.5 25.5
Croatia : 10.1 9.4 :
Turkey 9.2 i 5.9 i 7.9 :
Iceland : 22.2 17.1 16.7 p
Norway 25.8 28.2 28.7 28.2
Switzerland 30.5 i 33.1 i 33.3 i 33.5 i
b Break in series
p Provisional value
i Explanatory text:
Turkey – data source: national Labour Force Survey
Switzerland – data refers to quarter 2
Source: EU LFS
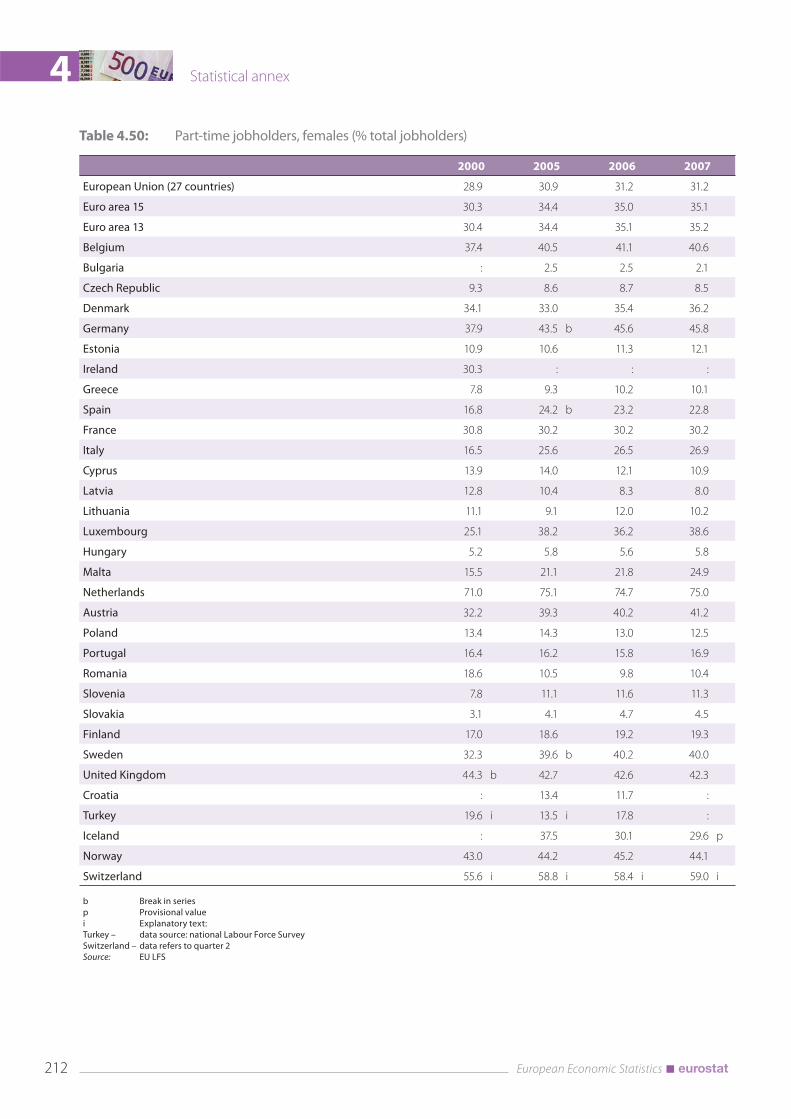
212 European Economic Statistics
4 Statistical annex
Table 4.50: Part-time jobholders, females (% total jobholders)
2000 2005 2006 2007
European Union (27 countries) 28.9 30.9 31.2 31.2
Euro area 15 30.3 34.4 35.0 35.1
Euro area 13 30.4 34.4 35.1 35.2
Belgium 37.4 40.5 41.1 40.6
Bulgaria : 2.5 2.5 2.1
Czech Republic 9.3 8.6 8.7 8.5
Denmark 34.1 33.0 35.4 36.2
Germany 37.9 43.5 b 45.6 45.8
Estonia 10.9 10.6 11.3 12.1
Ireland 30.3 : : :
Greece 7.8 9.3 10.2 10.1
Spain 16.8 24.2 b 23.2 22.8
France 30.8 30.2 30.2 30.2
Italy 16.5 25.6 26.5 26.9
Cyprus 13.9 14.0 12.1 10.9
Latvia 12.8 10.4 8.3 8.0
Lithuania 11.1 9.1 12.0 10.2
Luxembourg 25.1 38.2 36.2 38.6
Hungary 5.2 5.8 5.6 5.8
Malta 15.5 21.1 21.8 24.9
Netherlands 71.0 75.1 74.7 75.0
Austria 32.2 39.3 40.2 41.2
Poland 13.4 14.3 13.0 12.5
Portugal 16.4 16.2 15.8 16.9
Romania 18.6 10.5 9.8 10.4
Slovenia 7.8 11.1 11.6 11.3
Slovakia 3.1 4.1 4.7 4.5
Finland 17.0 18.6 19.2 19.3
Sweden 32.3 39.6 b 40.2 40.0
United Kingdom 44.3 b 42.7 42.6 42.3
Croatia : 13.4 11.7 :
Turkey 19.6 i 13.5 i 17.8 :
Iceland : 37.5 30.1 29.6 p
Norway 43.0 44.2 45.2 44.1
Switzerland 55.6 i 58.8 i 58.4 i 59.0 i
b Break in series
p Provisional value
i Explanatory text:
Turkey – data source: national Labour Force Survey
Switzerland – data refers to quarter 2
Source: EU LFS

213 European Economic Statistics
Statistical annex 4
Table 4.51: Part-time jobholders, males (% total jobholders)
2000 2005 2006 2007
European Union (27 countries) 6.5 7.4 7.7 7.7
Euro area 15 5.4 7.0 7.4 7.5
Euro area 13 5.4 7.0 7.4 7.5
Belgium 5.5 7.6 7.4 7.5
Bulgaria : 1.7 1.5 1.3
Czech Republic 2.2 2.1 2.2 2.3
Denmark 10.2 12.7 13.3 13.5
Germany 5.0 7.8 b 9.3 9.4
Estonia 5.3 4.9 4.3 4.3
Ireland 6.9 : : :
Greece 2.6 2.3 2.9 2.7
Spain 2.8 4.5 b 4.3 4.1
France 5.3 5.8 5.8 5.7
Italy 3.7 4.6 4.7 5.0
Cyprus 4.5 5.0 4.3 4.4
Latvia 9.7 6.3 4.7 4.9
Lithuania 9.2 5.1 7.9 7.0
Luxembourg 1.7 2.5 2.6 2.6
Hungary 2.0 2.7 2.6 2.8
Malta 3.0 4.5 4.8 4.4
Netherlands 19.3 22.6 23.0 23.6
Austria 4.1 6.1 6.5 7.2
Poland 8.2 8.0 7.1 6.6
Portugal 6.4 7.0 7.4 8.0
Romania 14.6 10.0 9.5 9.2
Slovenia 5.3 7.2 7.2 7.7
Slovakia 1.1 1.3 1.3 1.1
Finland 8.0 9.2 9.3 9.3
Sweden 8.2 11.5 b 11.8 11.8
United Kingdom 8.9 b 10.4 10.6 10.9
Croatia : 7.3 7.5 :
Turkey 5.5 i 3.3 i 4.4 :
Iceland : 8.7 7.0 6.8 p
Norway 10.6 13.8 13.9 13.9
Switzerland 10.8 i 11.8 i 12.6 i 12.4 i
b Break in series
p Provisional value
i Explanatory text:
Turkey – data source: national Labour Force Survey
Switzerland – data refers to quarter 2
Source: EU LFS

214 European Economic Statistics
4 Statistical annex
Table 4.52: Fixed-term contracts, males plus females (% total employees)
2000 2005 2006 2007
European Union (27 countries) 12.3 14.0 14.4 14.5
Euro area 15 15.2 16.3 16.7 16.7
Euro area 13 15.2 16.3 16.8 16.8
Belgium 9.1 8.9 8.7 8.6
Bulgaria : 6.4 6.2 5.2
Czech Republic 8.1 8.6 8.7 8.6
Denmark 9.7 9.8 8.9 8.7
Germany 12.7 14.1 b 14.5 14.6
Estonia 3.0 2.7 2.7 2.1
Ireland 5.9 3.7 3.4 7.3
Greece 13.5 11.8 10.7 10.9
Spain 32.2 33.3 b 34.0 31.7
France 15.2 14.1 14.1 14.4
Italy 10.1 12.3 13.1 13.2
Cyprus 10.7 14.0 13.1 13.2
Latvia 6.7 8.4 7.1 4.2
Lithuania 4.4 5.5 4.5 3.5
Luxembourg 5.3 5.3 6.1 6.8
Hungary 7.1 7.0 6.7 7.3
Malta 4.1 4.5 3.8 5.2
Netherlands 13.7 15.5 16.6 18.1
Austria 8.0 9.1 9.0 8.9
Poland 5.8 25.7 27.3 28.2
Portugal 19.9 19.5 20.6 22.4
Romania 2.8 2.4 1.8 1.6
Slovenia 13.7 17.4 17.3 18.5
Slovakia 4.8 5.0 5.1 5.1
Finland 16.3 16.5 16.4 15.9
Sweden 15.8 16.0 b 17.3 17.5
United Kingdom 6.9 b 5.7 5.8 5.8
Croatia : 12.4 12.9 :
Turkey : : 13.3 :
Iceland : 6.9 11.5 12.3 p
Norway 2.6 9.5 10.1 9.6
Switzerland 11.5 i 12.8 i 13.5 i 12.9 i
b Break in series
p Provisional value
i Explanatory text:
Turkey – data source: national Labour Force Survey
Switzerland – data refers to quarter 2
Source: EU LFS

215 European Economic Statistics
Statistical annex 4
Table 4.53: Fixed-term contracts, females (% total employees)
2000 2005 2006 2007
European Union (27 countries) 13.0 14.5 15.0 15.2
Euro area 15 16.4 17.2 17.7 17.7
Euro area 13 16.4 17.2 17.7 17.7
Belgium 12.3 11.4 10.9 10.8
Bulgaria : 6.2 6.1 5.5
Czech Republic 9.4 9.8 10.1 10.2
Denmark 11.1 11.3 10.0 10.0
Germany 13.1 13.8 b 14.1 14.5
Estonia 1.7 2.0 2.2 1.6
Ireland 7.2 4.2 3.9 8.6
Greece 16.1 14.3 13.0 13.1
Spain 34.2 35.7 b 36.7 33.1
France 16.4 15.0 14.8 15.4
Italy 12.2 14.7 15.8 15.9
Cyprus 14.3 19.5 19.0 19.2
Latvia 4.6 6.2 5.4 2.9
Lithuania 3.1 3.6 2.7 2.3
Luxembourg 6.6 5.8 6.6 7.9
Hungary 6.5 6.4 6.0 6.8
Malta 5.6 6.1 6.0 8.0
Netherlands 16.8 16.9 18.0 19.7
Austria 8.8 8.8 8.9 9.0
Poland 4.9 24.7 26.0 27.9
Portugal 21.9 20.4 21.7 23.0
Romania 2.8 1.9 1.6 1.5
Slovenia 14.8 19.3 19.3 20.8
Slovakia 4.5 4.9 5.2 5.3
Finland 19.8 20.0 20.0 19.4
Sweden 17.8 17.7 b 19.1 19.9
United Kingdom 7.9 b 6.2 6.4 6.4
Croatia : 12.3 12.6 :
Turkey : : 13.1 :
Iceland : 7.8 12.7 13.6 p
Norway 3.3 11.6 12.6 11.7
Switzerland 12.8 i 13.0 i 13.9 i 13.1 i
b Break in series
p Provisional value
i Explanatory text:
Turkey – data source: national Labour Force Survey
Switzerland – data refers to quarter 2
Source: EU LFS

216 European Economic Statistics
4 Statistical annex
Table 4.54: Fixed-term contracts, male (% total employees)
2000 2005 2006 2007
European Union (27 countries) 11.7 13.6 13.9 13.9
Euro area 15 14.2 15.6 15.9 15.9
Euro area 13 14.3 15.6 16.0 15.9
Belgium 6.7 6.8 6.9 6.8
Bulgaria : 6.7 6.3 5.0
Czech Republic 7.1 7.6 7.5 7.3
Denmark 8.5 8.5 8.0 7.6
Germany 12.5 14.4 b 14.7 14.7
Estonia 4.4 3.4 3.3 2.7
Ireland 4.9 3.1 2.9 6.0
Greece 11.8 10.1 9.1 9.3
Spain 30.9 31.7 b 32.0 30.6
France 14.2 13.3 13.4 13.3
Italy 8.7 10.5 11.2 11.2
Cyprus 7.6 9.0 7.9 7.6
Latvia 8.8 10.7 8.8 5.5
Lithuania 5.9 7.6 6.4 4.9
Luxembourg 4.6 4.9 5.7 5.9
Hungary 7.7 7.6 7.4 7.7
Malta 3.4 3.7 2.7 3.7
Netherlands 11.2 14.3 15.4 16.6
Austria 7.4 9.3 9.1 8.8
Poland 6.5 26.5 28.5 28.4
Portugal 18.3 18.7 19.5 21.8
Romania 2.8 2.8 2.0 1.7
Slovenia 12.7 15.7 15.5 16.5
Slovakia 5.1 5.1 5.0 4.9
Finland 12.9 12.9 12.6 12.4
Sweden 13.8 14.2 b 15.4 15.0
United Kingdom 6.1 b 5.2 5.1 5.2
Croatia : 12.4 13.1 :
Turkey : : 13.3 :
Iceland : 6.0 10.4 11.0 p
Norway 2.1 7.5 7.8 7.6
Switzerland 10.5 i 12.6 i 13.1 i 12.7 i
b Break in series
p Provisional value
i Explanatory text:
Turkey – data source: national Labour Force Survey
Switzerland – data refers to quarter 2
Source: EU LFS

217 European Economic Statistics
Statistical annex 4
Table 4.55: Fixed-term contracts by full-time / part-time job status, averages 2004-2007
Part-time jobholders Full-time jobholders
fixed-term permanent Total fixed-term permanent Total
European Union (27 countries) 19.9 80.1 100 12.8 87.2 100
Euro area 13 20.8 79.2 100 15.3 84.7 100
Belgium 14.7 85.3 100 6.8 93.2 100
Bulgaria 31.7 68.3 100 5.8 94.2 100
Czech Republic 44.5 55.5 100 7.0 93.0 100
Denmark 13.3 86.7 100 8.0 92.0 100
Germany 12.4 87.6 100 14.4 85.6 100
Estonia 7.7 92.3 100 2.2 97.8 100
Ireland 16.2 83.8 100 3.3 96.7 100
Greece 50.7 49.3 100 9.5 90.5 100
Spain 53.0 47.0 100 30.2 69.8 100
France 22.8 77.2 100 12.0 88.0 100
Italy 20.9 79.1 100 11.4 88.6 100
Cyprus 21.2 78.8 100 12.9 87.1 100
Latvia 21.7 78.3 100 6.3 93.7 100
Lithuania 13.9 86.1 100 4.4 95.6 100
Luxembourg 6.9 93.1 100 5.5 94.5 100
Hungary 21.8 78.2 100 6.4 93.6 100
Malta 20.8 79.2 100 2.4 97.6 100
Netherlands 21.9 78.1 100 11.2 88.8 100
Austria 6.7 93.3 100 9.8 90.2 100
Poland 55.8 44.2 100 23.8 76.2 100
Portugal 48.2 51.8 100 19.0 81.0 100
Romania 24.1 75.9 100 2.0 98.0 100
Slovenia 64.2 35.8 100 14.5 85.5 100
Slovakia 31.2 68.8 100 4.4 95.6 100
Finland 30.4 69.6 100 14.3 85.7 100
Sweden 26.2 73.8 100 10.8 89.2 100
United Kingdom 11.0 89.0 100 3.9 96.1 100
Croatia 45.1 54.9 100 12.2 87.8 100
Turkey 55.3 i 44.7 i 100 i 12.1 i 87.9 i 100 i
Iceland 12.6 87.4 100 7.8 92.2 100
Norway 16.9 83.1 100 7.0 93.0 100
Switzerland 8.5 i 91.5 i 100 i 14.9 i 85.1 i 100 i
i Explanatory text:
Turkey – data source: national Labour Force Survey
Switzerland – data refers to quarter 2
Source: EU LFS

218 European Economic Statistics
4 Statistical annex
Table 4.56: Actual hours worked, annual
EU27
Total hours worked Average hours/ person
Levels growth Levels growth
2000 : : : :
2001 : : : :
2002 361,429,184 : 1,703 :
2003 360,894,173 -0.1 1,694 -0.5
2004 363,843,836 0.8 1,697 0.2
2005 366,932,297 0.8 1,695 -0.1
2006 372,223,170 1.4 1,693 -0.1
EU25
Total hours worked Average hours/ person
Levels growth Levels growth
2000 338,547,068 : 1,723 :
2001 339,808,210 0.4 1,711 -0.7
2002 338,232,470 -0.5 1,696 -0.9
2003 337,872,396 -0.1 1,688 -0.5
2004 340,810,388 0.9 1,690 0.1
2005 343,963,573 0.9 1,689 -0.1
2006 349,053,676 1.5 1,686 -0.1
Source: National accounts

219 European Economic Statistics
Statistical annex 4
Table 4.57: Usual weekly hours worked, 2007 (% total distribution)
EU27Full-time jobholders Part-time jobholders
males females total males females total
<7 hours 0.0 0.0 0.0 11.8 8.0 8.9
8-12 hours 0.0 0.0 0.0 15.6 13.6 14.0
13-17 hours 0.0 0.1 0.1 11.7 11.7 11.7
18-22 hours 0.4 1.3 0.7 24.6 27.4 26.8
23-27 hours 0.3 1.3 0.6 12.6 15.6 14.9
28-32 hours 1.1 3.5 2.0 19.3 20.2 20.0
33-37 hours 12.0 18.2 14.3 3.2 2.7 2.8
38-42 hours 57.6 60.0 58.5 0.9 0.6 0.7
43-47 hours 7.3 4.9 6.4 0.1 0.0 0.1
48-52 hours 11.2 6.4 9.4 0.1 0.1 0.1
53-57 hours 2.3 1.1 1.8 0.0 0.0 0.0
58-62 hours 4.6 1.8 3.6 0.0 0.0 0.0
63-67 hours 0.6 0.3 0.5 0.0 0.0 0.0
68-72 hours 1.6 0.7 1.2 0.0 0.0 0.0
>73 hours 1.0 0.5 0.8 0.0 0.0 0.0
Total 100 100 100 100 100 100
Source: EU LFS

220 European Economic Statistics
4 Statistical annex
Table 4.58: Unemployment rates, males plus females
2000 2005 2006 2007
European Union (27 countries) 8.7 8.9 8.1 7.1
Euro area 15 8.3 8.8 8.2 7.4
Euro area 13 8.3 8.9 8.2 7.4
Belgium 6.9 8.4 8.2 7.5
Bulgaria 16.4 10.1 9.0 6.9
Czech Republic 8.7 7.9 7.1 5.3
Denmark 4.3 4.8 3.9 3.7
Germany 7.5 10.7 9.8 8.4
Estonia 12.8 7.9 5.9 4.7
Ireland 4.2 4.3 4.4 4.5
Greece 11.2 9.8 8.9 8.3
Spain 11.1 9.2 8.5 8.3
France 9.0 9.2 9.2 8.3
Italy 10.1 7.7 6.8 6.1
Cyprus 4.9 5.2 4.6 3.9
Latvia 13.7 8.9 6.8 6.0
Lithuania 16.4 8.3 5.6 4.3
Luxembourg 2.3 4.5 4.7 4.7
Hungary 6.4 7.2 7.5 7.4
Malta 6.7 7.3 7.3 6.4
Netherlands 2.8 4.7 3.9 3.2
Austria 3.6 5.2 4.7 4.4
Poland 16.1 17.7 13.8 9.6
Portugal 3.9 7.6 7.7 8.0
Romania 7.2 7.2 7.3 6.4
Slovenia 6.7 6.5 6.0 4.8
Slovakia 18.8 16.3 13.4 11.1
Finland 9.8 8.4 7.7 6.9
Sweden 5.6 7.4 b 7.0 6.1
United Kingdom 5.4 4.8 5.4 5.3
Croatia : 12.6 11.1 9.1
Turkey 5.2 8.8 8.4 :
Norway 3.4 4.6 3.5 2.6
b Break in series
Source: EU LFS

221 European Economic Statistics
Statistical annex 4
Table 4.59: Unemployment rates, females
2000 2005 2006 2007
European Union (27 countries) 9.8 9.6 8.9 7.8
Euro area 15 10.0 9.9 9.3 8.4
Euro area 13 10.0 9.9 9.3 8.4
Belgium 8.5 9.5 9.3 8.4
Bulgaria 16.2 9.8 9.3 7.3
Czech Republic 10.3 9.8 8.8 6.7
Denmark 4.8 5.3 4.5 4.1
Germany 7.5 10.1 9.4 8.3
Estonia 11.8 7.1 5.6 3.9
Ireland 4.2 4.0 4.1 4.1
Greece 17.1 15.3 13.6 12.8
Spain 16.0 12.2 11.6 10.9
France 10.8 10.2 10.1 8.9
Italy 13.6 10.1 8.8 7.9
Cyprus 7.2 6.5 5.4 4.6
Latvia 12.9 8.7 6.2 5.6
Lithuania 14.1 8.3 5.4 4.3
Luxembourg 3.1 5.8 6.2 5.7
Hungary 5.6 7.4 7.8 7.7
Malta 7.4 9.0 8.9 7.6
Netherlands 3.6 5.1 4.4 3.6
Austria 4.3 5.5 5.2 5.0
Poland 18.1 19.1 14.9 10.3
Portugal 4.9 8.7 9.0 9.6
Romania 6.4 6.4 6.1 5.4
Slovenia 7.0 7.0 7.2 5.8
Slovakia 18.6 17.2 14.7 12.7
Finland 10.6 8.6 8.1 7.2
Sweden 5.3 7.4 b 7.2 6.4
United Kingdom 4.8 4.3 4.9 4.9
Croatia : 13.8 12.7 10.5
Turkey 5.1 8.5 8.4 :
Norway 3.2 4.4 3.4 2.5
b Break in series
Source: EU LFS

222 European Economic Statistics
4 Statistical annex
Table 4.60: Unemployment rates, males
2000 2005 2006 2007
European Union (27 countries) 7.8 8.3 7.6 6.6
Euro area 15 6.9 8.0 7.4 6.6
Euro area 13 6.9 8.0 7.4 6.6
Belgium 5.6 7.6 7.4 6.7
Bulgaria 16.7 10.3 8.6 6.5
Czech Republic 7.3 6.5 5.8 4.2
Denmark 3.9 4.4 3.3 3.4
Germany 7.5 11.2 10.2 8.5
Estonia 13.8 8.8 6.2 5.4
Ireland 4.3 4.6 4.6 4.7
Greece 7.4 6.1 5.6 5.2
Spain 7.9 7.0 6.3 6.4
France 7.5 8.4 8.4 7.8
Italy 7.8 6.2 5.4 4.9
Cyprus 3.2 4.3 4.0 3.4
Latvia 14.4 9.1 7.4 6.4
Lithuania 18.6 8.2 5.8 4.3
Luxembourg 1.8 3.5 3.5 4.0
Hungary 7.0 7.0 7.2 7.1
Malta 6.4 6.5 6.5 5.8
Netherlands 2.2 4.4 3.5 2.8
Austria 3.1 4.9 4.4 3.9
Poland 14.4 16.6 13.0 9.0
Portugal 3.1 6.7 6.5 6.6
Romania 7.8 7.8 8.2 7.2
Slovenia 6.5 6.1 4.9 4.0
Slovakia 18.9 15.5 12.3 9.9
Finland 9.1 8.2 7.4 6.5
Sweden 5.9 7.5 b 6.9 5.8
United Kingdom 5.9 5.2 5.7 5.6
Croatia : 11.6 9.8 7.9
Turkey 5.3 8.9 8.4 :
Norway 3.6 4.8 3.6 2.6
b Break in series
Source: EU LFS

223 European Economic Statistics
Statistical annex 4
Table 4.61: Unemployment rates, young persons (aged 15-24), males plus females
2000 2005 2006 2007
European Union (27 countries) 17.4 18.3 17.1 15.4
Euro area 15 15.8 17.2 16.1 14.8
Euro area 13 15.8 17.2 16.1 14.8
Belgium 16.7 21.5 20.5 18.8
Bulgaria 33.7 22.3 19.5 15.1
Czech Republic 17.8 19.2 17.5 10.7
Denmark 6.2 8.6 7.7 8.2
Germany (including ex-GDR from 1991) 7.5 13.9 12.5 11.2
Estonia 23.9 15.9 12.0 10.0
Ireland 6.8 8.6 8.6 8.7
Greece 29.1 26.0 25.2 22.9
Spain 24.3 19.7 17.9 18.2
France 19.6 21.0 22.1 19.4
Italy 27.0 24.0 21.6 20.3
Cyprus 10.1 13.0 10.5 9.8
Latvia 21.4 13.6 12.2 10.7
Lithuania 30.6 15.7 9.8 8.2
Luxembourg (Grand-Duché) 7.1 13.7 16.2 17.5
Hungary 12.4 19.4 19.1 18.0
Malta 13.7 16.4 16.3 13.1
Netherlands 5.7 8.2 6.6 5.9
Austria 5.3 10.3 9.1 8.6
Poland 35.1 36.9 29.8 21.7
Portugal 8.6 16.1 16.3 16.6
Romania 20.0 20.2 21.4 20.1
Slovenia 16.3 15.9 13.9 10.1
Slovakia 36.9 30.1 26.6 20.3
Finland 21.4 20.1 18.7 16.5
Sweden 10.5 21.7 b 21.5 19.1
United Kingdom 12.2 12.8 14.0 14.3
Croatia : 32.3 28.9 22.9
Turkey 10.5 16.8 16.0 :
Norway 9.9 11.6 8.8 7.3
b Break in series
Source: EU LFS

224 European Economic Statistics
4 Statistical annex
Table 4.62: Long-term unemployment rates, males plus females (% active population)
2000 2005 2006 2007
European Union (27 countries) 4.0 4.1 3.7 3.0
Euro area 15 3.9 3.9 3.7 3.2
Euro area 13 4.0 3.9 3.7 3.2
Belgium 3.7 4.4 4.2 3.8
Bulgaria 9.4 6.0 5.0 4.0
Czech Republic 4.2 4.2 3.9 2.8
Denmark 0.9 1.1 0.8 0.6
Germany 3.8 5.7 b 5.5 4.7
Estonia 5.9 4.2 2.8 2.3
Ireland 1.6 1.5 1.4 1.4
Greece 6.1 5.1 4.8 4.1
Spain 4.6 2.2 b 1.8 1.7
France 3.5 3.8 3.9 3.3
Italy 6.3 3.9 3.4 2.9
Cyprus 1.2 1.2 0.9 0.7
Latvia 7.9 4.1 2.5 1.6
Lithuania 8.0 4.3 2.5 1.4
Luxembourg 0.6 1.2 1.4 1.3
Hungary 3.1 3.2 3.4 3.4
Malta 4.4 3.4 2.9 2.6
Netherlands 0.8 1.9 1.7 1.3
Austria 1.0 1.3 1.3 1.2
Poland 7.4 10.2 7.8 4.9
Portugal 1.7 3.7 3.8 3.8
Romania 3.7 4.0 4.2 3.2
Slovenia 4.1 3.1 2.9 2.2
Slovakia 10.3 11.7 10.2 8.3
Finland 2.8 2.2 1.9 1.6
Sweden 1.4 1.4 b 1.1 0.8
United Kingdom 1.4 b 1.0 1.2 1.3
Croatia : 7.4 6.7 :
Turkey 1.1 i 3.5 i 2.5 :
Iceland : 0.3 0.2 0.2 p
Norway 0.3 0.9 0.8 0.5
b Break in series
p Provisional value
i Explanatory text:
Turkey – data source: national Labour Force Survey
Switzerland – data refers to quarter 2
Source: EU LFS

European Commission
European Economic Statistics
Luxembourg: Office for Official Publications of the European Communities
2008 — 224 pp. — 21 x 29.7 cm
ISBN 978-92-79-08886-5
Price (excluding VAT) in Luxembourg: EUR 20


How to obtain EU publicationsOur priced publications are available from EU Bookshop (http://bookshop.europa.eu), where you can place an order with the sales agent of your choice.
The Publications Office has a worldwide network of sales agents. You can obtain their contact details by sending a fax to (352) 29 29-42758.

KS
-30
-08
-4-E
N-
Price (excluding VAT) in Luxembourg: EUR 20
European Economic Statistics
This fl agship publication on European economic
statistics gives a wide-ranging overview of economic
developments over recent years in the European Union,
its Member States and selected partner countries. The
publication covers key economic indicators available
at Eurostat, including national accounts, government
fi nances, balance of payments, foreign trade, prices,
monetary and fi nancial accounts, and the labour market.
In addition, editorial and methodological sections
provide commentary on topical issues and on the data
presented. The statistical annex includes data covering
the above mentioned areas.
http://ec.europa.eu/eurostat
ISBN 978-92-79-08886-5
9 789279 088865
N1
0