Embed Size (px)
Citation preview
EuropeanJournalofChemistry2(1)(2011)36‐46
EuropeanJournalofChemistry
ISSN2153‐2249(Print)/ISSN2153‐2257(Online)2011EURJCHEMDOI:10.5155/eurjchem.2.1.36‐46.371
EuropeanJournalofChemistryJournalhomepage:www.eurjchem.com
Physico‐chemicalcharacterizationofsomebetablockersandanti‐diabeticdrugs‐potentiometricandspectrophotometricpKadeterminationindifferentco‐solvents
LakshmiNarasimham*andVasantDnyandeoBarhate
DepartmentofChemistry,VivekanandEducationSociety’sCollegeofArts,ScienceandCommerce,Chembur,Mumbai,IN‐400071,India
*Correspondingauthorat:DepartmentofChemistry,VivekanandEducationSociety’sCollegeofArts,ScienceandCommerce,Chembur,Mumbai,IN‐400071,India.Tel.:+91.9765800468;fax:+91.9823240411.E‐mailaddress: [email protected](L.Narasimham).
ARTICLEINFORMATION ABSTRACTReceived:14December2010Receivedinrevisedform:21January2011Accepted:21January2011Online:31March2011
KEYWORDS
Inthepresentstudywehavedeterminedthefundamentalphysico‐chemicalpropertiessuchas, ionization constant (pKa) and lipophilicity (log P) of some ‐blockers and anti‐diabeticdrugs. The apparent ionization constant (psKa) of selected drugs were determined usingpotentiometrictitrationinvariouscosolvent‐watermixtures(methanol,ethanol,acetonitrileanddioxane)atdifferenttemperatures(25to45°C)andionicstrengths(0.15to0.5M).Effectof temperature, ionic strength and dielectric constant on dissociation constant has beencompared.TheaqueouspKavalueswerethenobtainedbyYasuda‐Shedlovskyextrapolation.In the case of water‐soluble drugs (Amiloride hydrochloride, metoprolol tartrate andpropranololhydrochloride),theextrapolatedresultswereingoodagreementwiththatofpKavaluesmeasuredinaqueoussolutionsunderthesameexperimentalconditions,whileforthewater insolubledrugs (atenolol, amlodipinebesylate, gliclazide, glipizide, glibenclamideandpioglitazone),theextrapolatedresultswereingoodagreementwiththeliteraturevalues.Forfewof the selecteddrugs, thepsKawasdetermined spectrophotometrically and the resultswerecomparedwiththatofpotentiometryinvariouscosolventmixtures.ThemeasuredlogPvaluesofselecteddrugsshowedacceptablerangetothatofliteraturevalues.
pKaPotentiometryCo‐solventsLipophilicitySpectrophotometryHPLC
1.Introduction
Therearedifferentmethodsbywhichdissociationconstantofweakacidsandbasescanbedetermined.Thepotentiometricmethodsarewidelyused,sincetheyarefastandeasytostudyionic equilibria in aqueous and non‐aqueous solvents, whileothermethodssuchasspectrophotometricandconductometricarelaborious,timeconsumingbuttheyareveryaccurate[1‐3].
ThepKavalueisakeyparametertopredicttheionizationstateofamoleculewithrespecttopH.ThepKaofamoleculeisthepHatwhichthemoleculeis50%protonated.ThepKaofamolecule predicts the degree of ionisation the molecule willhaveataparticularpH.Sincemostofthedrugcompoundshaveacidic and/or basic functionalities, their ionization state iscontrolled by both solution pH and acidic dissociationconstants (i.e. pKa values). These different chemical species(cationic, neutral, or anionic) often have vastly differentproperties with respect to water solubility, volatility, UVabsorption,andreactivitywithchemicaloxidants.The ionizedform is usuallymorewater soluble,while the neutral form ismore lipophilic and has higher membrane permeability. Theextentofionizationisoneofseveralcardinalpropertiesusedtoestimate the absorption, distribution, metabolism andexcretion of compounds in biological systems and theenvironment.Fromdissociationconstants,themajorspeciesofpharmaceuticalspresentintheenvironment(usuallyinneutralpHrange)canbeestimated[4,5].
Knowledge of pKa values as a function of solventcomposition is useful in liquid chromatography (LC) or
capillary electrophoresis (CE) for the separation of ionizablecompounds. The chromatographic retention and electro‐phoreticbehaviorof ionizablecompoundsstronglydependonthe pKa of the compound and the mobile‐phase pH [6,7].Satisfactoryknowledgeoftheacid–basebehaviorofsubstancesin hydro‐organic media is therefore essential to optimizeanalytical procedures for the separation of ionizablecompounds by LC [8,9] and CE [10].Moreover, the acid–baseproperty of a drug molecule is the key parameter for drugdevelopment because it governs the solubility, absorption,distribution, metabolism and elimination, particularly fordeveloping new active pharmaceutical ingredients. Thetransportofdrugs intocellsandacrossothermembranes isafunctionofphysicochemicalproperties,pKaofthedrugs[11].
The ionization constant describes the proportion ofdifferent ionic species in which the substance is divided atdifferentpH.Theionicspeciesdifferinphysicalandbiologicalproperties [12]. The survey of literature shows that theionizationconstantdatainaqueousandnon‐aqueoussolventsatdifferent temperaturesarenot frequentlyavailable [13,14].The pKa values are dependent on temperature and solventconcentration and hence these results are very important inpharmaceuticalindustries,inspectroscopyandinbiology[15].
Remarkable developments have been observed in theautomationofstandardpKadeterminationmethodsusingbothpotentiometry (GLpKa) and spectroscopy (GLpKa + D‐PAS)[16,17]. Karl et al., [18] had developed a new method andinstrument (ProfilerSGA) to address the need for highthroughput measurements of pKa. Spectral gradient analysis
NarasimhamandBarhate/EuropeanJournalofChemistry2(1)(2011)36‐46 37
(SGA) is suitable for measurements of large number ofcompounds using small amounts of samples, a typicalrequirementofearlyphasedrugdiscovery.
Evaluation of aqueous dissociation constants is anunavoidable requirement in routine drug development.However,many drugs are sparingly soluble inwater and anyexperimentalpKadeterminationrequirestheuseofanorganicorhydroorganicsolvent.Themixed‐solventproceduremainlyusingmethanol–watermixturesprovidesagoodalternativeforsparingly soluble compounds [19‐21]. Here, the cosolventionization constants (psKa) in different ratios of methanol–watermixturesaremeasuredandtheaqueouspKaisobtainedbyextrapolation.Acriticalevaluationofdifferentextrapolationapproaches for compoundspoorly soluble inwater shouldbeveryusefulindrugscreeningtechnology.
To overcome the difficulty and improve the solubility ofdrug compounds, G. Volgyi et al. [22] have developed andvalidated a new single, multicomponent cosolvent mixtureconsisting of equal volumes of methanol, acetonitrile anddioxane for an efficient pKa measurement. However, none ofthese literature surveys have shown any systematic study oftemperature,ionicstrengthanddielectricconstanteffectonthedissociationconstantofdrugcompounds.
In this work, we performed a systematic validation toevaluate the pKa values to understand the effect of dielectricconstant in different co‐solvents (methanol, ethanol, 1,4‐dioxaneandacetonitrile),temperatureandionicstrengthusingsome of beta‐blockers and antidiabetic drug compounds. ThepKa of selected drugs were determined by potentiometrictitrationbetween6and60%ofselectedsolventsat25oCandin 0.15 M ionic strength using KCl. Temperature effect onselecteddrugs isstudiedbetween25oCand45oCwhile ionicstrength effect is studied between 0.15 M and 0.50 M.Spectrophotometric techniquewas also applied under similarconditionsonthosecompoundswhichhasapH‐dependentUVspectrum (amiloride hydrochloride, atenolol, propranololhydrochlorideandgliclazide).
Themain objective of our presentworkwas to study theeffectofco‐solventsatvarioustemperaturesandionicstrengthon some of beta blockers (amiloride, propranolol, atenolol,metoprololandamlodipine)andanti‐diabeticdrugs(gliclazide,glipizide and pioglitazone) and compare the extrapolateddissociation constants (pKa) resultswith those determined inaqueousmediumorwith literature values. The present studyalsoincludesthedeterminationofpartitionco‐efficient(logP)ofalltheselecteddrugs(exceptthatpioglitazonewasreplacedwithglibenclamide)inoctanol/watersystemofalltheselecteddrugs using automated potentiometric titrator (GLpKa) andcomparestheavailablepercentagespeciesatphysiologicalpH.This paper deals with the comparison of psKa of drugcompounds determined by pHmetry and spectrophotometrymethods.2.Experimental2.1.Instrumentation2.1.1.PotentiometricpKadetermination
GLpKa automated pKa analyser (Sirius AnalyticalInstruments Ltd., Forest Row, UK) fitted with combinationAg/AgCl pH electrode was used for determination ofdissociation constants. The pKa and psKa values werecalculated by RefinementProTM software (Sirius AnalyticalInstrumentsLtd.,ForestRow,UK).2.1.2.Electrodecalibration
Thefour‐plusparametertechnique[19,23,25]wasusedforelectrode calibration in both aqueousmedium and co solventmixtures.HClsolutionsofknownconcentration,containing6–60wt%selectedcosolvents‐watermixturesweretitratedwithstandardizedKOHatconstant ionicstrength(I=0.15MusingKCl)and temperature (25.0±0.5 °C),underargonatmosphere,from pH 1.8 to 12.0 without any sample present (“blank”titration). The operational pH reading was related to theconcentrationpcHvaluesbyamultiparametricequation.
pH P H H
OH (1)
The parameters are determined by a weighted nonlinear
least squares procedure. The intercept parameter ‘α’correspondsto‘–LogaH+’attheworkingtemperatureandionicstrength.ThejHtermcorrectspHreadingsforthenonlinearpHresponse due to liquid junction and asymmetry potentials inmoderately acidic solutions, while the jOH term corrects forhigh‐pH nonlinear effect. Factor ‘S’ accounts that a particularelectrode may not have 100% Nernstian slope, ‘Kw’ is theionisationconstantofwater.Thesevalueswereobtainedfromthree parallel “blank” titrations. The “goodness‐of‐fit” (GOF)valueoflessthan1.5wasobservedforalltheblanktitrations,indicating the statistical significance of the data. TheseparameterswereusedtocalculatethepKaandpsKavalues.2.2.Methods2.2.1.Reagents
The following drugs viz; amiloride hydrochloride (AML),propranolol hydrochloride (PRO), atenolol (ATN), metoprololtartrate (MT), amlodipine besylate (AB) belonging tobetablockersandgliclazide(GLC),pioglitazone(PGL),glipizide(GLZ), glibenclamide (GLB), belonging to anti‐diabetic drugswereselectedforthepresentinvestigation.PRO,ATN,MT,AB,and PGL were obtained from IPCA Laboratories Limited,Mumbai;AML,GLCandGLZwereobtainedasgiftsamplesfromBalPharmaLimited,Bangalore.GLBwasobtainedfromSigma.Allthedrugcompoundsusedwereofpharmaceuticalgrade.
Of the chemicals used for pKa determination, methanol,ethanol,1,4‐dioxaneandacetonitrilewereofHPLCgradefromMerck. Solutions and solvent mixtures were made up ofdistilledwater obtained fromMillipore,Milli‐Q (Bedford,MA,USA) purification system. Readymade 0.5 M solutions ofpotassium hydroxide and hydrochloric acid were obtainedfrom Merck. Potassium hydroxide is standardized againstprimary standard using potassium hydrogen phthalate.Potassium hydrogen phthalate is purchased from Sigma. Di‐potassiumhydrogenphosphateandpotassiumchloridewereofanalytical grade from Sigma. Standards for HPLC log PmeasurementswereprocuredfromSigma.
2.2.2.Preparationofco‐solventmixtures
For psKa determination of selected drugs, a 80% (v/v)methanol, 60% (v/v) ethanol, 1,4‐dioxane and 50% (v/v) ofacetonitrilein0.15MKCladjustedwaterispreparedandusedthroughoutourinvestigation.2.2.3.Titrationinaqueousmedium
For bases, in each experiment, about 2 mg of sample,containing 10 mL of 0.15 M ionic strength water, was preacidifiedtopH1.8–2.0with0.5MHClandthentitratedwith0.5MKOHtoanappropriatelyhighpH,usually12. In thecaseofacids, the titration was performed in the opposite direction.

38 NarasimhamandBarhate/EuropeanJournalofChemistry2(1)(2011)36‐46The titrations were performed at 25.0 ± 0.5 °C, under argonatmosphere,atI=0.15MionicstrengthusingKCl.Aminimumof threeparallelmeasurementswere carriedout and thepKavalues of samples were calculated using RefinementProTMsoftware.2.2.4.Titrationincosolvent–watermixtures
About2mgeachofselecteddrugcompound,containing6‐10mLof0.15Msemi‐aqueoussolutions,wastitratedunderthesame conditions as in aqueous titration (Section 2.2.3) but inthe presence of co‐solvents containing 6 and 60 wt% ofmethanol, ethanol, acetonitrile and 1,4‐dioxane. Each samplewas measured in all the four selected co‐solvents inde‐pendently.Ateachselectedco‐solventmixture,measurementswerecarriedout inat least inthreedifferentwt%atconstantionicstrength(I=0.15MusingKCl)andtemperature(25.0±0.5°C) under argon atmosphere. The effect of ionic strength (I =0.15M, 0.3 M and 0.5 M using KCl) at constant temperature(25.0±0.5°C)andtheeffectoftemperature(25,35and45°C)atconstantionicstrength(I=0.15MKCl)usingmethanolascosolvent were carried out under argon atmosphere. Theapparentionizationconstantsinthemixedsolvent(psKa)werecalculated from the difference (Bjerrum) plot. The resultsobtainedthroughthisdifferenceplotisoftenfoundsuitablefordetecting small errors in titration such as acidity error,concentrationerrorandcorrectionstotheseerrorshasbecomenecessarytoachievethebestfit.DifferenceplotsallowthepKavalues of monoprotic and multiprotic weak acids to bedeterminedrapidlyandwithgoodprecision[24‐25].Toobtainthe best aqueous pKa value from psKa data the Yasuda‐Shedlovsky (YS) procedure was applied to estimate theaqueouspKavalue.Thefollowingequationhasbeenadopted.
p a log H2O (2)
where log[H2O] is themolarwaterconcentrationof thegivensolventmixture,‘ε’isthedielectricconstantofthemixtureand‘a’and‘b’aretheslopeandintercept,respectively.Thismethodis the most widely used procedure in co‐solvent techniques[20,21].2.2.5.UV‐pHtitrationinaqueousmediumandinco‐solvent–watermixtures
The UV/pH titrations were performed using D‐PAStechnique(SiriusAnalytical InstrumentsLtd.,ForestRow,UK)attached to a GLpKa [26]. The pKa and psKa values werecalculated using RefinementProTM software. Spectrophoto‐metric method can only be applied, for pKa/psKa measure‐ment, to those compoundswhichhas a chromophore at closeproximity of the ionization centre. Thiswould help to have asufficient change in absorbanceas a functionofpH.Of all theselecteddrugsinthepresentinvestigation,onlyAML,PRO,GLCand ATN is found to have chromophores in which ionisationgroups were part of the conjugation and produced enoughchangesintheabsorbancewithchangeinthepH.
Ineachexperiment,a10.0mMstocksolutionofthesamplewaspreparedinDMSO.50µLaliquotofthestocksolutionwasthendilutedto10mLwith0.15MKClsolutioncontaining0.25mLofphosphatebuffer(di‐potassiumhydrogenphosphate)toproducetherequiredsampleconcentration.Blankspectraarecollectedfromreferencevialwithoutsamplebutwith50µLofDMSO. For bases, in each experiment, the pH of the samplesolution was adjusted to pH=2 using 0.5 M HCl and thentitratedwith0.5MKOHtopH=12.Foracids,titrationisstartedfromhightolowpH.Spectraldatawererecordedintheregionof200–700nmaftereachpHmeasurement.Allmeasurementswereperformed inall the fourselectedco‐solventsat least inthreedifferentwt%,atconstantionicstrength(I=0.15MKCl)
andtemperature(25.0±0.5oC)underargonatmosphere.Threeparallel measurements were carried out. Sample concent‐rations of 5–100 µMwere used for UV/pH titration. The pKavalues of samples were calculated by Target Factor Analysis[27].2.2.6. Potentiometric log P determination (octanol/watersystem)
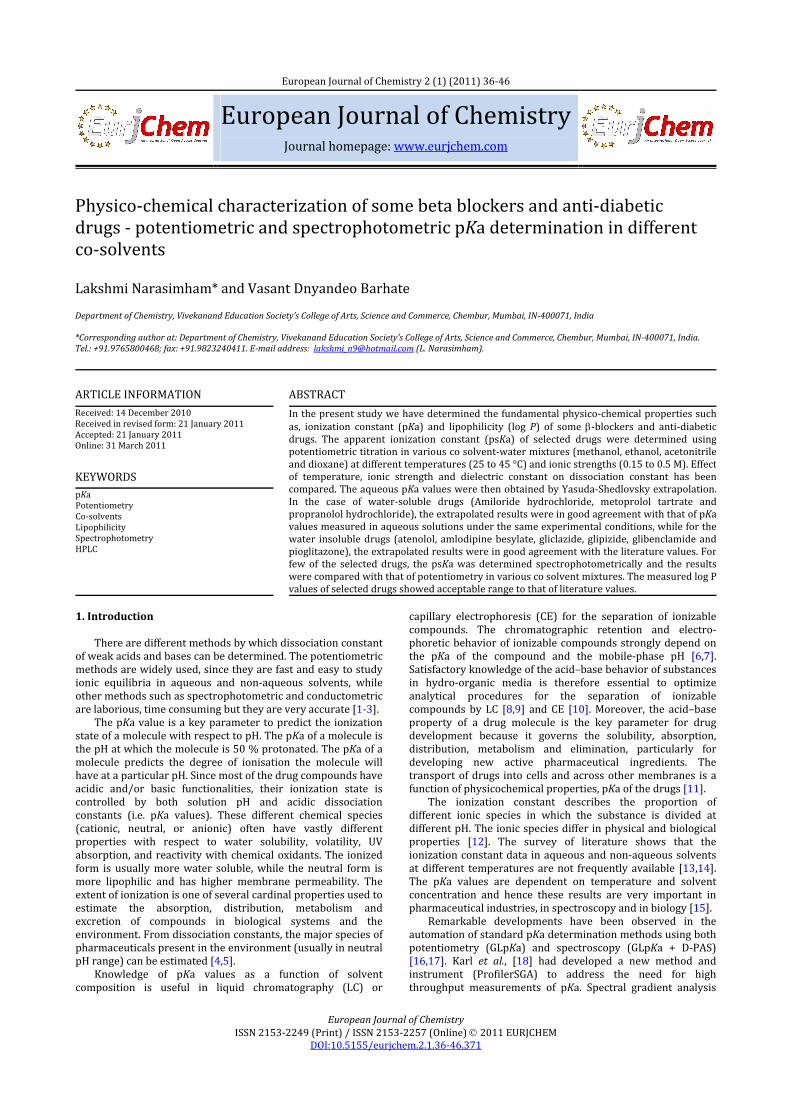
The logarithm of octanol/water partition coefficient (logPoct)wasdeterminedbythedual‐phasepotentiometrictitration[28,29]. Log P (partition coefficient) is a measure of thelipophilicity of a compound. A blank acid‐base titration iscompared to a titration in the presence of the compound. AdifferencecurveisproducedfromthevolumeofKOHrequiredto reach a given pH with and without the compound. Thedifference curve is converted to a Bjerrumplot. The axes arereversedandthevolumedifferenceisconvertedtotheaveragenumber of bound protons per molecule (½Á) (Figure 1).Titrations are then performed in the presence of varyingamounts of partition solvent, octanol. From the octanol‐containing titrations theapparent ionizationconstants (poKa)and then the log P values were estimated and refined by aweighted non‐linear least squares procedure where the pKavalueswereusedasunrefinedcontributions.
(a)
(b)
(c) (d)
Figure 1. Graphs showing (a) blank titration curve, (b) with sample, (c)volumedifferencecurveand(d)Bjerrumplot.
About1‐2mgof samplehaving10mLof0.15MKClwastitrated under the same conditions as in pKa determinationsbut in the presence of a partitioning solvent,water‐saturatedoctanol. Each sample was analysed in triplicate, with threetitrations in each experiment (beaker). Solid sample wasweighed into each beaker and specified volume of octanol(Table1) is addedmanually at thebeginningof first titrationandsonicatedfor30to45minutesforitsdissolution.Titrationis then carried out as per Section 2.2.3. In second and thirdtitration, octanol was added automatically by the instrumentthroughthedispenser.Thetotalvolumeofthebeakerisalwaysmaintainedlessthan15mL(workingcapacityofeachtitrationvessel).2.2.7.HPLClogPdetermination
The distribution coefficient (log D) is determined bycorrelation of the HPLC retention time of compound underinvestigation to a calibration curve calculated by linearregressionoftheretentiontimesoftheknownlogDvaluesatpH=7.4 of selected substances. Calibration of the system iscarriedoutby injectingdilute solutions of amixture of sevenaccurately known logP ”standards” ofmixed hydrogen‐bond‐donorand‐acceptorstrengths.Thecompoundsused, together

NarasimhamandBarhate/EuropeanJournalofChemistry2(1)(2011)36‐46 39
with their corresponding log P values in parentheses, areN‐methyl aniline (1.66), sulphinide (2.07), labetolol (2.65),4‐iodophenol(2.91),diltiazem(3.38),triphenylene(4.37),andchloropromazine(5.35).
Table1.Differentoctanol‐waterphaseratioforlogPexperimentaldesign.
Beaker
Octanolvolume(firstadditionisalwaysmanual
inadvanceandsonicatefor30to45minutes)
Aqueousvolume(mL)
1stBeaker 0.5 1.0 3.5 102ndbeaker 0.25 0.25 0.25 103rdBeaker 0.5 0.5 1.0 10
A Serveyor HPLC system (Thermo Fisher, USA) equippedwith quaternary gradient pump, auto sampler, column ovenand photodiode array detector (PDA) was employed foranalysis. Chromatographic data was acquired usingChromQuest4.2software.
An X‐Terra C18, 100×2.1mm, 5 µm columnwas used forseparation. Themobile phase consisting of A: buffer (10mMammonium acetate pH=7.4 adjusted with ammoniumhydroxide) and B: a mixture of 90% acetonitrile and 10%buffer with a timed gradient programme was used. Thegradientconditionofthemobilephasewas:0min4%solventB,16.0min90%solventB,18.2min90%solventB,18.9min4% solvent B and 25min 4% solvent B. The flow rate of themobile phasewas0.5mL/minwithdetection at 220nm.Thecolumntemperaturewaskeptat37°Candtheinjectionvolumewas10µL.
ThismethodisappliedforthelogPdeterminationofalltheselecteddrugsbyHPLC.Sixreplicateinjectionsweremadeforstandardandsampleswereinjectedinduplicate.3.Resultsanddiscussion3.1.Dissociationconstant3.1.1.Potentiometry
The selected compounds (Figure 2) in the presentinvestigation differ in acid–base properties representing avariety of proton‐binding sites in both the type and thestrength. There are monovalent bases (all beta‐blockers andPGL) with guanidine (AML), isopropyl amine (PRO, ATN andMT),primaryamine(AB)andpyridinenitrogenatom(s)(PGL).Compounds GLC and GLZ are acids due to the ‘NH group ofsulfonylurea.
Generally,potentiometryinaqueousmediumisthemethodof choice for the pKa determination for molecules havingsolubility higher than 0.8mM concentration in thewhole pHintervalof the titration.Outofall selectedcompounds,only3compoundswhose pKa values could bemeasured in aqueousmedium either by potentiometry (PRO and MT) orspectrophotometric titration (AML). These molecules areconsidered “water‐soluble” and its results are utilised toevaluate the accuracy of the results obtained in various cosolventsbyextrapolationmethod.
Allothercompoundsselectedinthisstudydidnotfulfilthesolubilitycriterion(lessthan0.8µM)andhence, theapparentdissociationconstants,psKavaluesweremeasuredindifferentmethanol–water, ethanol‐water, acetonitrile‐water and 1,4‐dioxane‐water mixtures and the corresponding extrapolatedpKa value were obtained by Yasuda‐Shedlovsky (YS)extrapolation to zero co‐solvent content. The average psKavaluesandthestandarddeviationswerecalculatedfromthreeparalleltitrationsateachR‐value.
Theionizationabilityofthemoleculesischaracterizedherebythedissociationconstant(pKa)measuredbypotentiometricand spectrophotometric techniques in different co‐solvents ‐
water mixtures. The obtained results show the goodreproducibilityofpotentiometric and spectrophotometricpKadetermination in all the selected co solvent‐water mixtures.The standard deviation values varied between 0.01 and 0.15.From the measured psKa values the aqueous pKa can beobtained by extrapolation. In order to select the bestextrapolationprocedureindifferentcosolvents,wecomparedthe Yasuda–Shedlovsky (YS) linear relationships using Eq. 2.Results indicate that this method provide appropriate pKavalues in the cases of both potentiometric and UV/pHtechniques. Table 3 summarizes the different solvent weightpercent range used for the titration, dielectric constant (ε),regression coefficient (R2), the number of titrations (n),extrapolatedaqueouspKavaluesandthemethodoftitration.
Figure2.(a)Amiloridehydrochloride(AML);(b)propranololhydrochloride(PRO); (c) atenolol (ATN); (d) metoprolol tartrate (MT); (e) amlodipinebesylate(AB);(f)gliclazide(GLC);(g)pioglitazone(PGL);(h)glipizide(GLZ)and(i)glibenclamide(GLB).
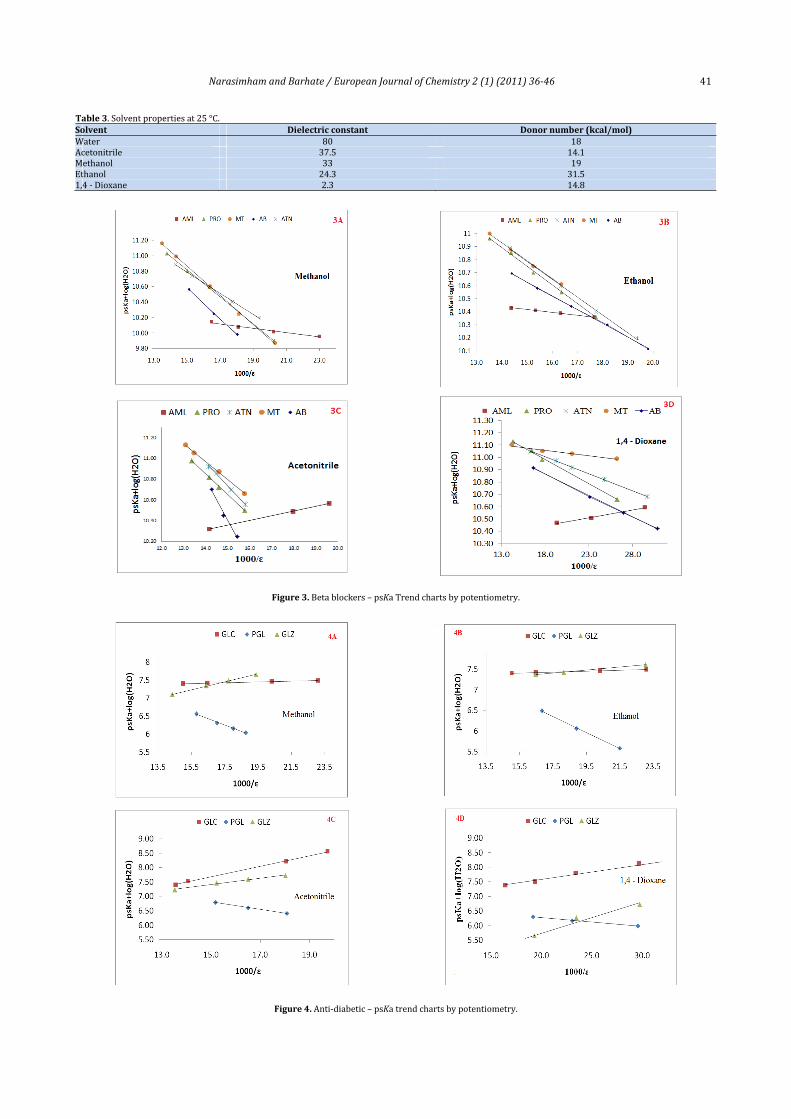
Figure 3 and 4 represents the Yasuda‐Shedlovsky trendcharts forbetablockersandanti‐diabeticcompoundsselectedin this study. It canbe seen thatbasic functional groupshavenegativeslopesandproducestraightlinesinthetotalinterval.The acids have positive slopes. The linearity of the plots ischaracterized by the regression coefficients values whichindicate significant linear correlation for the moleculesexamined.TheaverageoftheR2valuesis0.9945.
The pKa results in Table 2 allow interpretation of thestructure–property relationships (SPR) between the basicityandthechemicalstructureofthemolecules.IncompoundAML,thecentralelementofthestructureisaguanidine,theNatomofwhichistheproton‐bindingsitewhichisanintegralpartoftheconjugateddoublebond,whileincompoundsPRO,ATNandMT,theNatomofisopropylaminogroupistheproton‐bindingsite which is not a part of conjugation. Isopropyl groupincreases electron density on N atom due to +I (inductive)effectandhenceimpartsthebasicity.Incaseofcompounds‘AB’and ‘PIO’, primary amine and pyridine group, respectively,makesthemoleculecomparativelyweakbase.

40 NarasimhamandBarhate/EuropeanJournalofChemistry2(1)(2011)36‐46
Table2.pKavaluesbyYasuda‐Shedlovskyextrapolationindifferentco‐solvents.
Compound Co‐solvent Wt% εpsKa+log[H2O]=a/ε+b R2 n pKa±S.D.(YS) Literature
valuesaMethod
a b
Amiloridehydrochloride
Methanol20‐50 56‐70 ‐20.7 10.7 0.9989 4 8.72±0.05
8.7±0.1
Potentiometric20‐50 56‐70 ‐61.1 11.4 0.9883 4 8.82±0.02 Spectrophotometry
Ethanol30‐60 43‐60 ‐25.8 10.5 0.9797 4 8.47± 0.05 Potentiometric30‐60 43‐60 ‐21.1 10.6 0.9836 4 8.55±0.01 Spectrophotometry
Acetonitrile20‐60 51‐70 41.9 9.7 0.9999 3 8.51±0.07 Potentiometric10‐60 51‐74 69.2 9.4 0.9835 4 8.55±0.03 Spectrophotometry
1,4‐Dioxane30‐50 34‐52 10.2 10.2 0.9880 3 8.64±0.02 Potentiometric10‐50 34‐70 19.3 10.2 0.9920 4 8.70±0.03 Spectrophotometry
3 8.71±0.004 UV‐pH(aqueous)
Proopranololhydrochloride
Methanol10‐50 56‐74 ‐146.3 12.9 0.9982 5 9.31±0.05
9.53±0.1
Potentiometric10‐48 57‐74 ‐188.1 13.6 0.9919 5 9.41±0.03 Spectrophotometry
Ethanol10‐50 49‐73 ‐179.9 13.5 0.9985 5 9.45±0.08 Potentiometric10‐60 43‐72 ‐115.4 12.5 0.9999 3 9.28±0.20 Spectrophotometry
Acetonitrile10‐35 63‐75 ‐223.7 14.0 0.9993 4 9.42±0.03 Potentiometric10‐49 55‐74 ‐107.1 12.4 0.9960 3 9.26±0.12 Spectrophotometry
1,4‐Dioxane10‐45 38‐70 ‐41.1 11.7 0.9968 4 9.44±0.04 Potentiometric10‐60 25‐69 ‐12.7 11.2 0.9891 5 9.30±0.03 Spectrophotometry
3 9.46±0.02 pHmetry‐ aqueous
Atenolol
Methanol20‐60 52‐70 ‐138.6 12.9 0.9990 5 9.37±0.04
9.48±0.1
Potentiometric20‐60 52‐70 ‐184.8 13.6 0.9970 5 9.51±0.07 Spectrophotometry
Ethanol20‐43 53‐67 ‐207.1 14.0 0.9996 5 9.63±0.06 Potentiometric10‐49 50‐73 ‐114.4 12.6 0.9808 4 9.41±0.05 Spectrophotometry
Acetonitrile20‐35 63‐71 ‐222.5 14.1 0.9948 4 9.50±0.03 Potentiometric10‐60 51‐75 ‐57.7 12.0 0.9745 4 9.52±0.03 Spectrophotometry
1,4‐Dioxane20‐50 34‐61 ‐30.3 11.6 0.9996 5 9.43±0.04 Potentiometric10‐60 26‐70 ‐13.3 11.4 0.9815 5 9.53±0.02 Spectrophotometry
Metoprololtartrate
Methanol 10‐40 61‐74 ‐163.2 13.2 0.9986 4 9.35±0.04
9.51±0.1
PotentiometricEthanol 7‐50 49‐74 ‐183.7 13.6 0.9994 5 9.53±0.09 Potentiometric
Acetonitrile 6‐35 63‐76 ‐216.6 13.9 0.9989 4 9.43±0.01 Potentiometric1,4‐Dioxane 10‐45 38‐70 ‐7.7 11.2 0.9637 4 9.36±0.01 Potentiometric
3 9.51±0.02 pHmetry‐ aqueous
Amlodipinebesylate
Methanol 21‐62 50‐70 ‐108.7 12.3 0.9993 5 9.13±0.02
9.2±0.2
PotentiometricEthanol 21‐39 55‐66 ‐199.4 13.6 0.9988 3 9.29±0.03 Potentiometric
Acetonitrile 21‐31 65‐70 ‐387.7 16.2 0.9914 3 9.48±0.01 Potentiometric1,4‐Dioxane 21‐51 32‐60 ‐34.6 11.5 0.9993 4 9.30±0.03 Potentiometric
Pioglitazone
Methanol 37‐59 53‐63 ‐174.7 9.3 0.9981 4 5.37±0.04
5.59±0.2
PotentiometricEthanol 34‐56 46‐59 ‐192.1 9.7 0.9989 3 5.56±0.05 Potentiometric
Acetonitrile 31‐52 55‐66 ‐131.0 8.8 0.9949 3 5.38±0.04 Potentiometric1,4‐Dioxane 30‐50 34‐52 ‐19.4 6.6 0.9971 3 4.74±0.06 Potentiometric
Gliclazide
Methanol20‐60 52‐70 25.8 7.0 0.9996 4 5.58±0.01
5.54±0.2
Potentiometric10‐53 56‐75 32.8 7.0 0.9909 5 5.63±0.01 Spectrophotometry
Ethanol20‐60 43‐67 11.8 7.2 0.9996 4 5.63±0.01 Potentiometric10‐53 48‐73 28.3 7.1 0.9997 3 5.70±0.01 Spectrophotometry
Acetonitrile11‐60 51‐74 177.8 5.0 0.9980 4 5.58±0.06 Potentiometric21‐53 54‐70 111.3 6.0 0.9728 3 5.64±0.08 Spectrophotometry
1,4‐Dioxane20‐60 25‐61 50.6 6.6 0.9882 5 5.48±0.05 Potentiometric10‐52 32‐70 69.9 6.4 0.9956 5 5.58±0.07 Spectrophotometry
Glipizide
Methanol 20‐60 52‐70 110.2 5.5 0.9985 4 5.19±0.01
5.16±0.3
PotentiometricEthanol 30‐60 43‐60 36.3 6.8 0.9961 3 5.49±0.05 Potentiometric
Acetonitrile 12‐50 55‐74 110.0 5.7 0.9853 4 5.42±0.03 Potentiometric1,4‐Dioxane 27‐50 34‐55 94.3 5.4 0.9988 4 4.89±0.15 Potentiometric
aRef[30]. IncaseofGLCandGLZ,theionisable‘‐NH’ofsulfonylurea
moiety makes the molecule acidic due to – E (electron withdrawing) effect of sulfonyl group attached to ‘‐NH’ of ureagroup.
A donor number or DN is a qualitativemeasure of Lewisbasicity. A donor number is defined as the negative enthalpyvalue for the1:1 adduct formationbetweenaLewisbase andthestandardLewisacid.Theunitsarekilocaloriespermoleforhistoricalreasons[31].Thedonornumberisameasureoftheability of a solvent to solvate cations and Lewis acids. Themethod was developed by V. Gutmann [32]. Likewise Lewisacidsarecharacterizedbyacceptornumbers.
Thedielectricconstantsofalltheselectedcosolventsinthepresent study are lower than that ofwater,which affects theionizationequilibria.Asolventwillbemore likely topromoteionization of a dissolved acidic molecule in the followingcircumstances[33].
Aproticsolventcanformhydrogenbondsandwillpromoteionisation.
AsolventwithahighdonornumberisastrongLewisbase. A solvent with a high dielectric constant will promote
ionisation.For a given acid, pKa values will vary depending on the
solvent. The degree of dissociation of an acid increases withincreaseof solventbasicity.On theotherhand,dissociation isrelatively less for solvents having low dielectric constant. Co‐solventpropertiesused inthepresentstudiesareprovidedinTable3.
Itcanbeseenfromthetablethatmethanolandethanol ismore basic than water, but its dielectric constant is less.Acetonitrile is lessbasic thanwater,methanolor ethanol, butitsdielectricconstantismorethanmethanolorethanol.Hence,in general, acids are weaker and bases are stronger in thissolvent.
NarasimhamandBarhate/EuropeanJournalofChemistry2(1)(2011)36‐46 41
Table3.Solventpropertiesat25°C.Solvent Dielectricconstant Donornumber(kcal/mol)Water 80 18Acetonitrile 37.5 14.1Methanol 33 19Ethanol 24.3 31.51,4‐Dioxane 2.3 14.8
Figure3.Betablockers–psKaTrendchartsbypotentiometry.
Figure4.Anti‐diabetic–psKatrendchartsbypotentiometry.

42 NarasimhamandBarhate/EuropeanJournalofChemistry2(1)(2011)36‐46
Table4.EffectoftemperatureonthepsKavalues.
Therapeuticalclass Compound Co‐solvent Wt%psKa
I(M) Method25°C 35°C 45°C
Betablockers
AML
Methanol 40
8.91 8.74 8.57
0.15
PotentiometricPRO 9.04 8.88 8.73 PotentiometricATN 9.13 8.84 8.57 PotentiometricMT 9.10 8.88 8.68 PotentiometricAB 8.99 8.73 8.50 Potentiometric
Anti‐diabeticsGLC 5.94 5.86 5.81 PotentiometricPIO 5.01 4.86 4.67 PotentiometricGLZ 5.86 5.81 5.76 Potentiometric
Table5.EffectofionicstrengthonthepsKavalues.
Therapeuticalclass Compound Co‐solvent Wt%psKa
Temp°C Method0.15M 0.3M 0.5M
Betablockers
AML
Methanol 40
8.91 8.96 9.01
25
PotentiometricPRO 9.04 9.08 9.15 PotentiometricATN 9.13 9.18 9.25 PotentiometricMT 9.10 9.12 9.15 PotentiometricAB 8.99 9.04 9.09 Potentiometric
Anti‐diabeticsGLC 5.94 5.96 5.98 PotentiometricPIO 5.01 5.06 5.14 PotentiometricGLZ 5.86 5.90 5.94 Potentiometric
Figure5.Effectoftemperatureonionizationconstant.
Figure6.EffectofIonicstrengthonionizationconstant.
Figure 5 and 6 represent the psKa value trend charts ofselected compounds due to temperature and ionic strengtheffect, respectively. It is evident from these trend charts thatthe dissociation constants of all the drugs decreased withincreasing temperature, while same compounds showedincreasingtrendwithincreasingionicstrength.Thisisingoodagreement with the literature findings. The results arepresentedinTable4and5.
Analysis of the slope of YS equations allows us to have abetterinsightintothesolvationeffectofthedifferentcosolventmixtures upon the ionization of different functional groups.This canbebetter explained in caseofAML,where it beingabase, positive slope was observed for both acetonitrile and
dioxanesolvent.Thishasbeenvalidatedbybothpotentiometryand spectrophotometry methods. Comparatively, significantlower slope values in 1,4‐dioxane in almost all the selectedcompounds, with the exception of GLZ, indicate higher ionicdiameters of the solvated molecules in the four‐componentsolventsystem.Insolventshavinglowdielectricconstant,ionstendtoassociate,whichcomplicatestheinterpretationofpKas.In particular, in aprotic solvents the process of homo‐conjugationoccurswhentheconjugatebaseformsahydrogenbond with the parent acid [34].The slope values of all thecompoundsindifferentcosolventschoseninthepresentstudyhavingthesameionisationgroupsarepresentedinTable6.
NarasimhamandBarhate/EuropeanJournalofChemistry2(1)(2011)36‐46 43
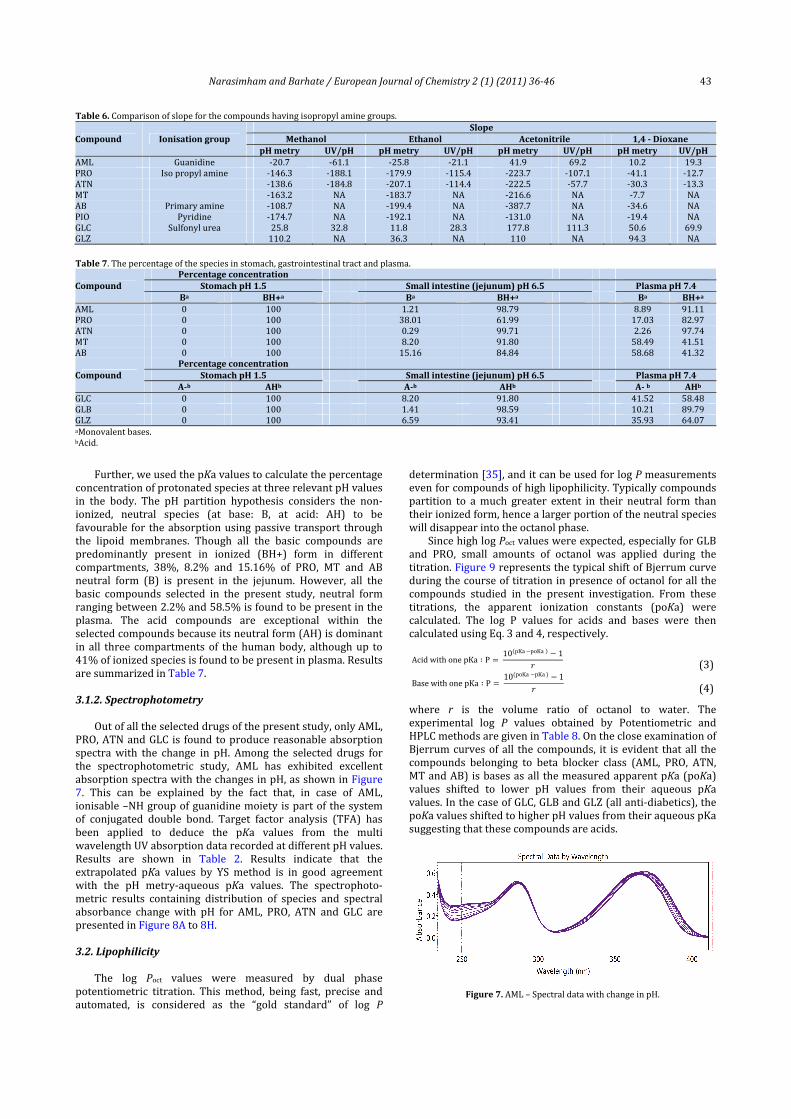
Table6.Comparisonofslopeforthecompoundshavingisopropylaminegroups.
Compound IonisationgroupSlope
Methanol Ethanol Acetonitrile 1,4‐DioxanepHmetry UV/pH pHmetry UV/pH pHmetry UV/pH pHmetry UV/pH
AML Guanidine ‐20.7 ‐61.1 ‐25.8 ‐21.1 41.9 69.2 10.2 19.3PRO Isopropylamine ‐146.3 ‐188.1 ‐179.9 ‐115.4 ‐223.7 ‐107.1 ‐41.1 ‐12.7ATN ‐138.6 ‐184.8 ‐207.1 ‐114.4 ‐222.5 ‐57.7 ‐30.3 ‐13.3MT ‐163.2 NA ‐183.7 NA ‐216.6 NA ‐7.7 NAAB Primaryamine ‐108.7 NA ‐199.4 NA ‐387.7 NA ‐34.6 NAPIO Pyridine ‐174.7 NA ‐192.1 NA ‐131.0 NA ‐19.4 NAGLC Sulfonylurea 25.8 32.8 11.8 28.3 177.8 111.3 50.6 69.9GLZ 110.2 NA 36.3 NA 110 NA 94.3 NATable7.Thepercentageofthespeciesinstomach,gastrointestinaltractandplasma.
CompoundPercentageconcentration
StomachpH1.5 Smallintestine(jejunum)pH6.5 PlasmapH7.4Ba BH+a Ba BH+a Ba BH+a
AML 0 100 1.21 98.79 8.89 91.11PRO 0 100 38.01 61.99 17.03 82.97ATN 0 100 0.29 99.71 2.26 97.74MT 0 100 8.20 91.80 58.49 41.51AB 0 100 15.16 84.84 58.68 41.32
CompoundPercentageconcentration
StomachpH1.5 Smallintestine(jejunum)pH6.5 PlasmapH7.4A‐b AHb A‐b AHb A‐b AHb
GLC 0 100 8.20 91.80 41.52 58.48GLB 0 100 1.41 98.59 10.21 89.79GLZ 0 100 6.59 93.41 35.93 64.07aMonovalentbases.bAcid.
Further,weusedthepKavaluestocalculatethepercentage
concentrationofprotonatedspeciesatthreerelevantpHvaluesin the body. The pH partition hypothesis considers the non‐ionized, neutral species (at base: B, at acid: AH) to befavourable for theabsorptionusingpassive transport throughthe lipoid membranes. Though all the basic compounds arepredominantly present in ionized (BH+) form in differentcompartments, 38%, 8.2% and 15.16% of PRO, MT and ABneutral form (B) is present in the jejunum. However, all thebasic compounds selected in the present study, neutral formrangingbetween2.2%and58.5%isfoundtobepresentintheplasma. The acid compounds are exceptional within theselectedcompoundsbecauseitsneutralform(AH)isdominantin all three compartmentsof thehumanbody, althoughup to41%ofionizedspeciesisfoundtobepresentinplasma.ResultsaresummarizedinTable7.3.1.2.Spectrophotometry
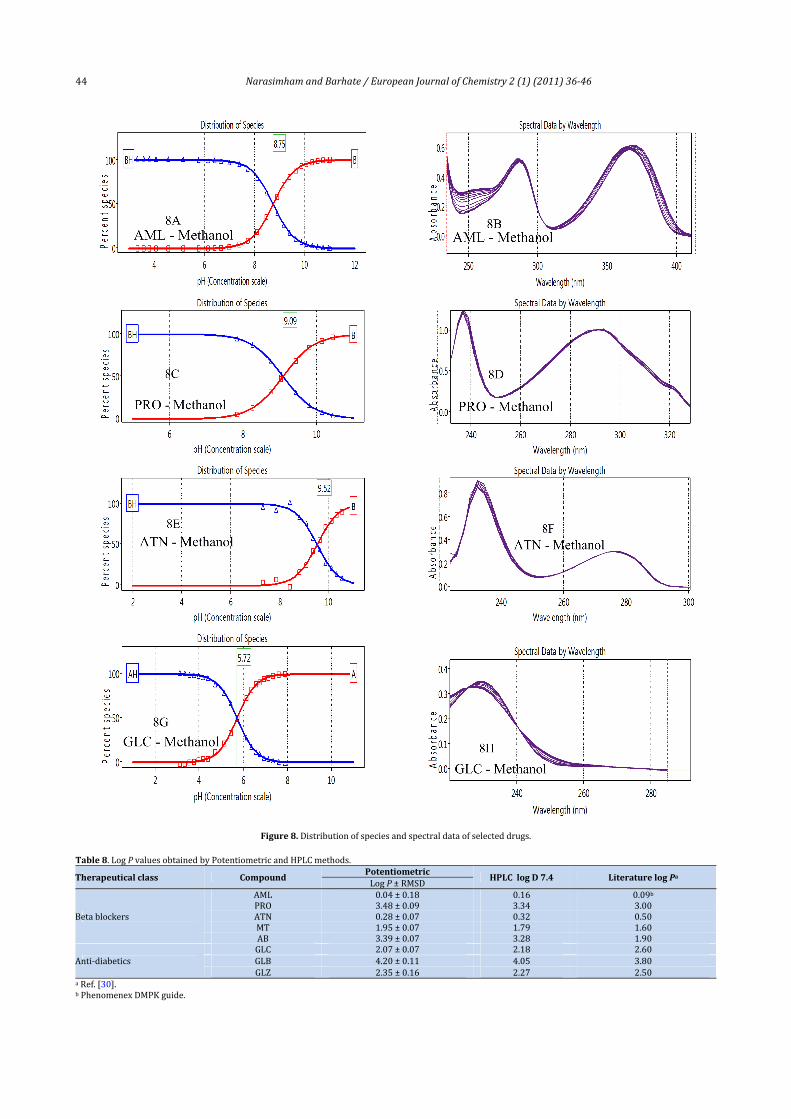
Outofalltheselecteddrugsofthepresentstudy,onlyAML,PRO,ATNandGLC is foundtoproducereasonableabsorptionspectrawith the change in pH. Among the selected drugs forthe spectrophotometric study, AML has exhibited excellentabsorptionspectrawiththechangesinpH,asshowninFigure7. This can be explained by the fact that, in case of AML,ionisable–NHgroupofguanidinemoietyispartofthesystemof conjugated double bond. Target factor analysis (TFA) hasbeen applied to deduce the pKa values from the multiwavelengthUVabsorptiondatarecordedatdifferentpHvalues.Results are shown in Table 2. Results indicate that theextrapolated pKa values by YS method is in good agreementwith the pH metry‐aqueous pKa values. The spectrophoto‐metric results containing distribution of species and spectralabsorbance change with pH for AML, PRO, ATN and GLC arepresentedinFigure8Ato8H.3.2.Lipophilicity
The log Poct values were measured by dual phasepotentiometric titration. This method, being fast, precise andautomated, is considered as the “gold standard” of log P
determination[35],anditcanbeusedforlogPmeasurementsevenforcompoundsofhighlipophilicity.Typicallycompoundspartition to amuch greater extent in their neutral form thantheirionizedform,hencealargerportionoftheneutralspecieswilldisappearintotheoctanolphase.
SincehighlogPoctvalueswereexpected,especiallyforGLBand PRO, small amounts of octanol was applied during thetitration.Figure9representsthetypicalshiftofBjerrumcurveduringthecourseoftitrationinpresenceofoctanolforallthecompounds studied in the present investigation. From thesetitrations, the apparent ionization constants (poKa) werecalculated. The log P values for acids and bases were thencalculatedusingEq.3and4,respectively.
Acid with one pKa ∶ P10 pKa poKa 1 (3)
Base with one pKa ∶ P10 poKa pKa 1 (4)
where r is the volume ratio of octanol to water. Theexperimental log P values obtained by Potentiometric andHPLCmethodsaregiveninTable8.OnthecloseexaminationofBjerrumcurvesofall thecompounds, it isevident thatall thecompounds belonging to beta blocker class (AML, PRO, ATN,MTandAB)isbasesasallthemeasuredapparentpKa(poKa)values shifted to lower pH values from their aqueous pKavalues.InthecaseofGLC,GLBandGLZ(allanti‐diabetics),thepoKavaluesshiftedtohigherpHvaluesfromtheiraqueouspKasuggestingthatthesecompoundsareacids.
Figure7.AML–SpectraldatawithchangeinpH.
44 NarasimhamandBarhate/EuropeanJournalofChemistry2(1)(2011)36‐46
Figure8.Distributionofspeciesandspectraldataofselecteddrugs.
Table8.LogPvaluesobtainedbyPotentiometricandHPLCmethods.
Therapeuticalclass CompoundPotentiometric
HPLClogD7.4 LiteraturelogPaLogP ±RMSD
Betablockers
AML 0.04± 0.18 0.16 0.09bPRO 3.48± 0.09 3.34 3.00ATN 0.28± 0.07 0.32 0.50MT 1.95± 0.07 1.79 1.60AB 3.39± 0.07 3.28 1.90
Anti‐diabeticsGLC 2.07± 0.07 2.18 2.60GLB 4.20± 0.11 4.05 3.80GLZ 2.35± 0.16 2.27 2.50
aRef.[30].bPhenomenexDMPKguide.

NarasimhamandBarhate/EuropeanJournalofChemistry2(1)(2011)36‐46 45
Figure9.LogP‐Bjerrumcurvesforselectedcompounds.
Aplotoflogk’,thechromatographiccapacityfactor,againstlogP is linear and the correlation co‐efficient for HPLC logPmeasurement is found to be 0.9973. Close look at the log PresultsbetweenpotentiometryandpartitionHPLC,revealsthatthevalueswitheachtechniquedifferbyonly0.2.Since,methodadopted for the literature values are unknown, it is obviousthat the values differ considerably with our experimentalvalues. Hence our present work is limited only till to thecomparisonbetweenpotentiometryandHPLCmethods.4.Conclusion
Theapplicationofcosolvent–watermixturesimprovesthesolubilityofpoorlywatersolubledrugsthustheirpsKavaluescanbemeasuredinlowerproportionoforganicsolvent.Thecosolvent dissociation constants (psKa) of selected compoundswere determined in different co solvent–water mixtures bypotentiometric and spectrophotometric methods. The cosolvent–water mixtures did not cause large shifts in psKavalues and the Yasuda–Shedlovsky extrapolation procedurewas proposed to obtain the aqueous pKa values. Theextrapolated data are in good agreement with pKa valuesmeasuredinwater.Theaveragedeviation ispKa=0.2. Inthiswaytheproposeddifferentcosolventscanbeappliedtothosecompoundswhicharenotsolubleinaqueoussolutionsandcan
be easily adopted in drug discovery laboratory for thedetermination of dissociation constant in a high throughputmanner.Theknowledgeoftheacid–basebehaviourofthedrugcompounds, in different hydro‐organic media is therefore auseful parameter to optimize analytical procedures for theseparationof ionizablecompoundsby liquid chromatography,especiallywhen these drugs are present in combinationwithotherdrugs.
Acknowledgement
The authors wish to thank the management of Nycomed
Pharma Pvt Ltd. (Mumbai, India) for providing necessaryfacilitiesandtechnicalsupport.
References[1]. Albert, A. and Serjeant, E. P. A Laboratory Manual, 3rd edition,
ChapmanandHallLondon.1984.[2]. RametteR.W.J.Chem.Educ.1967,44,647‐654.[3]. SerjeantE.P.John&WileyandSons,NewYork,1984.[4]. Qiang,Z.;Adams,C.WaterRes.2004,38,2874‐2890.[5]. Pool,S.K.;Patel,S.;Dehring,K.;Workman,H.;Pool,C.F.J.Chromatogr.
A2004,1037,445‐454.[6]. Erdemgil, F. Z.; Sanli, S.; Sanli,N.; Ozkan, G.; Barbosa, J.; Guiteras, J.;
Beltran,J.L.Talanta2007,72,489‐496.

46 NarasimhamandBarhate/EuropeanJournalofChemistry2(1)(2011)36‐46[7]. Evagelou,V.;Tsantili‐Kakoulidou,A.;Koupparis,M. J.Pharm.Biomed.
Anal.2003,31,1119‐1128.[8]. Jimenez‐Lozano, E.;Marques, I.; Barron, D.; Beltran, J. L.; Barbosa, J.
Anal.Chim.Acta2002,464,37‐45.[9]. JanosP.J.Chromatogr.A2004,1037,15‐28.[10]. Andrasi,M.;Buglyo,P.;Zekany,L.;Gaspar,A. J.Pharm.Biomed.Anal.
2007,44,1040‐1047.[11]. Wrobel,R.;Chmurzynski,L.Anal.Chim.Acta2000,405,303‐308.[12]. Meloun,M.;Havel, J.;Högfeldt,E.ComputationofSolutionEquilibria,
EllisHorwood,Chichester,1988.[13]. Ying‐Sing,F.;Shiu‐Fai,L.Analyst1985,110,1439‐1444.[14]. Papanastasiou,G.;Ziogas,I.Talanta1989,36,977‐983.[15]. Guillén,S.R.;Guzmán,C.M.Microchem.J.1988,37,40‐50.[16]. Avdeef,A.Anal.Chim.Acta1983,148,237‐244.[17]. Kin,T.Y.;Krisztina,T.N.Anal.Chim.Acta2001,434,157‐167.[18]. Karl, B.; Christopher, B.; John, C.; Alan, H.; Ruth, A.; Derek, R. Anal.
Chem.2003,75,883‐892.[19]. Avdeef,A.;John,E.A.C.;Simon,J.T.Anal.Chem.1993,65,42‐49.[20]. Krisztina,T.N.;Karl,B.;Avdeef,A.Int.J.Pharm.1997,151,235‐248.[21]. Avdeef,A.;Karl,J.B.;John,E.A.C.;Gilges,M.;Hadley,M.;Hibbert,C.;
Patterson,W.;Tam,K.Y.J.Pharm.Biomed.Anal.1999,20,631‐641.[22]. Gergely,V.;Rebeca,R.;Karl,B.; John,C.;Elisabeth,B.;Krisztina,T.N.
Anal.Chim.Acta2007,583,418–428.[23]. AvdeefA.J.Pharm.Sci.1993,82,183‐190.[24]. Kraft,A.J.Chem.Educ.2003,80,554‐559.[25]. Avdeef,A.;Kearney,D.L.;Brown,J.A.;ChemottiJr.,A.R.Anal.Chem.
1982,54,2322–2326.[26]. Tam,K.Y.;Krisztina,T.N.Anal.Chim.Acta2001,434,157‐167.[27]. Ruth,A.;Karl,B.;John,C.;PeakeC.;TamK.Y.J.Pharm.Biomed.Anal.
1998,17,699–712.[28]. Krisztina, T. N.; Avdeef, A. J. Pharm. Biomed. Anal. 1996, 14, 1405–
1413.[29]. Krisztina, T. N.; Avdeef, A.; Karl, B.; Podanyi, B.; Szasz, G. J. Pharm.
Biomed.Anal.1994,12,1369–1377.[30]. Wishart,D.S.;Knox,C.;Guo,A.C.;Cheng,D.;Shrivastava,S.;Tzur,D.;
Gautam, B.; Hassanali, M.; DrugBank: Nucleic Acids Res. 2008, 36(Databaseissue):D901‐6.
[31]. Arnaud‐neu,F.;Delgado,R.;Chaves,S.PureAppl.Chem.2003,75,71–102.
[32]. Gutmann,V.Coord.Chem.Rev.1976,18,225‐255.[33]. Loudon,G.M.OrganicChemistry,4thedition,OxfordUniversityPress,
2005.[34]. Coetzee,J.F.;Padmanabhan,G.R.J.Amer.Chem.Soc.1965,87,5005‐
5010.[35]. AvdeefA.AbsorptionandDrugDevelopment.Solubility,Permeability
andChargeState,Wiley&Sons,NewJersey,2003.


![European Journal of Medicinal Chemistry - avcr.cz · potent in cellular assays than purines. Therefore, pyrazolo[4,3-d]pyrimidine may emerge as a novel ... European Journal of Medicinal](https://img.pdfslide.net/doc/110x75/5e6b20904653c174f13d2073/european-journal-of-medicinal-chemistry-avcrcz-potent-in-cellular-assays-than.jpg)