Embed Size (px)
Citation preview
EUROPEAN ORGANIZATION FOR NUCLEAR RESEARCH European Laboratory for Particle Physics
CERN – TS DEPARTMENT
EDMS Nr. 804849 TS-Note-2006-010
Chemical and radiolytical characterization of some perfluorocarbon fluids used as coolants for LHC experiments
Chemical characterization
M. Battistin, S. Ilie, R. Setnescu, B. Teissandier
Abstract
Perfluorocarbon fluids, - mainly C6F14 - used as coolants within High Energy Physics Detectors in the Large Hadrons Collider (LHC) at CERN, were characterized by applying mainly the following methods: GC, FT-IR and UV-Vis. The aim of this work was the quality control, the identification and the quantification of different impurities which could increase the radiation sensitivity of these fluids. Thus, the presence of H containing molecules within perfluorocarbons strongly influences the appearance of hydrofluoric acid during their irradiation. The procedures settled-up in this work are sensitive to the presence of such impurities and would be used for the analyses of the received perfluorocarbon fluids as well as to assess the radiation induced modifications and the efficiency of their purification treatments.
Geneva, Switzerland October 2006
- 2 - 1. INTRODUCTION
Perfluorocarbons will be used as cooling fluids within the detector inner parts of the LHC experiments, in a high ionizing radiation field.
The purpose of the report is to present the work carried out in CERN for the characterization of C6F14 cooling perfluorocarbons using different methods and techniques (spectral, chromatographic, potentiometric, chemical, etc.), the behavior of the perfluorocarbons in the radiation fields, as well as their possible purification. Further it was decided to study also the perfluoropropane (C3F8), used as a cooling fluid in the evaporative mode.
The present part – Part One – of the report refers to the analyses carried out and the compliance of the obtained results and the procedures applied in CERN to the technical specifications delivered by the suppliers.
An important part of this work was focused on the identification and the quantification of different impurities which could increase the radiation sensitivity of these fluids. Thus, the presence of H containing molecules within perfluorocarbons strongly influence the appearance of hydrofluoric acid during their irradiation, while the presence of double bonds can induce the appearance of polymers and/or pre-polymers. The procedures settled-up in this work were found to be sensitive to the presence of such impurities and would be used to characterize the as received perfluorocarbon fluids, as well as their radiation induced modifications. In some cases, several different analytical methods were tested for one parameter as shown in Ch. 4, in order to found the most adequate one, or to validate a certain analyze method proposed. In other cases, the procedures given by the supplier (such as density or boiling point measurements) were directly applied.
Our strategy envisaged also to apply adequate treatments to less pure, hence less expensive fluids, in order to fulfil the CERN technical requirements and enlarge the range of the potential suppliers.
2. CERN TECHNICAL REQUIREMENTS AND PERFLUOROCARBON FLUIDS STUDIED
The CERN quality (technical) requirements cf. IT 3397/TS for the perfluorocarbon fluids to be supplied are summarized in Table 1 and Table 2; the main types received and studied within the present work are summarized in Table 3.
The analyze documents of the supplied fluids are listed in Table 4. The specifications from F2 (UK) for C6F14 (iso-C6F14 or 2-perfluoromethylpentane) and Astor (Russia) for C3F8 fulfill the CERN technical requirements. The specifications from 3M (USA) for n-C6F14 (PF 5060 and PF 5060 DL) does not refer to all CERN requirements, therefore their characterization in CERN was carried out in the Chemistry Laboratory.
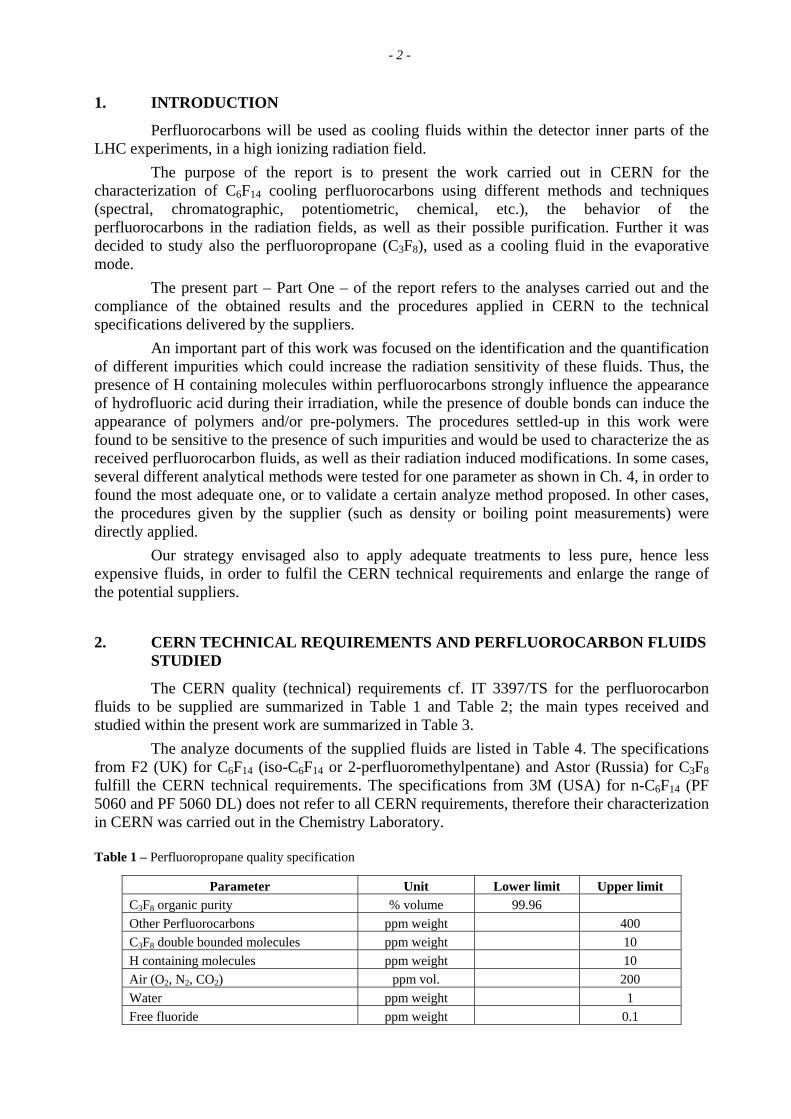
Table 1 – Perfluoropropane quality specification
Parameter Unit Lower limit Upper limit C3F8 organic purity % volume 99.96 Other Perfluorocarbons ppm weight 400 C3F8 double bounded molecules ppm weight 10 H containing molecules ppm weight 10 Air (O2, N2, CO2) ppm vol. 200 Water ppm weight 1 Free fluoride ppm weight 0.1
- 3 - Table 2 – Perfluorohexane quality specification
Parameter Unit Lower limit Upper limit C6F14 purity by GLC (area %) % 98 Other Perfluorocarbons % 2 C6F14 double bounded molecules ppm weight 10 H containing molecules ppm weight 10 Water ppm weight 10 Free fluoride ppm weight 1 Density g/ml 1.660 1.700 Boiling point ºC 51 59
Table 3 – The main perfluorocarbon fluids studied in this work
No. Product name Supplier Composition Name used in this report
1 PF 5060 3M Chemicals, USA mainly n-C6F14(n-perfluorohexane) PF 5060
2 PF 5060 "purified"
3M Chemicals, USA; tentatively " treated" (purified) in CERN Chemistry Lab. to meet the quality requirements cf. IT 3397/TS
mainly n-C6F14 (n-perfluorohexane) purified PF 5060
3 PF 5060 DL 3M Chemicals, USA mainly n-C6F14(n-perfluorohexane) PF 5060 DL
4 Flutec PP1 F2 Chemicals Ltd., UK mainly iso-C6F14(iso-perfluorohexane) PP1
5 C3F8(R218) ASTOR, Russia C3F8
perfluoropropane C3F8
perfluoropropane Table 4 – The analyse documents of the perfluorocarbon fluids supplied to CERN
No. Product name Supplier Technical
Specification Document
1 PF 5060 3M Chemicals, USA 3M Technical
Specifications for PF-5060 / 28 August 2002
Certificate of Compliance/ Analysis (19 Sep.05)
2 PF 5060 DL 3M Chemicals, USA
3M Technical Specifications for PF-
5060DL / 13 Feb. 2001
Certificate of Analysis Lot. Nbr. 20032/ 13 Mar. 2006
3 Flutec PP1 F2 Chemicals Ltd., UK
F2 Chemicals Ltd. Specification Sheet
QCS 38
Certificate of Analysis Batch No 0294/ Ref. No. P51917
4 C3F8(R218) ASTOR, Russia ASTOR Specification AST 427/ 02 Dec. 2005
- 4 - 3. INSTRUMENTS, METHODS AND PROCEDURES
3.1 Gas-chromatograph with mass spectrometer detector (GC-MSD) A GC-MSD Agilent 6890 Series GC System with a 60 m capillary GasPro column
coupled to the Agilent 5973 Mass Selective Detector was used. The analytical parameters were optimized as follows:
- C3F8 analysis • detector: 250 °C • heater: 260 °C • carrier gas flow: 0.9 mL/ minute • split 300:1; sample gas loop 0.25 mL, previously pumped out • initial temperature: 90 °C • initial time: 15 minutes • heating rate: 20 °C/ minute • final temperature: 170 °C • final time: 10 minutes
- C6F14 analysis • detector: 250 °C • heater: 260 °C • carrier gas flow: 0.9 mL/minute • split 300:1; sample injections between 2 µL and 10 µL
- initial temperature: 120 °C - initial time: 20 minutes - heating rate: 8 °C/ minute - final temperature: 200 °C - final time: 10 minutes
3.2 Gas-chromatograph with TCD detector (GC-TCD) A GC Hewlett - Packard 5890 with a Thermal Conductivity Detector (TCD) and a
4 m, 1/8’’, packed Porapak Q column was used. The analytical parameters were optimized as follows:
- C3F8 analysis • oven temperature: 80 °C (isotherm) • injector: 130 °C • detector: 140 °C • sample gas loop 0.25 mL, previously pumped out.
- C6F14 analysis Method PFC 2006B • injector: 140 °C • detector: 180 °C • initial temperature: 140 °C • initial time: 45 minutes • heating rate: 8 °C/ minute • final time: 20 minutes • final temperature: 170 °C • sample injections: between 2 µL and 10 µL
- 5 -
Method PFC 2006C • - injector: 130 °C • - detector: 160 °C • - initial temperature: 110 °C • - initial time: 20 minutes • - heating rate: 20 °C/ minute • - final time: 45 minutes • - final temperature: 150 °C • - sample injections: between 2 µL and 10 µL
3.3 Fourier Transform-Infrared Spectroscopy (FT-IR) A Bruker FT-IR spectrometer Vertex 70 was used, with the following settings: - aperture: 6 mm - resolution: 4 cm-1
- sample scan time: 32 scans - transmission or absorbance mode - ZnS cells (Cleartran) - optical path length: 0.5 mm - all analyses were realized in liquid phase
3.4 UV-Vis Spectrophotometry An UV-Vis Spectrophotometer Agilent 8453 was used, with the following
parameters: - spectral range: 190 – 1100 nm - diode array, mono-beam - silica cells - optical path length: 1 cm - air or purified C6F14 were used as references.
3.5 Free fluoride ion analysis The fluoride ion (F-) concentration was measured by a potentiometric method with the
instrument Methrom Titrando 809, using a fluoride ion-selective electrode, a reference Ag/AgCl (double junction filled with KCl solution, 3 mol/L) and magnetically stirred solution. The calibration curve was established using appropriate NaF standard solutions. The measurements were realized at a fixed ionic strength using a TISAB III1 solution (10 % reported to total volume of the analyzed solution). All used vessels were in plastic materials (mainly polypropylene).
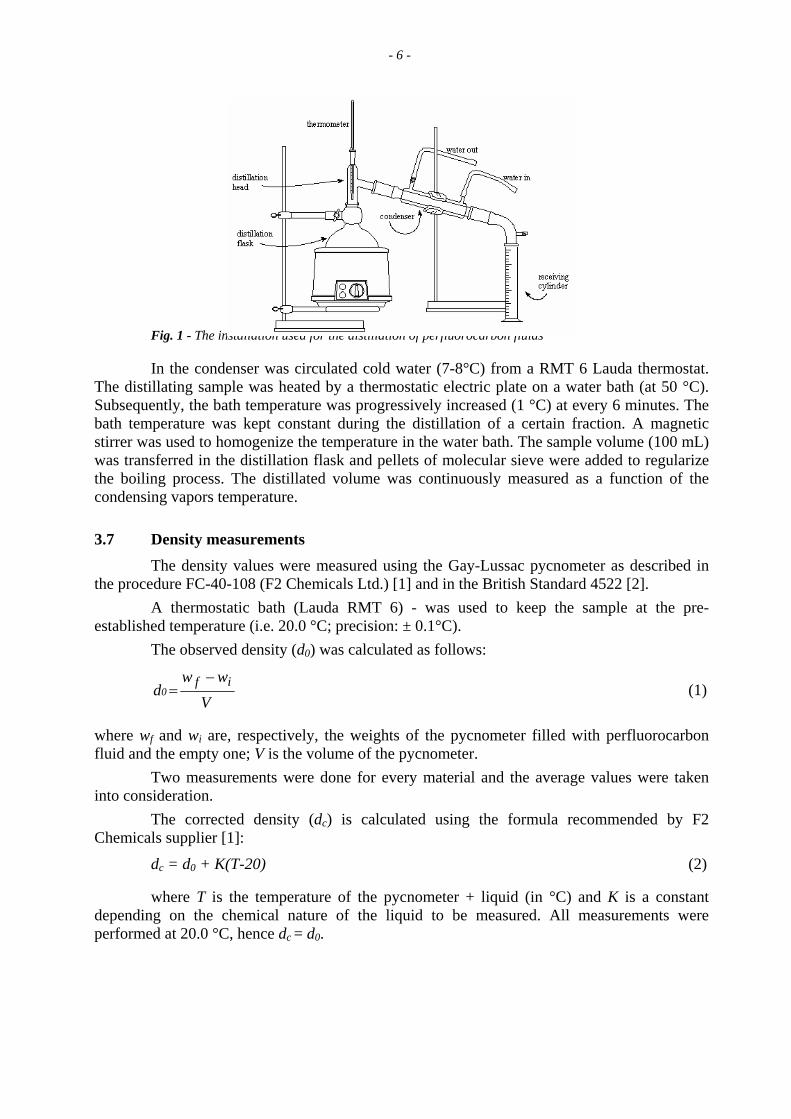
3.6 Boiling points (distillation ranges) measurements The boiling points (distillation ranges) of the perfluorocarbon fluids were measured
according to the procedure FC-40-106 (F2 Chemicals Ltd.) [1] and the British Standard 658 [2]. The distillation installation used is shown in the Fig. 1.
1 Total Ionic Strength Adjustment Buffer
- 6 -
Fig. 1 - The installation used for the distillation of perfluorocarbon fluids
In the condenser was circulated cold water (7-8°C) from a RMT 6 Lauda thermostat. The distillating sample was heated by a thermostatic electric plate on a water bath (at 50 °C). Subsequently, the bath temperature was progressively increased (1 °C) at every 6 minutes. The bath temperature was kept constant during the distillation of a certain fraction. A magnetic stirrer was used to homogenize the temperature in the water bath. The sample volume (100 mL) was transferred in the distillation flask and pellets of molecular sieve were added to regularize the boiling process. The distillated volume was continuously measured as a function of the condensing vapors temperature.
3.7 Density measurements The density values were measured using the Gay-Lussac pycnometer as described in
the procedure FC-40-108 (F2 Chemicals Ltd.) [1] and in the British Standard 4522 [2]. A thermostatic bath (Lauda RMT 6) - was used to keep the sample at the pre-
established temperature (i.e. 20.0 °C; precision: ± 0.1°C). The observed density (d0) was calculated as follows:
Vww
d if0
−= (1)
where wf and wi are, respectively, the weights of the pycnometer filled with perfluorocarbon fluid and the empty one; V is the volume of the pycnometer.
Two measurements were done for every material and the average values were taken into consideration.
The corrected density (dc) is calculated using the formula recommended by F2 Chemicals supplier [1]:
dc = d0 + K(T-20) (2)
where T is the temperature of the pycnometer + liquid (in °C) and K is a constant depending on the chemical nature of the liquid to be measured. All measurements were performed at 20.0 °C, hence dc = d0.
- 7 - 4. RESULTS
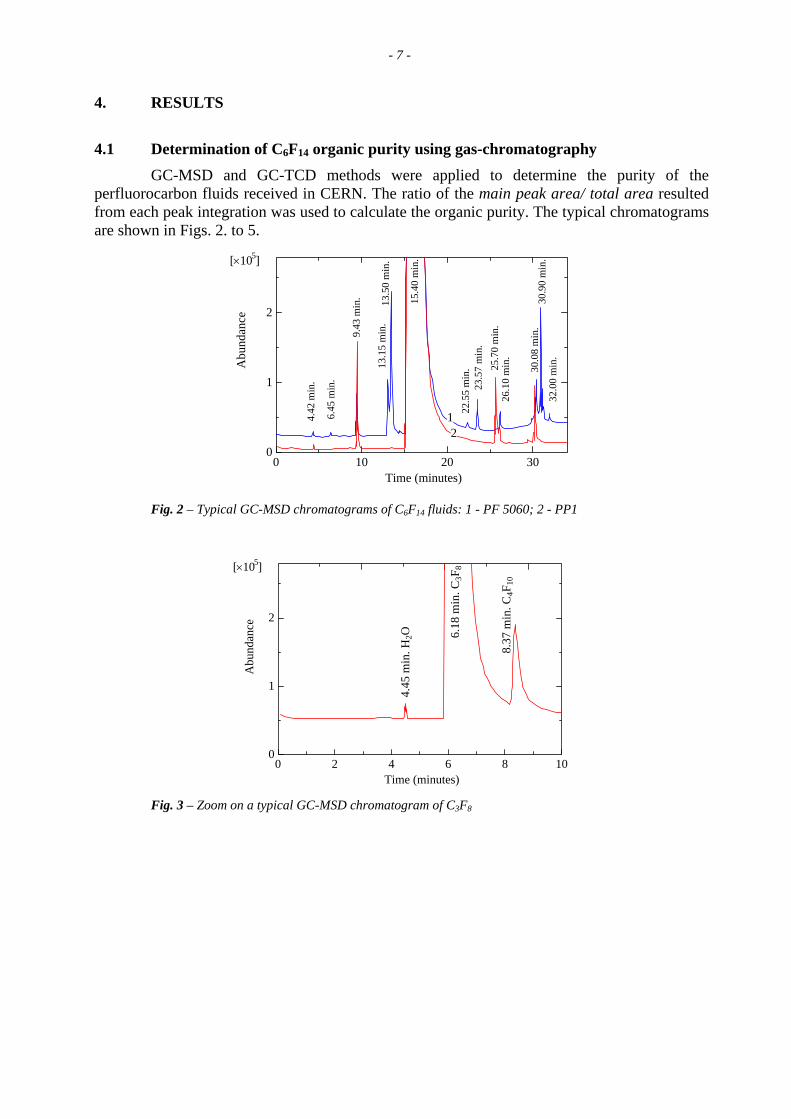
4.1 Determination of C6F14 organic purity using gas-chromatography GC-MSD and GC-TCD methods were applied to determine the purity of the
perfluorocarbon fluids received in CERN. The ratio of the main peak area/ total area resulted from each peak integration was used to calculate the organic purity. The typical chromatograms are shown in Figs. 2. to 5.
0 10 20 300
1
2
[×105]
Time (minutes)
Abu
ndan
ce
12
4.42
min
.
6.45
min
.
9.43
min
.
13.1
5 m
in.
13.5
0 m
in.
15.4
0 m
in.
22.5
5 m
in.
23.5
7 m
in.
25.7
0 m
in.
26.1
0 m
in.
30.0
8 m
in.
30.9
0 m
in.
32.0
0 m
in.
Fig. 2 – Typical GC-MSD chromatograms of C6F14 fluids: 1 - PF 5060; 2 - PP1
0 2 4 6 8 100
1
2
[×105]
Time (minutes)
Abu
ndan
ce
6.18
min
. C3F
8
4.45
min
. H2O
8.37
min
. C4F
10
Fig. 3 – Zoom on a typical GC-MSD chromatogram of C3F8
- 8 -
0 20 40 60500
520
540
560
580
Time (minutes)
Abu
ndan
ce
0.979 min.
2.65
min
.4.
05 m
in. 8.
64 m
in.
12.4
0 m
in.
32.5
0 m
in.
34.4
0 m
in.
47.7
5 m
in.
1
2
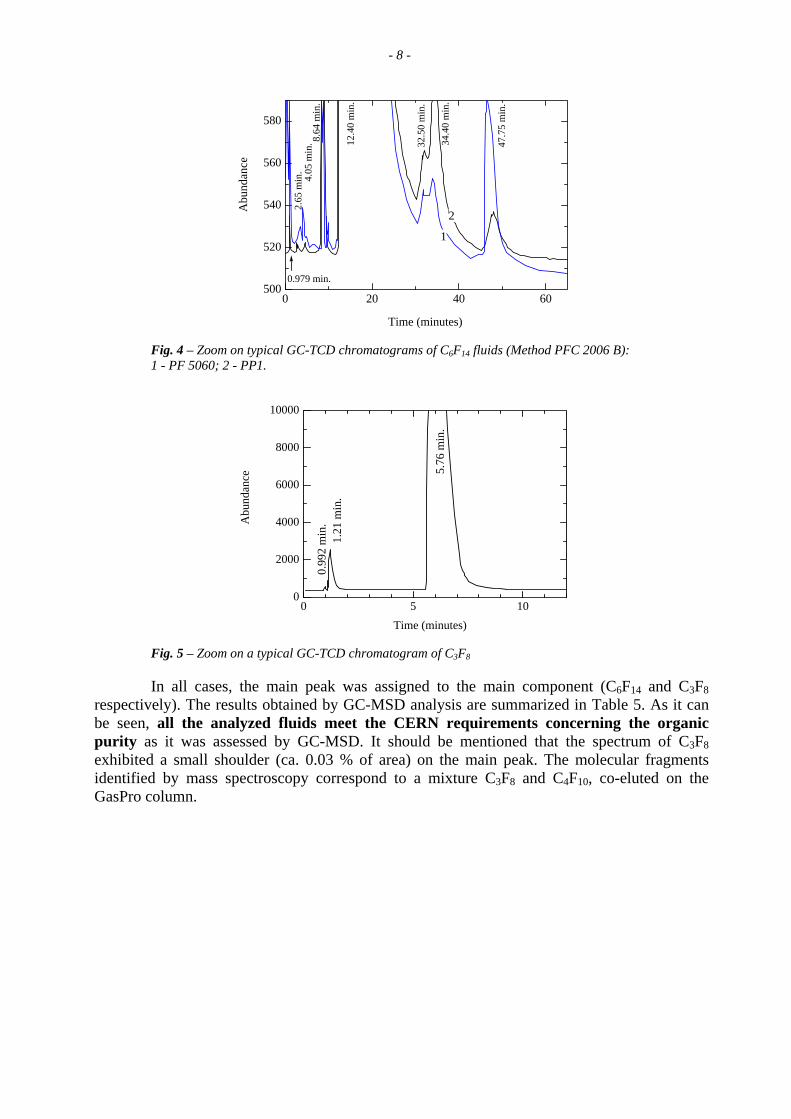
Fig. 4 – Zoom on typical GC-TCD chromatograms of C6F14 fluids (Method PFC 2006 B): 1 - PF 5060; 2 - PP1.
0 5 100
2000
4000
6000
8000
10000
Time (minutes)
Abu
ndan
ce 5.76
min
.
1.21
min
.0.
992
min
.
Fig. 5 – Zoom on a typical GC-TCD chromatogram of C3F8
In all cases, the main peak was assigned to the main component (C6F14 and C3F8 respectively). The results obtained by GC-MSD analysis are summarized in Table 5. As it can be seen, all the analyzed fluids meet the CERN requirements concerning the organic purity as it was assessed by GC-MSD. It should be mentioned that the spectrum of C3F8 exhibited a small shoulder (ca. 0.03 % of area) on the main peak. The molecular fragments identified by mass spectroscopy correspond to a mixture C3F8 and C4F10, co-eluted on the GasPro column.
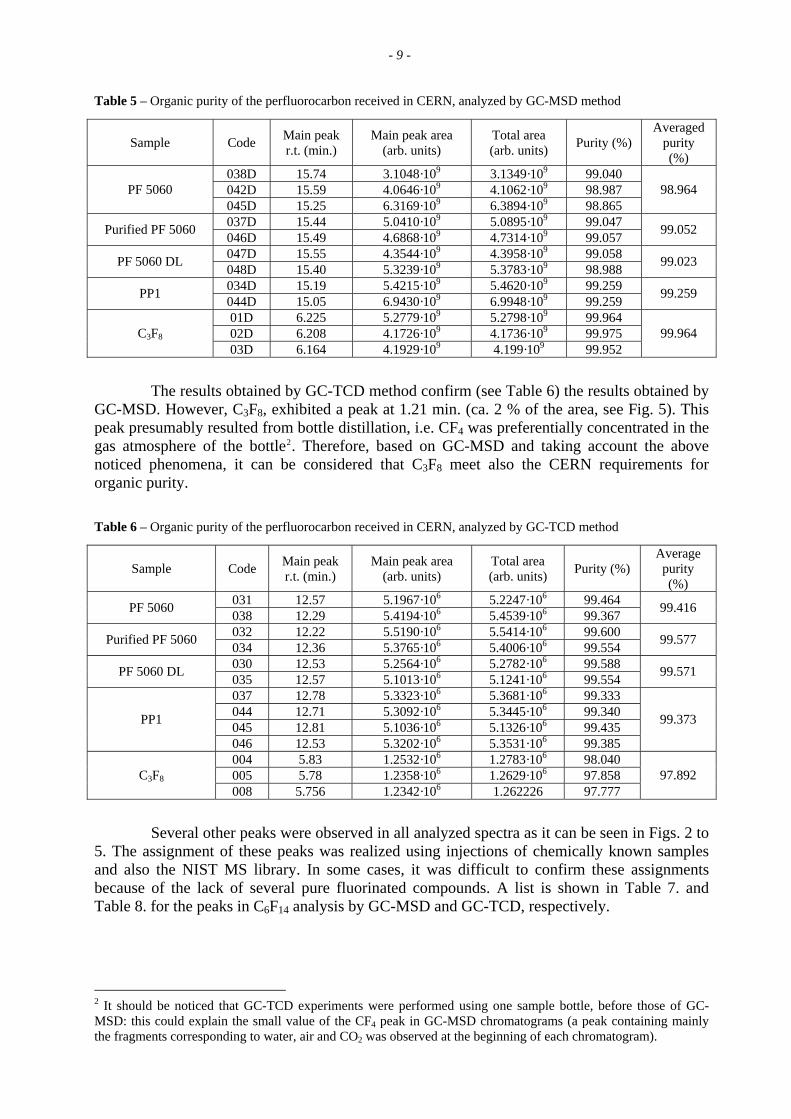
- 9 - Table 5 – Organic purity of the perfluorocarbon received in CERN, analyzed by GC-MSD method
Sample Code Main peak r.t. (min.)
Main peak area (arb. units)
Total area (arb. units) Purity (%)
Averaged purity (%)
038D 15.74 3.1048·109 3.1349·109 99.040 042D 15.59 4.0646·109 4.1062·109 98.987 PF 5060 045D 15.25 6.3169·109 6.3894·109 98.865
98.964
037D 15.44 5.0410·109 5.0895·109 99.047 Purified PF 5060 046D 15.49 4.6868·109 4.7314·109 99.057 99.052
047D 15.55 4.3544·109 4.3958·109 99.058 PF 5060 DL 048D 15.40 5.3239·109 5.3783·109 98.988 99.023
034D 15.19 5.4215·109 5.4620·109 99.259 PP1 044D 15.05 6.9430·109 6.9948·109 99.259 99.259
01D 6.225 5.2779·109 5.2798·109 99.964 02D 6.208 4.1726·109 4.1736·109 99.975 C3F8 03D 6.164 4.1929·109 4.199·109 99.952
99.964
The results obtained by GC-TCD method confirm (see Table 6) the results obtained by
GC-MSD. However, C3F8, exhibited a peak at 1.21 min. (ca. 2 % of the area, see Fig. 5). This peak presumably resulted from bottle distillation, i.e. CF4 was preferentially concentrated in the gas atmosphere of the bottle2. Therefore, based on GC-MSD and taking account the above noticed phenomena, it can be considered that C3F8 meet also the CERN requirements for organic purity. Table 6 – Organic purity of the perfluorocarbon received in CERN, analyzed by GC-TCD method
Sample Code Main peak r.t. (min.)
Main peak area (arb. units)
Total area (arb. units) Purity (%)
Average purity (%)
031 12.57 5.1967·106 5.2247·106 99.464 PF 5060 038 12.29 5.4194·106 5.4539·106 99.367 99.416
032 12.22 5.5190·106 5.5414·106 99.600 Purified PF 5060 034 12.36 5.3765·106 5.4006·106 99.554 99.577
030 12.53 5.2564·106 5.2782·106 99.588 PF 5060 DL 035 12.57 5.1013·106 5.1241·106 99.554 99.571
037 12.78 5.3323·106 5.3681·106 99.333 044 12.71 5.3092·106 5.3445·106 99.340 045 12.81 5.1036·106 5.1326·106 99.435 PP1
046 12.53 5.3202·106 5.3531·106 99.385
99.373
004 5.83 1.2532·106 1.2783·106 98.040 005 5.78 1.2358·106 1.2629·106 97.858 C3F8
008 5.756 1.2342·106 1.262226 97.777 97.892
Several other peaks were observed in all analyzed spectra as it can be seen in Figs. 2 to
5. The assignment of these peaks was realized using injections of chemically known samples and also the NIST MS library. In some cases, it was difficult to confirm these assignments because of the lack of several pure fluorinated compounds. A list is shown in Table 7. and Table 8. for the peaks in C6F14 analysis by GC-MSD and GC-TCD, respectively.
2 It should be noticed that GC-TCD experiments were performed using one sample bottle, before those of GC-MSD: this could explain the small value of the CF4 peak in GC-MSD chromatograms (a peak containing mainly the fragments corresponding to water, air and CO2 was observed at the beginning of each chromatogram).
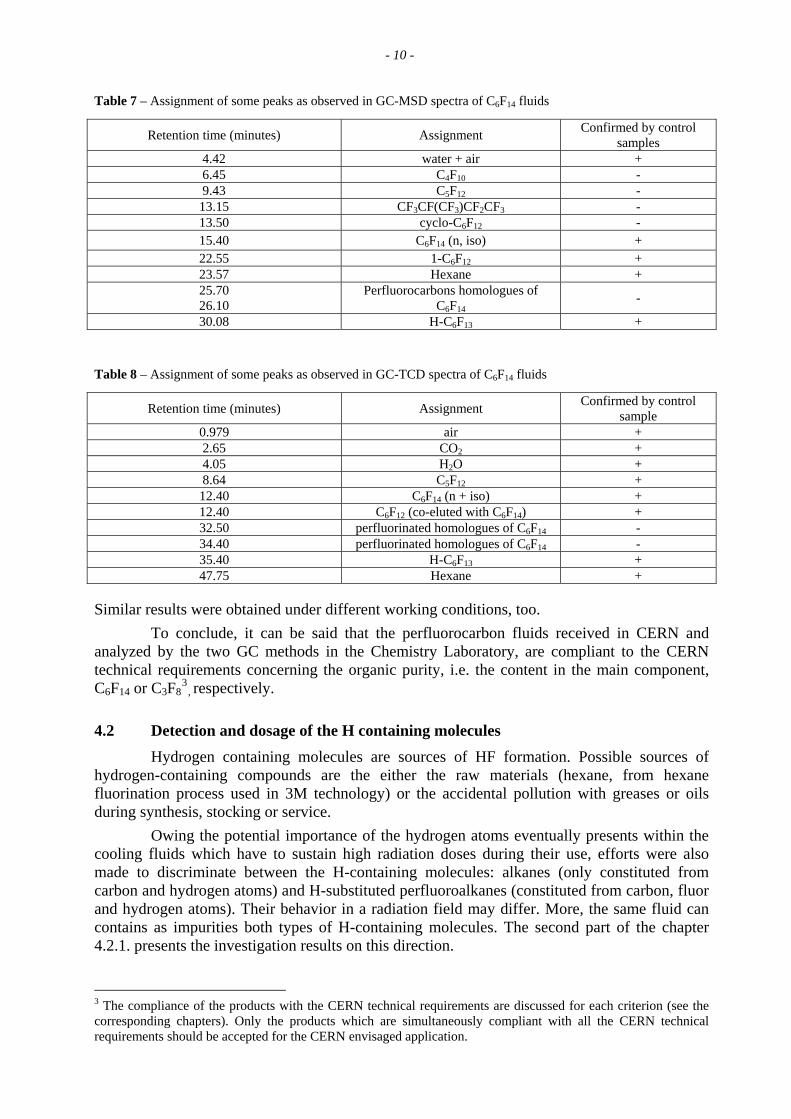
- 10 - Table 7 – Assignment of some peaks as observed in GC-MSD spectra of C6F14 fluids
Retention time (minutes) Assignment Confirmed by control samples
4.42 water + air + 6.45 C4F10 - 9.43 C5F12 - 13.15 CF3CF(CF3)CF2CF3 - 13.50 cyclo-C6F12 - 15.40 C6F14 (n, iso) + 22.55 1-C6F12 + 23.57 Hexane + 25.70 26.10
Perfluorocarbons homologues of C6F14
-
30.08 H-C6F13 + Table 8 – Assignment of some peaks as observed in GC-TCD spectra of C6F14 fluids
Retention time (minutes) Assignment Confirmed by control sample
0.979 air + 2.65 CO2 + 4.05 H2O + 8.64 C5F12 + 12.40 C6F14 (n + iso) + 12.40 C6F12 (co-eluted with C6F14) + 32.50 perfluorinated homologues of C6F14 - 34.40 perfluorinated homologues of C6F14 - 35.40 H-C6F13 + 47.75 Hexane +
Similar results were obtained under different working conditions, too. To conclude, it can be said that the perfluorocarbon fluids received in CERN and
analyzed by the two GC methods in the Chemistry Laboratory, are compliant to the CERN technical requirements concerning the organic purity, i.e. the content in the main component, C6F14 or C3F8
3, respectively.
4.2 Detection and dosage of the H containing molecules Hydrogen containing molecules are sources of HF formation. Possible sources of
hydrogen-containing compounds are the either the raw materials (hexane, from hexane fluorination process used in 3M technology) or the accidental pollution with greases or oils during synthesis, stocking or service.
Owing the potential importance of the hydrogen atoms eventually presents within the cooling fluids which have to sustain high radiation doses during their use, efforts were also made to discriminate between the H-containing molecules: alkanes (only constituted from carbon and hydrogen atoms) and H-substituted perfluoroalkanes (constituted from carbon, fluor and hydrogen atoms). Their behavior in a radiation field may differ. More, the same fluid can contains as impurities both types of H-containing molecules. The second part of the chapter 4.2.1. presents the investigation results on this direction.
3 The compliance of the products with the CERN technical requirements are discussed for each criterion (see the corresponding chapters). Only the products which are simultaneously compliant with all the CERN technical requirements should be accepted for the CERN envisaged application.
- 11 - 4.2.1 FT-IR method
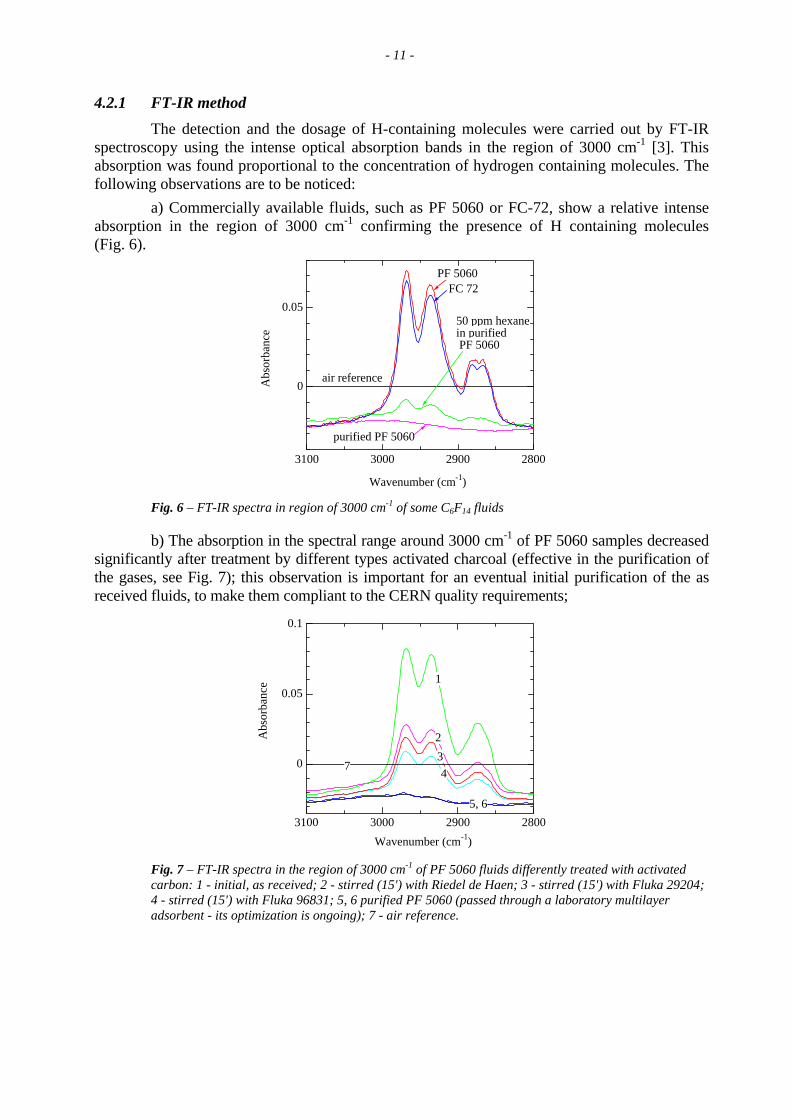
The detection and the dosage of H-containing molecules were carried out by FT-IR spectroscopy using the intense optical absorption bands in the region of 3000 cm-1 [3]. This absorption was found proportional to the concentration of hydrogen containing molecules. The following observations are to be noticed:
a) Commercially available fluids, such as PF 5060 or FC-72, show a relative intense absorption in the region of 3000 cm-1 confirming the presence of H containing molecules (Fig. 6).
2800290030003100
0
0.05
Wavenumber (cm-1)
Abs
orba
nce
PF 5060
50 ppm hexanein purified PF 5060
air reference
purified PF 5060
FC 72
Fig. 6 – FT-IR spectra in region of 3000 cm-1 of some C6F14 fluids
b) The absorption in the spectral range around 3000 cm-1 of PF 5060 samples decreased significantly after treatment by different types activated charcoal (effective in the purification of the gases, see Fig. 7); this observation is important for an eventual initial purification of the as received fluids, to make them compliant to the CERN quality requirements;
2800290030003100
0
0.05
0.1
Wavenumber (cm-1)
Abs
orba
nce 1
234
5, 6
7
Fig. 7 – FT-IR spectra in the region of 3000 cm-1 of PF 5060 fluids differently treated with activated carbon: 1 - initial, as received; 2 - stirred (15') with Riedel de Haen; 3 - stirred (15') with Fluka 29204; 4 - stirred (15') with Fluka 96831; 5, 6 purified PF 5060 (passed through a laboratory multilayer adsorbent - its optimization is ongoing); 7 - air reference.
- 12 -
c) The optical absorption exhibited by the fluids supplied to CERN is similar to that induced in pure or purified samples by adding hexane (see Fig. 6). Low traces of hexane could be present in these fluids as non converted raw materials, as it was noted above;
d) The optical absorption in the region of 3000 cm-1 of the purified PF 5060 samples was lower than that of air, so negative values of the absorbance were observed when air was used as a reference (see Fig. 7); similar values of the absorbance were also obtained in the case of the both high purity products PF 5060 DL and PP1 (see data in Table 9). In the latter case, the lack of hydrogen-containing products could be related to the peculiarities of the applied technology based on the dimerization of a previously purified perfluoroalkene (i.e. C3F6).
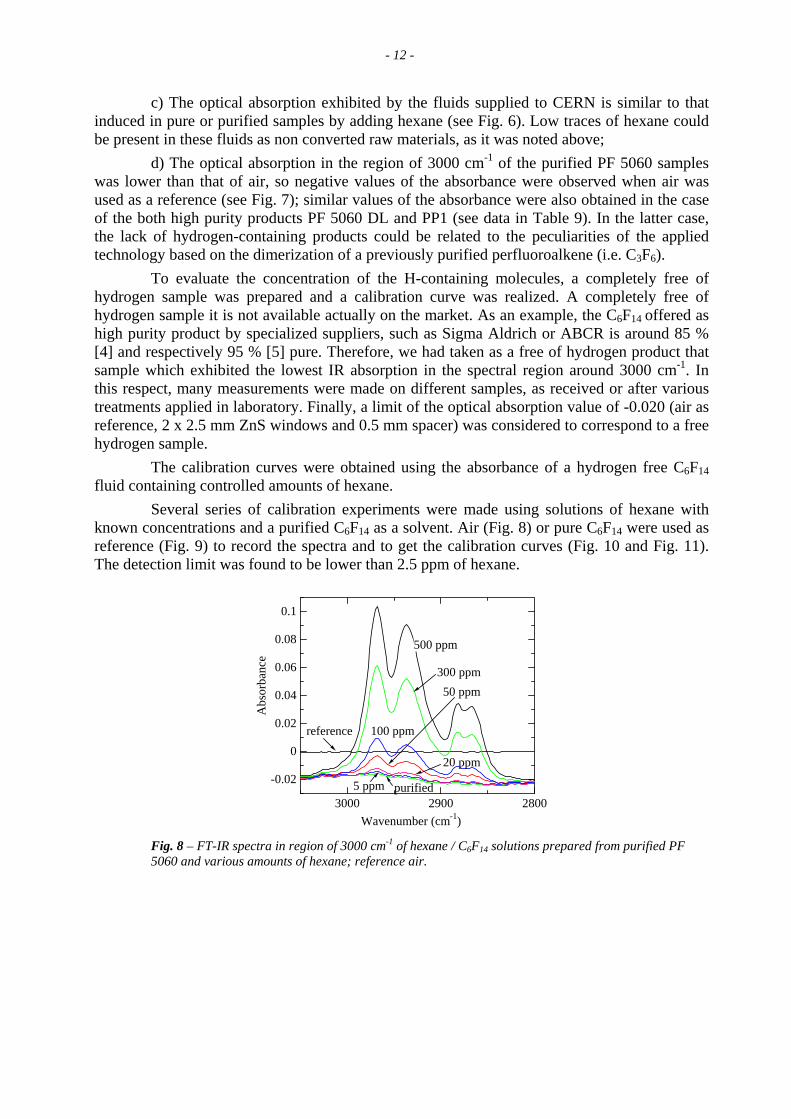
To evaluate the concentration of the H-containing molecules, a completely free of hydrogen sample was prepared and a calibration curve was realized. A completely free of hydrogen sample it is not available actually on the market. As an example, the C6F14 offered as high purity product by specialized suppliers, such as Sigma Aldrich or ABCR is around 85 % [4] and respectively 95 % [5] pure. Therefore, we had taken as a free of hydrogen product that sample which exhibited the lowest IR absorption in the spectral region around 3000 cm-1. In this respect, many measurements were made on different samples, as received or after various treatments applied in laboratory. Finally, a limit of the optical absorption value of -0.020 (air as reference, 2 x 2.5 mm ZnS windows and 0.5 mm spacer) was considered to correspond to a free hydrogen sample.
The calibration curves were obtained using the absorbance of a hydrogen free C6F14 fluid containing controlled amounts of hexane.
Several series of calibration experiments were made using solutions of hexane with known concentrations and a purified C6F14 as a solvent. Air (Fig. 8) or pure C6F14 were used as reference (Fig. 9) to record the spectra and to get the calibration curves (Fig. 10 and Fig. 11). The detection limit was found to be lower than 2.5 ppm of hexane.
280029003000
-0.02
0
0.02
0.04
0.06
0.08
0.1
Wavenumber (cm-1)
Abs
orba
nce
500 ppm
300 ppm
100 ppm
50 ppm
20 ppm
5 ppm
reference
purified
Fig. 8 – FT-IR spectra in region of 3000 cm-1 of hexane / C6F14 solutions prepared from purified PF 5060 and various amounts of hexane; reference air.
- 13 -
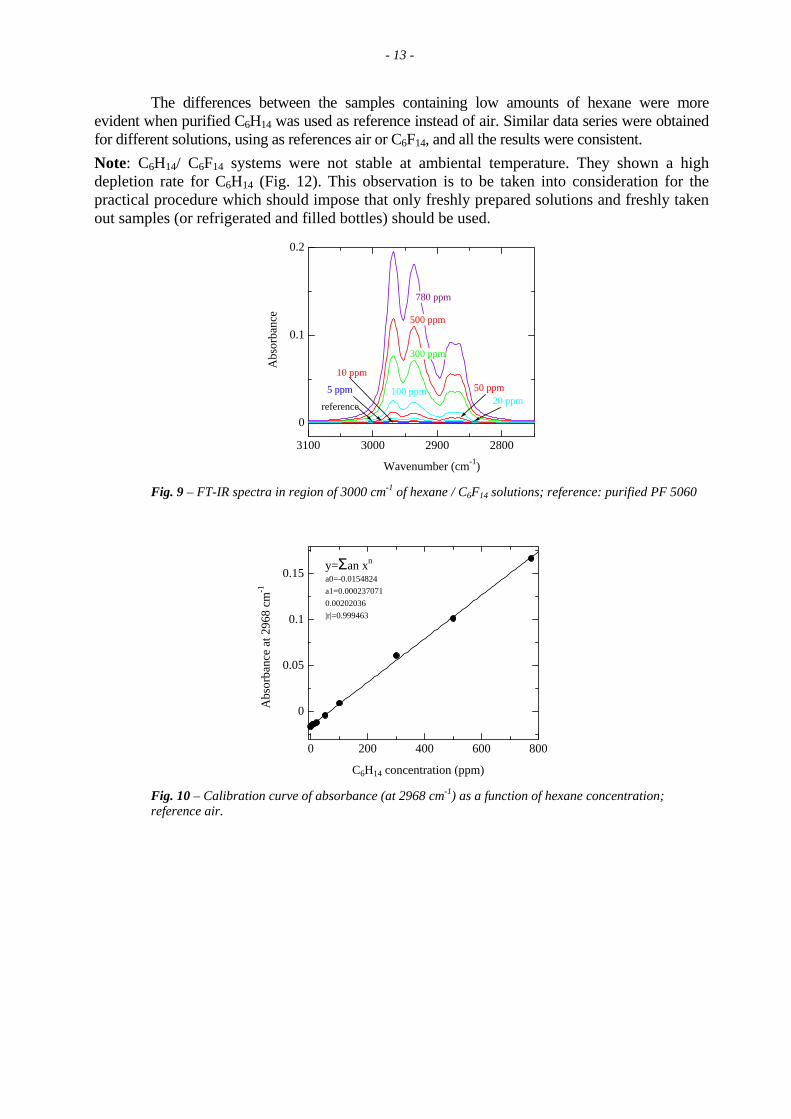
The differences between the samples containing low amounts of hexane were more evident when purified C6H14 was used as reference instead of air. Similar data series were obtained for different solutions, using as references air or C6F14, and all the results were consistent. Note: C6H14/ C6F14 systems were not stable at ambiental temperature. They shown a high depletion rate for C6H14 (Fig. 12). This observation is to be taken into consideration for the practical procedure which should impose that only freshly prepared solutions and freshly taken out samples (or refrigerated and filled bottles) should be used.
2800290030003100
0
0.1
0.2
Wavenumber (cm-1)
Abs
orba
nce
reference
5 ppm
780 ppm 500 ppm
300 ppm
10 ppm50 ppm 20 ppm
100 ppm
Fig. 9 – FT-IR spectra in region of 3000 cm-1 of hexane / C6F14 solutions; reference: purified PF 5060
0 200 400 600 800
0
0.05
0.1
0.15
C6H14 concentration (ppm)
Abs
orba
nce
at 2
968
cm-1
y=Σan xn
a0=-0.0154824a1=0.0002370710.00202036|r|=0.999463
Fig. 10 – Calibration curve of absorbance (at 2968 cm-1) as a function of hexane concentration; reference air.
- 14 -
0 10 20 30 40 500
0.005
0.01
C6H14 concentration (ppm)
Abs
orba
nce
at 2
968
cm-1
y=Σan xn
a0=0.00147123a1=0.0002011840.00304114|r|=0.998792
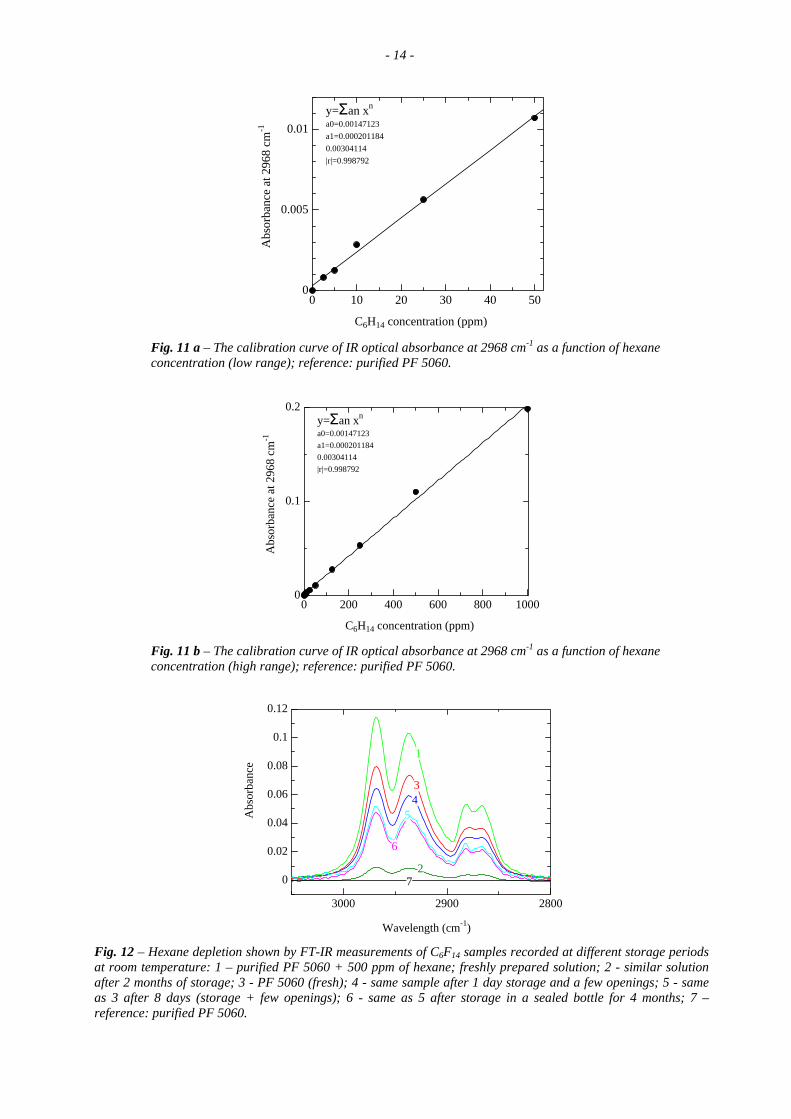
Fig. 11 a – The calibration curve of IR optical absorbance at 2968 cm-1 as a function of hexane concentration (low range); reference: purified PF 5060.
0 200 400 600 800 10000
0.1
0.2
C6H14 concentration (ppm)
Abs
orba
nce
at 2
968
cm-1
y=Σan xn
a0=0.00147123a1=0.0002011840.00304114|r|=0.998792
Fig. 11 b – The calibration curve of IR optical absorbance at 2968 cm-1 as a function of hexane concentration (high range); reference: purified PF 5060.
280029003000
0
0.02
0.04
0.06
0.08
0.1
0.12
Wavelength (cm-1)
Abs
orba
nce
1
3 4
5 6
2 7 Fig. 12 – Hexane depletion shown by FT-IR measurements of C6F14 samples recorded at different storage periods at room temperature: 1 – purified PF 5060 + 500 ppm of hexane; freshly prepared solution; 2 - similar solution after 2 months of storage; 3 - PF 5060 (fresh); 4 - same sample after 1 day storage and a few openings; 5 - same as 3 after 8 days (storage + few openings); 6 - same as 5 after storage in a sealed bottle for 4 months; 7 – reference: purified PF 5060.
- 15 -
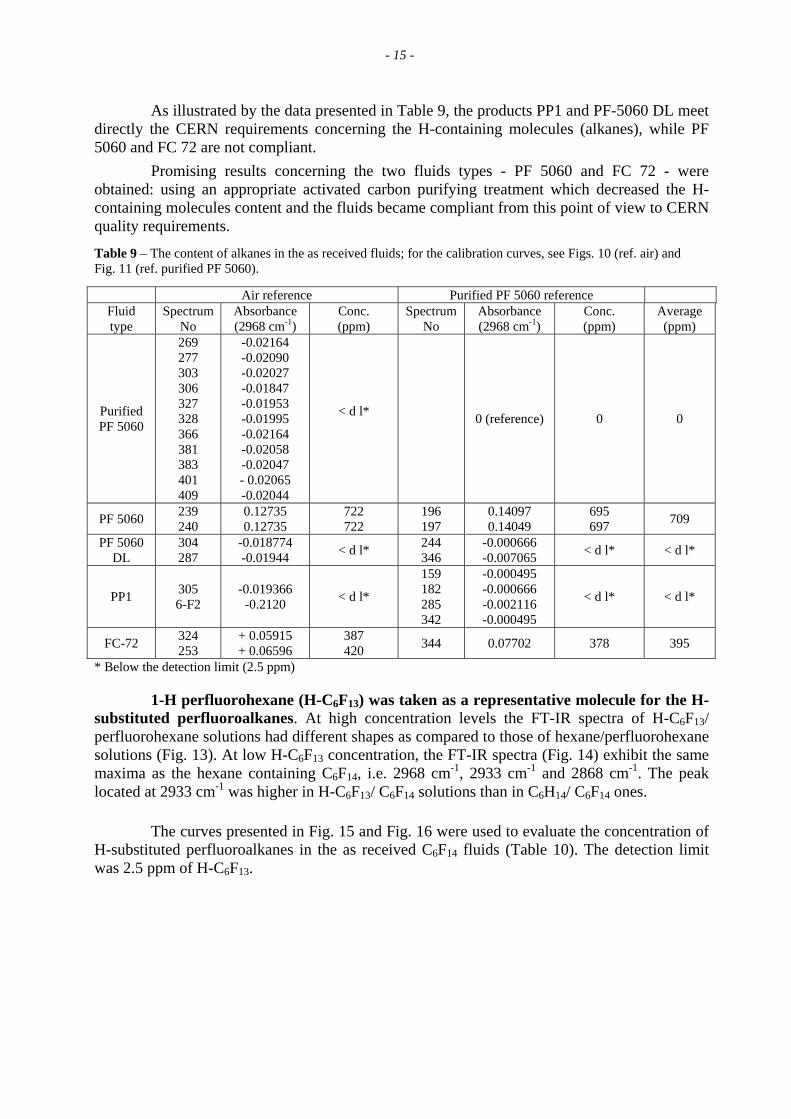
As illustrated by the data presented in Table 9, the products PP1 and PF-5060 DL meet directly the CERN requirements concerning the H-containing molecules (alkanes), while PF 5060 and FC 72 are not compliant.
Promising results concerning the two fluids types - PF 5060 and FC 72 - were obtained: using an appropriate activated carbon purifying treatment which decreased the H-containing molecules content and the fluids became compliant from this point of view to CERN quality requirements.
Table 9 – The content of alkanes in the as received fluids; for the calibration curves, see Figs. 10 (ref. air) and Fig. 11 (ref. purified PF 5060).
Air reference Purified PF 5060 reference Fluid type
Spectrum No
Absorbance (2968 cm-1)
Conc. (ppm)
Spectrum No
Absorbance (2968 cm-1)
Conc. (ppm)
Average (ppm)
Purified PF 5060
269 277 303 306 327 328 366 381 383 401 409
-0.02164 -0.02090 -0.02027 -0.01847 -0.01953 -0.01995 -0.02164 -0.02058 -0.02047 - 0.02065 -0.02044
< d l* 0 (reference) 0 0
PF 5060 239 240
0.12735 0.12735
722 722
196 197
0.14097 0.14049
695 697 709
PF 5060 DL
304 287
-0.018774 -0.01944 < d l* 244
346 -0.000666 -0.007065 < d l* < d l*
PP1 305 6-F2
-0.019366 -0.2120 < d l*
159 182 285 342
-0.000495 -0.000666 -0.002116 -0.000495
< d l* < d l*
FC-72 324 253
+ 0.05915 + 0.06596
387 420 344 0.07702 378 395
* Below the detection limit (2.5 ppm)
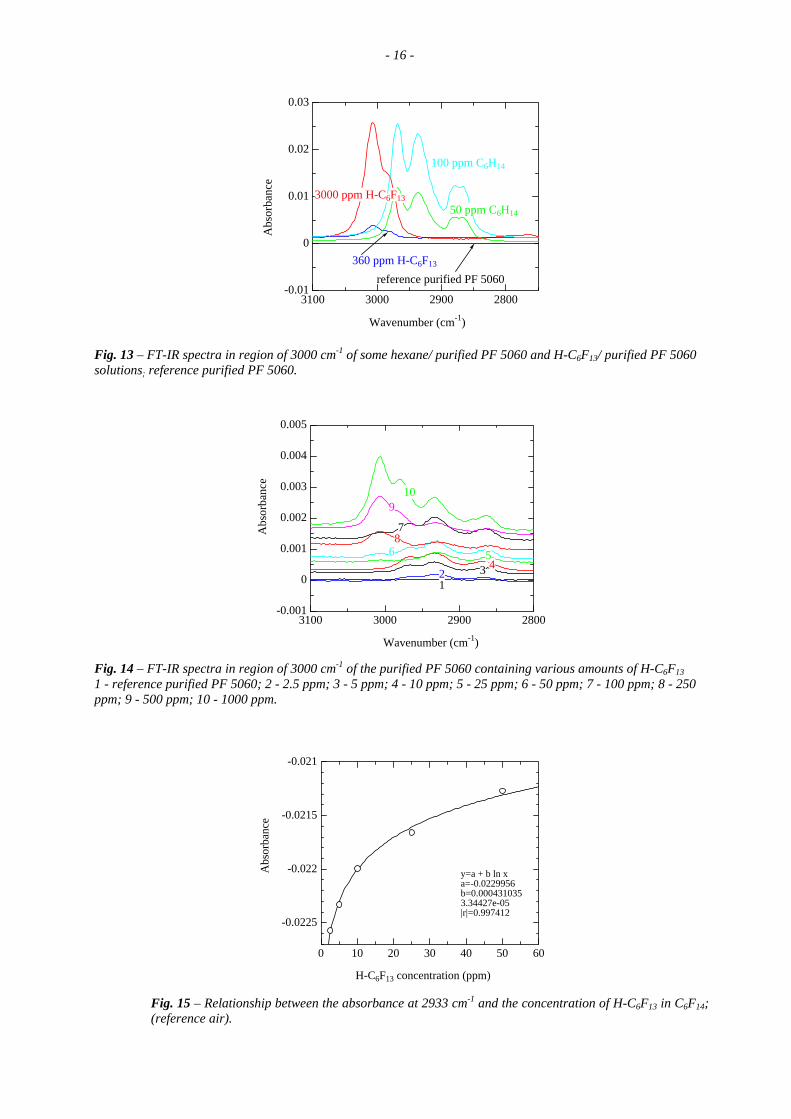
1-H perfluorohexane (H-C6F13) was taken as a representative molecule for the H-substituted perfluoroalkanes. At high concentration levels the FT-IR spectra of H-C6F13/ perfluorohexane solutions had different shapes as compared to those of hexane/perfluorohexane solutions (Fig. 13). At low H-C6F13 concentration, the FT-IR spectra (Fig. 14) exhibit the same maxima as the hexane containing C6F14, i.e. 2968 cm-1, 2933 cm-1 and 2868 cm-1. The peak located at 2933 cm-1 was higher in H-C6F13/ C6F14 solutions than in C6H14/ C6F14 ones.
The curves presented in Fig. 15 and Fig. 16 were used to evaluate the concentration of H-substituted perfluoroalkanes in the as received C6F14 fluids (Table 10). The detection limit was 2.5 ppm of H-C6F13.
- 16 -
2800290030003100-0.01
0
0.01
0.02
0.03
Wavenumber (cm-1)
Abs
orba
nce
3000 ppm H-C6F13
360 ppm H-C6F13
reference purified PF 5060
100 ppm C6H14
Fig. 13 – FT-IR spectra in region of 3000 cm-1 of some hexane/ purified PF 5060 and H-C6F13/ purified PF 5060 solutions; reference purified PF 5060. Fig. 14 – FT-IR spectra in region of 3000 cm-1 of the purified PF 5060 containing various amounts of H-C6F13 1 - reference purified PF 5060; 2 - 2.5 ppm; 3 - 5 ppm; 4 - 10 ppm; 5 - 25 ppm; 6 - 50 ppm; 7 - 100 ppm; 8 - 250 ppm; 9 - 500 ppm; 10 - 1000 ppm.
Fig. 15 – Relationship between the absorbance at 2933 cm-1 and the concentration of H-C6F13 in C6F14; (reference air).
50 ppm C6H14
2800290030003100-0.001
0
0.001
0.002
0.003
0.004
0.005
Wavenumber (cm-1)
Abs
orba
nce
109
12 3
7
68
45
0 10 20 30 40 50 60
-0.0225
-0.022
-0.0215
-0.021
H-C6F13 concentration (ppm)
Abs
orba
nce
y=a + b ln xa=-0.0229956b=0.0004310353.34427e-05|r|=0.997412
- 17 -
0 10 20 30 40 50 600
0.001
0.002
Concentration of H-C6F13 (ppm)
Abs
orba
nce
y=a + b ln xa=-0.00018189b=0.0003993117.08598e-05|r|=0.98668
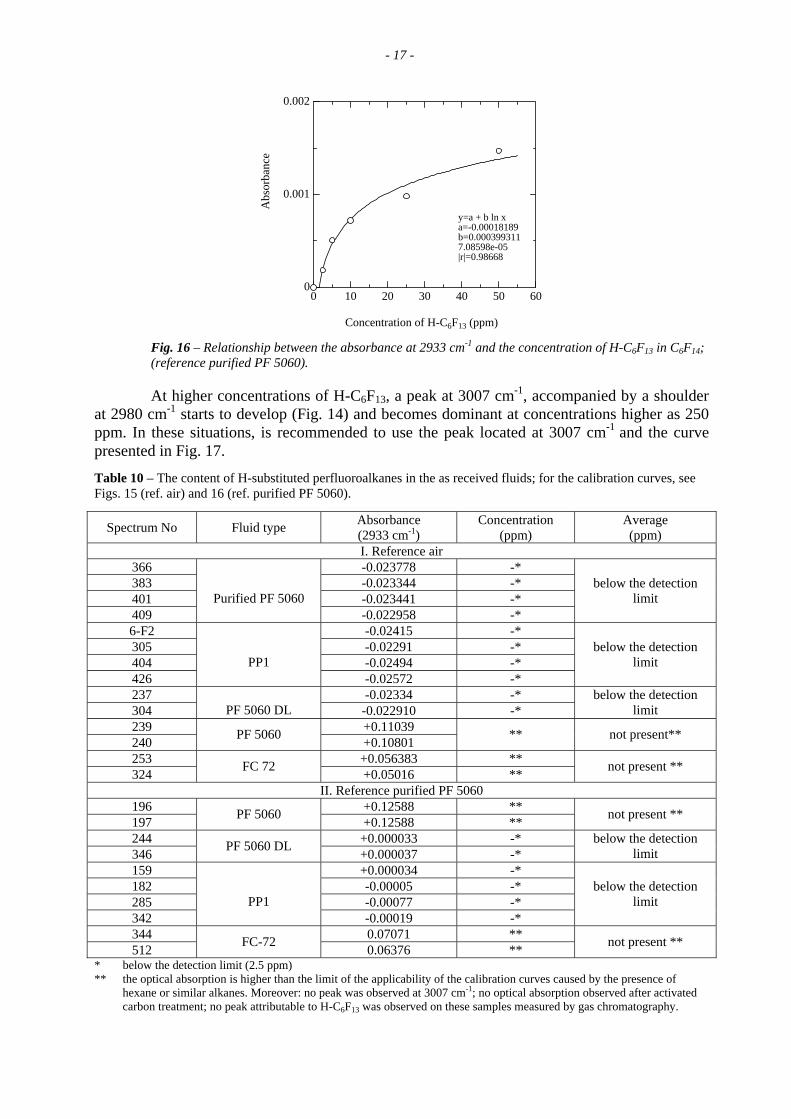
Fig. 16 – Relationship between the absorbance at 2933 cm-1 and the concentration of H-C6F13 in C6F14; (reference purified PF 5060).
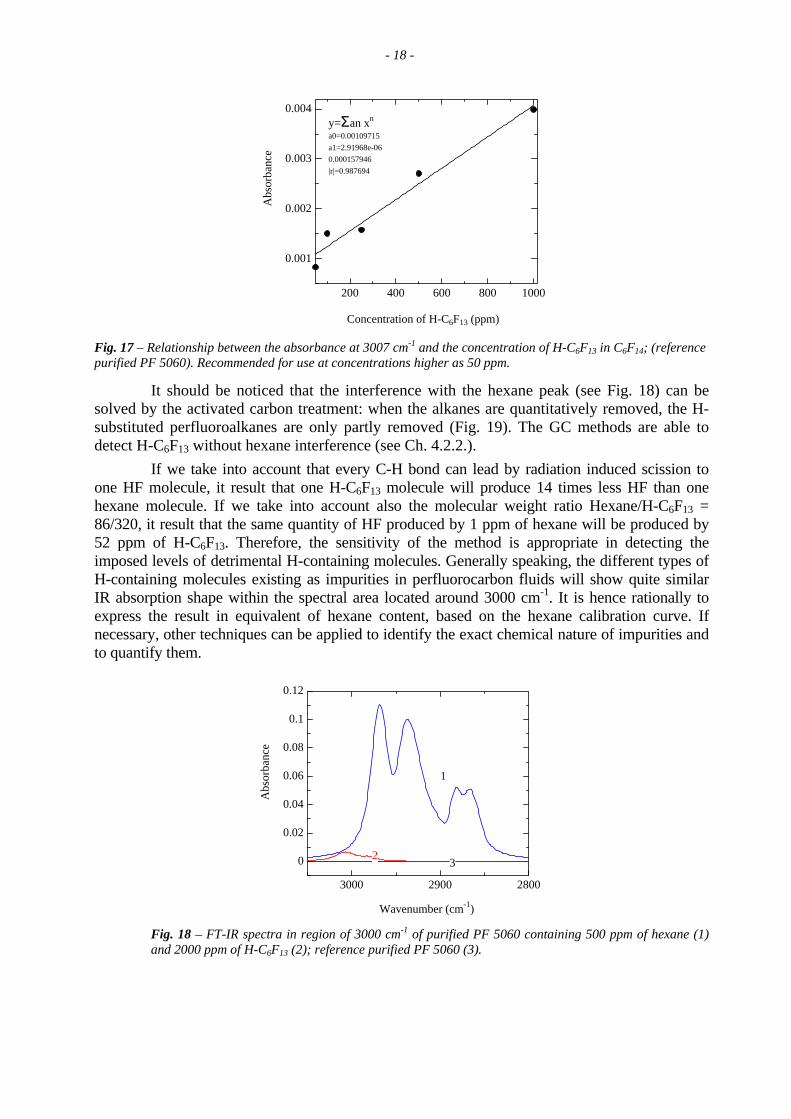
At higher concentrations of H-C6F13, a peak at 3007 cm-1, accompanied by a shoulder at 2980 cm-1 starts to develop (Fig. 14) and becomes dominant at concentrations higher as 250 ppm. In these situations, is recommended to use the peak located at 3007 cm-1 and the curve presented in Fig. 17.
Table 10 – The content of H-substituted perfluoroalkanes in the as received fluids; for the calibration curves, see Figs. 15 (ref. air) and 16 (ref. purified PF 5060).
Spectrum No Fluid type Absorbance (2933 cm-1)
Concentration (ppm)
Average (ppm)
I. Reference air 366 -0.023778 -* 383 -0.023344 -* 401 -0.023441 -* 409
Purified PF 5060
-0.022958 -*
below the detection limit
6-F2 -0.02415 -* 305 -0.02291 -* 404 -0.02494 -* 426
PP1
-0.02572 -*
below the detection limit
237 -0.02334 -* 304
PF 5060 DL -0.022910 -*
below the detection limit
239 +0.11039 240 PF 5060 +0.10801 ** not present**
253 +0.056383 ** 324 FC 72 +0.05016 ** not present **
II. Reference purified PF 5060 196 +0.12588 ** 197 PF 5060 +0.12588 ** not present **
244 +0.000033 -* 346 PF 5060 DL +0.000037 -*
below the detection limit
159 +0.000034 -* 182 -0.00005 -* 285 -0.00077 -* 342
PP1
-0.00019 -*
below the detection limit
344 0.07071 ** 512 FC-72 0.06376 ** not present **
* below the detection limit (2.5 ppm) ** the optical absorption is higher than the limit of the applicability of the calibration curves caused by the presence of
hexane or similar alkanes. Moreover: no peak was observed at 3007 cm-1; no optical absorption observed after activated carbon treatment; no peak attributable to H-C6F13 was observed on these samples measured by gas chromatography.
- 18 -
200 400 600 800 1000
0.001
0.002
0.003
0.004
Concentration of H-C6F13 (ppm)
Abs
orba
nce
y=Σan xn
a0=0.00109715a1=2.91968e-060.000157946|r|=0.987694
Fig. 17 – Relationship between the absorbance at 3007 cm-1 and the concentration of H-C6F13 in C6F14; (reference purified PF 5060). Recommended for use at concentrations higher as 50 ppm.
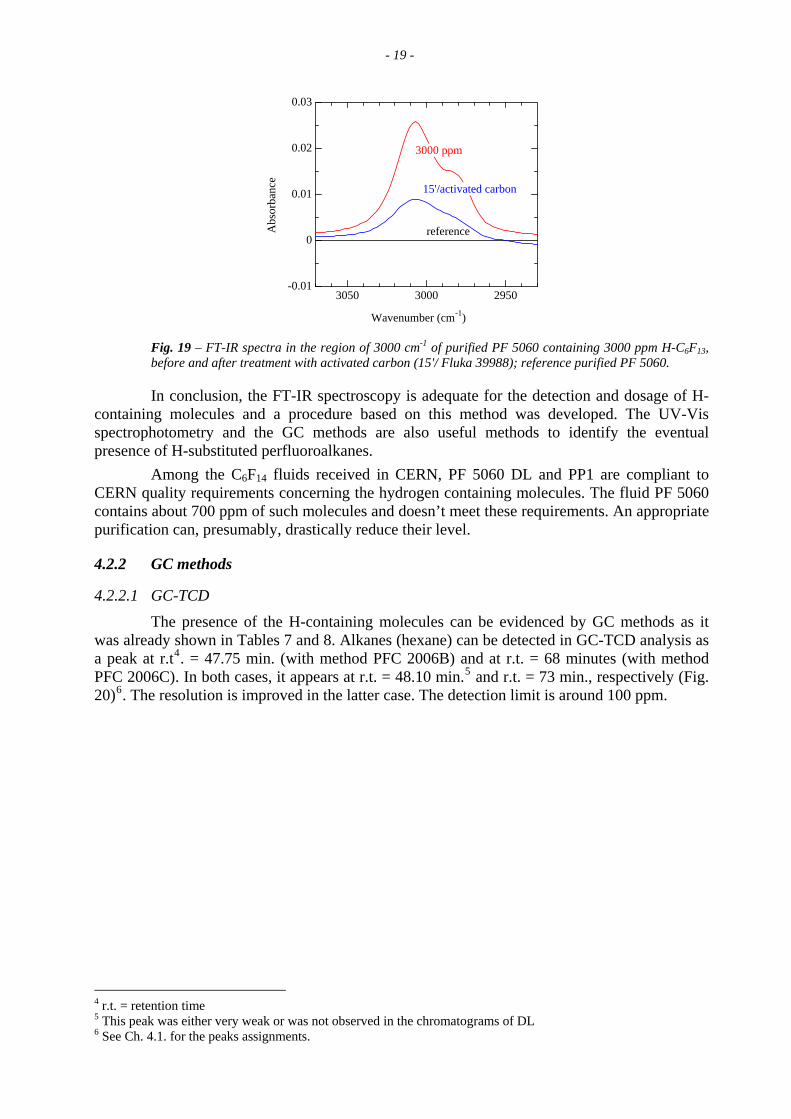
It should be noticed that the interference with the hexane peak (see Fig. 18) can be solved by the activated carbon treatment: when the alkanes are quantitatively removed, the H-substituted perfluoroalkanes are only partly removed (Fig. 19). The GC methods are able to detect H-C6F13 without hexane interference (see Ch. 4.2.2.).
If we take into account that every C-H bond can lead by radiation induced scission to one HF molecule, it result that one H-C6F13 molecule will produce 14 times less HF than one hexane molecule. If we take into account also the molecular weight ratio Hexane/H-C6F13 = 86/320, it result that the same quantity of HF produced by 1 ppm of hexane will be produced by 52 ppm of H-C6F13. Therefore, the sensitivity of the method is appropriate in detecting the imposed levels of detrimental H-containing molecules. Generally speaking, the different types of H-containing molecules existing as impurities in perfluorocarbon fluids will show quite similar IR absorption shape within the spectral area located around 3000 cm-1. It is hence rationally to express the result in equivalent of hexane content, based on the hexane calibration curve. If necessary, other techniques can be applied to identify the exact chemical nature of impurities and to quantify them.
280029003000
0
0.02
0.04
0.06
0.08
0.1
0.12
Wavenumber (cm-1)
Abs
orba
nce
3
1
2
Fig. 18 – FT-IR spectra in region of 3000 cm-1 of purified PF 5060 containing 500 ppm of hexane (1) and 2000 ppm of H-C6F13 (2); reference purified PF 5060 (3).
- 19 -
295030003050-0.01
0
0.01
0.02
0.03
Wavenumber (cm-1)
Abs
orba
nce
reference
3000 ppm
15'/activated carbon
Fig. 19 – FT-IR spectra in the region of 3000 cm-1 of purified PF 5060 containing 3000 ppm H-C6F13, before and after treatment with activated carbon (15'/ Fluka 39988); reference purified PF 5060.
In conclusion, the FT-IR spectroscopy is adequate for the detection and dosage of H-containing molecules and a procedure based on this method was developed. The UV-Vis spectrophotometry and the GC methods are also useful methods to identify the eventual presence of H-substituted perfluoroalkanes.
Among the C6F14 fluids received in CERN, PF 5060 DL and PP1 are compliant to CERN quality requirements concerning the hydrogen containing molecules. The fluid PF 5060 contains about 700 ppm of such molecules and doesn’t meet these requirements. An appropriate purification can, presumably, drastically reduce their level.
4.2.2 GC methods
4.2.2.1 GC-TCD The presence of the H-containing molecules can be evidenced by GC methods as it
was already shown in Tables 7 and 8. Alkanes (hexane) can be detected in GC-TCD analysis as a peak at r.t4. = 47.75 min. (with method PFC 2006B) and at r.t. = 68 minutes (with method PFC 2006C). In both cases, it appears at r.t. = 48.10 min.5 and r.t. = 73 min., respectively (Fig. 20)6. The resolution is improved in the latter case. The detection limit is around 100 ppm.
4 r.t. = retention time 5 This peak was either very weak or was not observed in the chromatograms of DL 6 See Ch. 4.1. for the peaks assignments.
- 20 -
0 20 40 60 80450
500
550
Time (minutes)
Abu
ndan
ce
r.t. =
68
min
. H
exan
e pe
ak
123
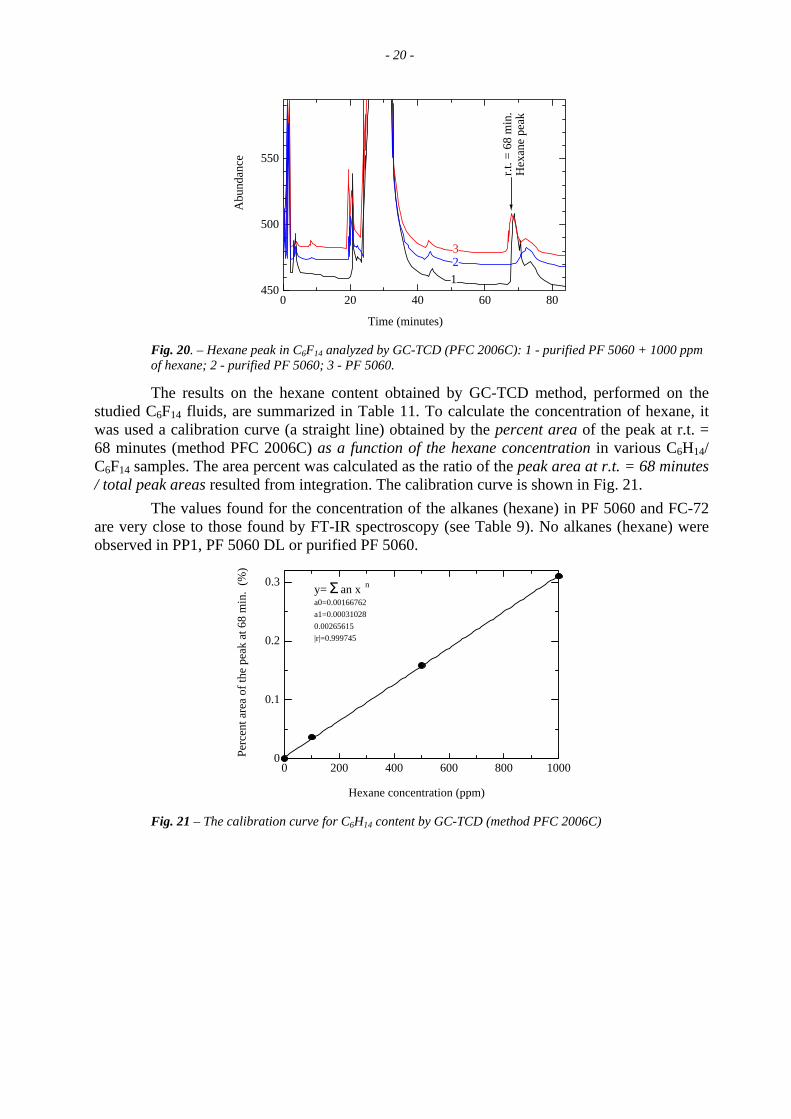
Fig. 20. – Hexane peak in C6F14 analyzed by GC-TCD (PFC 2006C): 1 - purified PF 5060 + 1000 ppm of hexane; 2 - purified PF 5060; 3 - PF 5060.
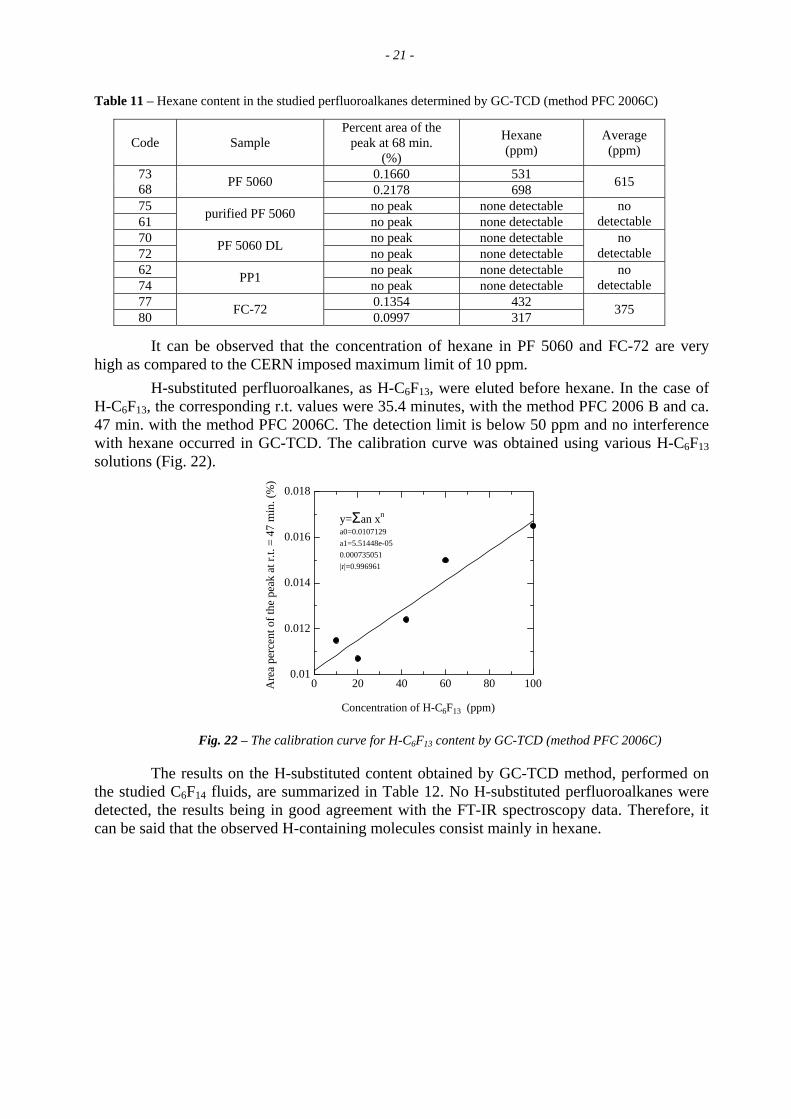
The results on the hexane content obtained by GC-TCD method, performed on the studied C6F14 fluids, are summarized in Table 11. To calculate the concentration of hexane, it was used a calibration curve (a straight line) obtained by the percent area of the peak at r.t. = 68 minutes (method PFC 2006C) as a function of the hexane concentration in various C6H14/ C6F14 samples. The area percent was calculated as the ratio of the peak area at r.t. = 68 minutes / total peak areas resulted from integration. The calibration curve is shown in Fig. 21.
The values found for the concentration of the alkanes (hexane) in PF 5060 and FC-72 are very close to those found by FT-IR spectroscopy (see Table 9). No alkanes (hexane) were observed in PP1, PF 5060 DL or purified PF 5060.
0 200 400 600 800 10000
0.1
0.2
0.3
Hexane concentration (ppm)
Perc
ent a
rea
of th
e pe
ak a
t 68
min
. (%
)
y= Σ an x n
a0=0.00166762a1=0.000310280.00265615|r|=0.999745
Fig. 21 – The calibration curve for C6H14 content by GC-TCD (method PFC 2006C)
- 21 - Table 11 – Hexane content in the studied perfluoroalkanes determined by GC-TCD (method PFC 2006C)
Code Sample Percent area of the
peak at 68 min. (%)
Hexane (ppm)
Average (ppm)
0.1660 531 73 68 PF 5060 0.2178 698 615
75 no peak none detectable 61 purified PF 5060 no peak none detectable
no detectable
70 no peak none detectable 72 PF 5060 DL no peak none detectable
no detectable
62 no peak none detectable 74 PP1 no peak none detectable
no detectable
77 0.1354 432 80 FC-72 0.0997 317 375
It can be observed that the concentration of hexane in PF 5060 and FC-72 are very high as compared to the CERN imposed maximum limit of 10 ppm.
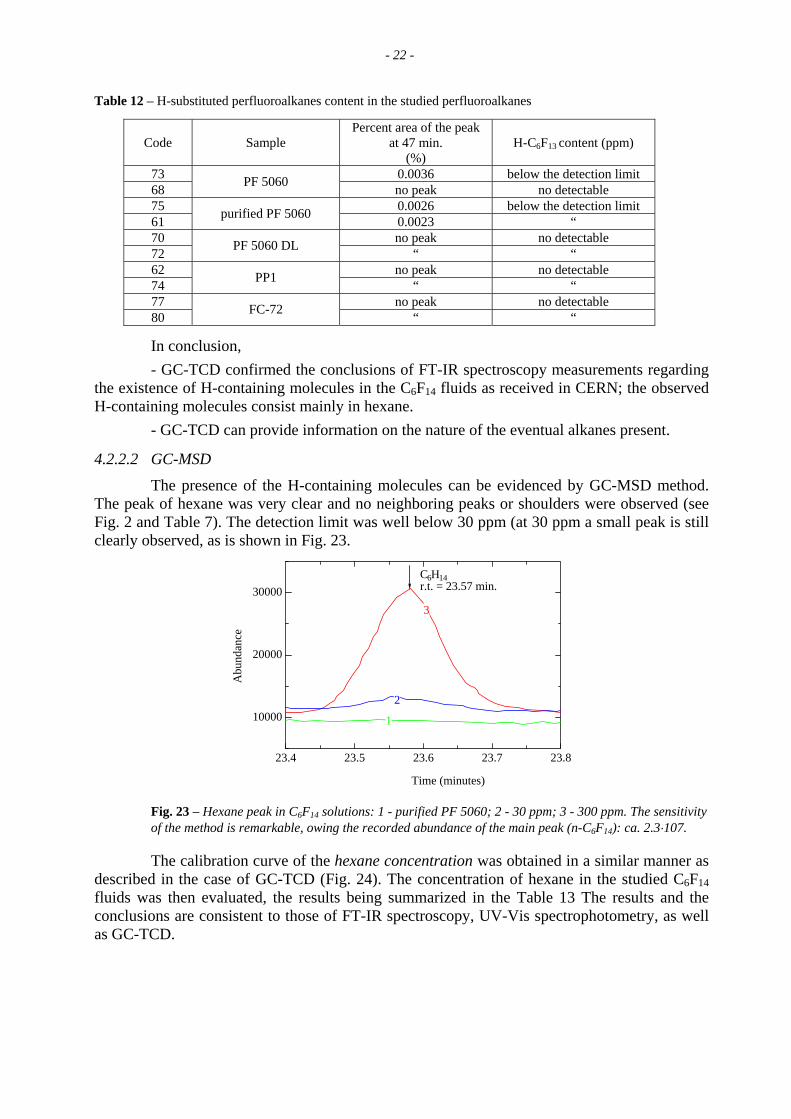
H-substituted perfluoroalkanes, as H-C6F13, were eluted before hexane. In the case of H-C6F13, the corresponding r.t. values were 35.4 minutes, with the method PFC 2006 B and ca. 47 min. with the method PFC 2006C. The detection limit is below 50 ppm and no interference with hexane occurred in GC-TCD. The calibration curve was obtained using various H-C6F13 solutions (Fig. 22).
0 20 40 60 80 1000.01
0.012
0.014
0.016
0.018
Concentration of H-C6F13 (ppm)
Are
a pe
rcen
t of t
he p
eak
at r.
t. =
47 m
in. (
%)
y=Σan xn
a0=0.0107129a1=5.51448e-050.000735051|r|=0.996961
Fig. 22 – The calibration curve for H-C6F13 content by GC-TCD (method PFC 2006C)
The results on the H-substituted content obtained by GC-TCD method, performed on the studied C6F14 fluids, are summarized in Table 12. No H-substituted perfluoroalkanes were detected, the results being in good agreement with the FT-IR spectroscopy data. Therefore, it can be said that the observed H-containing molecules consist mainly in hexane.
- 22 - Table 12 – H-substituted perfluoroalkanes content in the studied perfluoroalkanes
Code Sample Percent area of the peak
at 47 min. (%)
H-C6F13 content (ppm)
73 0.0036 below the detection limit
68 PF 5060 no peak no detectable 75 0.0026 below the detection limit
61 purified PF 5060 0.0023 “
70 no peak no detectable 72 PF 5060 DL “ “ 62 no peak no detectable 74 PP1 “ “ 77 no peak no detectable 80 FC-72 “ “
In conclusion, - GC-TCD confirmed the conclusions of FT-IR spectroscopy measurements regarding
the existence of H-containing molecules in the C6F14 fluids as received in CERN; the observed H-containing molecules consist mainly in hexane.
- GC-TCD can provide information on the nature of the eventual alkanes present.
4.2.2.2 GC-MSD
The presence of the H-containing molecules can be evidenced by GC-MSD method. The peak of hexane was very clear and no neighboring peaks or shoulders were observed (see Fig. 2 and Table 7). The detection limit was well below 30 ppm (at 30 ppm a small peak is still clearly observed, as is shown in Fig. 23.
23.4 23.5 23.6 23.7 23.8
10000
20000
30000
Time (minutes)
Abu
ndan
ce
C6H14r.t. = 23.57 min.
1
2
3
Fig. 23 – Hexane peak in C F solutions: 1 - purified PF 5060; 2 - 30 ppm; 3 - 300 ppm. The sensitivity of the method is remarkable, owing the recorded abundance of the main peak (n-C F ): ca. 2.3⋅107.
6 14
6 14
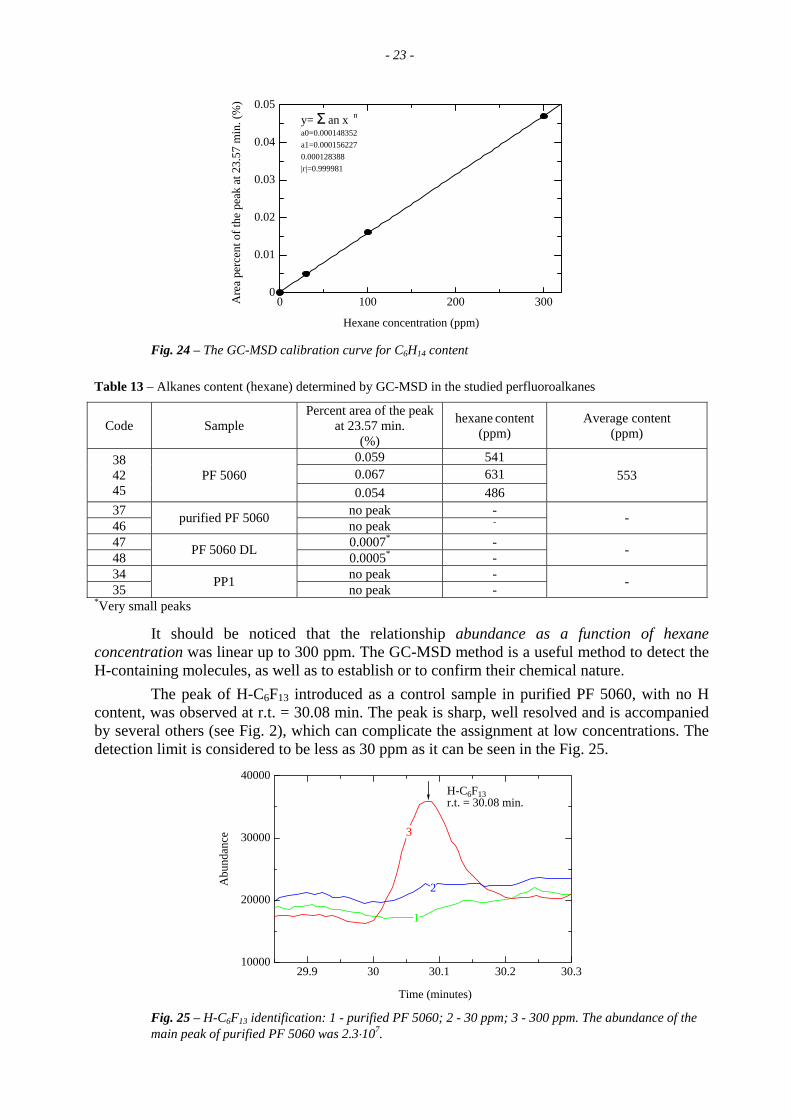
The calibration curve of the hexane concentration was obtained in a similar manner as described in the case of GC-TCD (Fig. 24). The concentration of hexane in the studied C F fluids was then evaluated, the results being summarized in the Table 13 The results and the conclusions are consistent to those of FT-IR spectroscopy, UV-Vis spectrophotometry, as well as GC-TCD.
6 14
- 23 -
0 100 200 3000
0.01
0.02
0.03
0.04
0.05
Hexane concentration (ppm)
Are
a pe
rcen
t of t
he p
eak
at 2
3.57
min
. (%
)
y= Σ an x n
a0=0.000148352a1=0.0001562270.000128388|r|=0.999981
Fig. 24 – The GC-MSD calibration curve for C6H14 content
Table 13 – Alkanes content (hexane) determined by GC-MSD in the studied perfluoroalkanes
Code Sample Percent area of the peak
at 23.57 min. (%)
hexane content (ppm)
Average content (ppm)
0.059 541 0.067 631
38 42 45
PF 5060 0.054 486
553
37 no peak - 46 purified PF 5060 no peak - -
47 0.0007* - 48 PF 5060 DL 0.0005* - -
34 no peak - 35 PP1 no peak - -
*Very small peaks
It should be noticed that the relationship abundance as a function of hexane concentration was linear up to 300 ppm. The GC-MSD method is a useful method to detect the H-containing molecules, as well as to establish or to confirm their chemical nature.
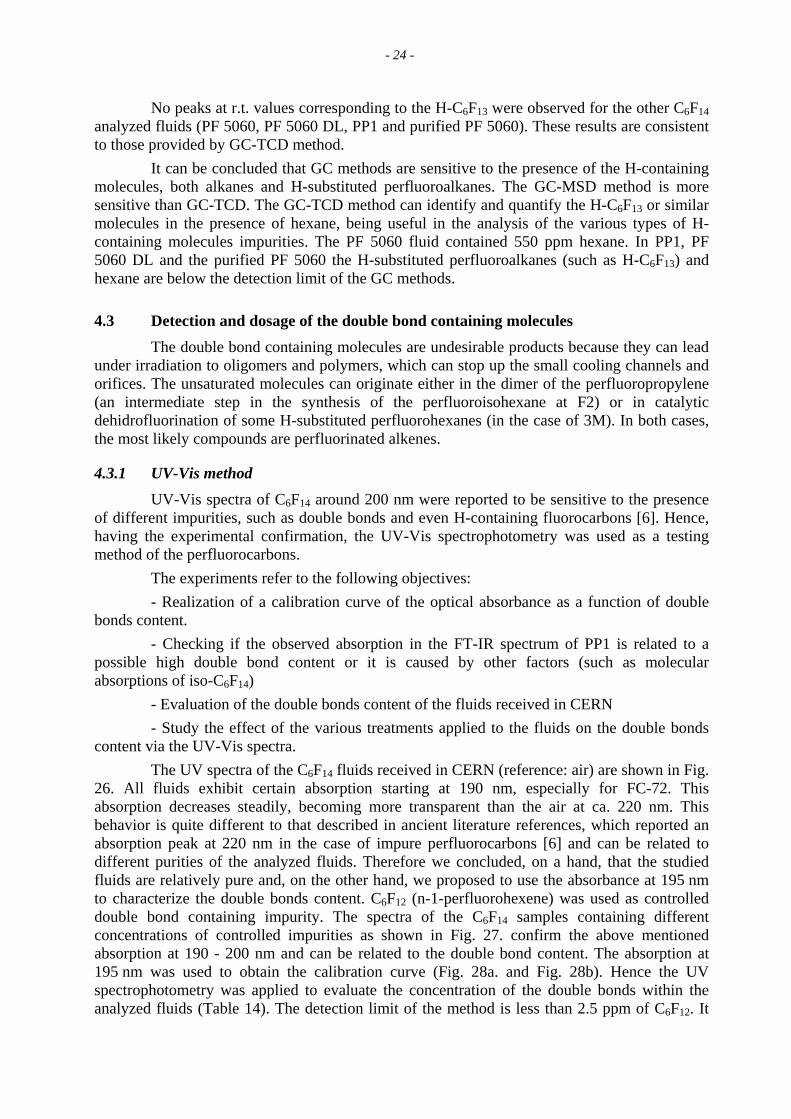
The peak of H-C F introduced as a control sample in purified PF 5060, with no H content, was observed at r.t. = 30.08 min. The peak is sharp, well resolved and is accompanied by several others (see Fig. 2), which can complicate the assignment at low concentrations. The detection limit is considered to be less as 30 ppm as it can be seen in the Fig.
6 13
25.
29.9 30 30.1 30.2 30.310000
20000
30000
40000
Time (minutes)
Abu
ndan
ce
H-C6F13 r.t. = 30.08 min.
1
2
3
Fig. 25 – H-C F identification: 1 - purified PF 5060; 2 - 30 ppm; 3 - 300 ppm. The abundance of the main peak of purified PF 5060 was 2.3⋅10 .
6 137
- 24 -
No peaks at r.t. values corresponding to the H-C6F13 were observed for the other C6F14 analyzed fluids (PF 5060, PF 5060 DL, PP1 and purified PF 5060). These results are consistent to those provided by GC-TCD method.
It can be concluded that GC methods are sensitive to the presence of the H-containing molecules, both alkanes and H-substituted perfluoroalkanes. The GC-MSD method is more sensitive than GC-TCD. The GC-TCD method can identify and quantify the H-C F or similar molecules in the presence of hexane,
6 13 being useful in the analysis of the various types of H-
containing molecules impurities. The PF 5060 fluid contained 550 ppm hexane. In PP1, PF 5060 DL and the purified PF 5060 the H-substituted perfluoroalkanes (such as H-C F ) and hexane are below the detection limit of the GC methods.
6 13
4.3 Detection and dosage of the double bond containing molecules The double bond containing molecules are undesirable products because they can lead
under irradiation to oligomers and polymers, which can stop up the small cooling channels and orifices. The unsaturated molecules can originate either in the dimer of the perfluoropropylene (an intermediate step in the synthesis of the perfluoroisohexane at F2) or in catalytic dehidrofluorination of some H-substituted perfluorohexanes (in the case of 3M). In both cases, the most likely compounds are perfluorinated alkenes.
4.3.1 UV-Vis method UV-Vis spectra of C6F14 around 200 nm were reported to be sensitive to the presence
of different impurities, such as double bonds and even H-containing fluorocarbons [6]. Hence, having the experimental confirmation, the UV-Vis spectrophotometry was used as a testing method of the perfluorocarbons.
The experiments refer to the following objectives: - Realization of a calibration curve of the optical absorbance as a function of double
bonds content. - Checking if the observed absorption in the FT-IR spectrum of PP1 is related to a
possible high double bond content or it is caused by other factors (such as molecular absorptions of iso-C6F14)
- Evaluation of the double bonds content of the fluids received in CERN - Study the effect of the various treatments applied to the fluids on the double bonds
content via the UV-Vis spectra. The UV spectra of the C F fluids received in CERN (reference: air) are shown in Fig.
26. All fluids exhibit certain absorption starting at 190 nm, especially for FC-72. This absorption decreases steadily, becoming more transparent than the air at ca. 220 nm. This behavior is quite different to that described in ancient literature references, which reported an absorption peak at 220 nm in the case of impure perfluorocarbons [6] and can be related to different purities of the analyzed fluids. Therefore we concluded, on a hand, that the studied fluids are relatively pure and, on the other hand, we proposed to use the absorbance at 195 nm to characterize the double bonds content. C F (n-1-perfluorohexene) was used as controlled double bond containing impurity. The spectra of the C F samples containing different concentrations of controlled impurities as shown in Fig. 27. confirm the above mentioned absorption at 190 - 200 nm and can be related to the double bond content. The absorption at 195 nm was used to obtain the calibration curve
6 14
6 12
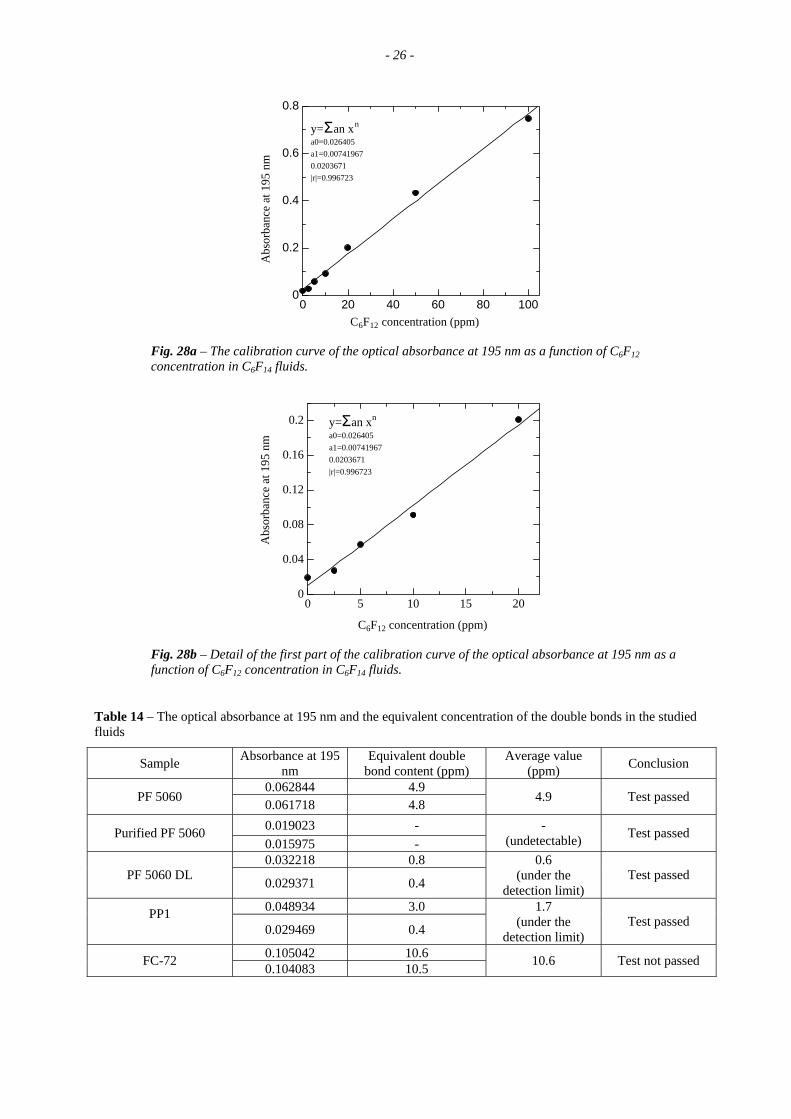
6 14
(Fig. 28a. and Fig. 28b). Hence the UV spectrophotometry was applied to evaluate the concentration of the double bonds within the analyzed fluids (Table 14). The detection limit of the method is less than 2.5 ppm of C F . It 6 12
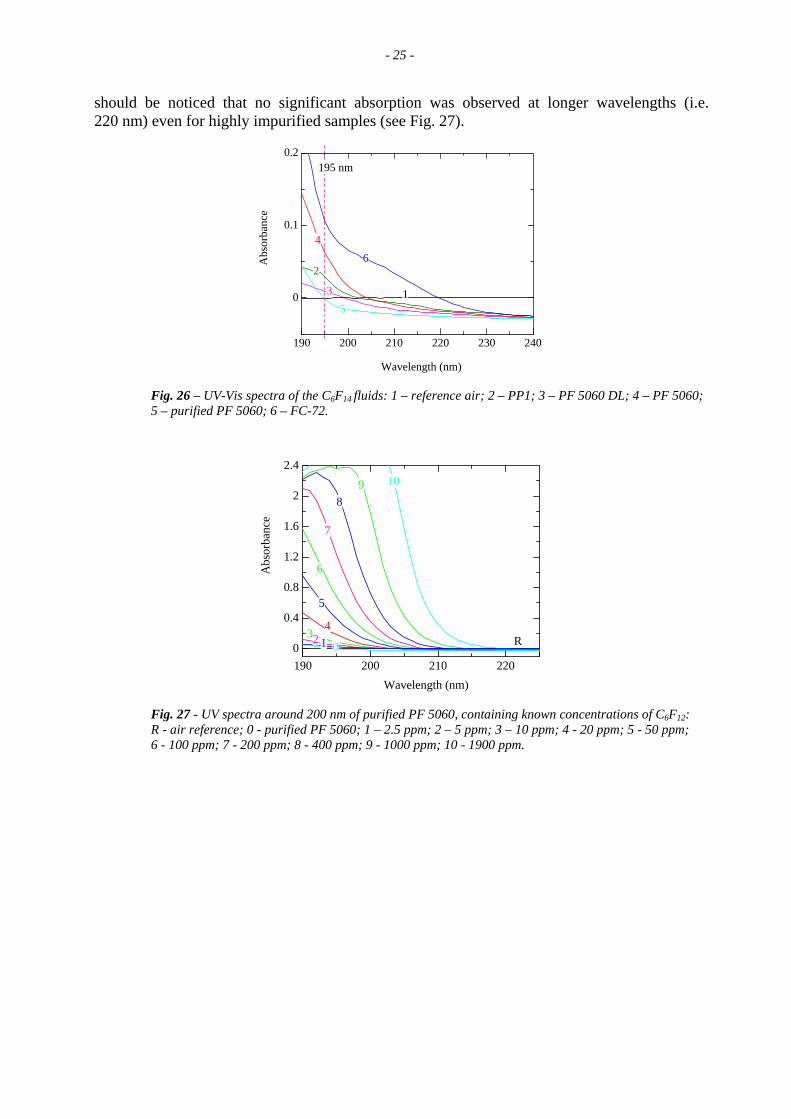
- 25 - should be noticed that no significant absorption was observed at longer wavelengths (i.e. 220 nm) even for highly impurified samples (see Fig. 27).
190 200 210 220 230 240
0
0.1
0.2
Wavelength (nm)
Abs
orba
nce
1
195 nm
46
2
35
Fig. 26 – UV-Vis spectra of the C F fluids: 1 – reference air; 2 – PP1; 3 – PF 5060 DL; 6 14 4 – PF 5060; 5 – purified PF 5060; 6 – FC-72.
190 200 210 2200
0.4
0.8
1.2
1.6
2
2.4
Wavelength (nm)
Abs
orba
nce
0123
1098
4
5
7
R
6
Fig. 27 - UV spectra around 200 nm of purified PF 5060, containing known concentrations of C F : R - air reference; 0 - purified PF 5060; 1 – 2.5 ppm; 2 – 5 ppm;
6 123 – 10 ppm; 4 - 20 ppm; 5 - 50 ppm;
6 - 100 ppm; 7 - 200 ppm; 8 - 400 ppm; 9 - 1000 ppm; 10 - 1900 ppm.
- 26 -
0 20 40 60 80 1000
0.2
0.4
0.6
0.8
C6F12 concentration (ppm)
Abs
orba
nce
at 1
95 n
m
y=Σan xn
a0=0.026405a1=0.007419670.0203671|r|=0.996723
Fig. 28a – The calibration curve of the optical absorbance at 195 nm as a function of C F concentration in
6 12C6F14 fluids.
0 5 10 15 200
0.04
0.08
0.12
0.16
0.2
C6F12 concentration (ppm)
Abs
orba
nce
at 1
95 n
m
y=Σan xn
a0=0.026405a1=0.007419670.0203671|r|=0.996723
Fig. 28b – Detail of the first part of the calibration curve of the optical absorbance at 195 nm as a function of C6F12 concentration in C6F14 fluids.
Table 14 – The optical absorbance at 195 nm and the equivalent concentration of the double bonds in the studied fluids
Sample Absorbance at 195 nm
Equivalent double bond content (ppm)
Average value (ppm) Conclusion
0.062844 4.9 PF 5060 0.061718 4.8 4.9 Test passed
0.019023 - Purified PF 5060 0.015975 -
- (undetectable) Test passed
0.032218 0.8 PF 5060 DL 0.029371 0.4
0.6 (under the
detection limit) Test passed
0.048934 3.0 PP1 0.029469 0.4
1.7 (under the
detection limit) Test passed
0.105042 10.6 FC-72 0.104083 10.5 10.6 Test not passed
- 27 -
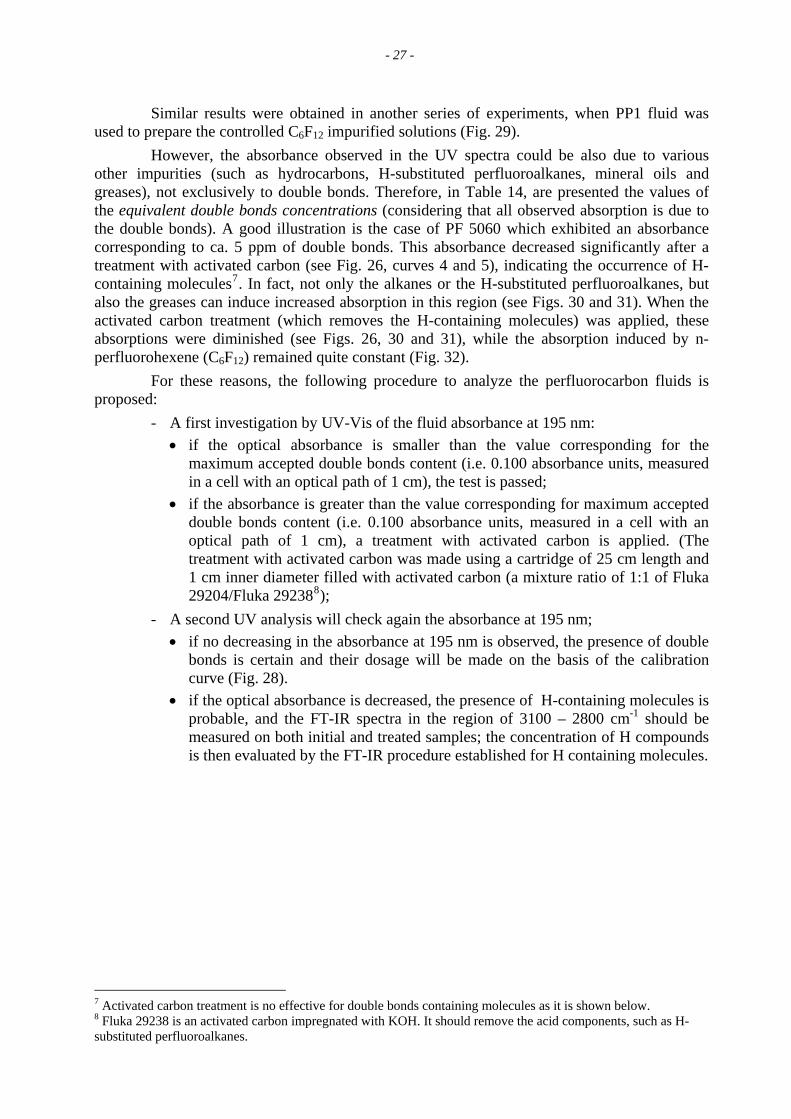
Similar results were obtained in another series of experiments, when PP1 fluid was used to prepare the controlled C6F12 impurified solutions (Fig. 29).
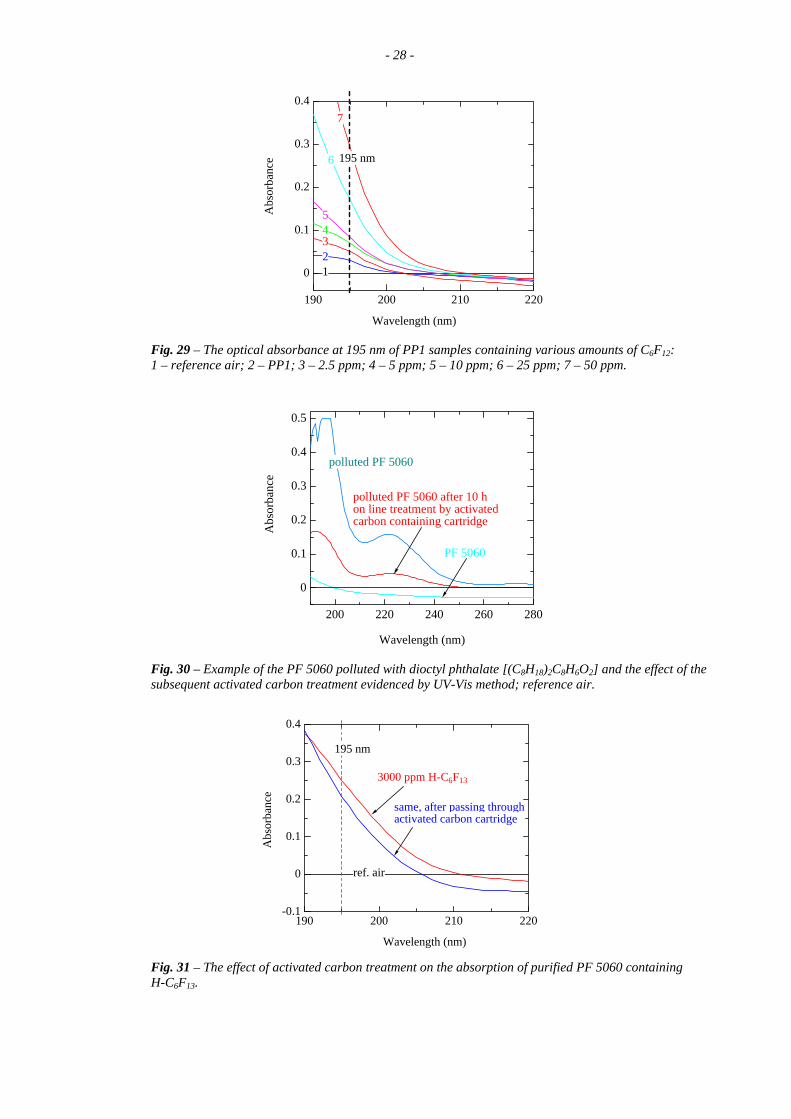
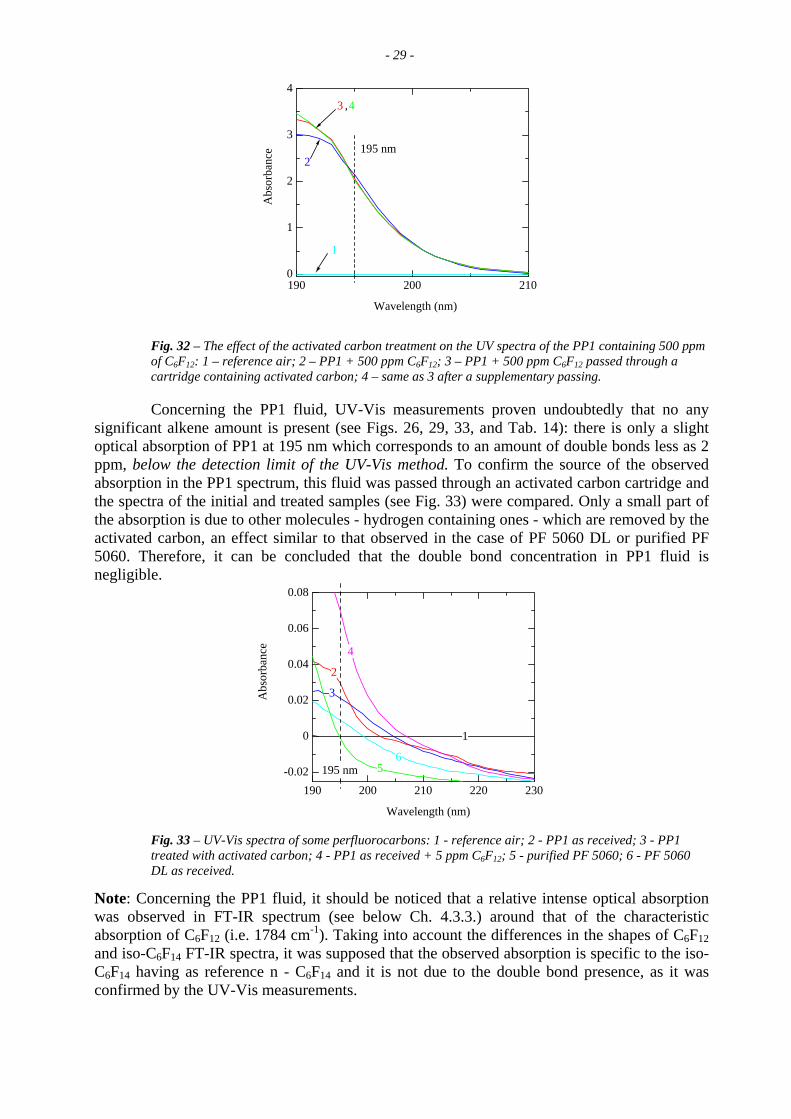
However, the absorbance observed in the UV spectra could be also due to various other impurities (such as hydrocarbons, H-substituted perfluoroalkanes, mineral oils and greases), not exclusively to double bonds. Therefore, in Table 14, are presented the values of the equivalent double bonds concentrations (considering that all observed absorption is due to the double bonds). A good illustration is the case of PF 5060 which exhibited an absorbance corresponding to ca. 5 ppm of double bonds. This absorbance decreased significantly after a treatment with activated carbon (see Fig. 26, curves 4 and 5), indicating the occurrence of H-containing molecules7. In fact, not only the alkanes or the H-substituted perfluoroalkanes, but also the greases can induce increased absorption in this region (see Figs. 30 and 31). When the activated carbon treatment (which removes the H-containing molecules) was applied, these absorptions were diminished (see Figs. 26, 30 and 31), while the absorption induced by n-perfluorohexene (C F ) remained quite constant (Fig. 32). 6 12
For these reasons, the following procedure to analyze the perfluorocarbon fluids is proposed:
- A first investigation by UV-Vis of the fluid absorbance at 195 nm: • if the optical absorbance is smaller than the value corresponding for the
maximum accepted double bonds content (i.e. 0.100 absorbance units, measured in a cell with an optical path of 1 cm), the test is passed;
• if the absorbance is greater than the value corresponding for maximum accepted double bonds content (i.e. 0.100 absorbance units, measured in a cell with an optical path of 1 cm), a treatment with activated carbon is applied. (The treatment with activated carbon was made using a cartridge of 25 cm length and 1 cm inner diameter filled with activated carbon (a mixture ratio of 1:1 of Fluka 29204/Fluka 292388);
- A second UV analysis will check again the absorbance at 195 nm; • if no decreasing in the absorbance at 195 nm is observed, the presence of double
bonds is certain and their dosage will be made on the basis of the calibration curve (Fig. 28).
• if the optical absorbance is decreased, the presence of H-containing molecules is probable, and the FT-IR spectra in the region of 3100 – 2800 cm-1 should be measured on both initial and treated samples; the concentration of H compounds is then evaluated by the FT-IR procedure established for H containing molecules.
7 Activated carbon treatment is no effective for double bonds containing molecules as it is shown below. 8 Fluka 29238 is an activated carbon impregnated with KOH. It should remove the acid components, such as H-substituted perfluoroalkanes.
- 28 -
190 200 210 220
0
0.1
0.2
0.3
0.4
Wavelength (nm)
Abs
orba
nce
1
195 nm
2
7
6
345
Fig. 29 – The optical absorbance at 195 nm of PP1 samples containing various amounts of C F : 1 – reference air; 2 – PP1; 3 – 2.5 ppm; 4 – 5 ppm; 5 – 10 ppm; 6 – 25 ppm; 7 – 50 ppm.
6 12
200 220 240 260 280
0
0.1
0.2
0.3
0.4
0.5
Wavelength (nm)
Abs
orba
nce
PF 5060
polluted PF 5060
polluted PF 5060 after 10 hon line treatment by activated carbon containing cartridge
Fig. 30 – Example of the PF 5060 polluted with dioctyl phthalate [(C H ) C H O ] and the effect of the subsequent activated carbon treatment evidenced by UV-Vis method; reference air.
8 18 2 8 6 2
190 200 210 220-0.1
0
0.1
0.2
0.3
0.4
Wavelength (nm)
Abs
orba
nce
195 nm
3000 ppm H-C6F13 same, after passing through activated carbon cartridge ref. air
Fig. 31 – The effect of activated carbon treatment on the absorption of purified PF 5060 containing H-C F . 6 13
- 29 -
190 200 2100
1
2
3
4
Wavelength (nm)
Abs
orba
nce
2
3 ,4
195 nm
1
Fig. 32 – The effect of the activated carbon treatment on the UV spectra of the PP1 containing 500 ppm of C F : 1 – reference air; 2 – PP1 + 500 ppm C F ; 3 – PP1 + 500 ppm C F passed through a cartridge containing activated carbon; 4 – same as 3 after a supplementary passing.
6 12 6 12 6 12
Concerning the PP1 fluid, UV-Vis measurements proven undoubtedly that no any significant alkene amount is present (see Figs. 26, 29, 33, and Tab. 14): there is only a slight optical absorption of PP1 at 195 nm which corresponds to an amount of double bonds less as 2 ppm, below the detection limit of the UV-Vis method. To confirm the source of the observed absorption in the PP1 spectrum, this fluid was passed through an activated carbon cartridge and the spectra of the initial and treated samples (see Fig. 33) were compared. Only a small part of the absorption is due to other molecules - hydrogen containing ones - which are removed by the activated carbon, an effect similar to that observed in the case of PF 5060 DL or purified PF 5060. Therefore, it can be concluded that the double bond concentration in PP1 fluid is negligible.
190 200 210 220 230-0.02
0
0.02
0.04
0.06
0.08
Wavelength (nm)
Abs
orba
nce
195 nm
1
3
4
5
2
6
Fig. 33 – UV-Vis spectra of some perfluorocarbons: 1 - reference air; 2 - PP1 as received; 3 - PP1 treated with activated carbon; 4 - PP1 as received + 5 ppm C6F12; 5 - purified PF 5060; 6 - PF 5060 DL as received.
Note: Concerning the PP1 fluid, it should be noticed that a relative intense optical absorption was observed in FT-IR spectrum (see below Ch. 4.3.3.) around that of the characteristic absorption of C6F12 (i.e. 1784 cm-1). Taking into account the differences in the shapes of C6F12 and iso-C6F14 FT-IR spectra, it was supposed that the observed absorption is specific to the iso-C6F14 having as reference n - C6F14 and it is not due to the double bond presence, as it was confirmed by the UV-Vis measurements.
- 30 - 4.3.2 GC-MS method
1-C6F12 (1 - perfluorohexene, named below C6F12) was used as control sample for detection and dosage of the double bonds in the studied C6F14 fluids.
GC-TCD method was no applicable because C6F12 was eluted, perhaps together the main peak.
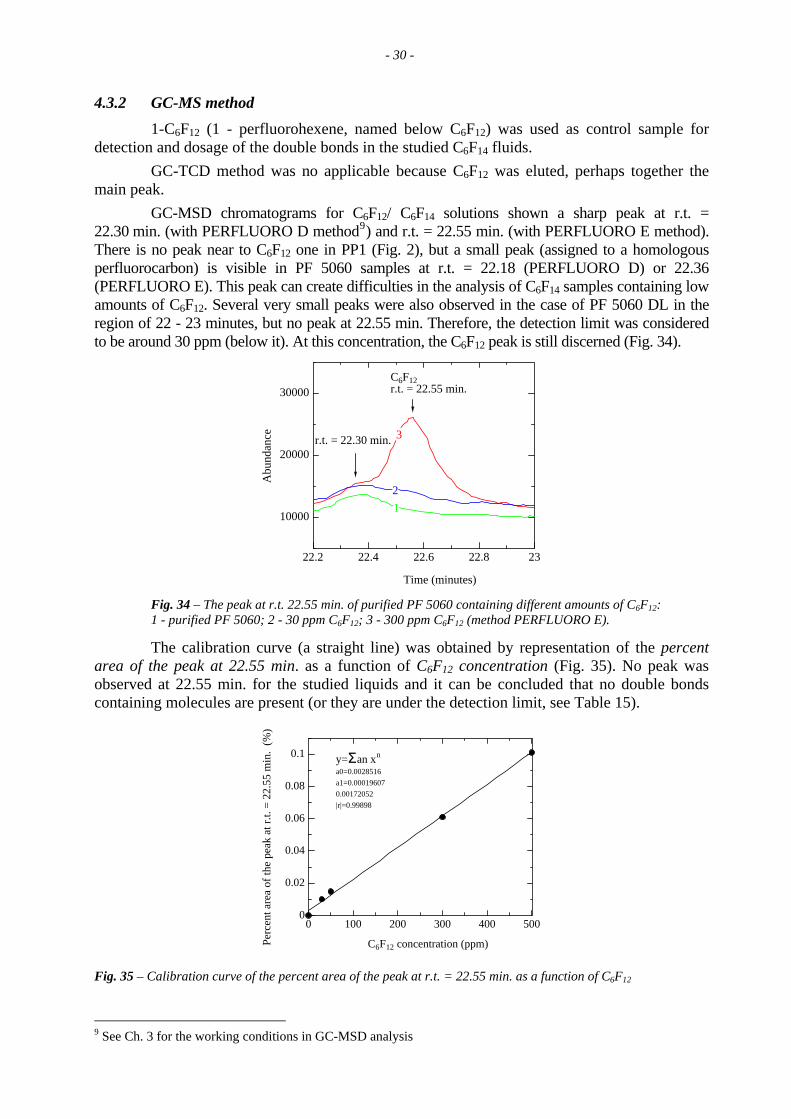
GC-MSD chromatograms for C6F12/ C6F14 solutions shown a sharp peak at r.t. = 22.30 min. (with PERFLUORO D method9) and r.t. = 22.55 min. (with PERFLUORO E method). There is no peak near to C6F12 one in PP1 (Fig. 2), but a small peak (assigned to a homologous perfluorocarbon) is visible in PF 5060 samples at r.t. = 22.18 (PERFLUORO D) or 22.36 (PERFLUORO E). This peak can create difficulties in the analysis of C6F14 samples containing low amounts of C6F12. Several very small peaks were also observed in the case of PF 5060 DL in the region of 22 - 23 minutes, but no peak at 22.55 min. Therefore, the detection limit was considered to be around 30 ppm (below it). At this concentration, the C6F12 peak is still discerned (Fig. 34).
22.2 22.4 22.6 22.8 23
10000
20000
30000
Time (minutes)
Abu
ndan
ce
1
C6F12r.t. = 22.55 min.
r.t. = 22.30 min.
2
3
Fig. 34 – The peak at r.t. 22.55 min. of purified PF 5060 containing different amounts of C6F12: 1 - purified PF 5060; 2 - 30 ppm C6F12; 3 - 300 ppm C6F12 (method PERFLUORO E).
The calibration curve (a straight line) was obtained by representation of the percent area of the peak at 22.55 min. as a function of C6F12 concentration (Fig. 35). No peak was observed at 22.55 min. for the studied liquids and it can be concluded that no double bonds containing molecules are present (or they are under the detection limit, see Table 15).
0 100 200 300 400 5000
0.02
0.04
0.06
0.08
0.1
C6F12 concentration (ppm)Perc
ent a
rea
of th
e pe
ak a
t r.t.
= 2
2.55
min
. (%
)
y=Σan xn
a0=0.0028516a1=0.000196070.00172052|r|=0.99898
Fig. 35 – Calibration curve of the percent area of the peak at r.t. = 22.55 min. as a function of C6F12
9 See Ch. 3 for the working conditions in GC-MSD analysis
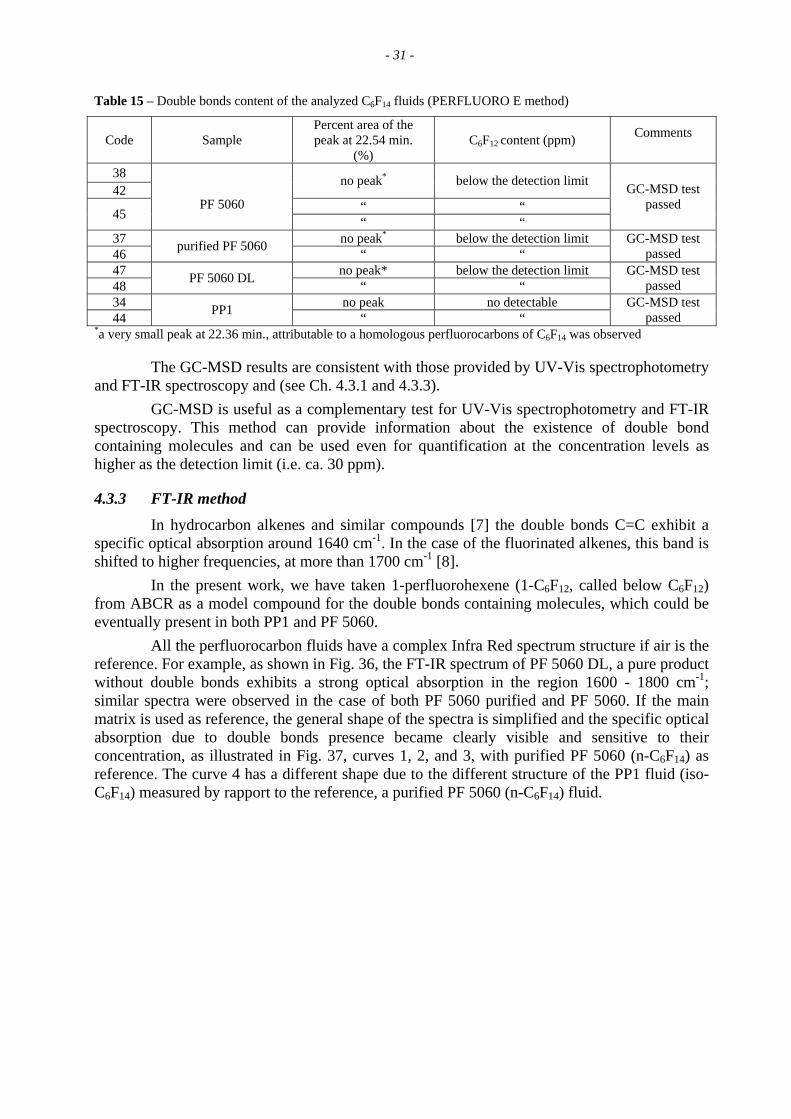
- 31 - Table 15 – Double bonds content of the analyzed C6F14 fluids (PERFLUORO E method)
Code Sample Percent area of the peak at 22.54 min.
(%) C6F12 content (ppm) Comments
38 42
no peak* below the detection limit
“ “ 45
PF 5060
“ “
GC-MSD test passed
37 no peak* below the detection limit
46 purified PF 5060 “ “ GC-MSD test
passed 47 no peak* below the detection limit 48 PF 5060 DL “ “
GC-MSD test passed
34 no peak no detectable 44 PP1 “ “
GC-MSD test passed
*a very small peak at 22.36 min., attributable to a homologous perfluorocarbons of C6F14 was observed
The GC-MSD results are consistent with those provided by UV-Vis spectrophotometry and FT-IR spectroscopy and (see Ch. 4.3.1 and 4.3.3).
GC-MSD is useful as a complementary test for UV-Vis spectrophotometry and FT-IR spectroscopy. This method can provide information about the existence of double bond containing molecules and can be used even for quantification at the concentration levels as higher as the detection limit (i.e. ca. 30 ppm).
4.3.3 FT-IR method In hydrocarbon alkenes and similar compounds [7] the double bonds C=C exhibit a
specific optical absorption around 1640 cm-1. In the case of the fluorinated alkenes, this band is shifted to higher frequencies, at more than 1700 cm-1 [8].
In the present work, we have taken 1-perfluorohexene (1-C6F12, called below C6F12) from ABCR as a model compound for the double bonds containing molecules, which could be eventually present in both PP1 and PF 5060.
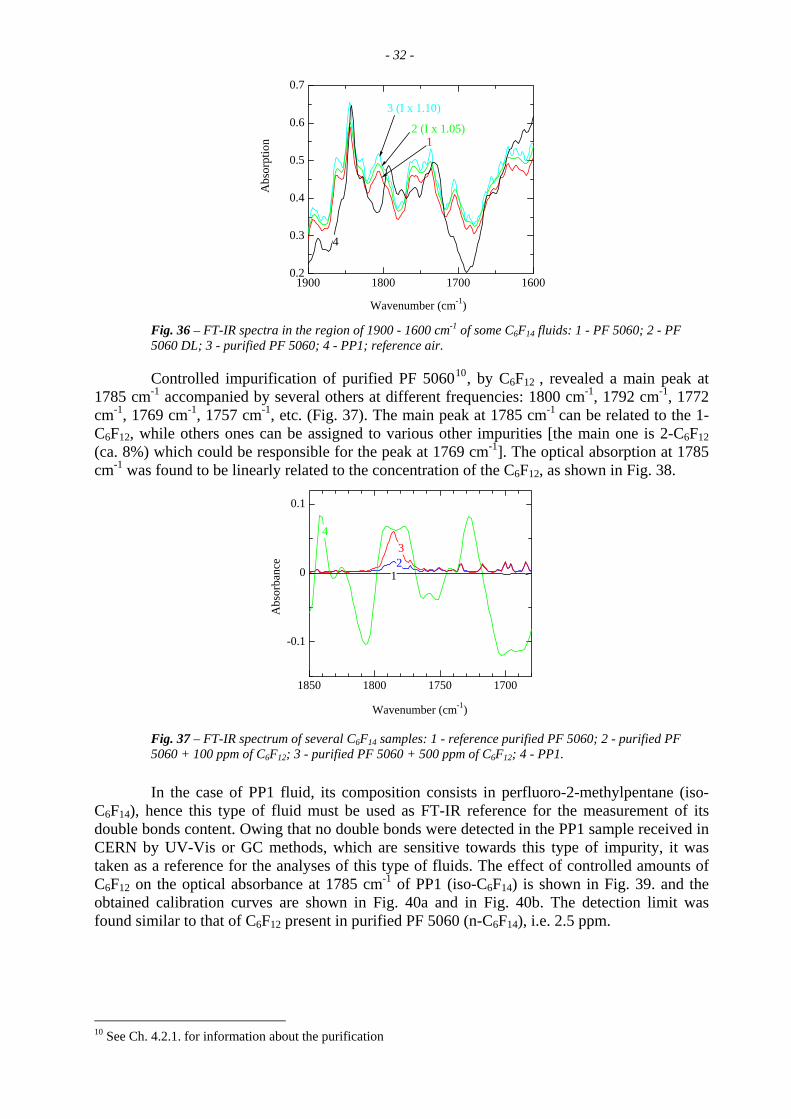
All the perfluorocarbon fluids have a complex Infra Red spectrum structure if air is the reference. For example, as shown in Fig. 36, the FT-IR spectrum of PF 5060 DL, a pure product without double bonds exhibits a strong optical absorption in the region 1600 - 1800 cm-1; similar spectra were observed in the case of both PF 5060 purified and PF 5060. If the main matrix is used as reference, the general shape of the spectra is simplified and the specific optical absorption due to double bonds presence became clearly visible and sensitive to their concentration, as illustrated in Fig. 37, curves 1, 2, and 3, with purified PF 5060 (n-C6F14) as reference. The curve 4 has a different shape due to the different structure of the PP1 fluid (iso-C6F14) measured by rapport to the reference, a purified PF 5060 (n-C6F14) fluid.
- 32 -
16001700180019000.2
0.3
0.4
0.5
0.6
0.7
Wavenumber (cm-1)
Abs
orpt
ion
1
3 (I x 1.10)
2 (I x 1.05)
4
Fig. 36 – FT-IR spectra in the region of 1900 - 1600 cm of some C F fluids: 1 - PF 5060; 2 - PF 5060 DL; 3 - purified PF 5060; 4 - PP1; reference air.
-16 14
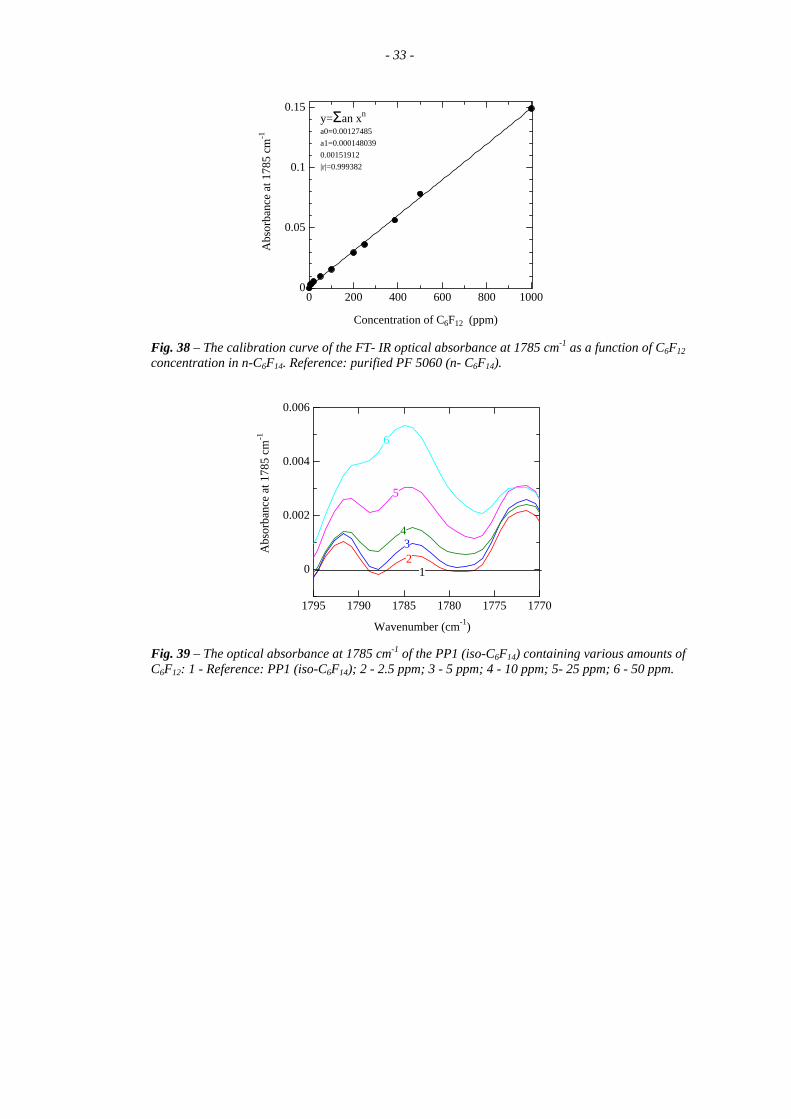
Controlled impurification of purified PF 506010, by C6F12 , revealed a main peak at 1785 cm-1 accompanied by several others at different frequencies: 1800 cm-1, 1792 cm-1, 1772 cm-1, 1769 cm-1, 1757 cm-1, etc. (Fig. 37). The main peak at 1785 cm-1 can be related to the 1-C6F12, while others ones can be assigned to various other impurities [the main one is 2-C6F12 (ca. 8%) which could be responsible for the peak at 1769 cm-1]. The optical absorption at 1785 cm-1 was found to be linearly related to the concentration of the C6F12, as shown in Fig. 38.
1700175018001850
-0.1
0
0.1
Wavenumber (cm-1)
Abs
orba
nce
1
4
2
3
Fig. 37 – FT-IR spectrum of several C F samples: 1 - reference purified PF 5060; 2 - purified PF 5060 + 100 ppm of C F ; 3 - purified PF 5060 + 500 ppm of C F ; 4 - PP1.
6 14
6 12 6 12
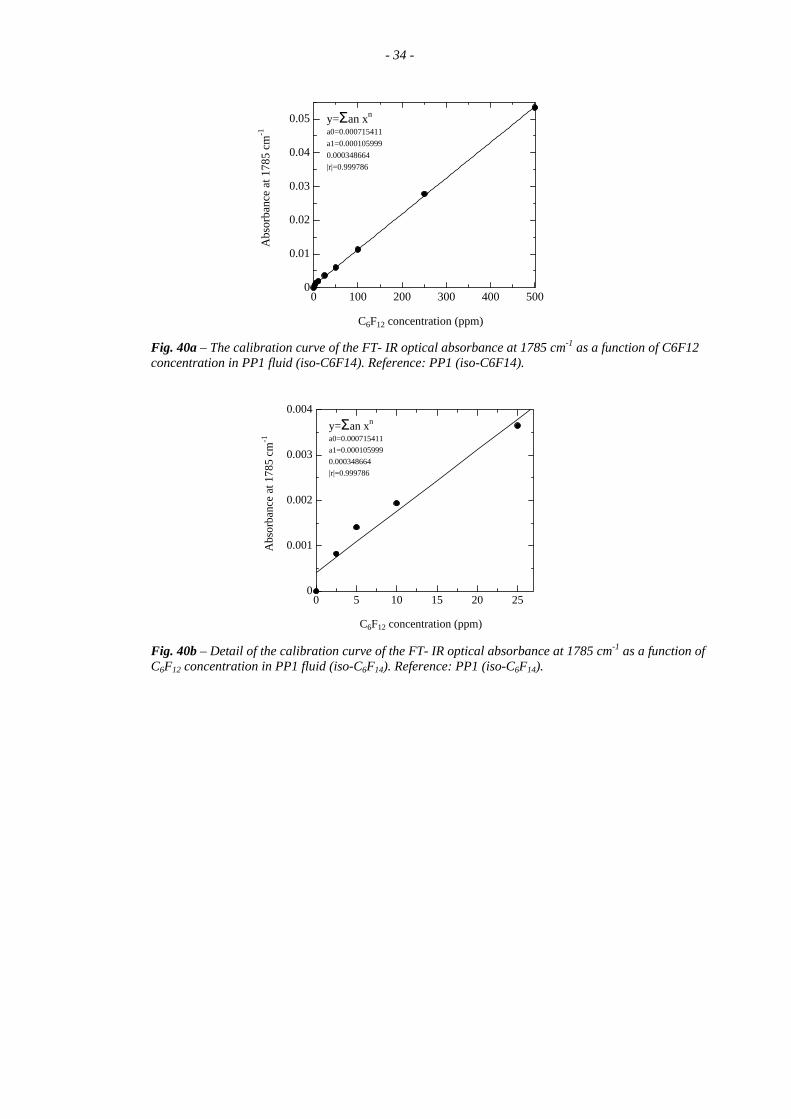
In the case of PP1 fluid, its composition consists in perfluoro-2-methylpentane (iso-C6F14), hence this type of fluid must be used as FT-IR reference for the measurement of its double bonds content. Owing that no double bonds were detected in the PP1 sample received in CERN by UV-Vis or GC methods, which are sensitive towards this type of impurity, it was taken as a reference for the analyses of this type of fluids. The effect of controlled amounts of C6F12 on the optical absorbance at 1785 cm-1 of PP1 (iso-C6F14) is shown in Fig. 39. and the obtained calibration curves are shown in Fig. 40a and in Fig. 40b. The detection limit was found similar to that of C6F12 present in purified PF 5060 (n-C6F14), i.e. 2.5 ppm.
10 See Ch. 4.2.1. for information about the purification
- 33 -
0 200 400 600 800 10000
0.05
0.1
0.15
Concentration of C6F12 (ppm)
Abs
orba
nce
at 1
785
cm-1
y=Σan xn
a0=0.00127485a1=0.0001480390.00151912|r|=0.999382
Fig. 38 – The calibration curve of the FT- IR optical absorbance at 1785 cm-1 as a function of C F concentration in n-C F . Reference: purified PF 5060 (n- C F ).
6 12
6 14 6 14
177017751780178517901795
0
0.002
0.004
0.006
Wavenumber (cm-1)
Abs
orba
nce
at 1
785
cm-1
1
6
5
Fig. 39 – The optical absorbance at 1785 cm-1 of the PP1 (iso-C6F14) containing various amounts of C6F12: 1 - Reference: PP1 (iso-C6F14); 2 - 2.5 ppm; 3 - 5 ppm; 4 - 10 ppm; 5- 25 ppm; 6 - 50 ppm.
23
4
- 34 -
0 100 200 300 400 5000
0.01
0.02
0.03
0.04
0.05
C6F12 concentration (ppm)
Abs
orba
nce
at 1
785
cm-1
y=Σan xn
a0=0.000715411a1=0.0001059990.000348664|r|=0.999786
Fig. 40a – The calibration curve of the FT- IR optical absorbance at 1785 cm-1 as a function of C6F12 concentration in PP1 fluid (iso-C6F14). Reference: PP1 (iso-C6F14).
0 5 10 15 20 250
0.001
0.002
0.003
0.004
C6F12 concentration (ppm)
Abs
orba
nce
at 1
785
cm-1
y=Σan xn
a0=0.000715411a1=0.0001059990.000348664|r|=0.999786
Fig. 40b – Detail of the calibration curve of the FT- IR optical absorbance at 1785 cm-1 as a function of C6F12 concentration in PP1 fluid (iso-C6F14). Reference: PP1 (iso-C6F14).
- 35 - 4.4 KM O test for the reducing agents n 4
Potassium permanganate (KMnO4) is well known to produce the oxidation of the double bonds containing hydrocarbons; therefore it could be a useful test for detection of double bonds containing molecules. F2 - Chemicals proposed a method (FC-40-116) for determination of the reducing agents, e.g. double bonds in the perfluorocarbon fluids based on KMnO4 oxidation [9]. The test is based on the visual observation of the initial KMnO4 solution discoloration or on the appearance of a precipitate.
In this work, we checked the effectiveness of the method to detect the perfluoroalkene (double bonds containing perfluorinated molecules). The recommended procedure of F2-Chemicals was applied to various C6F14 fluids. Thus, the following steps were realized:
- preparation of a KMnO4 solution (FC-40-116): 0.040 g of KMnO4 (pro analysis grade) was introduced in a 25 mL aliquot and acetone was added to reach 25 mL volume; then, the mixture was shaken to obtain a clear solution;
- 10 mL of the C6F14 sample under test were pipetted into a 25 mL aliquot; 1 mL of the acetone/ KMnO4 solution was then added and the resultant mixture was shaken for 20 minutes;
- after the separation of the two layers, the upper permanganate layer was examined for signs of a precipitate or for a color fading .
No changing in the color was observed with PP1, PF 5060 DL or purified PF 5060. Slight modification was observed in the case of PF 5060, and this can be assigned to oxidation of hexane or similar H-containing molecules.
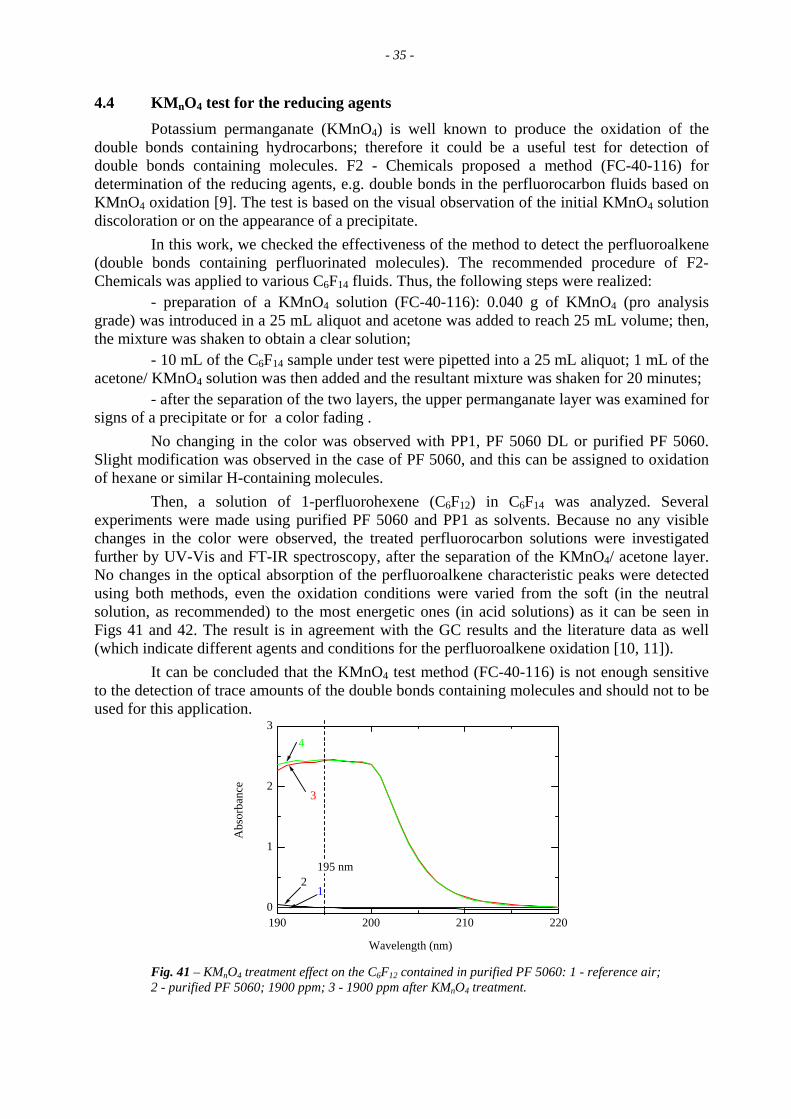
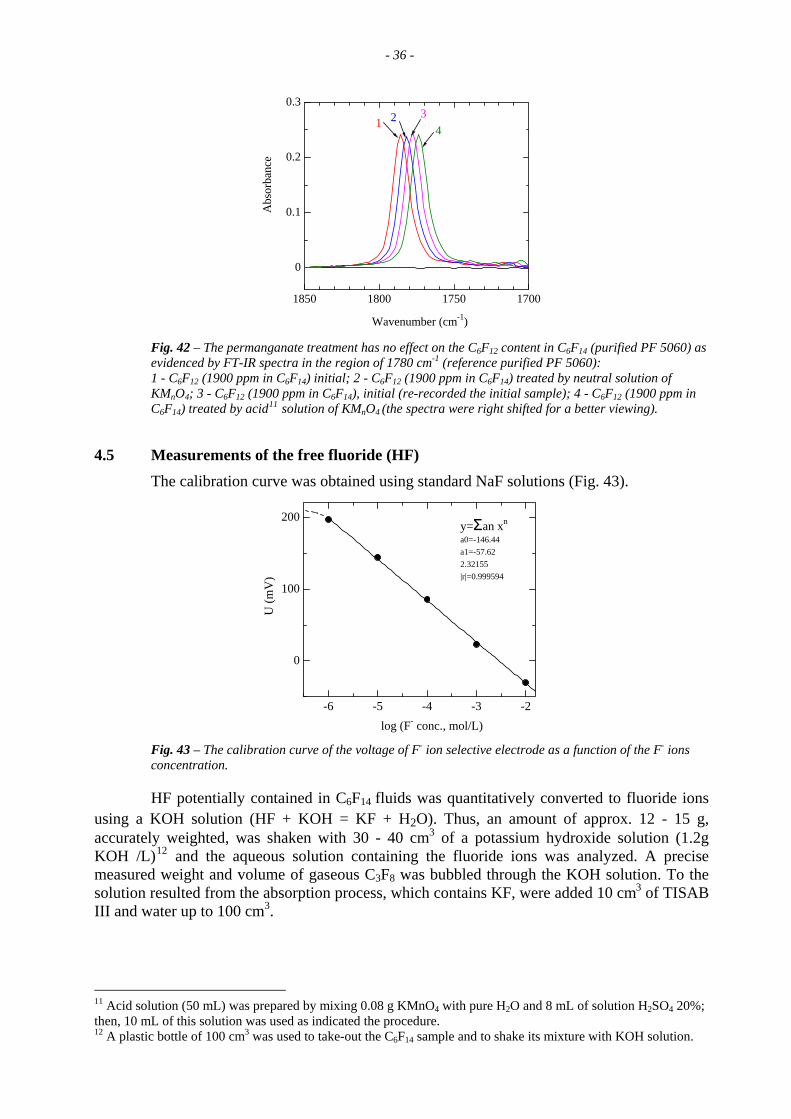
Then, a solution of 1-perfluorohexene (C6F12) in C6F14 was analyzed. Several experiments were made using purified PF 5060 and PP1 as solvents. Because no any visible changes in the color were observed, the treated perfluorocarbon solutions were investigated further by UV-Vis and FT-IR spectroscopy, after the separation of the KMnO4/ acetone layer. No changes in the optical absorption of the perfluoroalkene characteristic peaks were detected using both methods, even the oxidation conditions were varied from the soft (in the neutral solution, as recommended) to the most energetic ones (in acid solutions) as it can be seen in Figs 41 and 42. The result is in agreement with the GC results and the literature data as well (which indicate different agents and conditions for the perfluoroalkene oxidation [10, 11]).
It can be concluded that the KMnO4 test method (FC-40-116) is not enough sensitive to the detection of trace amounts of the double bonds containing molecules and should not to be used for this application.
190 200 210 2200
1
2
3
Wavelength (nm)
Abs
orba
nce
1
195 nm2
4
3
Fig. 41 – KM O treatment effect on the C F contained in purified PF 5060: 1 - reference air; 2 - purified PF 5060; 1900 ppm; 3 - 1900 ppm after KM O treatment.
n 4 6 12
n 4
- 36 -
1700175018001850
0
0.1
0.2
0.3
Wavenumber (cm-1)
Abs
orba
nce
2 3 1 4
Fig. 42 – The permanganate treatment has no effect on the C6F12 content in C6F14 (purified PF 5060) as evidenced by FT-IR spectra in the region of 1780 cm-1 (reference purified PF 5060): 1 - C6F12 (1900 ppm in C6F14) initial; 2 - C6F12 (1900 ppm in C6F14) treated by neutral solution of KMnO4; 3 - C6F12 (1900 ppm in C6F14), initial (re-recorded the initial sample); 4 - C6F12 (1900 ppm in C6F14) treated by acid11 solution of KM O (the spectra were right shifted for a better viewing). n 4
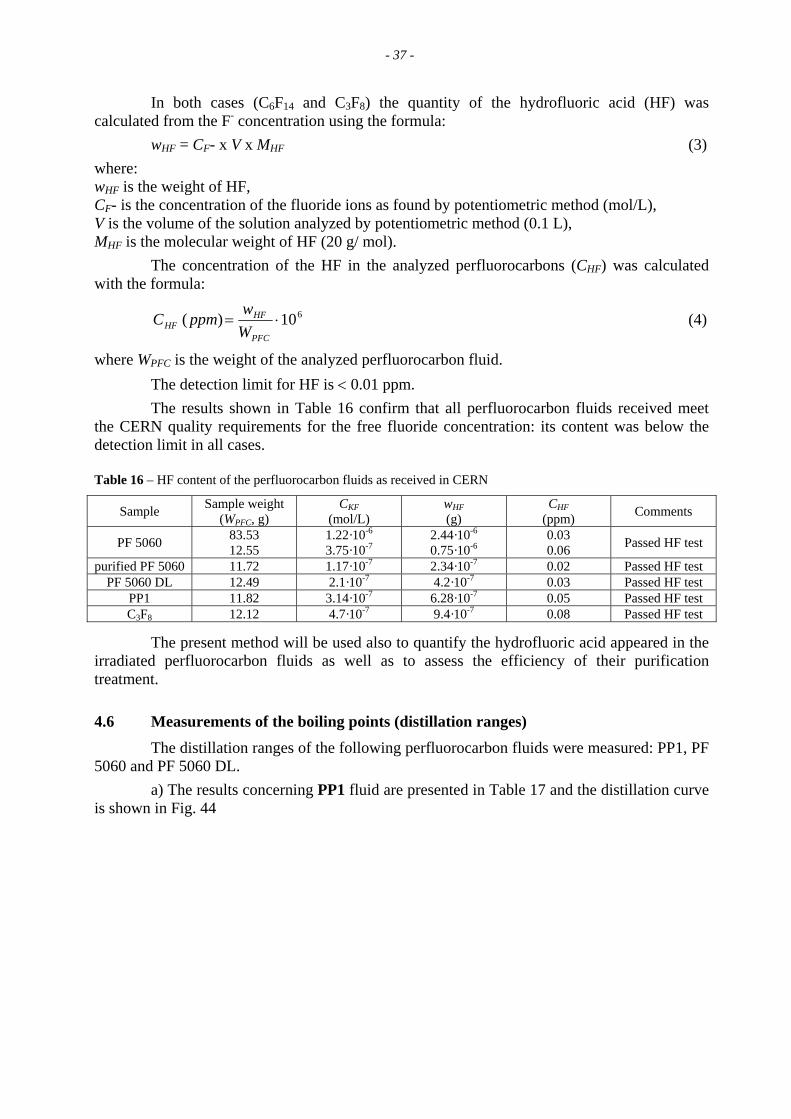
4.5 Measurements of the free fluoride (HF) The calibration curve was obtained using standard NaF solutions (Fig. 43).
-6 -5 -4 -3 -2
0
100
200
log (F- conc., mol/L)
U (m
V)
y=Σan xn
a0=-146.44a1=-57.622.32155|r|=0.999594
Fig. 43 – The calibration curve of the voltage of F- ion selective electrode as a function of the F- ions concentration.
HF potentially contained in C6F14 fluids was quantitatively converted to fluoride ions using a KOH solution (HF + KOH = KF + H2O). Thus, an amount of approx. 12 - 15 g, accurately weighted, was shaken with 30 - 40 cm3 of a potassium hydroxide solution (1.2g KOH /L)12 and the aqueous solution containing the fluoride ions was analyzed. A precise measured weight and volume of gaseous C3F8 was bubbled through the KOH solution. To the solution resulted from the absorption process, which contains KF, were added 10 cm3 of TISAB III and water up to 100 cm3.
11 Acid solution (50 mL) was prepared by mixing 0.08 g KMnO4 with pure H2O and 8 mL of solution H2SO4 20%; then, 10 mL of this solution was used as indicated the procedure. 12 A plastic bottle of 100 cm3 was used to take-out the C6F14 sample and to shake its mixture with KOH solution.
- 37 -
In both cases (C6F14 and C3F8) the quantity of the hydrofluoric acid (HF) was calculated from the F- concentration using the formula:
wHF = CF- x V x MHF (3) where: wHF is the weight of HF, CF- is the concentration of the fluoride ions as found by potentiometric method (mol/L), V is the volume of the solution analyzed by potentiometric method (0.1 L), MHF is the molecular weight of HF (20 g/ mol).
The concentration of the HF in the analyzed perfluorocarbons (CHF) was calculated with the formula:
610)( ⋅=PFC
HFHF W
wppmC (4)
where WPFC is the weight of the analyzed perfluorocarbon fluid. The detection limit for HF is < 0.01 ppm. The results shown in Table 16 confirm that all perfluorocarbon fluids received meet
the CERN quality requirements for the free fluoride concentration: its content was below the detection limit in all cases. Table 16 – HF content of the perfluorocarbon fluids as received in CERN
Sample Sample weight (WPFC, g)
CKF (mol/L)
wHF (g)
CHF (ppm) Comments
PF 5060 83.53 12.55
1.22·10-6
3.75·10-72.44·10-6
0.75·10-60.03 0.06 Passed HF test
purified PF 5060 11.72 1.17·10-7 2.34·10-7 0.02 Passed HF test PF 5060 DL 12.49 2.1·10-7 4.2·10-7 0.03 Passed HF test
PP1 11.82 3.14·10-7 6.28·10-7 0.05 Passed HF test C3F8 12.12 4.7·10-7 9.4·10-7 0.08 Passed HF test
The present method will be used also to quantify the hydrofluoric acid appeared in the irradiated perfluorocarbon fluids as well as to assess the efficiency of their purification treatment.
4.6 Measurements of the boiling points (distillation ranges) The distillation ranges of the following perfluorocarbon fluids were measured: PP1, PF
5060 and PF 5060 DL. a) The results concerning PP1 fluid are presented in Table 17 and the distillation curve
is shown in Fig. 44
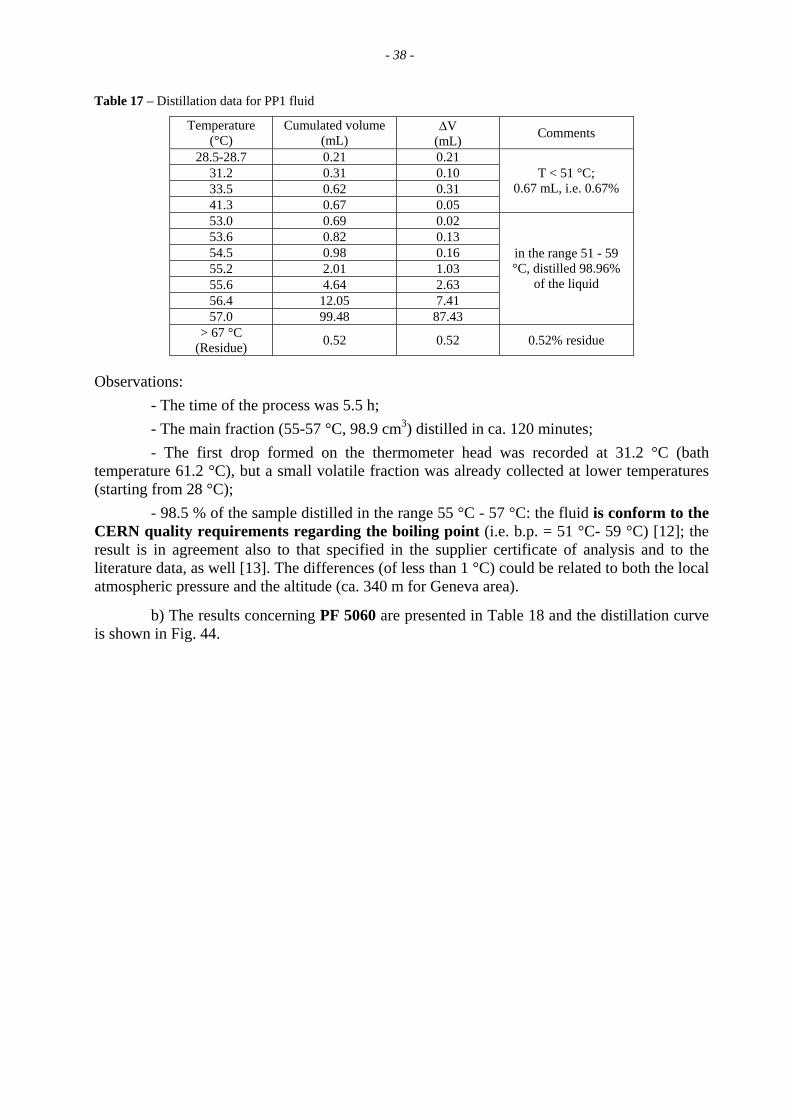
- 38 - Table 17 – Distillation data for PP1 fluid
Temperature (°C)
Cumulated volume (mL)
ΔV (mL) Comments
28.5-28.7 0.21 0.21 31.2 0.31 0.10 33.5 0.62 0.31 41.3 0.67 0.05
T < 51 °C; 0.67 mL, i.e. 0.67%
53.0 0.69 0.02 53.6 0.82 0.13 54.5 0.98 0.16 55.2 2.01 1.03 55.6 4.64 2.63 56.4 12.05 7.41 57.0 99.48 87.43
in the range 51 - 59 °C, distilled 98.96%
of the liquid
> 67 °C (Residue) 0.52 0.52 0.52% residue
Observations: - The time of the process was 5.5 h; - The main fraction (55-57 °C, 98.9 cm3) distilled in ca. 120 minutes; - The first drop formed on the thermometer head was recorded at 31.2 °C (bath
temperature 61.2 °C), but a small volatile fraction was already collected at lower temperatures (starting from 28 °C);
- 98.5 % of the sample distilled in the range 55 °C - 57 °C: the fluid is conform to the CERN quality requirements regarding the boiling point (i.e. b.p. = 51 °C- 59 °C) [12]; the result is in agreement also to that specified in the supplier certificate of analysis and to the literature data, as well [13]. The differences (of less than 1 °C) could be related to both the local atmospheric pressure and the altitude (ca. 340 m for Geneva area).
b) The results concerning PF 5060 are presented in Table 18 and the distillation curve is shown in Fig. 44.
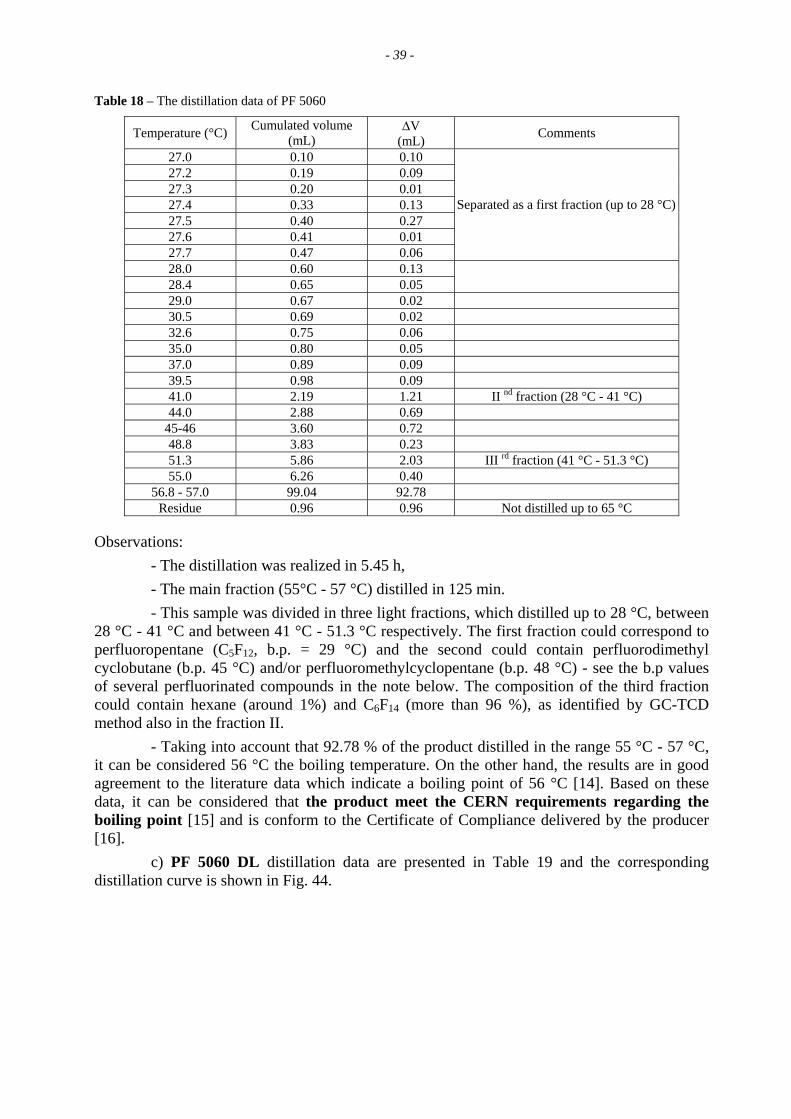
- 39 - Table 18 – The distillation data of PF 5060
Temperature (°C) Cumulated volume (mL)
ΔV (mL) Comments
27.0 0.10 0.10 27.2 0.19 0.09 27.3 0.20 0.01 27.4 0.33 0.13 27.5 0.40 0.27 27.6 0.41 0.01 27.7 0.47 0.06
Separated as a first fraction (up to 28 °C)
28.0 0.60 0.13 28.4 0.65 0.05
29.0 0.67 0.02 30.5 0.69 0.02 32.6 0.75 0.06 35.0 0.80 0.05 37.0 0.89 0.09 39.5 0.98 0.09 41.0 2.19 1.21 II nd fraction (28 °C - 41 °C)44.0 2.88 0.69
45-46 3.60 0.72 48.8 3.83 0.23 51.3 5.86 2.03 III rd fraction (41 °C - 51.3 °C)55.0 6.26 0.40
56.8 - 57.0 99.04 92.78 Residue 0.96 0.96 Not distilled up to 65 °C
Observations: - The distillation was realized in 5.45 h, - The main fraction (55°C - 57 °C) distilled in 125 min. - This sample was divided in three light fractions, which distilled up to 28 °C, between
28 °C - 41 °C and between 41 °C - 51.3 °C respectively. The first fraction could correspond to perfluoropentane (C5F12, b.p. = 29 °C) and the second could contain perfluorodimethyl cyclobutane (b.p. 45 °C) and/or perfluoromethylcyclopentane (b.p. 48 °C) - see the b.p values of several perfluorinated compounds in the note below. The composition of the third fraction could contain hexane (around 1%) and C6F14 (more than 96 %), as identified by GC-TCD method also in the fraction II.
- Taking into account that 92.78 % of the product distilled in the range 55 °C - 57 °C, it can be considered 56 °C the boiling temperature. On the other hand, the results are in good agreement to the literature data which indicate a boiling point of 56 °C [14]. Based on these data, it can be considered that the product meet the CERN requirements regarding the boiling point [15] and is conform to the Certificate of Compliance delivered by the producer [16].
c) PF 5060 DL distillation data are presented in Table 19 and the corresponding distillation curve is shown in Fig. 44.
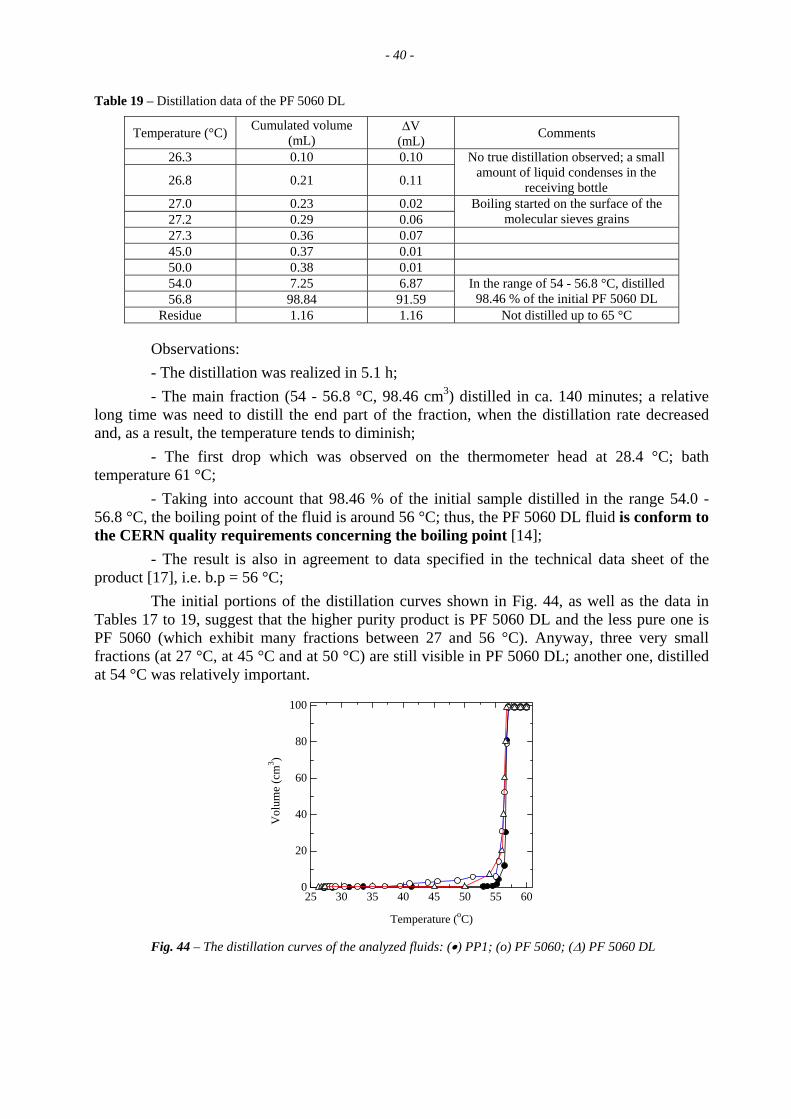
- 40 - Table 19 – Distillation data of the PF 5060 DL
Temperature (°C) Cumulated volume (mL)
ΔV (mL) Comments
26.3 0.10 0.10
26.8 0.21 0.11
No true distillation observed; a small amount of liquid condenses in the
receiving bottle 27.0 0.23 0.02 27.2 0.29 0.06
Boiling started on the surface of the molecular sieves grains
27.3 0.36 0.07 45.0 0.37 0.01 50.0 0.38 0.01 54.0 7.25 6.87 56.8 98.84 91.59
In the range of 54 - 56.8 °C, distilled 98.46 % of the initial PF 5060 DL
Residue 1.16 1.16 Not distilled up to 65 °C
Observations: - The distillation was realized in 5.1 h; - The main fraction (54 - 56.8 °C, 98.46 cm3) distilled in ca. 140 minutes; a relative
long time was need to distill the end part of the fraction, when the distillation rate decreased and, as a result, the temperature tends to diminish;
- The first drop which was observed on the thermometer head at 28.4 °C; bath temperature 61 °C;
- Taking into account that 98.46 % of the initial sample distilled in the range 54.0 - 56.8 °C, the boiling point of the fluid is around 56 °C; thus, the PF 5060 DL fluid is conform to the CERN quality requirements concerning the boiling point [14];
- The result is also in agreement to data specified in the technical data sheet of the product [17], i.e. b.p = 56 °C;
The initial portions of the distillation curves shown in Fig. 44, as well as the data in Tables 17 to 19, suggest that the higher purity product is PF 5060 DL and the less pure one is PF 5060 (which exhibit many fractions between 27 and 56 °C). Anyway, three very small fractions (at 27 °C, at 45 °C and at 50 °C) are still visible in PF 5060 DL; another one, distilled at 54 °C was relatively important.
25 30 35 40 45 50 55 600
20
40
60
80
100
Temperature (oC)
Vol
ume
(cm
3 )
Fig. 44 – The distillation curves of the analyzed fluids: (•) PP1; (o) PF 5060; (Δ) PF 5060 DL
- 41 -
In conclusion, all the analyzed fluids exhibited narrow distillation ranges. The values are in agreement to the CERN requirements concerning the boiling point of these fluids. Note: The boiling point values of several perfluorinated compounds possible present as impurities in the analyzed liquids.
Name RN B.p. (°C)/ Reference Perfluoromethylcyclopentane (PCMP) 1805-22-7 48 [15]
Pefluoromethylcyclohexane (PCMH) 355-02-2 76 [15]
Pefluorobenzene 392-56-3 81-82 (at 743 torr) [15]
Perfluoro-dimethyl-cyclobutane 28677-00-1 2994-71-0 45 [15]
Perfluoro-methyl-cyclopentane 1805-22-7 48 [18]
Perfluorocyclohexane 355-68-0 59-60 [15]
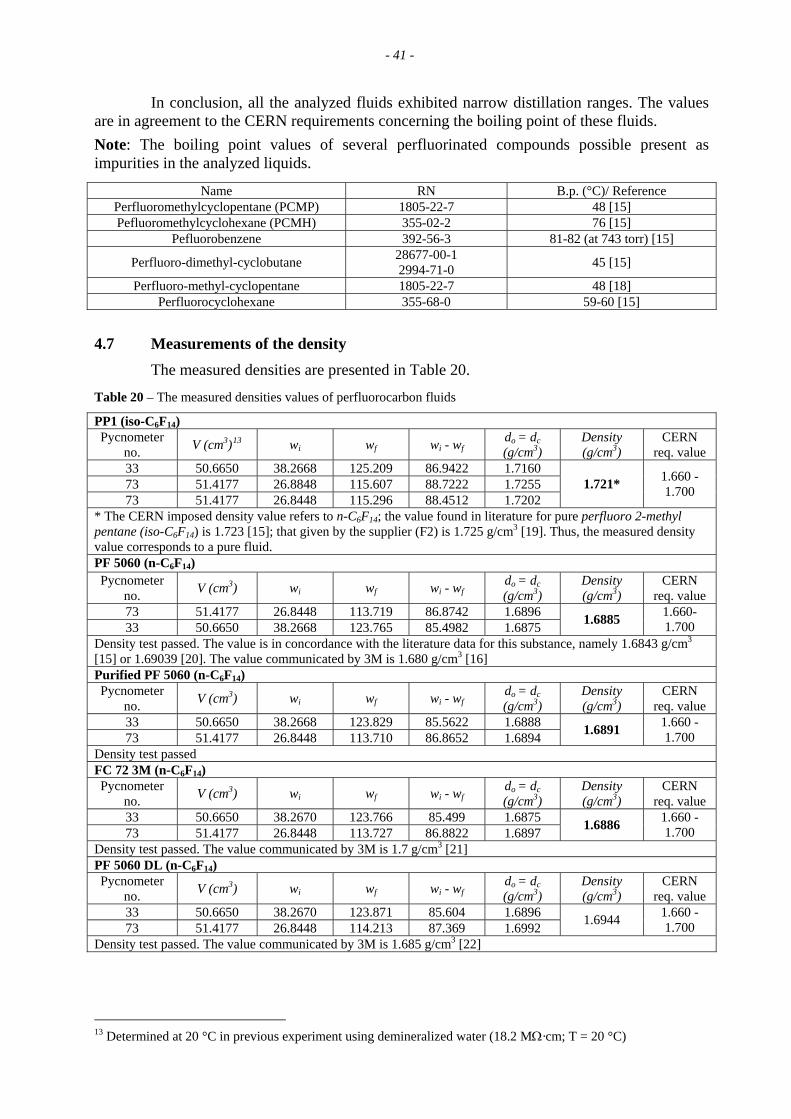
4.7 Measurements of the density The measured densities are presented in Table 20.
Table 20 – The measured densities values of perfluorocarbon fluids
PP1 (iso-C6F14) Pycnometer
no. V (cm3)13 wi wf wi - wfdo = dc(g/cm3)
Density (g/cm3)
CERN req. value
33 50.6650 38.2668 125.209 86.9422 1.7160 73 51.4177 26.8848 115.607 88.7222 1.7255 73 51.4177 26.8448 115.296 88.4512 1.7202
1.721* 1.660 - 1.700
* The CERN imposed density value refers to n-C6F14; the value found in literature for pure perfluoro 2-methyl pentane (iso-C6F14) is 1.723 [15]; that given by the supplier (F2) is 1.725 g/cm3 [19]. Thus, the measured density value corresponds to a pure fluid. PF 5060 (n-C6F14) Pycnometer
no. V (cm3) wi wf wi - wfdo = dc(g/cm3)
Density (g/cm3)
CERN req. value
73 51.4177 26.8448 113.719 86.8742 1.6896 33 50.6650 38.2668 123.765 85.4982 1.6875 1.6885 1.660-
1.700 Density test passed. The value is in concordance with the literature data for this substance, namely 1.6843 g/cm3 [15] or 1.69039 [20]. The value communicated by 3M is 1.680 g/cm3 [16] Purified PF 5060 (n-C6F14) Pycnometer
no. V (cm3) wi wf wi - wfdo = dc(g/cm3)
Density (g/cm3)
CERN req. value
33 50.6650 38.2668 123.829 85.5622 1.6888 73 51.4177 26.8448 113.710 86.8652 1.6894 1.6891 1.660 -
1.700 Density test passed FC 72 3M (n-C F ) 6 14Pycnometer
no. V (cm3) wi wf wi - wfdo = dc(g/cm3)
Density (g/cm3)
CERN req. value
33 50.6650 38.2670 123.766 85.499 1.6875 73 51.4177 26.8448 113.727 86.8822 1.6897 1.6886 1.660 -
1.700 Density test passed. The value communicated by 3M is 1.7 g/cm3 [21] PF 5060 DL (n-C F ) 6 14Pycnometer
no. V (cm3) wi wf wi - wfdo = dc(g/cm3)
Density (g/cm3)
CERN req. value
33 50.6650 38.2670 123.871 85.604 1.6896 73 51.4177 26.8448 114.213 87.369 1.6992 1.6944 1.660 -
1.700 Density test passed. The value communicated by 3M is 1.685 g/cm3 [22]
13 Determined at 20 °C in previous experiment using demineralized water (18.2 MΩ·cm; T = 20 °C)
- 42 -
All 3M fluids (PF 5060, PF 5060 DL and purified PF 5060) passed the density test, the values being within the normal limits, in agreement to the literature data [23]. These values meet the CERN quality requirements. The value for PP1 fluid product is in good agreement to the literature data for pure perfluoro 2-methyl pentane (iso-C6F14) [15].
5. CONCLUSIONS AND NEXT WORK
The aim of Part I of the work was successfully accomplished using the chemistry laboratory analytical techniques and methods, which were sensitive to the parameters or the properties of interest: these techniques should be used for the future characterization and analyses.
The following perfluorocarbon fluids supplied to CERN: PF 5060 DL, PP1 and C3F8 were found compliant to the CERN quality requirements and to the analysis certificates delivered by the respective producers.
Other perfluorocarbon fluids were not compliant in all points, as expected, to our quality requirements, mainly concerning the hydrogen content, i.e. FC-72 and PF 5060.
The acidity (HF content) of the all received fluids was below the imposed CERN limits.
The measurements carried out also shown that the recommended procedure for the double bonds and the reducing agents control using KMnO4 is not enough sensitive for this application and it was replaced by our own FT-IR procedure.
The preliminary purification tests on less pure fluids were very promising. The work will continue and the tests will be adapted and optimized, thus making other perfluorocarbon fluids quality grades to meet the CERN quality requirements. In such a way the potential suppliers and the range of the available fluids, possibly less expensive, may be advantageously enlarged.
The measurements to be realized on the different gamma irradiated perfluorocarbon fluids (doses of 28 kGy and 56 kGy) should show the radiation induced levels of acidity, the presence in these fluids of possible radiation induced polymers or pre-polymers as well as the eventual necessary on line purification to maintain a constant quality during their use.
Owing the chemical characterization and the measurements performed in the Chemistry Laboratory, some points of the CERN technical (quality) requirements have to be consequently adapted for the future purchases.
- 43 - REFERENCES [1] Determination of density of Flutec dyed blue fluid; Method FC-40-108 rev. 0 (F2 Chemicals Ltd.
2006) [2] British Standard 4522: 1988 (Method for determination of absolute density at 20 °C of liquid
chemical products for industrial use) [3] Colthup, N., Daly, L. H., Wiberley, S. E., "Introduction to Infrared and Raman Spectroscopy",
III-rd. Edition, Academic Press Inc. 1990, Ch. 5, p 215 [4] Fluka Riedel de Haen, "Produits Chimiques et Réactifs du Analytiques Laboratoire, Sigma
Aldrich, 2005-2006, p. 1702 [5] ABCR catalog reference F06072 http://www.chemexper.com/ [6] Grafstein, D., "Detection, Estimation and removal of Impurities in Fluorocarbon Liquids"in:
Analytical Chemistry, 26(3) 523 - 525 (1954) [7] Hariguchi, H., "Bibliography on IR Spectra", Sankyo Shuppan Co., 1989, Ch. 41, p. 357 [8] "Infrared Spectra of Halogenated Hydrocarbons” (Ed. Clara D. Craver), III-rd edition, Coblenz
Society Inc. 1984, p. 153 – 154 [9] "Determination of potassium permanganate test for reducing agents in fluorocarbon fluids",
Laboratory Test Method - F2 Chemicals Ltd., Method: FC-40-116 [10] Moiseeva, N. I., Gekhman, A. E., Moiseev, I. I., Journal of Molecular Catalysis A: Chemical,
117, 39 - 55 (1997) [11] Sandford, G., Tetrahedron, 59, 437 - 454 (2003) [12] "Determination of distillation range of fluorocarbon fluids" Method FC-40-106, rev. 0 (F2-
Chemicals Ltd.) [13] British Standard 658: 1994 - Specification for apparatus for determination of distillation range
(including flask and receivers) [14] CERN Technical Specification IT-3397/TS [15] http://www.chemexper.com/[16] Certificate de compliance for the product PF 5060 3M Performance fluid product ID ZF-0002-
0798-3 (issued by DATE S.A.38770 La Motte d'Aveillans, France) [17] Performance fluid PF 5060 DL Product information 2006
(http://multimedia.mmm.com/mws/mediawebserver.dyn?6666660Zjcf61Vs6EVs666xWiCOrrrrQ-) [18] http://rem.jrc.cec.eu.int/etex/15.htm [19] Certificate of Analysis Batch No 0294/ Ref. No. P51917 [20] Caco A.I. et al "Thermophysical properties of some perfluorocompounds", Fifteenth Symposium
on Thermophysical Properties, Boulder, CO, USA, June 22 - 27, 2003 [21] FC-72 Fluorinert Brand Electronic Liquid, Safety data sheet [22] Certificate of Analysis Product PF-5060 DL, Lot. Nbr. 20032/ 13 Mar. 2006 [23] 3M Specialty Fluids Newsletter Vol1 No.1, April 1995