Embed Size (px)
Citation preview
European Private Equity Buyout Review
First Quarter 2017
Fabrizio Bensch REUTERS
Table of Contents
Europe’s PE Buyout Market in Q1 2017 3
€ Invested and # Companies Financed 4
Top PE Buyout Deals 6
Investment by Company Location 7
Investment by Transaction Type 9
PE Investment vs. all European M&A 10
Investment by Company Sector 11
Buyout Funds Raised 12
Public and M&A Exits 13
Private Equity Returns 14
Explanatory Notes & Contacts 15
European Private Equity Buyout Market Activity in Q1 2017
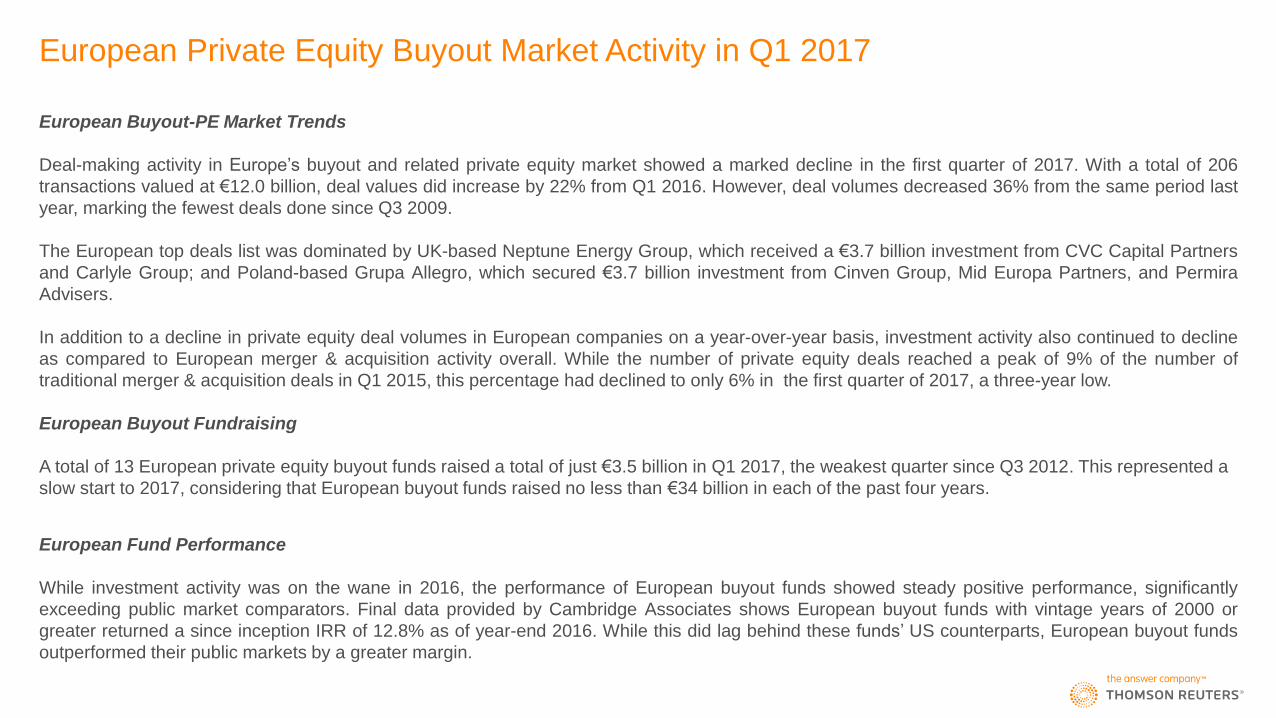
European Buyout-PE Market Trends
Deal-making activity in Europe’s buyout and related private equity market showed a marked decline in the first quarter of 2017. With a total of 206
transactions valued at €12.0 billion, deal values did increase by 22% from Q1 2016. However, deal volumes decreased 36% from the same period last
year, marking the fewest deals done since Q3 2009.
The European top deals list was dominated by UK-based Neptune Energy Group, which received a €3.7 billion investment from CVC Capital Partners
and Carlyle Group; and Poland-based Grupa Allegro, which secured €3.7 billion investment from Cinven Group, Mid Europa Partners, and Permira
Advisers.
In addition to a decline in private equity deal volumes in European companies on a year-over-year basis, investment activity also continued to decline
as compared to European merger & acquisition activity overall. While the number of private equity deals reached a peak of 9% of the number of
traditional merger & acquisition deals in Q1 2015, this percentage had declined to only 6% in the first quarter of 2017, a three-year low.
European Buyout Fundraising
A total of 13 European private equity buyout funds raised a total of just €3.5 billion in Q1 2017, the weakest quarter since Q3 2012. This represented a
slow start to 2017, considering that European buyout funds raised no less than €34 billion in each of the past four years.
European Fund Performance
While investment activity was on the wane in 2016, the performance of European buyout funds showed steady positive performance, significantly
exceeding public market comparators. Final data provided by Cambridge Associates shows European buyout funds with vintage years of 2000 or
greater returned a since inception IRR of 12.8% as of year-end 2016. While this did lag behind these funds’ US counterparts, European buyout funds
outperformed their public markets by a greater margin.
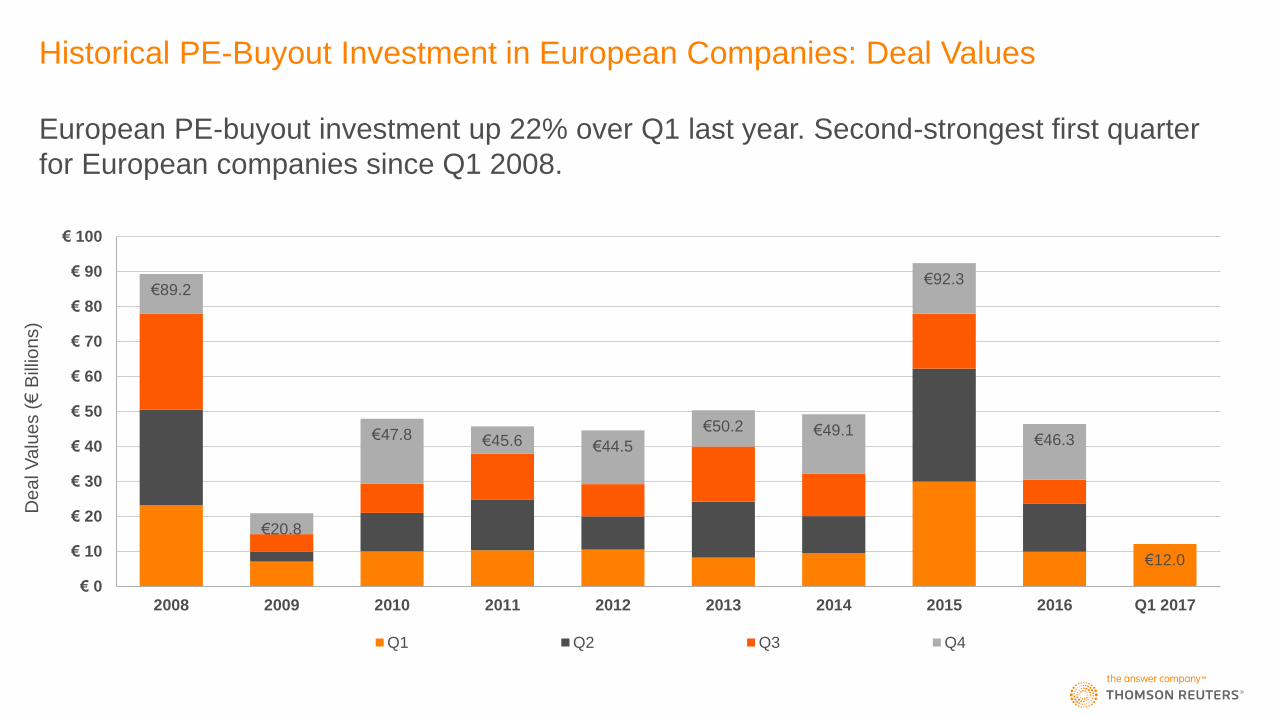
Historical PE-Buyout Investment in European Companies: Deal Values
European PE-buyout investment up 22% over Q1 last year. Second-strongest first quarter
for European companies since Q1 2008.
€12.0
€89.2
€20.8
€47.8 €45.6 €44.5
€50.2 €49.1
€92.3
€46.3
€ 0
€ 10
€ 20
€ 30
€ 40
€ 50
€ 60
€ 70
€ 80
€ 90
€ 100
2008 2009 2010 2011 2012 2013 2014 2015 2016 Q1 2017
Q1 Q2 Q3 Q4
De
al V
alu
es (
€ B
illio
ns)
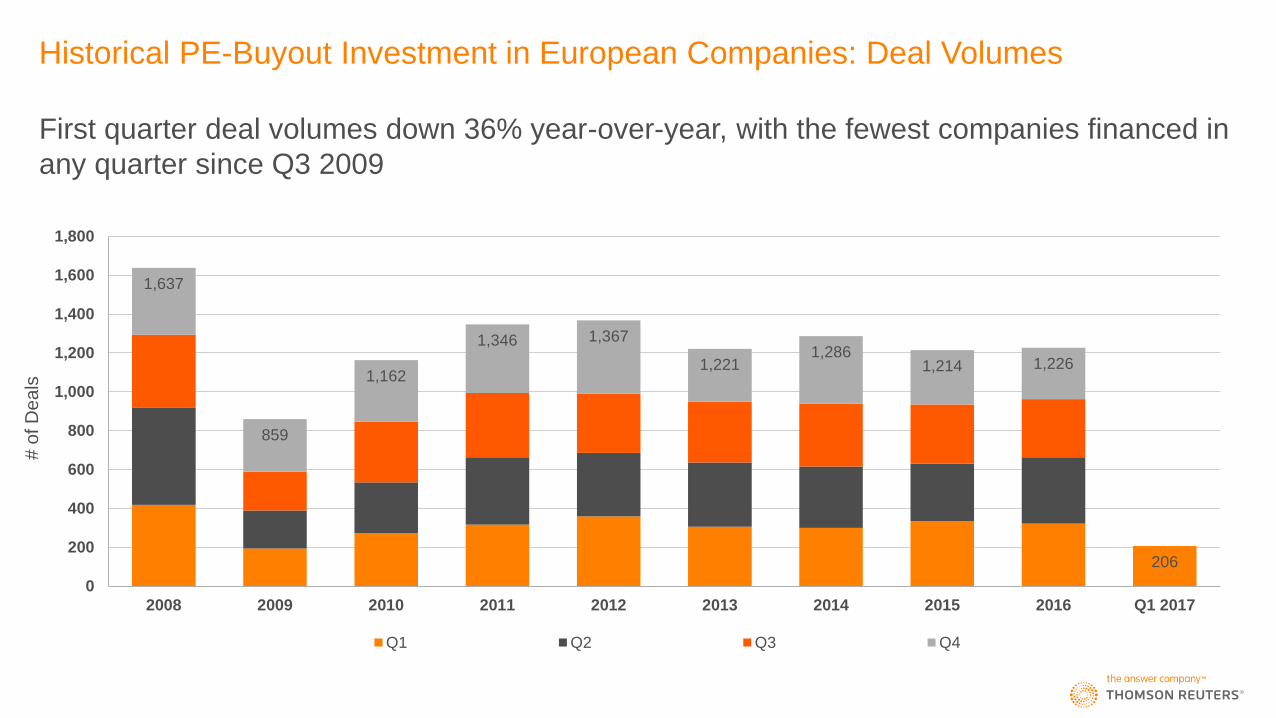
Historical PE-Buyout Investment in European Companies: Deal Volumes
First quarter deal volumes down 36% year-over-year, with the fewest companies financed in
any quarter since Q3 2009
206
1,637
859
1,162
1,346 1,367
1,221 1,286
1,214 1,226
0
200
400
600
800
1,000
1,200
1,400
1,600
1,800
2008 2009 2010 2011 2012 2013 2014 2015 2016 Q1 2017
Q1 Q2 Q3 Q4
# o
f D
ea
ls
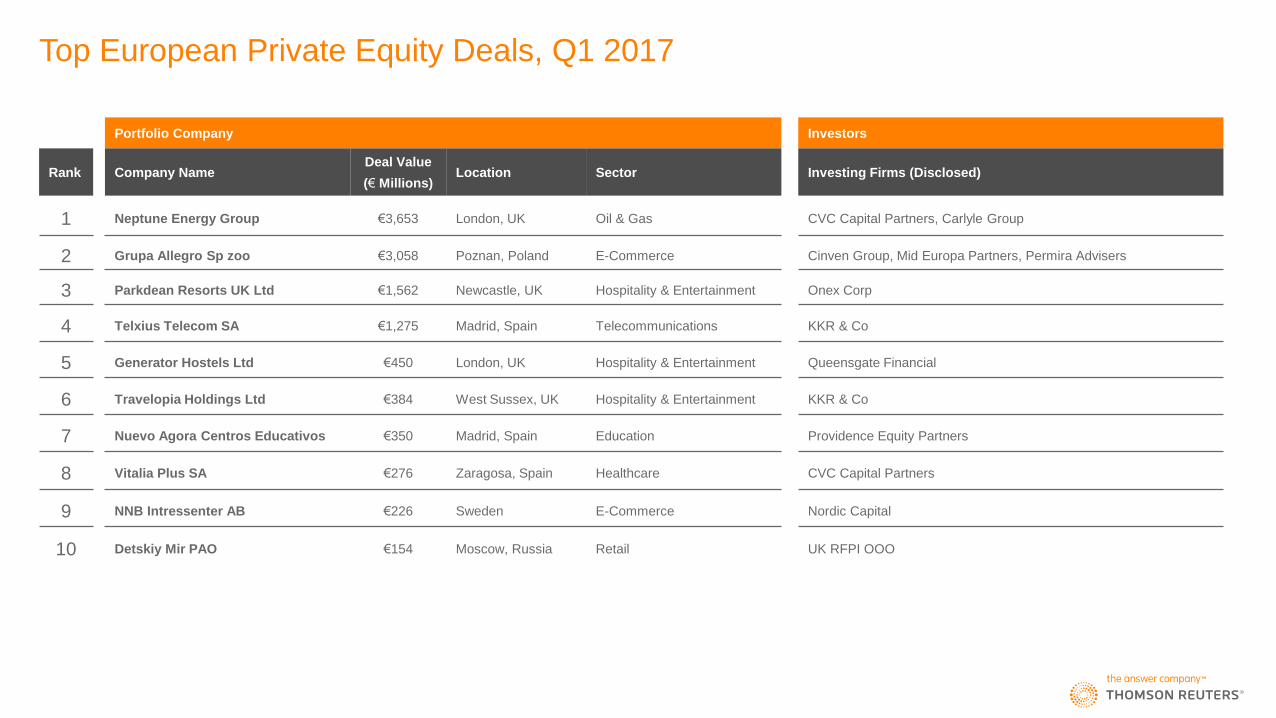
Top European Private Equity Deals, Q1 2017
Portfolio Company Investors
Rank Company Name Deal Value
(€ Millions) Location Sector Investing Firms (Disclosed)
1 Neptune Energy Group €3,653 London, UK Oil & Gas CVC Capital Partners, Carlyle Group
2 Grupa Allegro Sp zoo €3,058 Poznan, Poland E-Commerce Cinven Group, Mid Europa Partners, Permira Advisers
3 Parkdean Resorts UK Ltd €1,562 Newcastle, UK Hospitality & Entertainment Onex Corp
4 Telxius Telecom SA €1,275 Madrid, Spain Telecommunications KKR & Co
5 Generator Hostels Ltd €450 London, UK Hospitality & Entertainment Queensgate Financial
6 Travelopia Holdings Ltd €384 West Sussex, UK Hospitality & Entertainment KKR & Co
7 Nuevo Agora Centros Educativos €350 Madrid, Spain Education Providence Equity Partners
8 Vitalia Plus SA €276 Zaragosa, Spain Healthcare CVC Capital Partners
9 NNB Intressenter AB €226 Sweden E-Commerce Nordic Capital
10 Detskiy Mir PAO €154 Moscow, Russia Retail UK RFPI OOO
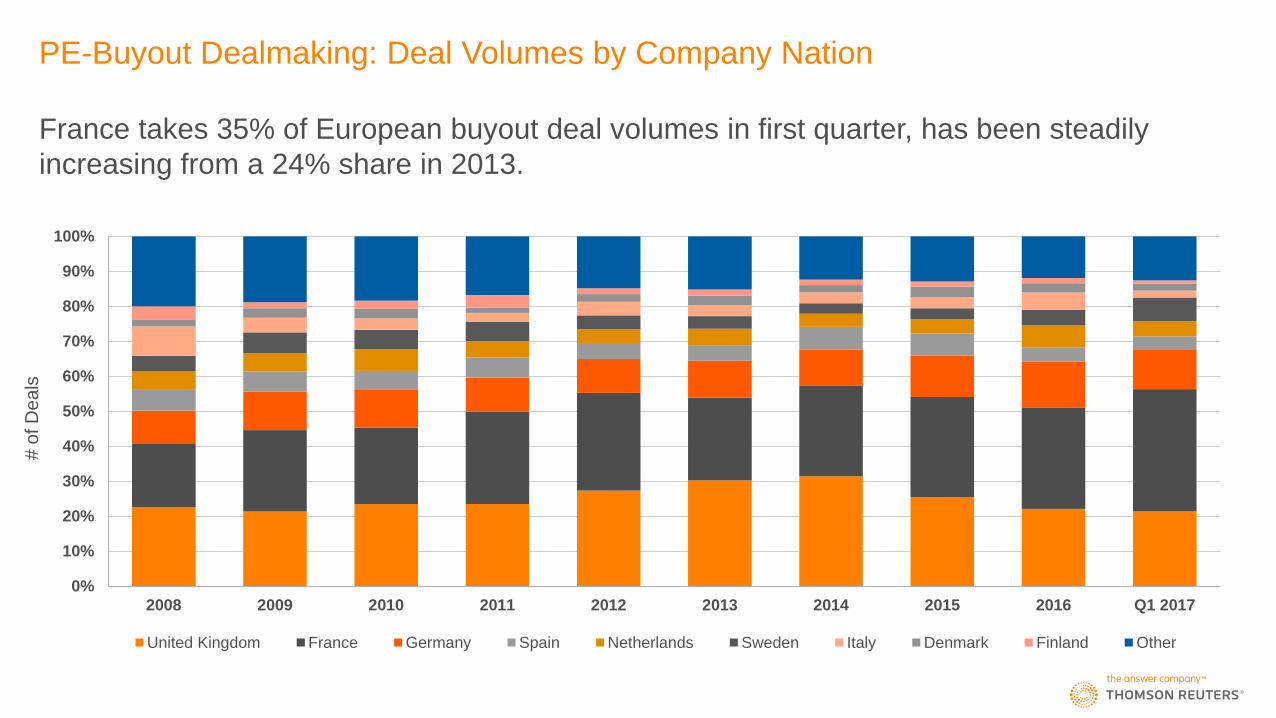
PE-Buyout Dealmaking: Deal Volumes by Company Nation
France takes 35% of European buyout deal volumes in first quarter, has been steadily
increasing from a 24% share in 2013.
0%
10%
20%
30%
40%
50%
60%
70%
80%
90%
100%
2008 2009 2010 2011 2012 2013 2014 2015 2016 Q1 2017
United Kingdom France Germany Spain Netherlands Sweden Italy Denmark Finland Other
# o
f D
ea
ls
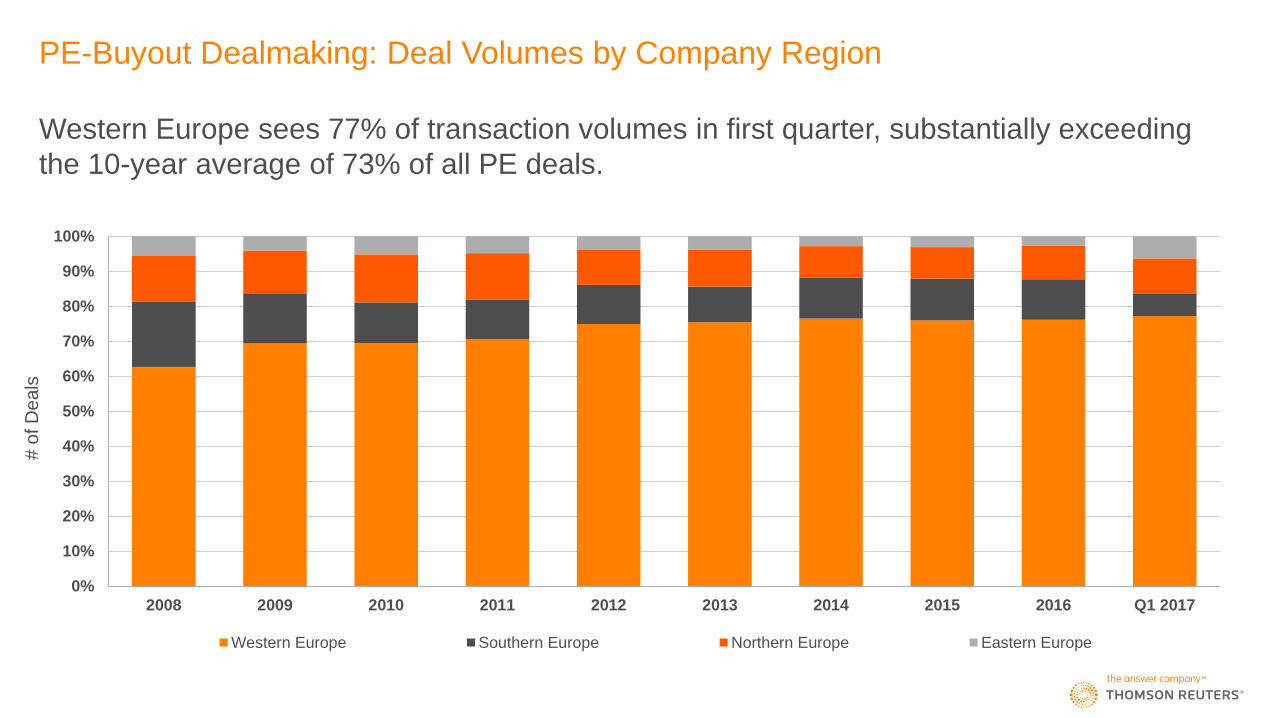
PE-Buyout Dealmaking: Deal Volumes by Company Region
Western Europe sees 77% of transaction volumes in first quarter, substantially exceeding
the 10-year average of 73% of all PE deals.
0%
10%
20%
30%
40%
50%
60%
70%
80%
90%
100%
2008 2009 2010 2011 2012 2013 2014 2015 2016 Q1 2017
Western Europe Southern Europe Northern Europe Eastern Europe
# o
f D
ea
ls
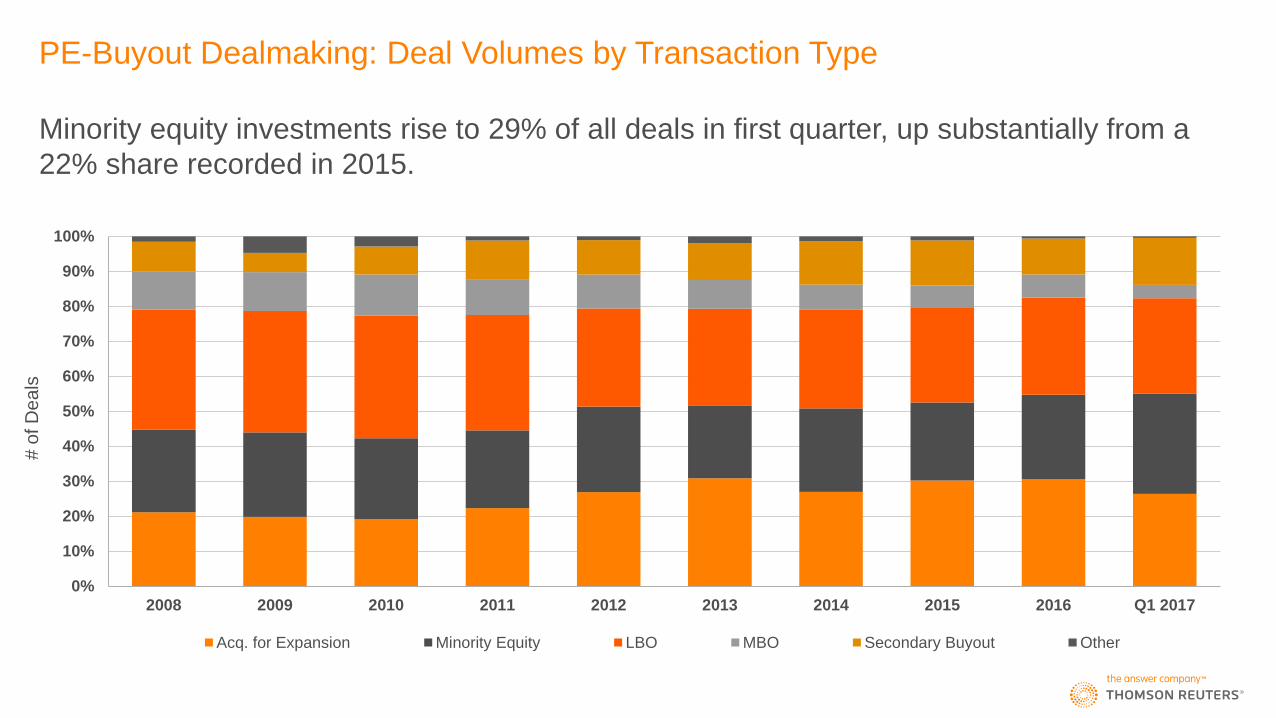
PE-Buyout Dealmaking: Deal Volumes by Transaction Type
Minority equity investments rise to 29% of all deals in first quarter, up substantially from a
22% share recorded in 2015.
0%
10%
20%
30%
40%
50%
60%
70%
80%
90%
100%
2008 2009 2010 2011 2012 2013 2014 2015 2016 Q1 2017
Acq. for Expansion Minority Equity LBO MBO Secondary Buyout Other
# o
f D
ea
ls
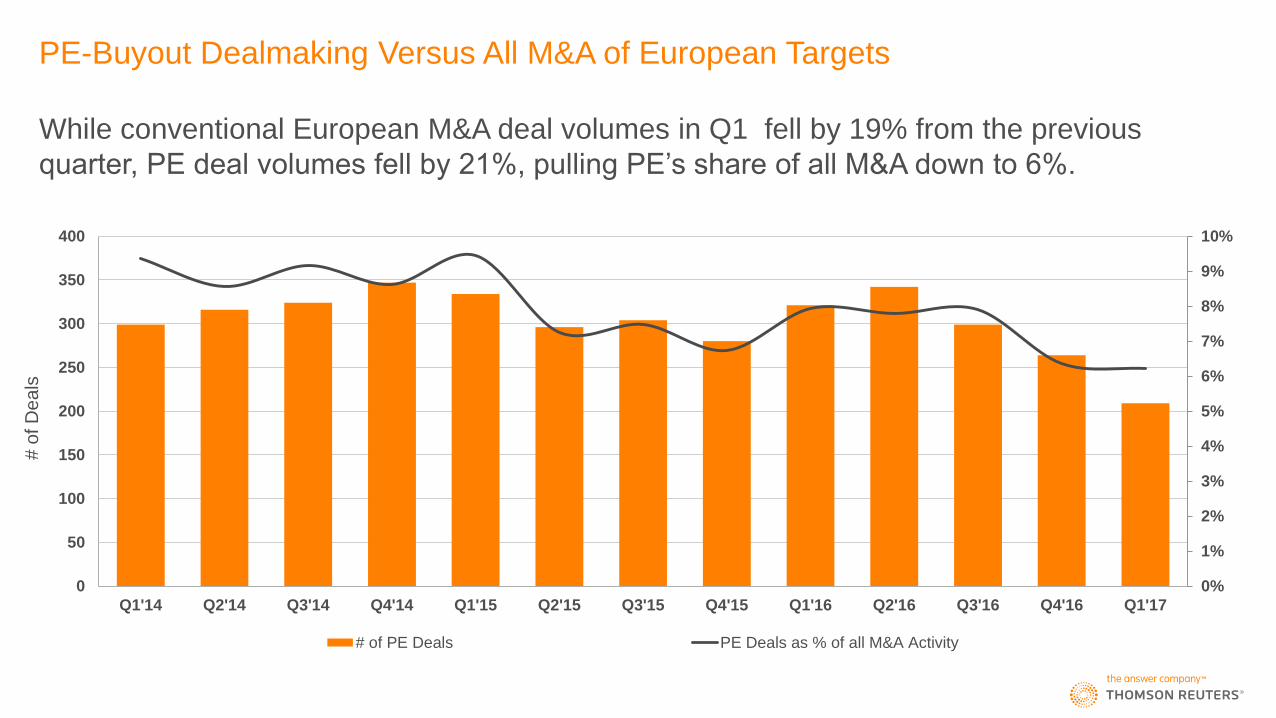
PE-Buyout Dealmaking Versus All M&A of European Targets
While conventional European M&A deal volumes in Q1 fell by 19% from the previous
quarter, PE deal volumes fell by 21%, pulling PE’s share of all M&A down to 6%.
0%
1%
2%
3%
4%
5%
6%
7%
8%
9%
10%
0
50
100
150
200
250
300
350
400
Q1'14 Q2'14 Q3'14 Q4'14 Q1'15 Q2'15 Q3'15 Q4'15 Q1'16 Q2'16 Q3'16 Q4'16 Q1'17
# of PE Deals PE Deals as % of all M&A Activity
# o
f D
ea
ls
0
5
10
15
20
25
30
35
40
45
50
Q1 2017 Total # of Deals
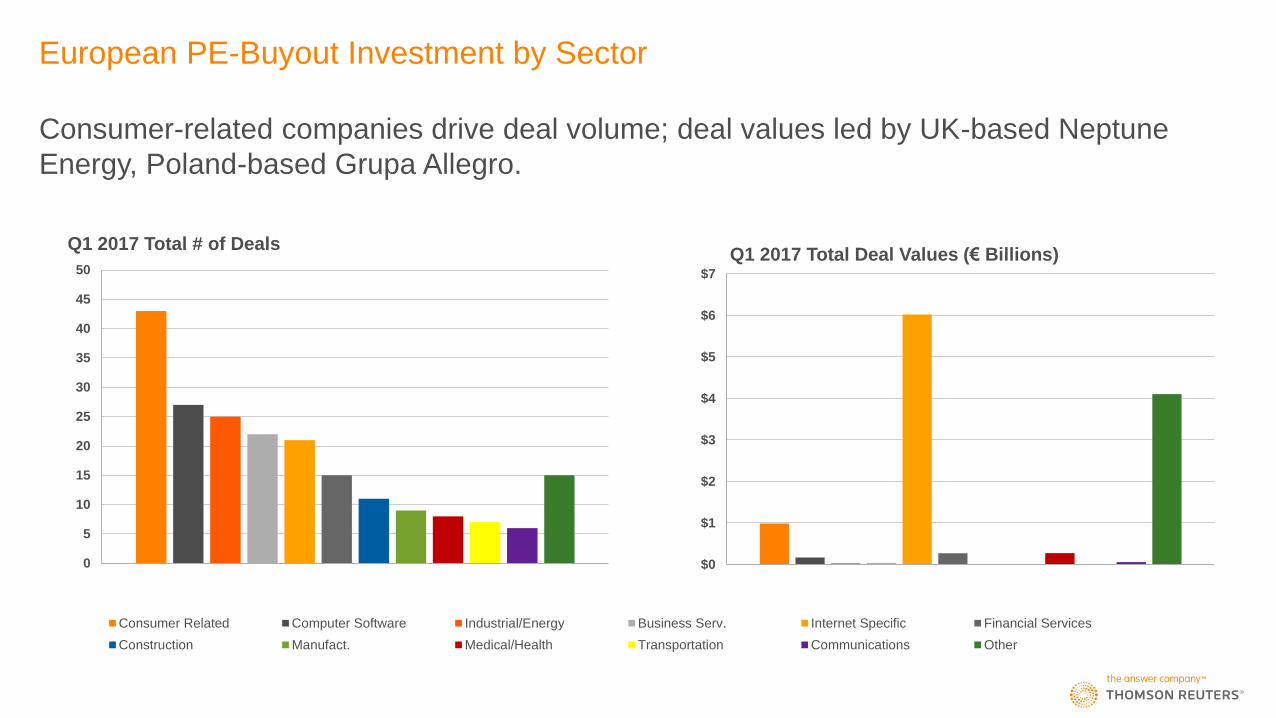
European PE-Buyout Investment by Sector
Consumer-related companies drive deal volume; deal values led by UK-based Neptune
Energy, Poland-based Grupa Allegro.
$0
$1
$2
$3
$4
$5
$6
$7
Q1 2017 Total Deal Values (€ Billions)
Consumer Related Computer Software Industrial/Energy Business Serv. Internet Specific Financial Services
Construction Manufact. Medical/Health Transportation Communications Other
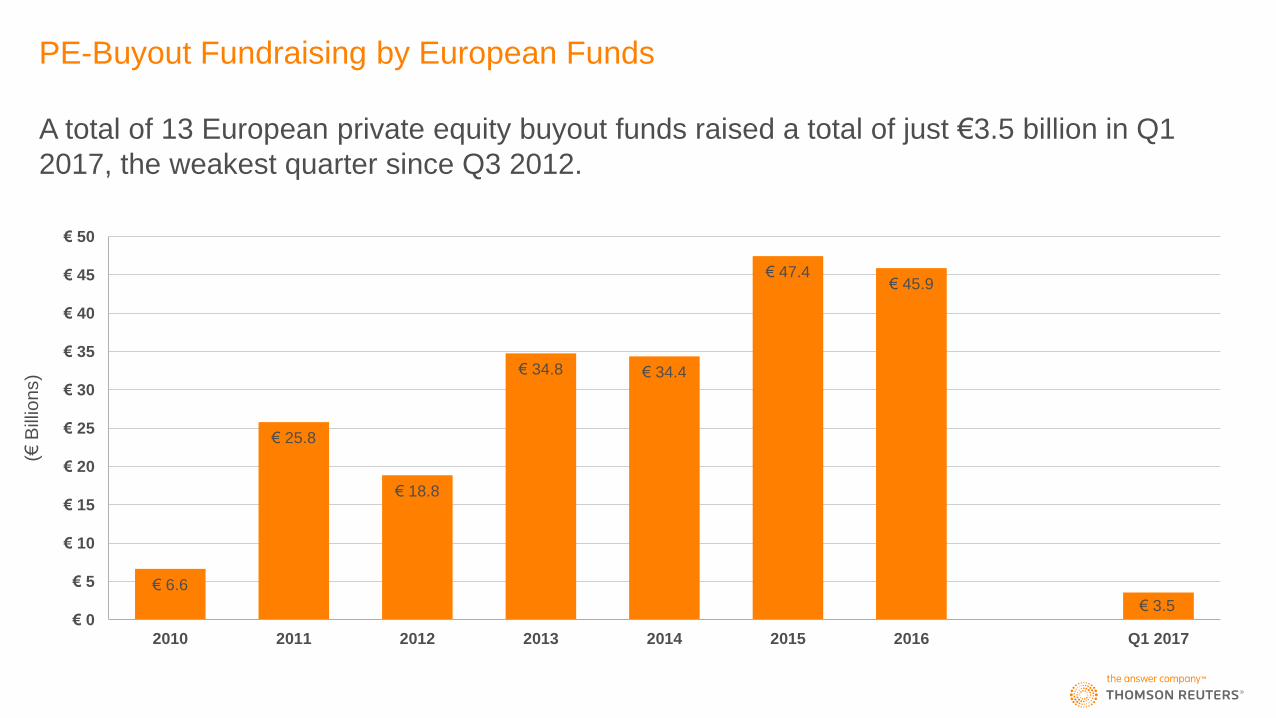
PE-Buyout Fundraising by European Funds
A total of 13 European private equity buyout funds raised a total of just €3.5 billion in Q1
2017, the weakest quarter since Q3 2012.
€ 6.6
€ 25.8
€ 18.8
€ 34.8 € 34.4
€ 47.4 € 45.9
€ 3.5 € 0
€ 5
€ 10
€ 15
€ 20
€ 25
€ 30
€ 35
€ 40
€ 45
€ 50
2010 2011 2012 2013 2014 2015 2016 Q1 2017
(€ B
illio
ns)
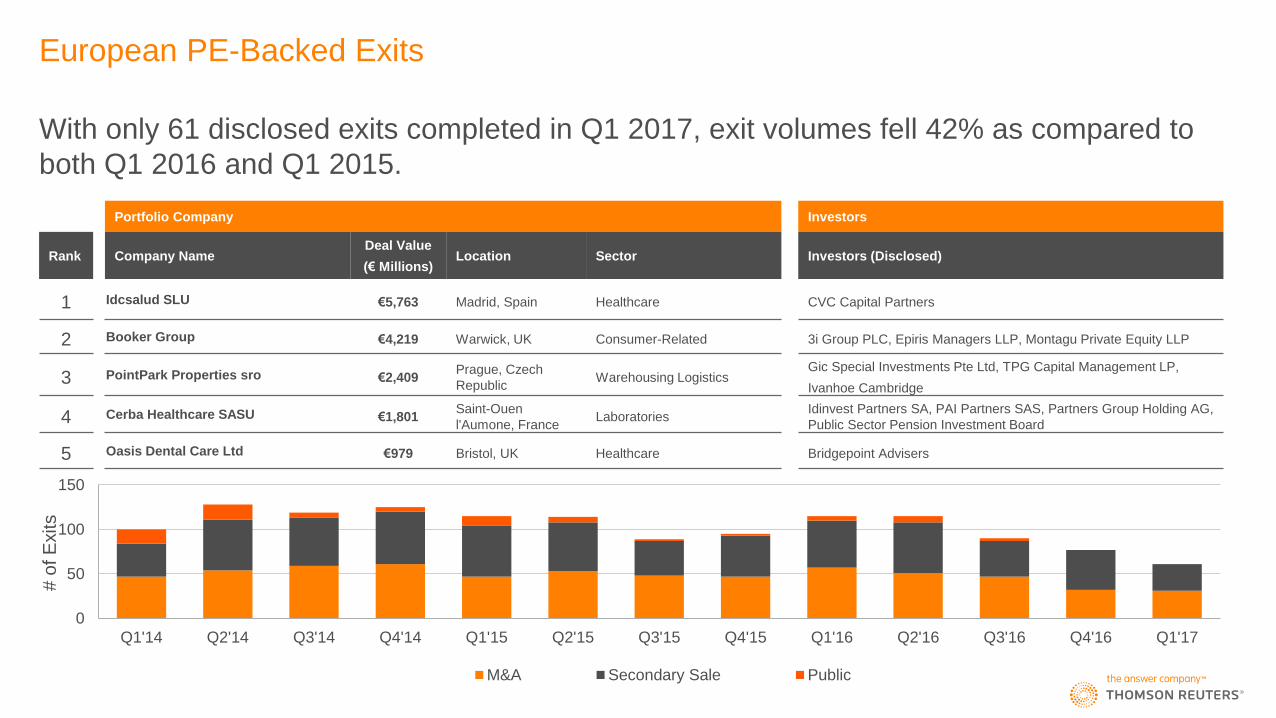
European PE-Backed Exits
Portfolio Company Investors
Rank Company Name Deal Value
(€ Millions) Location Sector Investors (Disclosed)
1 Idcsalud SLU €5,763 Madrid, Spain Healthcare CVC Capital Partners
2 Booker Group €4,219 Warwick, UK Consumer-Related 3i Group PLC, Epiris Managers LLP, Montagu Private Equity LLP
3 PointPark Properties sro €2,409 Prague, Czech
Republic Warehousing Logistics
Gic Special Investments Pte Ltd, TPG Capital Management LP,
Ivanhoe Cambridge
4 Cerba Healthcare SASU €1,801 Saint-Ouen
l'Aumone, France Laboratories
Idinvest Partners SA, PAI Partners SAS, Partners Group Holding AG,
Public Sector Pension Investment Board
5 Oasis Dental Care Ltd €979 Bristol, UK Healthcare Bridgepoint Advisers
With only 61 disclosed exits completed in Q1 2017, exit volumes fell 42% as compared to
both Q1 2016 and Q1 2015.
0
50
100
150
Q1'14 Q2'14 Q3'14 Q4'14 Q1'15 Q2'15 Q3'15 Q4'15 Q1'16 Q2'16 Q3'16 Q4'16 Q1'17
M&A Secondary Sale Public
# o
f E
xits
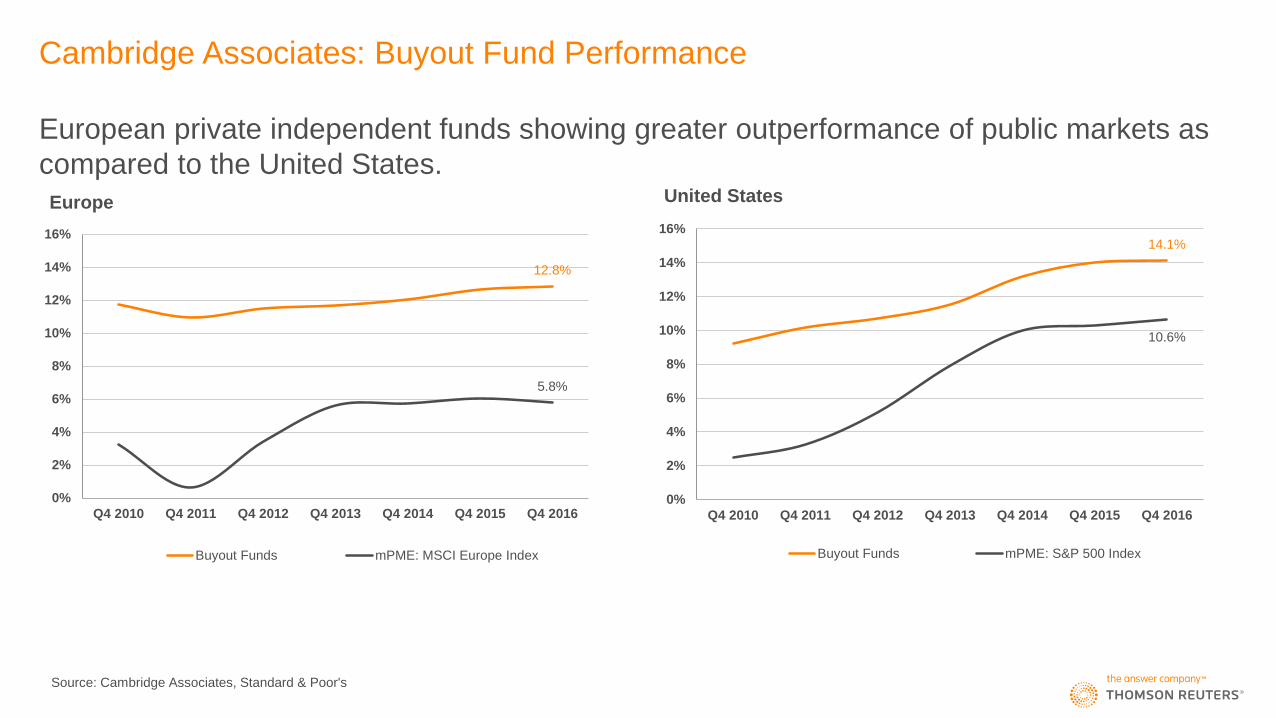
Cambridge Associates: Buyout Fund Performance
12.8%
5.8%
0%
2%
4%
6%
8%
10%
12%
14%
16%
Q4 2010 Q4 2011 Q4 2012 Q4 2013 Q4 2014 Q4 2015 Q4 2016
Europe
Buyout Funds mPME: MSCI Europe Index
14.1%
10.6%
0%
2%
4%
6%
8%
10%
12%
14%
16%
Q4 2010 Q4 2011 Q4 2012 Q4 2013 Q4 2014 Q4 2015 Q4 2016
United States
Buyout Funds mPME: S&P 500 Index
Source: Cambridge Associates, Standard & Poor's
European private independent funds showing greater outperformance of public markets as
compared to the United States.
Explanatory Notes
1. Data collected and analyzed by Thomson Reuters for this statistical report were drawn from a variety of sources including Thomson Reuters M&A databases, regulatory filings, press releases, and proprietary investor
reports from European and non-resident fund managers.
2. Key statistical indicators (e.g., total disbursements, per quarter or per annum) are influenced by the fact that a substantial fraction of buyout and other PE deals are not fully disclosed. For instance, “Euros invested” in a
given period pertain only to those deals with values that have been published or confidentially disclosed to Thomson Reuters.
3. Statistical data reflect all essential forms of buyout-PE deal-making, including control-stake acquisitions of businesses, minority equity investments, restructuring and special-situations transactions, mezzanine deals,
acquisitions for expansion and other quasi-equity investments.
4. Fund performance data and public market equivalents are produced via the Cambridge Associates Benchmark Calculator, available through Thomson Reuters Eikon. Returns are for European and US buyout funds with
vintage years of 2001 or greater, on a first cash flow basis, in Euros, from inception to the end of the indicated quarter, under published data mode Q4 2016. Pooled internal rates of return are net of fees, expenses and
carried interest. CA Modified Public Market Equivalent (mPME) replicates private investment performance under public market conditions. The public index’s shares are purchased and sold according to the private fund
cash flow schedule, with distributions calculated in the same proportion as the private fund, and mPME NAV is a function of mPME cash flows and public index returns.
5. All current and previous years data is as of Monday, May 29th, 2017. Data is continuously updated and is therefore subject to change. All figures are in Euros unless otherwise noted.
For further information on Thomson Reuters venture capital and private equity offerings, please visit us at:
• http://thomsonreuters.com/en/products-services/financial/venture-capital-and-private-equity.html
For further reports on private equity, venture capital, and other asset classes, please visit us at:
• http://dmi.thomsonreuters.com
Contributors to this analysis are provided with additional packages of data. If you would like to participate in the submission process, receive quarterly press releases, or have questions about our venture capital criteria, please
contact us at:
Jelena Marinovic
Private Equity European Contributor Relations Lead
E-mail: [email protected]