Embed Size (px)
Citation preview

www.oecd.org/economy/economicoutlook.htm
ECOSCOPE blog: oecdecoscope.wordpress.com
Catherine L. Mann OECD Chief Economist
Structural Reforms in the Euro Area Conference
ECB, Frankfurt, October 18, 2017
Europe’s Single Market Challenges
Backdrop: Productivity-wage dispersion
Challenges: Banking, Services, Digital
and some regional observations

2
Note: Frontier firms are the 5% of firms with the highest labour productivity by year and sector. Included industries are manufacturing and business services, excluding the financial sector, for firms with at least 20 employees. Source: Andrews, D., C. Criscuolo and P. Gal (2016), “The Best versus the Rest: The Global Productivity Slowdown, Divergence across Firms and the Role of Public Policy”, OECD Productivity Working Papers, No. 5; Orbis data of Bureau van Dijk; and OECD calculations.
Real compensation per worker Index, 2001 = 100
Labour productivity Index, 2001 = 100
Twin-Divergences: The Best vs the Rest Firms vary in productivity and wage dispersion

Wage Productivity Dispersion
Varies substantially within Europe
3
Note: Data are for 2013. OECD is the unweighted average of the countries for which data are available. The P90/P50 ratio is labour income or labour productivity of the firm at the 90th percentile divided by the corresponding value of the firm at the median. Labour income is total compensation including taxes and the employer’s and employee’s social security contributions. Source: OECD estimations based on Saia and Schwellnus (2016), “Decoupling of Productivity and Median Wage Growth: Micro-Level Evidence”, OECD Economics Department Working Papers, forthcoming; Orbis.
Wage inequality and productivity dispersion across firms
Higher wage inequality
Greater productivity dispersion

Role for Banking Union NPLs and Zombies capture capital, reduce dynamism
4
Note: Firms aged 10 years or more and with profits not covering interest payments over
three consecutive years. The sample excludes firms that are larger than 100 times the
99th percentile of the size distribution in terms of capital stock or number of employees.
Source: Adalet McGowan, Andrews and Millot (2017), “The Walking Dead? Zombie
Firms and Productivity Performance in OECD Countries”, OECD Economics
Department working paper; and OECD calculations.
Productivity gains from reducing zombie capital Gains to aggregate multi-factor productivity
Average zombie firm share for each
category of bank health
Note: the average zombie firm share for each bin of bank health, purged of country-
industry-fixed effects. The relationship is statistically significant at the 1% level and is
based on over 1.5 million firm-bank observations for 11 European countries over the
period 2001-2014.
Source: Andrews, D. and F. Petroulakis (2017), “Breaking the Shackles: Zombie Firms,
Weak Banks and Depressed Restructuring in Europe”, OECD Economics Department
Working Papers.

Role for Services Single Market Scope for improvement, and implications
The burden of restrictions falls
disproportionately on smaller firms
Note: average effect across sectors and countries based on microdata from Belgium, Finland, Germany, Italy, Japan, the United Kingdom and the United States. The numbers indicate the ad valorem tariff equivalent of an STRI score of 0.2 on top of what is incurred by firms with turnovers of EUR 500m and above. Source: Rouzet, Benz and Spinelli (2017), “Trading Firms and Trading Costs in Services”, OECD Trade Policy paper.
0
5
10
15
20
25
30
1 million 5 million 50 million 200 million
Ta
riff
eq
uiv
ale
nt
in
%
of
ST
RI o
f 0
.2
Firm turnover in EUR
Cross-border trade
Foreign affiliate sales
0.0
0.2
0.4
0.6
0.8
1.0
Average Minimum Maximum
Services trade restrictiveness indices 2016, covering 44 countries
Note: Covers the 35 OECD members plus Brazil, China, Colombia, Costa Rica, India, Indonesia, Lithuania, Russia and South Africa. Source: OECD STRI database.
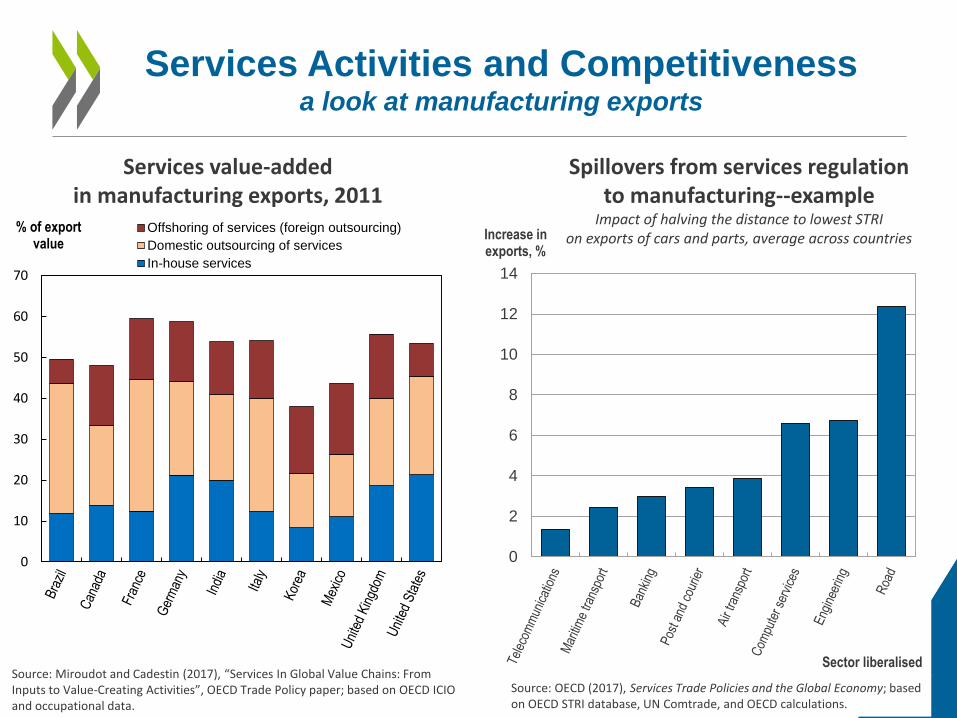
Services Activities and Competitiveness a look at manufacturing exports
0
2
4
6
8
10
12
14
Increase in exports, %
Sector liberalised
Spillovers from services regulation to manufacturing--example
Impact of halving the distance to lowest STRI on exports of cars and parts, average across countries
Source: OECD (2017), Services Trade Policies and the Global Economy; based on OECD STRI database, UN Comtrade, and OECD calculations.
Services value-added in manufacturing exports, 2011
Source: Miroudot and Cadestin (2017), “Services In Global Value Chains: From Inputs to Value-Creating Activities”, OECD Trade Policy paper; based on OECD ICIO and occupational data.
0
10
20
30
40
50
60
70
% of export value
Offshoring of services (foreign outsourcing)
Domestic outsourcing of services
In-house services

Role for Digital Single Market Trade and digitalisation go hand in hand
Note: Figures show correlation between internet use per 100 inhabitants, number of products exported and export market. To avoid correlations arising through other variables, such as internet use and income, or number of products and size of markets, the residuals from a regression of the trade outcomes with respect to per capita GDP and size of markets with country specific fixed effects and time dummies are taken.
More ‘connected’ countries sell more goods to more destinations

But growing number and complexity of “data
regulation” risks putting sand in the wheels
0
10
20
30
40
50
60
70
80
1983 1986 1989 1992 1995 1998 2001 2004 2007 2010 2013
Nu
bm
er o
f m
ea
su
re
s
Prohibition
Conditions - Combination
Conditional - One of
0
5
10
15
20
25
30
35
40
45
1972 1976 1980 1984 1988 1992 1996 2000 2004 2008 2012
Nu
mb
er o
f m
ea
su
re
s
Compulsory
Conditional
Cross-border data transfer restrictions Local storage requirements
Source: Lopez-Gonzalez et al. (2017), “Localising data in a globalised world”, OECD Trade Policy paper,

9
Why Focus on Services? Evidence that manufacturing is regionally concentrated
which accentuates adjustment to trade, technology shocks
Geographic concentration index by sector Average from 2000 to 2015 or latest
Note: “Distributive trades” includes distributive trade, repairs, transportation and storage, accommodation and food service activities. Index measures the extent to which employment is concentrated in particular regions, varying between 0 (no concentration, where all regions of a country have the same manufacturing employment rate) and 100 (maximum concentration, where all manufacturing employment is concentrated in the smallest region). The index incorporates the size of the region and is based on OECD (2003) “Geographic Concentration and Territorial Disparity in OECD Countries”. Source: OECD Regional database; and OECD calculations., and Economic Outlook, chapter 2, June 2017
More concentrated
10
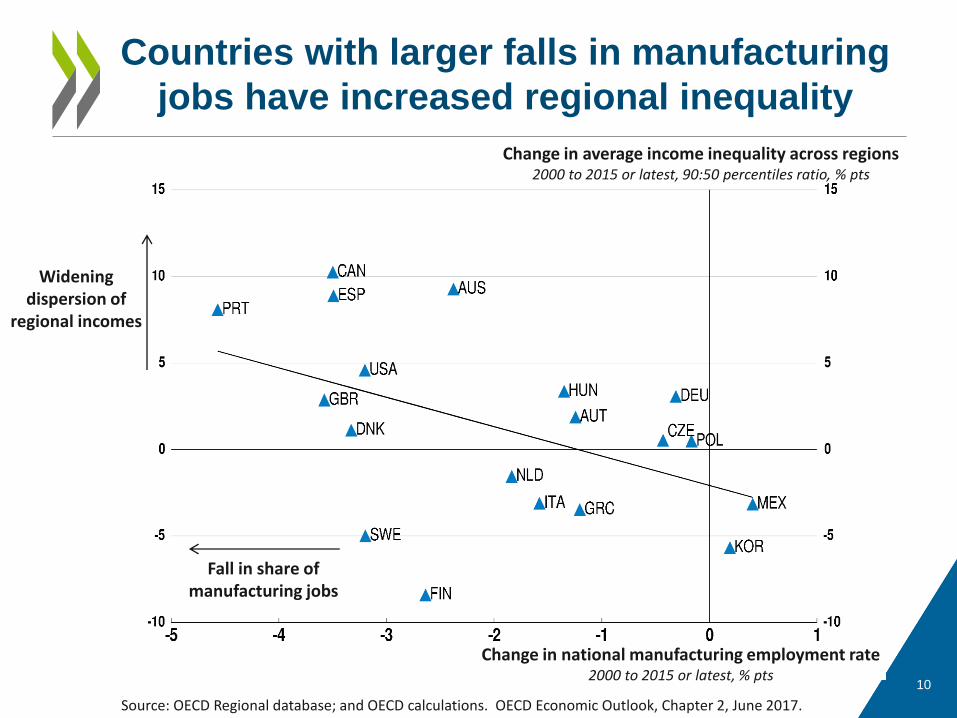
Countries with larger falls in manufacturing
jobs have increased regional inequality
Source: OECD Regional database; and OECD calculations. OECD Economic Outlook, Chapter 2, June 2017.
Change in average income inequality across regions 2000 to 2015 or latest, 90:50 percentiles ratio, % pts
Change in national manufacturing employment rate 2000 to 2015 or latest, % pts
Widening dispersion of
regional incomes
Fall in share of manufacturing jobs

• Background: Two sides of the growth and inequality challenge – Low average productivity masks divergence between ‘’best’’ and
‘’ rest’’
– Productivity divergence mirrors real wage divergence
• Three challenges for completing the Single Market: Banking Union, Services, Digital – Zombie firms and zombie banks interact to inhibit dynamism and
improvements in both productivity and inequality
– Services regulations stand in the way of enhanced competitiveness, and disproportionately burden small firms
– Digital expands export market and range of export products, but restrictions are rising.
• Why focus on services? – Services are less regionally concentrated than manufacturing,
which can offset concentrated shocks to trade and technology
11
Summing up