Embed Size (px)
Citation preview
Federal Communications Commission Office of Engineering & Technology__________________________________
Evaluating Compliance with FCCGuidelines for Human Exposure to
Radiofrequency Electromagnetic Fields
Additional Information for Radio andTelevision Broadcast Stations
Supplement A (Edition 97-01)
toOET Bulletin 65 (Edition 97-01)
Evaluating Compliance with FCCGuidelines for Human Exposure
to Radiofrequency Electromagnetic Fields
Additional Information for Radio andTelevision Broadcast Stations
SUPPLEMENT AEdition 97-01
totoOET BULLETIN 65
Edition 97-01
August 1997
AUTHORSAUTHORSRobert F. Cleveland, Jr.
David M. SylvarJerry L. Ulcek
Standards Development BranchAllocations and Standards Division
Office of Engineering and TechnologyFederal Communications Commission
Washington, D.C. 20554

ACKNOWLEDGEMENTS
The following individuals and organizations from outside the FCC reviewed an early draft ofBulletin 65, including the material in this supplement. Their valuable comments andsuggestions greatly enhanced the accuracy and usefulness of this document, and theirassistance is gratefully acknowledged.
Joseph A. Amato, Maxwell RF Radiation Safety, Ltd.Edward Aslan, Lockheed Martin Microwave (Narda)Ameritech Mobile Communications, Inc.Dr. Tadeusz M. Babij, Florida International UniversityDr. Quirano Balzano, MotorolaDavid Baron, P.E., Holaday Industries, Inc.Howard I. Bassen, U.S. Food and Drug AdministrationClarence M. Beverage, Communications Technologies, Inc.Dr. Donald J. Bowen, AT&T LaboratoriesCellular Telecommunications Industry AssociationDr. C.K. Chou, City of Hope National Medical CenterJules Cohen, P.E., Consulting EngineerDr. David L. Conover, National Institute for Occupational Safety & HealthCohen, Dippell and Everist, P.C.Robert D. Culver, Lohnes and CulverFred J. Dietrich, Ph.D., GlobalstarElectromagnetic Energy AssociationProfessor Om P. Gandhi, University of UtahRobert Gonsett, Communications General Corp.Hammett & Edison, Inc.Norbert Hankin, U.S. Environmental Protection AgencyJames B. Hatfield, Hatfield & DawsonRobert JohnsonDr. John A. LeonowichDr. W. Gregory Lotz, National Institute for Occupational Safety & HealthFrederick O. Maia, National Volunteer Examiners (Amateur Radio Service)Ed Mantiply, U.S. Environmental Protection AgencyRobert MooreDr. Daniel Murray, Okanagan University CollegeDr. John M. Osepchuk, Full Spectrum ConsultingProfessor Wayne Overbeck, California State University, FullertonPersonal Communications Industry AssociationRonald C. Petersen, Lucent TechnologiesDavid B. PopkinKazimierz Siwiak, P.E.Richard A. Tell, Richard Tell Associates, Inc.Rory Van Tuyl, Hewlett-Packard LaboratoriesLouis A. Williams, Jr., Louis A. Williams, Jr. and Associates
Contributions from the following FCC staff members are also acknowledged:Kwok Chan, Errol Chang, William Cross, Richard Engelman, Bruce Franca and Jay Jackson
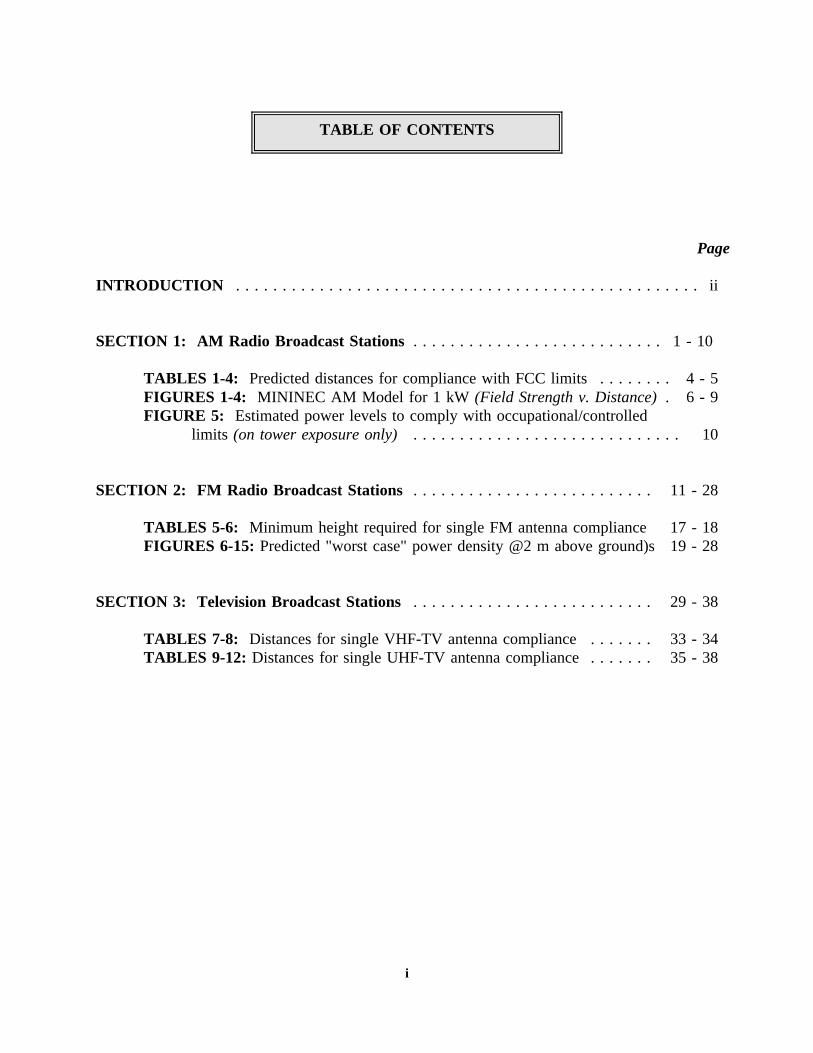
TABLE OF CONTENTS
Page
INTRODUCTION . . . . . . . . . . . . . . . . . . . . . . . . . . . . . . . . . . . . . . . . . . . . . . . . . . ii
SECTION 1: AM Radio Broadcast Stations . . . . . . . . . . . . . . . . . . . . . . . . . . . 1 - 10
TABLES 1-4: Predicted distances for compliance with FCC limits. . . . . . . . 4 - 5FIGURES 1-4: MININEC AM Model for 1 kW (Field Strength v. Distance). 6 - 9FIGURE 5: Estimated power levels to comply with occupational/controlled
limits (on tower exposure only) . . . . . . . . . . . . . . . . . . . . . . . . . . . . . 10
SECTION 2: FM Radio Broadcast Stations . . . . . . . . . . . . . . . . . . . . . . . . . . 11 - 28
TABLES 5-6: Minimum height required for single FM antenna compliance 17 - 18FIGURES 6-15: Predicted "worst case" power density @2 m above ground)s 19 - 28
SECTION 3: Television Broadcast Stations . . . . . . . . . . . . . . . . . . . . . . . . . . 29 - 38
TABLES 7-8: Distances for single VHF-TV antenna compliance. . . . . . . 33 - 34TABLES 9-12: Distances for single UHF-TV antenna compliance. . . . . . . 35 - 38
i
INTRODUCTION
This supplement is designed to be used in connection with the FCC’s
OET Bulletin 65, Version 97-01. The information in this supplement
provides additional detailed information that can be used for evaluating
compliance of radio and television broadcast stations with FCC guidelines
for exposure to radiofrequency electromagnetic fields. However, users of
this supplement should also consult Bulletin 65 for complete information on
FCC policies, guidelines, compliance-related issues and methods for
achieving compliance.
NOTE: The first edition of Bulletin 65 was issued as OST Bulletin No. 65 in October1985. This supplement contains broadcast-related information and data that have beenrevised from that which was included in the original bulletin.
Mention of commercial products does not constitute endorsement by the Federal Communications Commissionor by the authors.
ii
SECTION 1AM Radio Broadcast Stations
In determining compliance with limits for Maximum Permissible Exposure (MPE) forAM radio broadcast stations, it is normally most important to determine electric and magneticfield strength at distances relatively close to transmitting antennas. Fields from thesemonopole antennas decrease relatively rapidly with distance, and MPE limits for AM radiofrequencies are not as restrictive as those for other frequencies, such as those used for FMradio. Therefore, even for the highest powered stations, MPE limits for AM radiotransmissions would normally only be exceeded relatively close to antennas. Compliancewith the FCC’s guidelines for AM stations typically will involve assessment of exposurepotential of persons working or occupying areas in the close-in vicinity of transmittingantennas. Because such persons will always be in the near field of AM antennas, due to therelatively long wavelengths in the AM frequency band, an evaluation of both electric andmagnetic field strength is necessary.
In the original version of OET Bulletin 65, staff from the U.S. EnvironmentalProtection Agency (EPA) provided the FCC with results from a computer-based model tohelp determine compliance with MPE limits for AM radio broadcast stations. The EPAmodel used the Numeric Electromagnetic Code (NEC) computer program to predict field-strength levels near AM monopole antennas. In the past several years a PC-based version ofthis code, called MININEC, has also become available. The FCC has used MININEC toexpand and refine the predictions for electric and magnetic field-strength presented in theoriginal version of Bulletin 65. They are included in this supplement in the form of tablesand figures that can be used in evaluating compliance at these stations.
Tables 1-4 may be used to determine the minimum distance from an AM broadcastantenna to the point where electric and magnetic field strengths are predicted to correspond toMPE limit values. The tables provide compliance distances from antennas of various electricalheights transmitting at various frequencies and using various power levels. The distancesspecified are the distances from an antenna at which access should be restricted in order tocomply with both the electric and magnetic field-strength MPE limits. For antennas that donot correspond to the specific conditions given in these tables, interpolation can be used toarrive at intermediate values, or, alternatively, the greatest distance for the range used forinterpolation could be used.
Since the MPE limits for the two exposure tiers are similar for most AM frequencies,and because of variability in compliance distances according to electrical height and operatingfrequency, one entry is given in each case that applies for both occupational/controlled andgeneral population/uncontrolled exposures. These numbers represent the minimum worst-casedistances predicted for compliance with the strictest MPE limit for each case. Note that time-
1
averaging considerations are not taken into account in these computations. Continuousexposure is assumed in all cases.
This model computes field strength values in the vicinity of single antennas. For AMstations with multiple-tower arrays a conservative "worst case" prediction could be made byassuming thatall transmitted power is radiated from each antenna. Therefore, in such casesthe appropriate value from the tables could be used to define a zone of restriction around thearray, consisting of circles with equal radii, each of which is centered around a tower in thearray. Alternatively, a more accurate prediction could be made if the power actually radiatedby each tower is known.
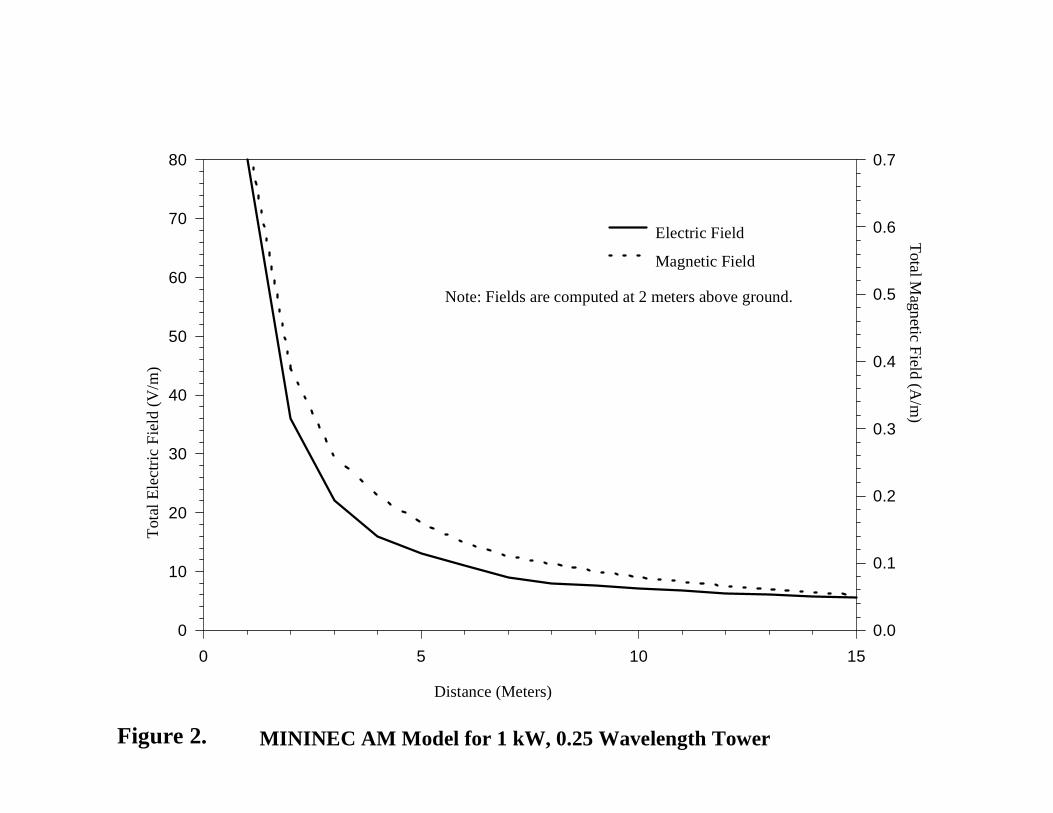
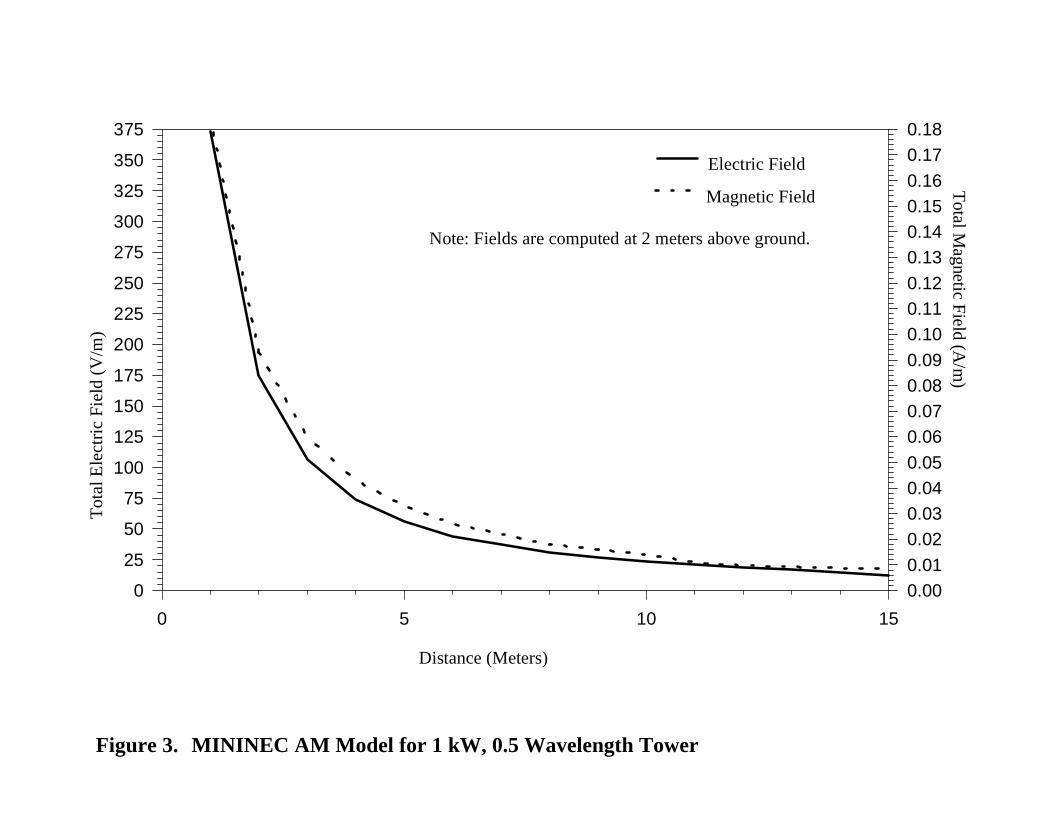
It may be necessary to predict electric and magnetic field-strength at various locationsin the vicinity of AM antennas. Therefore, Figures 1-4 have been developed for this purposeusing MININEC. These figures show conservative predictions of electric and magnetic field-strength versus distance from typical AM broadcast antennas for towers with electrical heightsequal to 0.1, 0.25, 0.5, and 0.625 wavelengths, respectively.
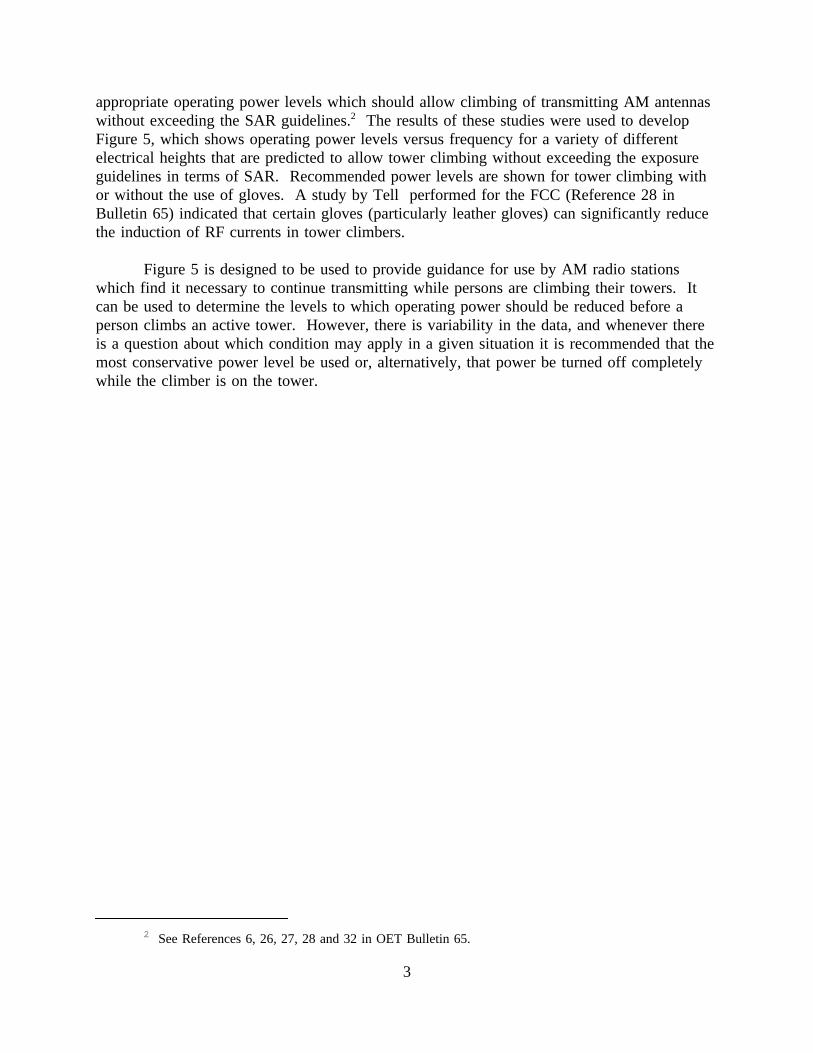
Figures 1-4 predict field strength for stations transmitting with 1 kilowatt of power.Therefore, for stations operating at other power levels values obtained from these figuresshould be multiplied by the square root of the station’s power. The following exampleillustrates the proper procedure. In this example a 50 kilowatt AM station is located near apublicly accessible area. It is desired to obtain an estimate of the field-strength levels in thisarea which is at a distance of 10 meters from the station’s single tower that has an electricalheight of 0.25. To arrive at the estimated field strength values proceed as follows:
Consult Figure 2 for an antenna with electrical height = 0.25
At 10 meters read predicted electrical field-strength = about 8 V/m
At 10 meters read predicted magnetic field-strength = about 0.06 A/m
Multiply each value by
Predicted values are 56.6 V/m and 0.42 A/m
As discussed in Section 4 of Bulletin 65, RF currents will be induced in the body ofpersons who climb transmitting AM broadcast antennas for maintenance or other purposes.This is a significant source of RF exposure and can be related to the limits for specificabsorption rate (SAR) adopted by the FCC.1 Although many stations may prefer to shutdownpower entirely while persons are climbing their antennas, in some cases this may be difficultor undesirable. Studies have been undertaken by the FCC and the EPA to determine
1 SAR is discussed in Section 1 of Bulletin 65.
2
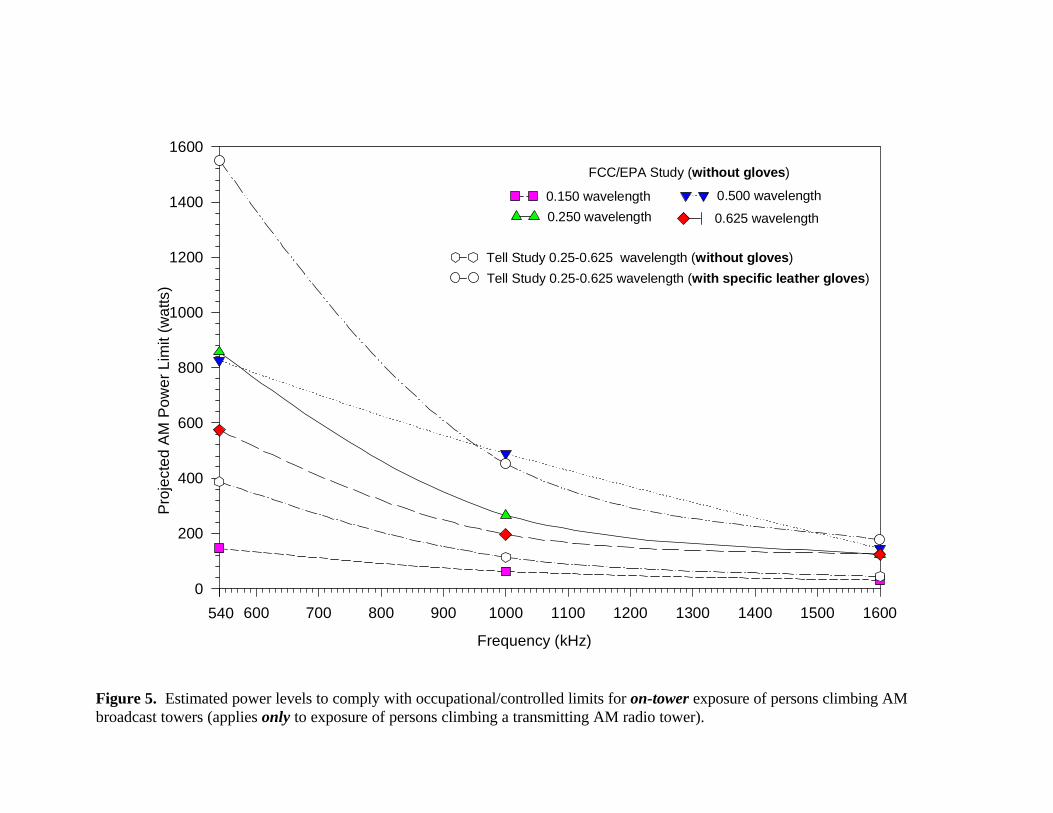
appropriate operating power levels which should allow climbing of transmitting AM antennaswithout exceeding the SAR guidelines.2 The results of these studies were used to developFigure 5, which shows operating power levels versus frequency for a variety of differentelectrical heights that are predicted to allow tower climbing without exceeding the exposureguidelines in terms of SAR. Recommended power levels are shown for tower climbing withor without the use of gloves. A study by Tell performed for the FCC (Reference 28 inBulletin 65) indicated that certain gloves (particularly leather gloves) can significantly reducethe induction of RF currents in tower climbers.
Figure 5 is designed to be used to provide guidance for use by AM radio stationswhich find it necessary to continue transmitting while persons are climbing their towers. Itcan be used to determine the levels to which operating power should be reduced before aperson climbs an active tower. However, there is variability in the data, and whenever thereis a question about which condition may apply in a given situation it is recommended that themost conservative power level be used or, alternatively, that power be turned off completelywhile the climber is on the tower.
2 See References 6, 26, 27, 28 and 32 in OET Bulletin 65.
3
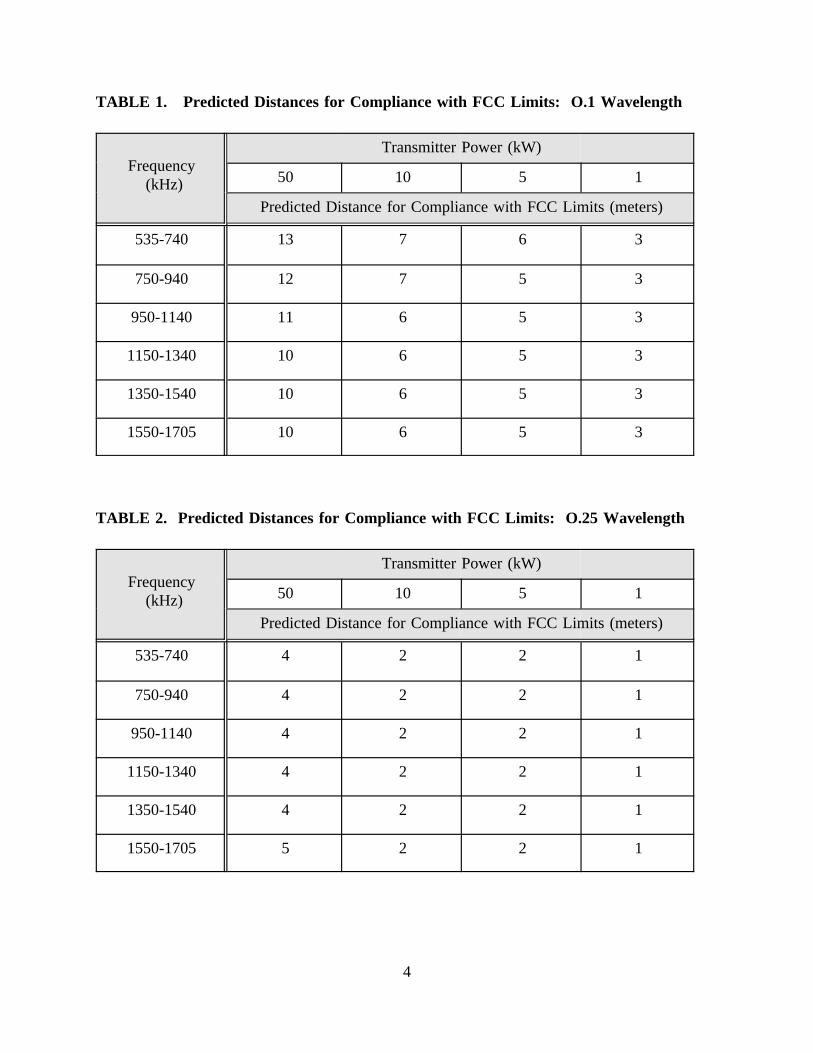
TABLE 1. Predicted Distances for Compliance with FCC Limits: O.1 Wavelength
Frequency(kHz)
Transmitter Power (kW)
50 10 5 1
Predicted Distance for Compliance with FCC Limits (meters)
535-740 13 7 6 3
750-940 12 7 5 3
950-1140 11 6 5 3
1150-1340 10 6 5 3
1350-1540 10 6 5 3
1550-1705 10 6 5 3
TABLE 2. Predicted Distances for Compliance with FCC Limits: O.25 Wavelength
Frequency(kHz)
Transmitter Power (kW)
50 10 5 1
Predicted Distance for Compliance with FCC Limits (meters)
535-740 4 2 2 1
750-940 4 2 2 1
950-1140 4 2 2 1
1150-1340 4 2 2 1
1350-1540 4 2 2 1
1550-1705 5 2 2 1
4
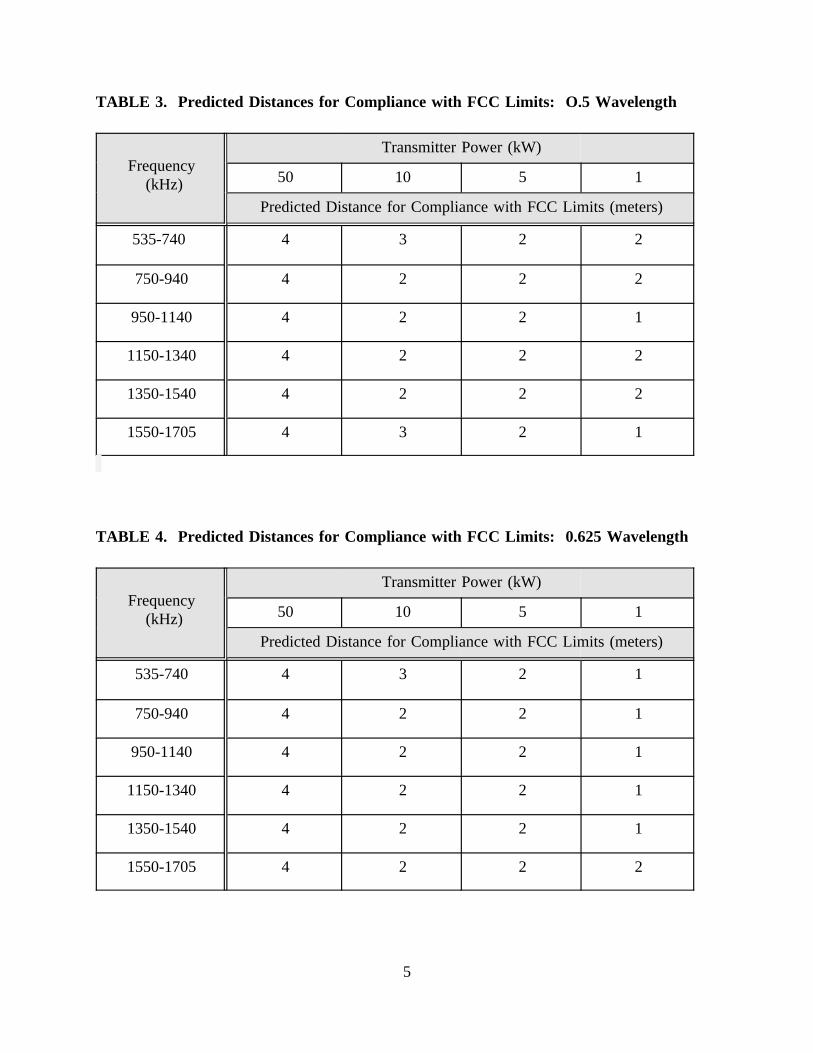
TABLE 3. Predicted Distances for Compliance with FCC Limits: O.5 Wavelength
Frequency(kHz)
Transmitter Power (kW)
50 10 5 1
Predicted Distance for Compliance with FCC Limits (meters)
535-740 4 3 2 2
750-940 4 2 2 2
950-1140 4 2 2 1
1150-1340 4 2 2 2
1350-1540 4 2 2 2
1550-1705 4 3 2 1
TABLE 4. Predicted Distances for Compliance with FCC Limits: 0.625 Wavelength
Frequency(kHz)
Transmitter Power (kW)
50 10 5 1
Predicted Distance for Compliance with FCC Limits (meters)
535-740 4 3 2 1
750-940 4 2 2 1
950-1140 4 2 2 1
1150-1340 4 2 2 1
1350-1540 4 2 2 1
1550-1705 4 2 2 2
5
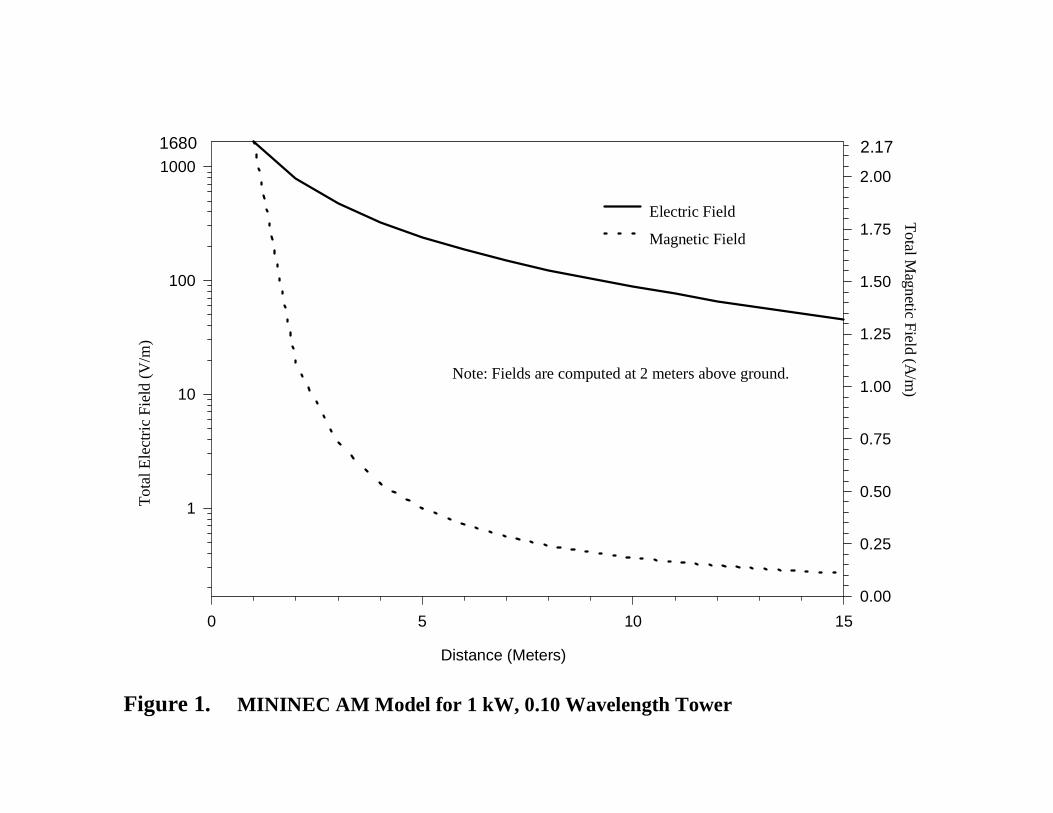
Figure 1. MININEC AM Model for 1 kW, 0.10 Wavelength Tower
Distance (Meters)
0 5 10 15
Tot
al E
lect
ric
Fie
ld (
V/m
)
1
10
100
1000
Total M
agnetic Field (A
/m)
0.00
0.25
0.50
0.75
1.00
1.25
1.50
1.75
2.00
Electric Field
Magnetic Field
Note: Fields are computed at 2 meters above ground.
2.171680
MININEC AM Model for 1 kW, 0.25 Wavelength Tower
Distance (Meters)
0 5 10 15
Tot
al E
lect
ric
Fie
ld (
V/m
)
0
10
20
30
40
50
60
70
80T
otal Magnetic F
ield (A/m
)
0.0
0.1
0.2
0.3
0.4
0.5
0.6
0.7
Electric Field
Magnetic Field
Note: Fields are computed at 2 meters above ground.
Figure 2.
Distance (Meters)
0 5 10 15
Tot
al E
lect
ric
Fiel
d (V
/m)
0
25
50
75
100
125
150
175
200
225
250
275
300
325
350
375
Total M
agnetic Field (A/m
)
0.000.01
0.020.030.040.05
0.060.070.080.09
0.100.110.12
0.130.140.150.16
0.170.18
Electric Field
Magnetic Field
Note: Fields are computed at 2 meters above ground.
Figure 3. MININEC AM Model for 1 kW, 0.5 Wavelength Tower
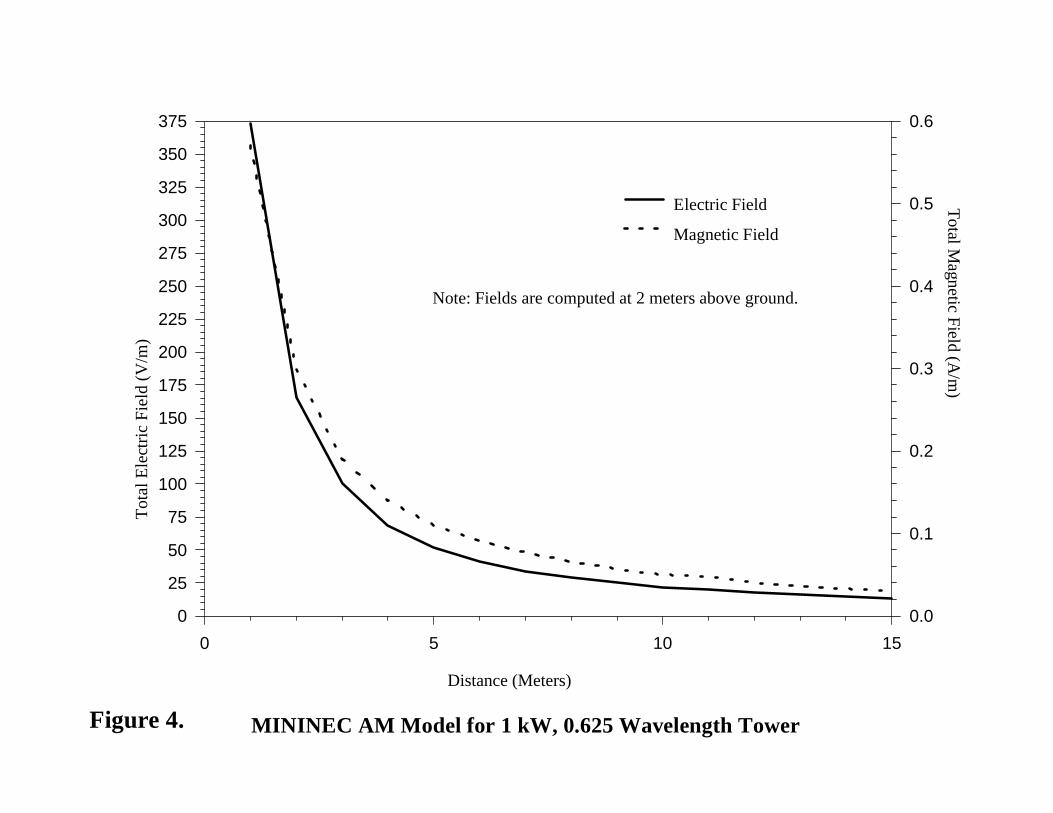
MININEC AM Model for 1 kW, 0.625 Wavelength Tower
Distance (Meters)
0 5 10 15
Tot
al E
lect
ric
Fiel
d (V
/m)
0
25
50
75
100
125
150
175
200
225
250
275
300
325
350
375T
otal Magnetic Field (A
/m)
0.0
0.1
0.2
0.3
0.4
0.5
0.6
Electric Field
Magnetic Field
Note: Fields are computed at 2 meters above ground.
Figure 4.
Frequency (kHz)
600 700 800 900 1000 1100 1200 1300 1400 1500 1600
Pro
ject
ed A
M P
ower
Lim
it (w
atts
)
0
200
400
600
800
1000
1200
1400
1600
0.250 wavelength
0.500 wavelength
0.625 wavelength
Tell Study 0.25-0.625 wavelength (without gloves)
0.150 wavelength
540
FCC/EPA Study (without gloves)
Tell Study 0.25-0.625 wavelength (with specific leather gloves)
Figure 5. Estimated power levels to comply with occupational/controlled limits for on-tower exposure of persons climbing AMbroadcast towers (applies only to exposure of persons climbing a transmitting AM radio tower).
SECTION 2FM Radio Broadcast Stations
Antennas used for FM radio broadcast stations normally consist of an array ofelements stacked vertically and typically side-mounted on a tower. The elements are usuallyspaced about one wavelength apart and are fed in phase with power distributed equally amongthe elements. FM radio stations transmit in the 88-108 MHz band. Consulting Table 1 inAppendix A of OET Bulletin 65 shows that at these frequencies the MPE limit for generalpopulation/uncontrolled exposure is 0.2 mW/cm² (200 µW/cm2) and the limit foroccupational/controlled exposure is 1 mW/cm² (1000 µW/cm2).
Section 2 of Bulletin 65 explains how calculations can be performed to predict RFfield-strength or power density near various antennas, including those used for FM radiotransmissions. In addition, in 1985, the Environmental Protection Agency (EPA) developed acomputer model for estimating ground-level power densities in the vicinity of typical FMbroadcast towers. The EPA model estimates power densities in the vicinity of typical FMbroadcast antennas for various antenna types and patterns. With some minor modifications,the FCC has successfully used this model over the past several years to predict ground-levelpower densities near FM towers. The EPA model considers the following variables of an FMantenna in arriving at is predictions: (1) the total effective radiated power (both horizontaland vertical), (2) the height above ground to the center of radiation of the antenna, (3) thetype of antenna element used in the antenna array and (4) the number of elements (or bays) inthe antenna array. The model is discussed in detail in an EPA publication by P. Gailey andR. Tell (Reference 11 in Bulletin 65). The FCC’s version of the FM computer model can bedownloaded from the FCC’s Office of Engineering and Technology World Wide Web site.3
The FM computer model uses element and array radiation patterns to developpredicted field strengths and power densities on the ground.4 Ground reflection is taken intoaccount in these calculations (a factor of 1.6 for field strength as discussed in Section 2 ofBulletin 65). Although the model is theoretical, measurements made by the EPA and byothers around existing FM antenna towers have shown good agreement with predicted values.
3 The FCC’s FM computer model ("FM Model") may be downloaded via the Internet from the FCC’sWeb Site at http://www.fcc.gov/oet/info/software/. Any future revisions to this software may be found at thislocation. For further details contact: rf [email protected] or the FCC’s RF Safety Program at (202) 418-2464.
4 The EPA measured the vertical radiation patterns of several element types and incorporated themeasurement data into its computer model. The FCC has also used the EPA element pattern data and has addedother data submitted by manufacturers for additional antenna elements.
11
For a variety of antenna types, the FM computer model has been used by the FCC andothers to predict values of far-field equivalent power density at specific locations on theground relative to existing or proposed FM antennas. The model can also be used to predictthe minimum height to an antenna’s center of radiation necessary to prevent RF levels fromexceeding an established level, such as the 200 µW/cm2 MPE limit for generalpopulation/uncontrolled exposure. The FCC version of the FM computer model calculatesfields at a height of 2 meters above ground, taken as the approximate upper range for theheight of a standing person.
In performing any calculations for an FM radio antenna, whether using the equationsof Section 2 of Bulletin 65 or by use of the FM computer model, the value used for ERPmust be thetotal ERP. This means that in the case of a "circularly-polarized" antenna thesum ofboth the horizontal and vertical ERP values must be used. For example, an FMstation using a circularly-polarized antenna that is authorized to use 100 kilowatts (kW) ERPin the horizontal polarization could be assumed to have a total ERP of 200 kW (100 + 100),unless otherwise specified.
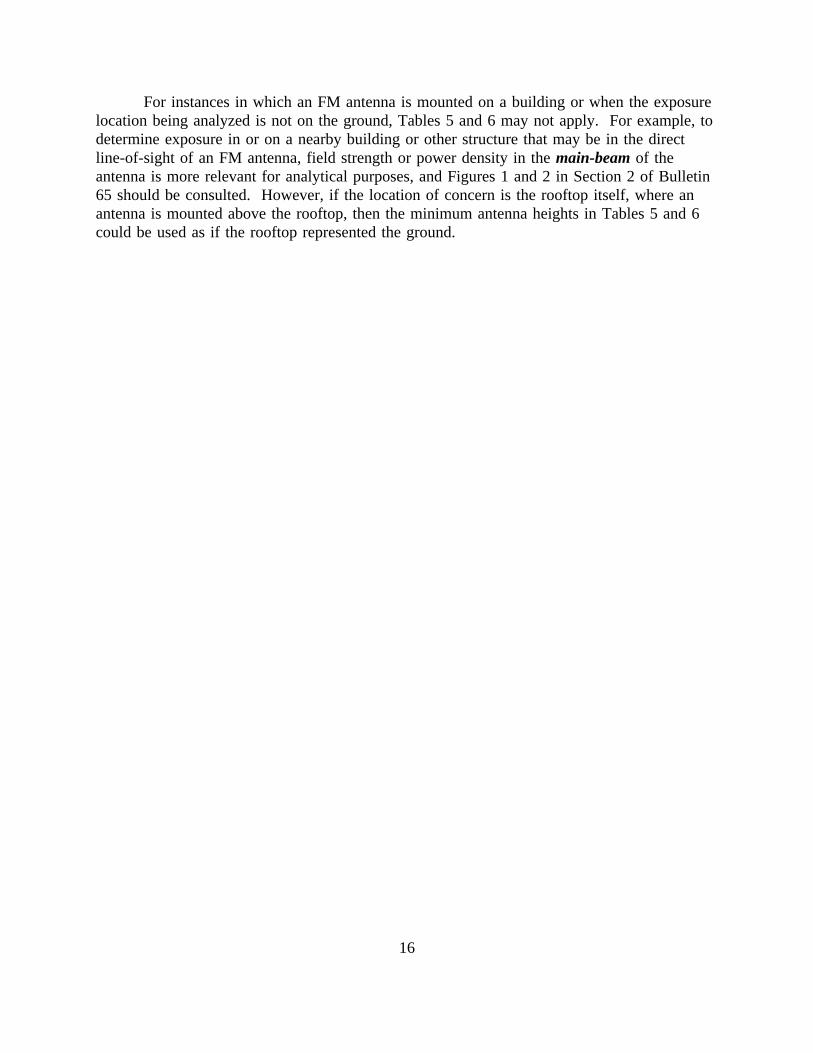
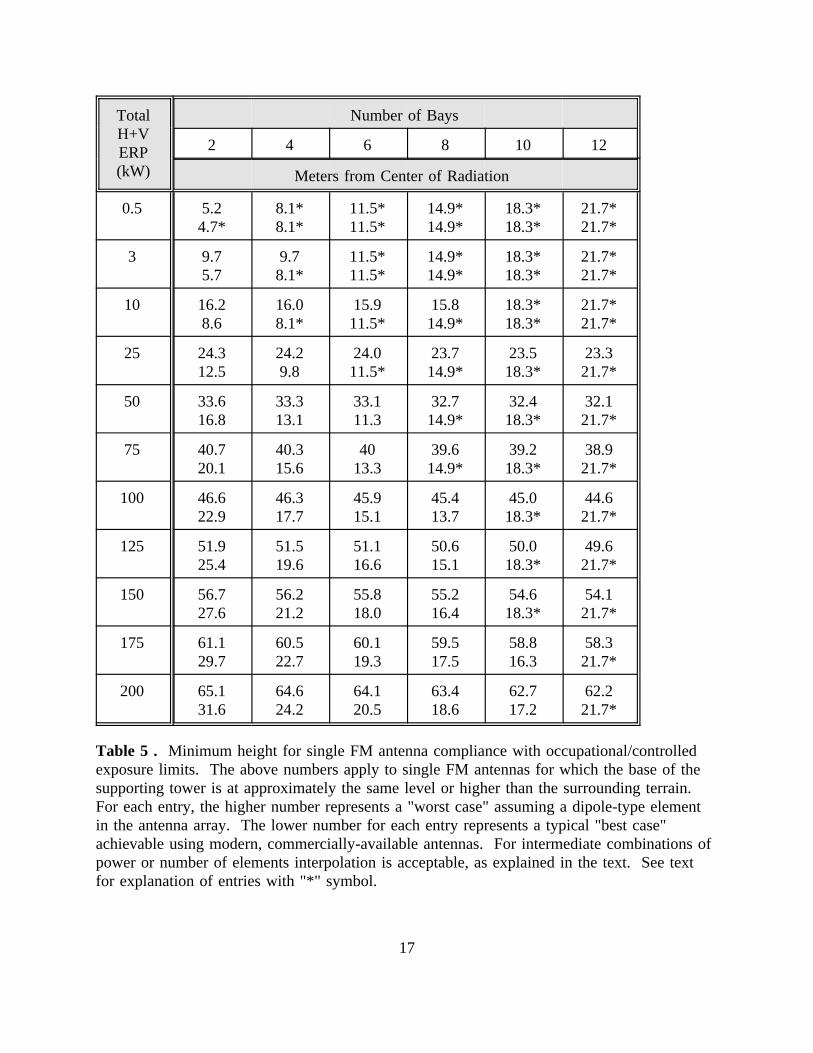
Using the FM computer model, tables and figures have been derived for use by FMstation licensees and applicants in evaluating compliance with the FCC’s RF exposure limits.Table 5 lists estimated minimum antenna heights necessary to prevent power densities on theground (actually at 2 m above ground) from exceeding the FCC’s occupational/controlledMPE limits. Table 6 gives estimated antenna heights necessary to prevent "ground-level"power densities (2 m above ground) from exceeding the general population/uncontrolled MPElimits. The tables and figures in this section are designed to predict spatial peak values forpower densities rather than values that are spatially-averaged over a given dimension such asthe height of a human being. In that regard, the results may be conservative, and, in somecases, could indicate non-compliance when, in fact, a station may be in compliance.
Tables 5 and 6 should be consulted as a first step in evaluating an existing orproposed FM radio broadcast facility to determine whether it would comply with the FCC’sMPE limits at ground level. Both tables will need to be consulted to ensure that ground-levelexposures for all persons, whether workers or members of the general public, are below theappropriate acceptable levels. If non-compliance is indicated then some restriction of accessor other mitigating measures may be necessary (see Section 4 of Bulletin 65 on controllingexposure for more information). In the case of Table 5, if a given tower height is less thanthe appropriate minimum value for occupational/controlled exposure, appropriate workpractices may have to be implemented to ensure protection of personnel at the tower site (seeSection 4 of Bulletin 65).
Note that Tables 5 and 6 give predicted minimum heights to the radiation center for anumber of combinations of total ERP and number of elements (bays). Note that for eachentry in the tables two values are given. In each case the top (higher) number represents the"worst case" where computations were based on using dipole elements in arrays with one-
12
wavelength spacing.5 The bottom (lower) entries in the table represent a typical "best case"where computations used antenna elements that, according to EPA’s analysis, were designedto minimize radiation in the direction of the ground.6
It is important to recognize that the values in Tables 5 and 6 apply tosingle FMantennas and to towers whose bases are approximately at the same level or higher than thesurrounding terrain. For multiple antennas on the same tower, it would be possible to arriveat a worst-case estimate using these tables by assuming that the total ERP fromall antennaswas concentrated at the radiation center of the antenna that is lowest on the tower. For suchan imaginary radiating source, the number of elements could be considered to be that of theantenna with the smallest number of elements. A more accurate estimate could be made byusing Figures 6-15 (described below) or by using the FM model software to estimate powerdensity contributions from each antenna at a ground-level point of interest and then add thecontributions to arrive at the total predicted power density at that point.
In some cases FM radio antennas may have a relatively large number of elements andthe lowest element may be a significant distance from the radiation center. The FM computermodel may not be accurate when predicting field levels from relatively large multiple-elementarrays at distances very close to the antenna. For example, in some cases the minimumantenna height computed using the FM computer model may be on the order of or less thanone-half the array length (meaning that the antenna would be mounted with its lowest elementat or below ground). Obviously this is not a realistic or desirable situation. Therefore, inTables 5 and 6, values have been adjusted to ensure that the lowest element in an array is atleast 3 meters above ground-levelin all cases,i.e., head height plus an additional 1-metermargin of safety. These adjusted numbers are marked with the "*" symbol.7
For FM antennas with ERP/element combinations that are intermediate to the valueslisted in Tables 5 and 6, interpolation can be used between table entries, assuming a directrelation between antenna height and power and an inverse relation between antenna height
5 As shown by the EPA model, the use of dipole elements in an array results in the greatest amount ofdownward radiation due to the approximately circular radiation pattern of a dipole.
6 As shown by the EPA and others, other element types generate vertical radiation patterns that tend tominimize downward radiation significantly. The "best case" element studied by the EPA had a maximumdownward radiation field factor of less than 0.2 compared to the approximate 1.0 maximum for a dipole element.
7 These values were determined by first calculating the longest wavelength that can be utilized for FMradio broadcast (about 3.4 meters at 88 MHz). Assuming one-wavelength spacing between the elements in anantenna array, the greatest possible length for an array with a given number of elements can be approximated.Since the radiation center will be located in the middle of the array, the minimum height of the antenna aboveground has to be at least one-half of the array length. The values for minimum height given in the tables arealways at least 3 meters greater than one-half the calculated array length even though the FM computer modelmay indicate a lesser value.
13
and number of elements. Alternatively, the next highest value could be used for ERP and thenext lowest value could be used for number of elements. For example, with respect to thepublic/uncontrolled MPE limits, an FM station with a total ERP of 20 kW and 5 elementscould use the values given in Table 6 for 25 kW and 4 bays (51.5 meters, worst case, or 21.1meters, best case), since these values would be conservative. Interpolation would yield morerealistic values of either 45.4 m or 45.1 m for worst case, depending on whether the 4-bay or6-bay column is used. Similar interpolation could be performed for the best case values.
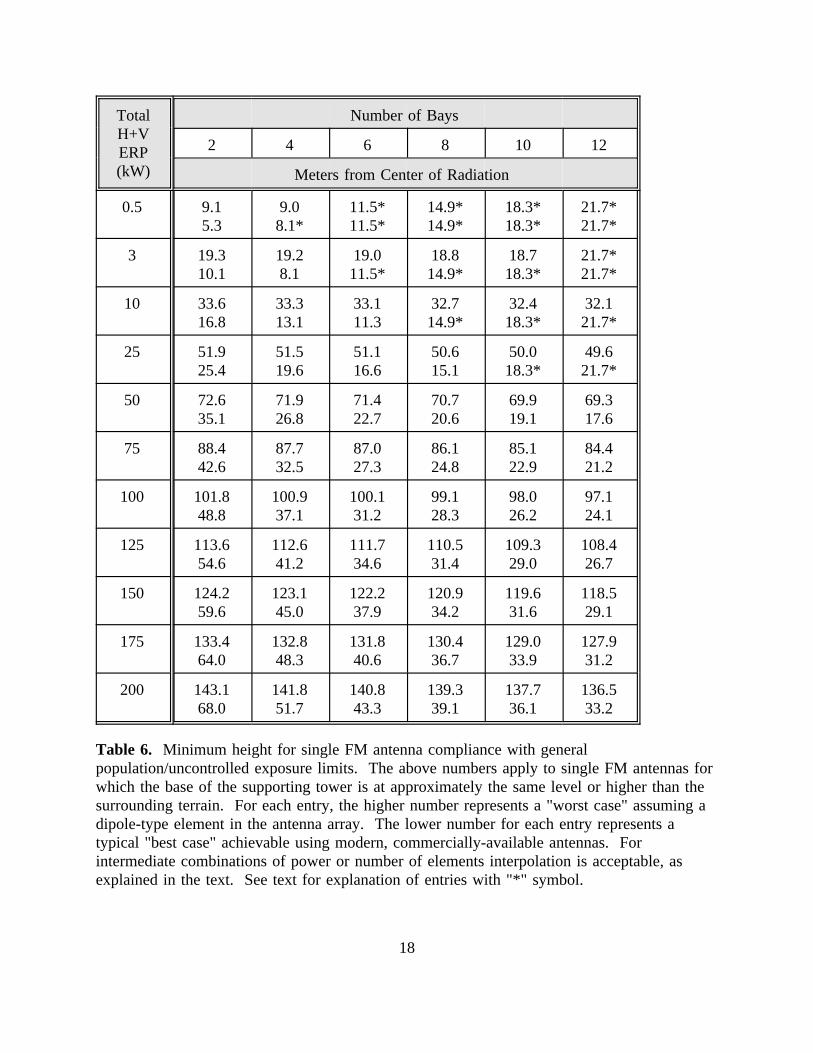
In determining compliance for a proposed or existing FM facility, Tables 5 and 6 maybe used initially to determine that a station is or will be in compliance with the MPE limits.However, if comparison with the appropriate values in the tables indicates potential non-compliance, i.e., if the antenna center of radiation islessthan the indicated minimum towerheight necessary for compliance, further analysis will be necessary. For example, Figures 6-15 can be consulted, calculations can be made (see Section 2 of Bulletin 65) or FM modelsoftware can be used to determine predicted field levels. Bulletin 65 can then be consultedfor information on how to ensure compliance (e.g., Section 4 on controlling exposure).
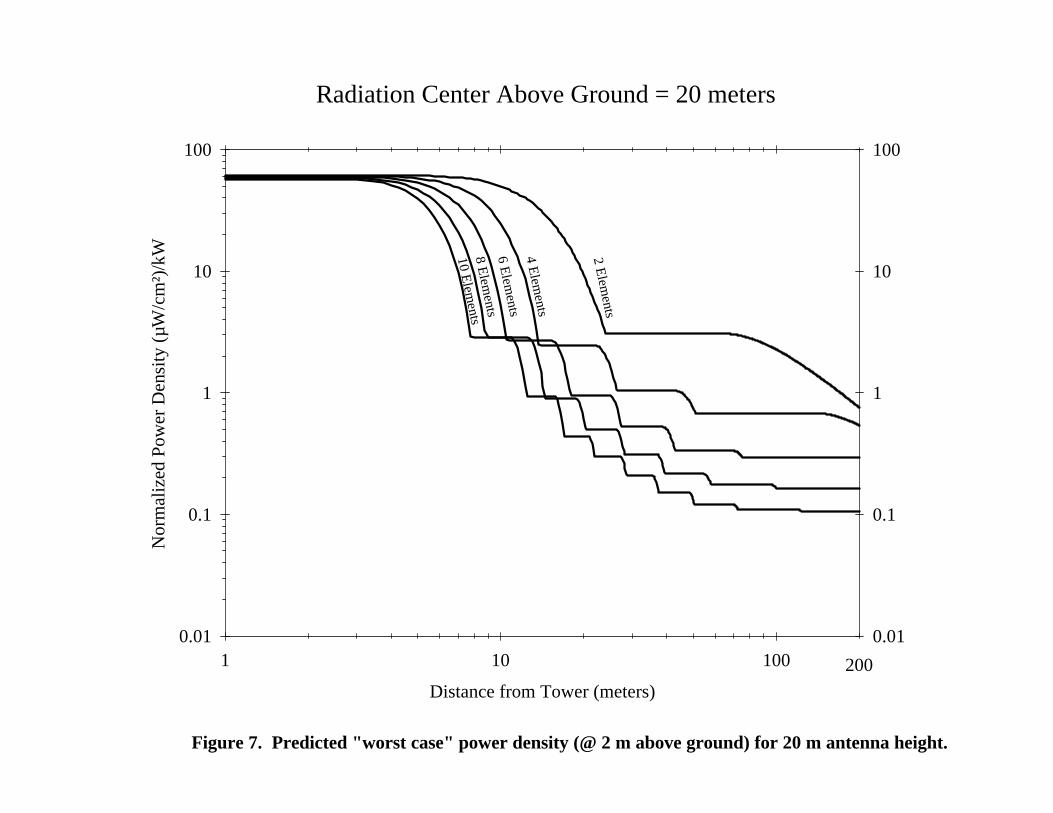
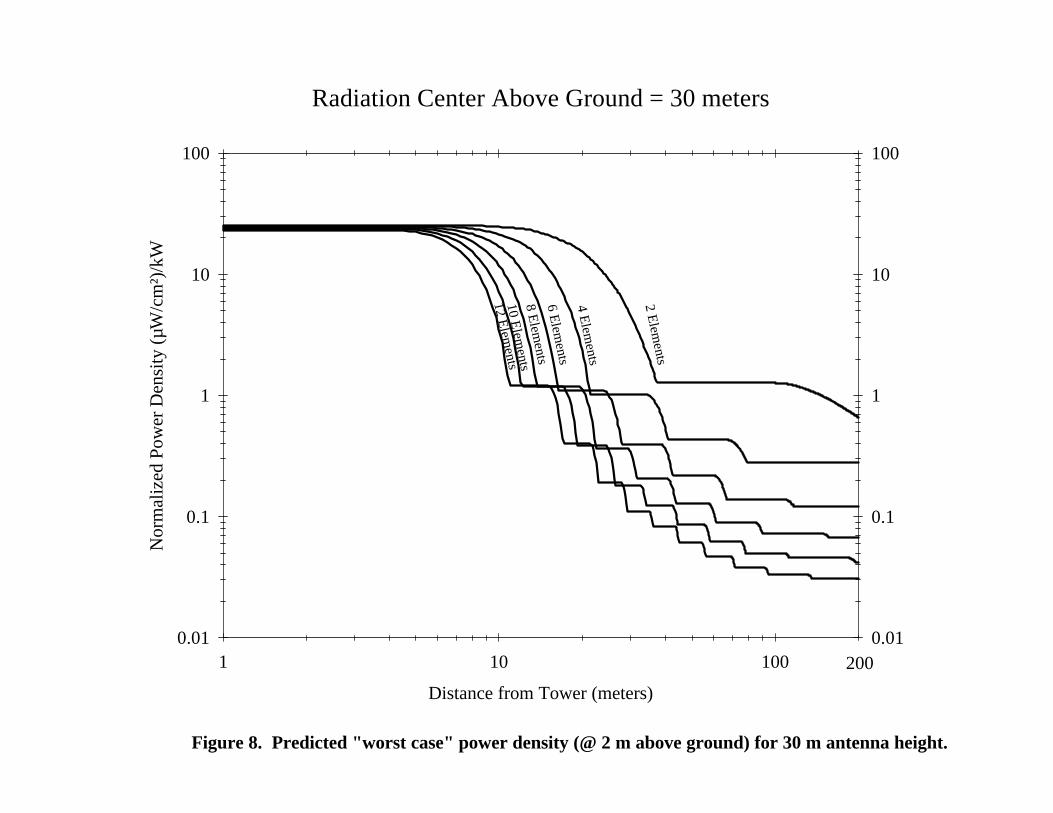
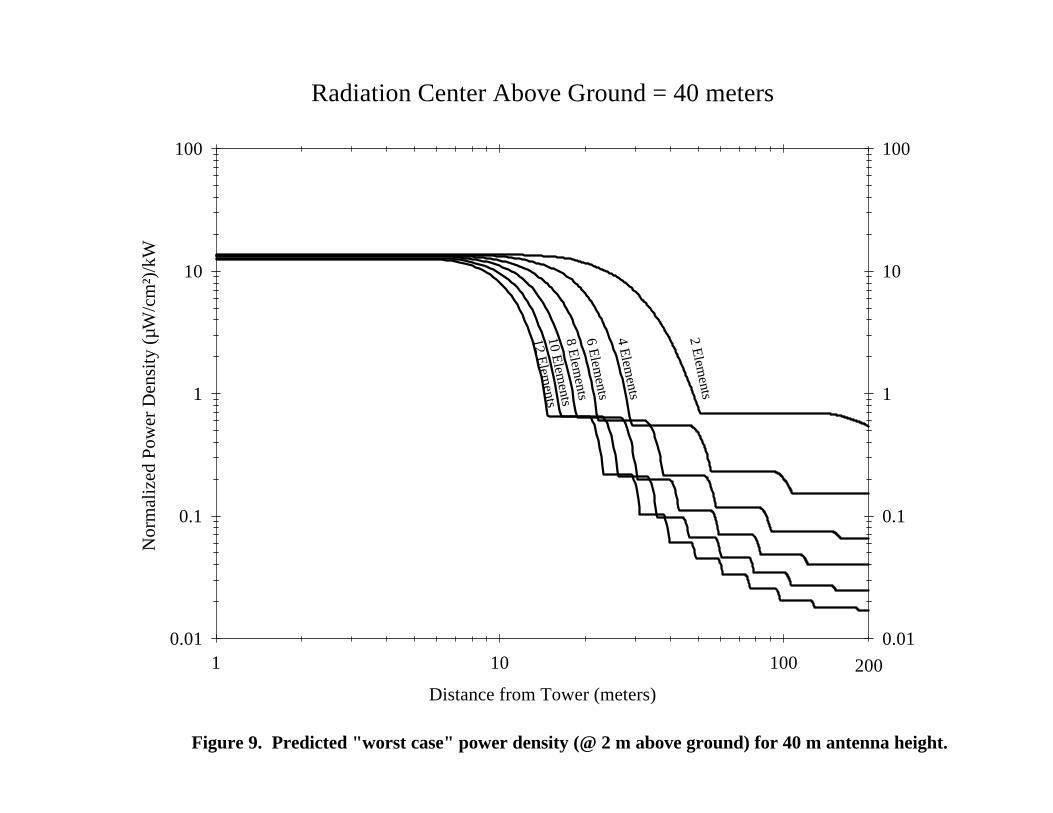
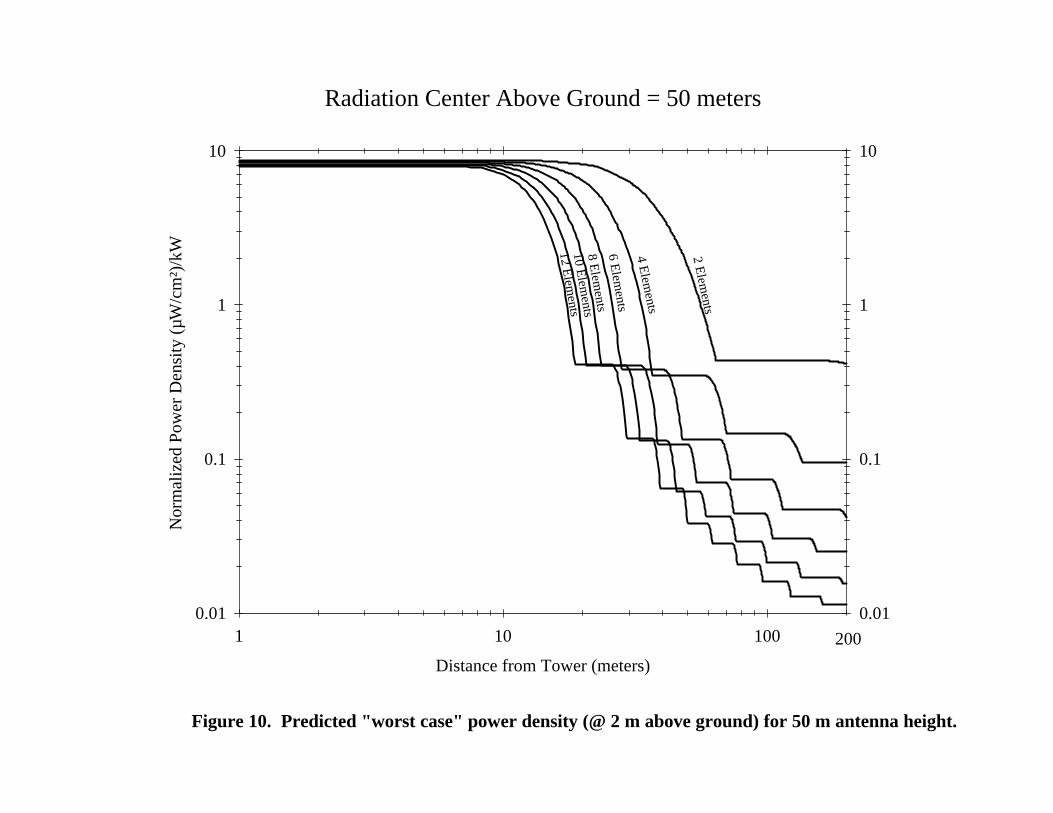
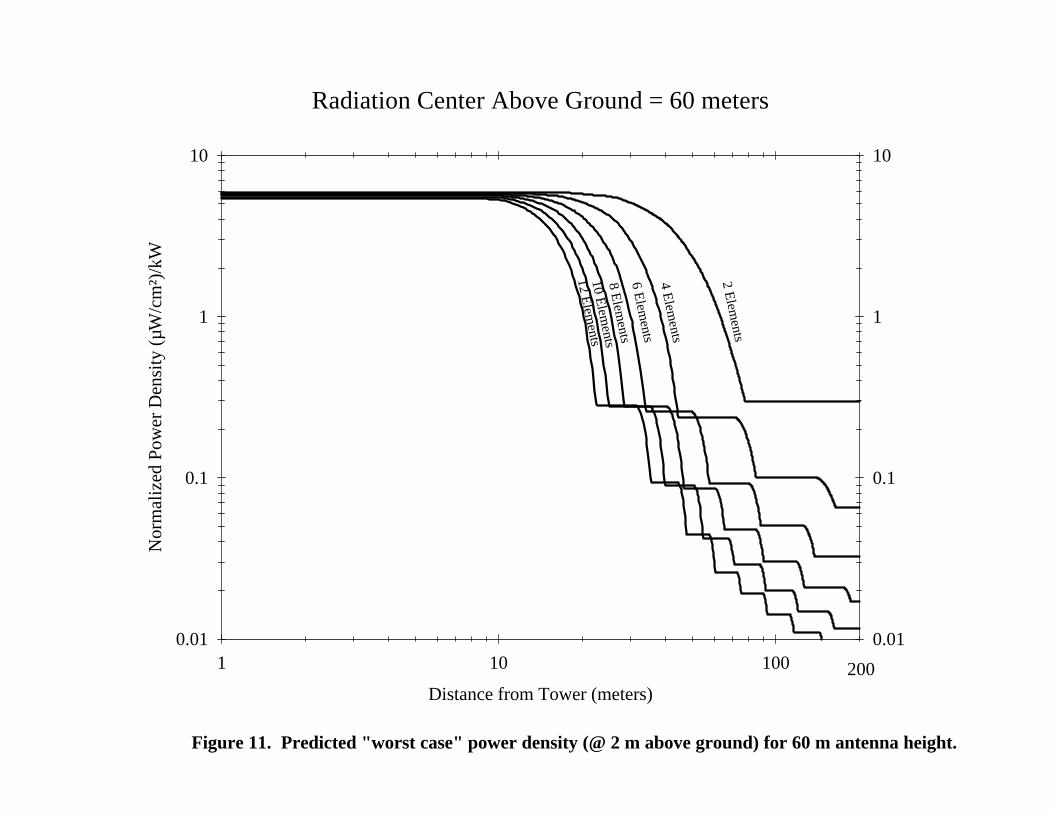
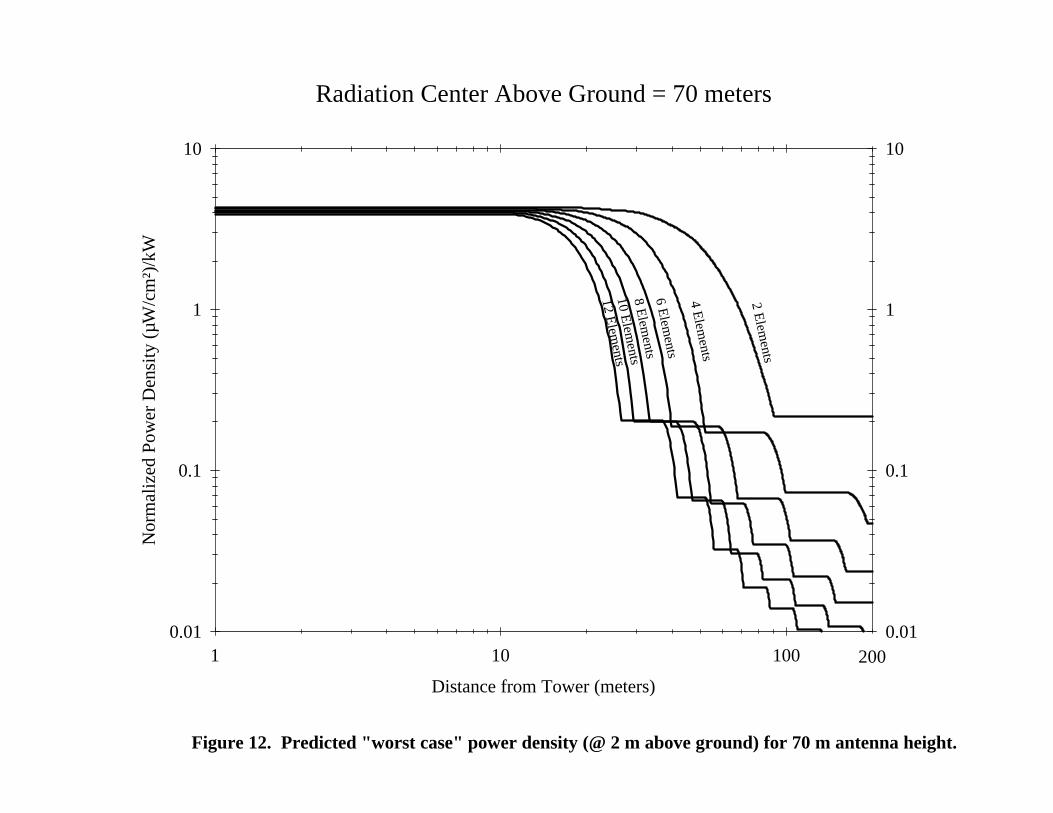
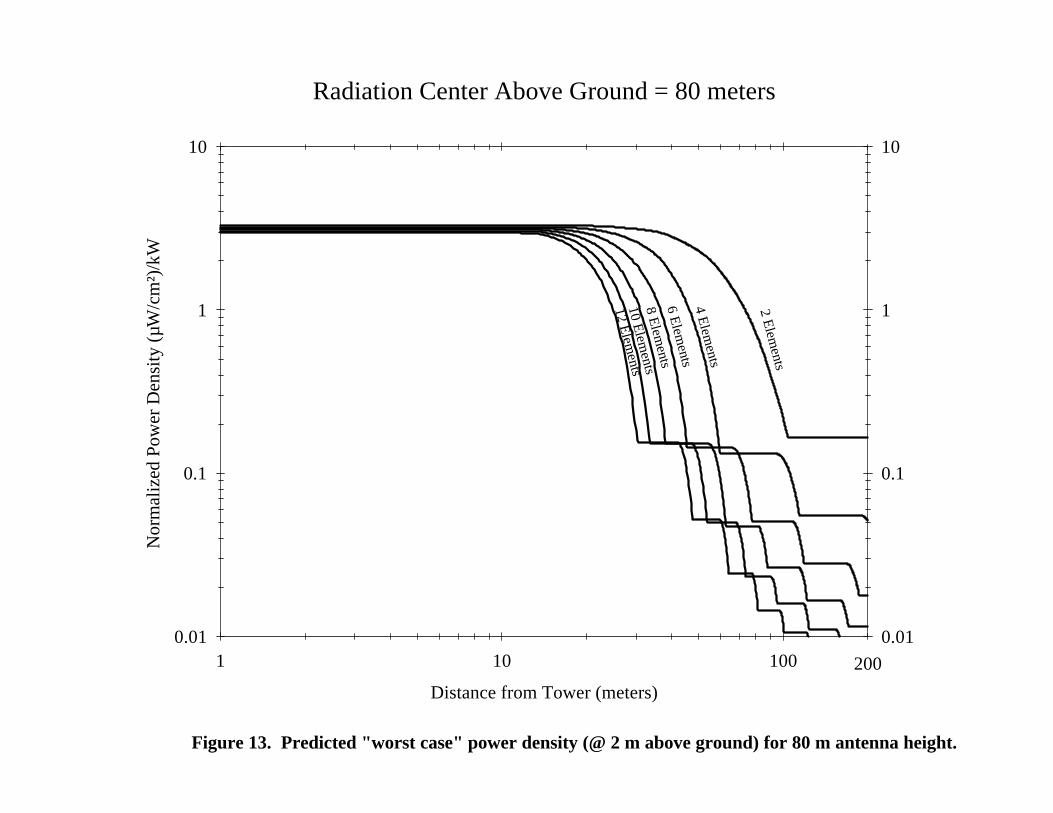
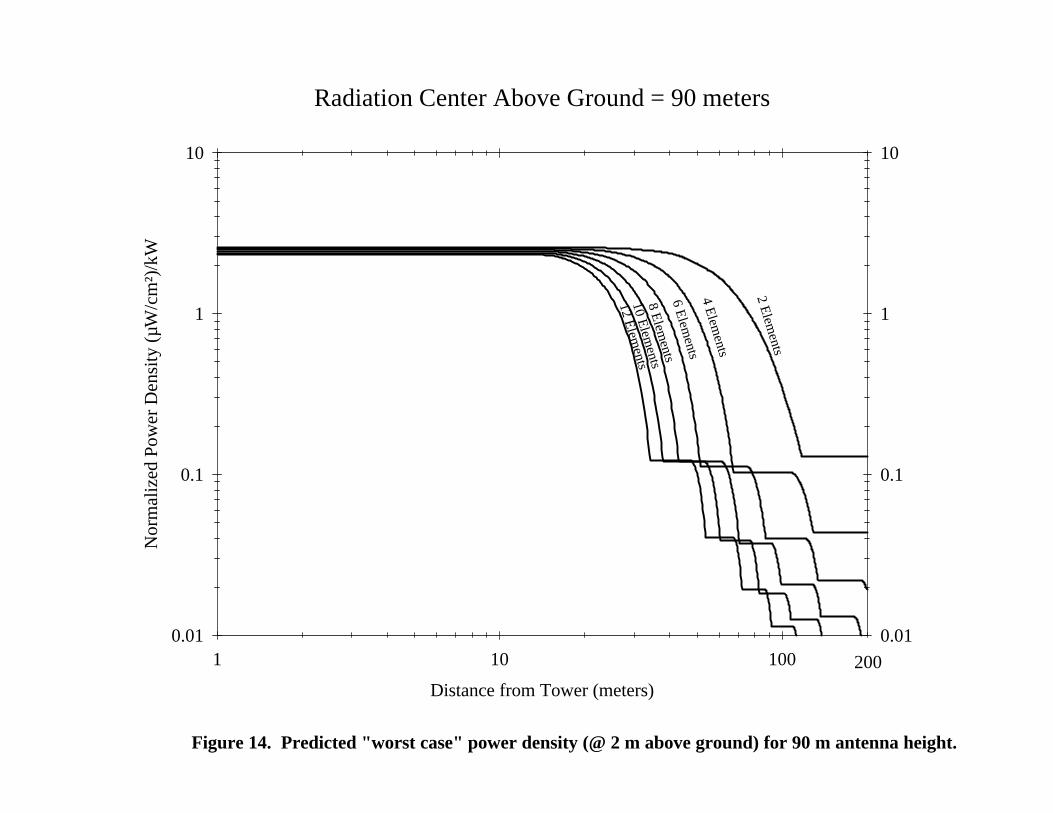
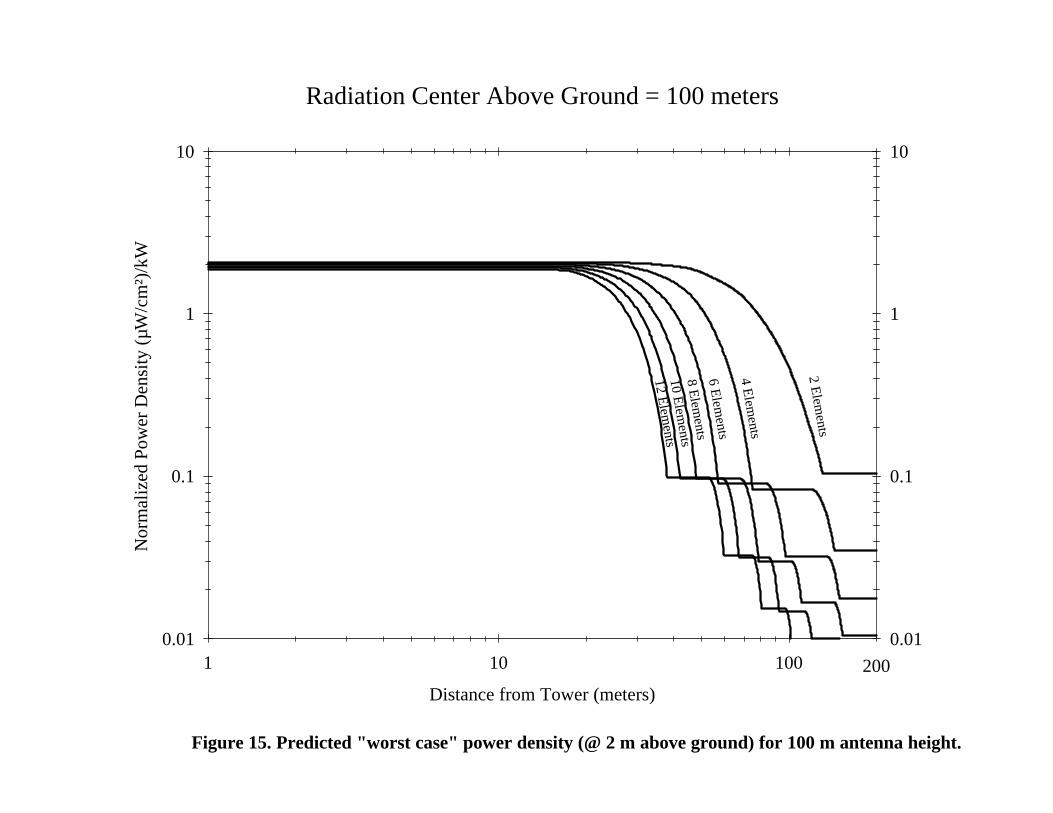
Figures 6-15 were generated using the FCC’s FM computer model. These figuresinclude curves of predicted far-field equivalent, "ground-level" power density (2 m aboveground) versus distance from the base of towers on which FM antennas are mounted forvarious combinations of total ERP, height to radiation center and number of elements. Byconsulting the appropriate figure, the exposure level at a given point near the ground can bepredicted, thereby determining places where access may have to be restricted. It should beemphasized that these figures show"worst-case" curves assuming dipole elements in the FMantenna array. Therefore, the values in these figures should be conservative and shouldrepresent the upper range for power densities for the given conditions. In general, if the FMcomputer model is used with other element type different curves, with lower power densityvalues, would be generated for a given set of conditions.
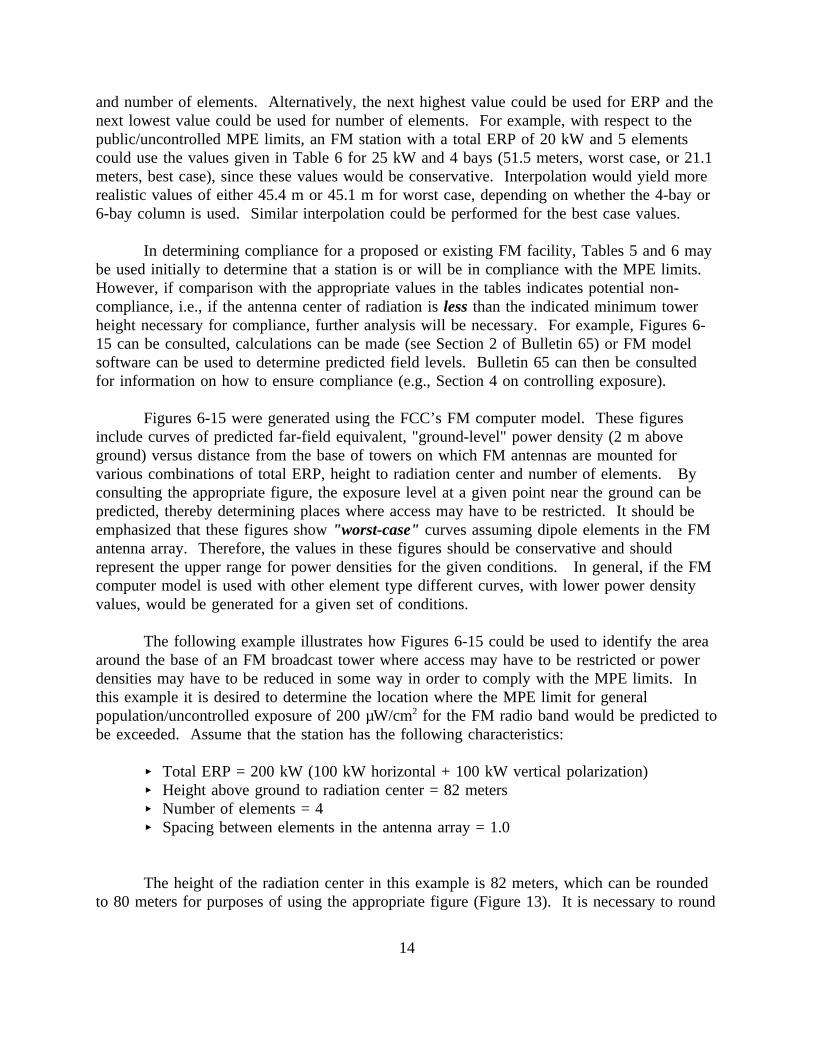
The following example illustrates how Figures 6-15 could be used to identify the areaaround the base of an FM broadcast tower where access may have to be restricted or powerdensities may have to be reduced in some way in order to comply with the MPE limits. Inthis example it is desired to determine the location where the MPE limit for generalpopulation/uncontrolled exposure of 200 µW/cm2 for the FM radio band would be predicted tobe exceeded. Assume that the station has the following characteristics:
Total ERP = 200 kW (100 kW horizontal + 100 kW vertical polarization)Height above ground to radiation center = 82 metersNumber of elements = 4Spacing between elements in the antenna array = 1.0
The height of the radiation center in this example is 82 meters, which can be roundedto 80 meters for purposes of using the appropriate figure (Figure 13). It is necessary to round
14
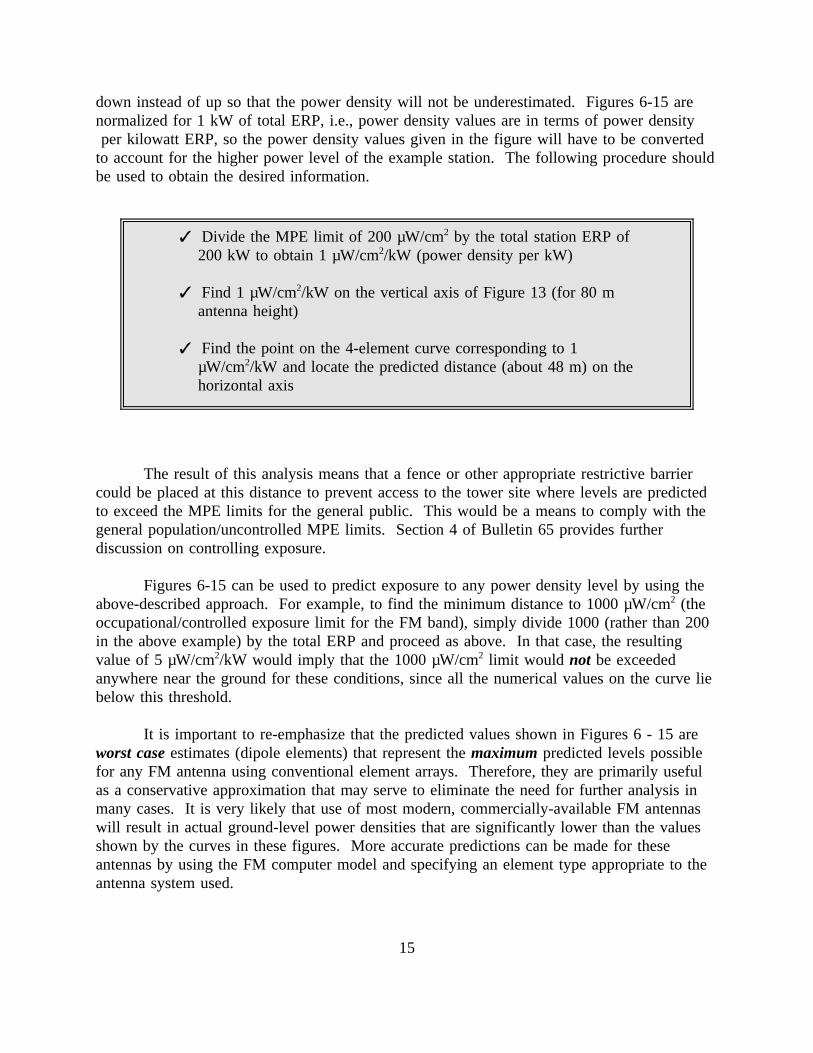
down instead of up so that the power density will not be underestimated. Figures 6-15 arenormalized for 1 kW of total ERP, i.e., power density values are in terms of power densityper kilowatt ERP, so the power density values given in the figure will have to be converted
to account for the higher power level of the example station. The following procedure shouldbe used to obtain the desired information.
Divide the MPE limit of 200 µW/cm2 by the total station ERP of200 kW to obtain 1 µW/cm2/kW (power density per kW)
Find 1 µW/cm2/kW on the vertical axis of Figure 13 (for 80 mantenna height)
Find the point on the 4-element curve corresponding to 1µW/cm2/kW and locate the predicted distance (about 48 m) on thehorizontal axis
The result of this analysis means that a fence or other appropriate restrictive barriercould be placed at this distance to prevent access to the tower site where levels are predictedto exceed the MPE limits for the general public. This would be a means to comply with thegeneral population/uncontrolled MPE limits. Section 4 of Bulletin 65 provides furtherdiscussion on controlling exposure.
Figures 6-15 can be used to predict exposure to any power density level by using theabove-described approach. For example, to find the minimum distance to 1000 µW/cm2 (theoccupational/controlled exposure limit for the FM band), simply divide 1000 (rather than 200in the above example) by the total ERP and proceed as above. In that case, the resultingvalue of 5 µW/cm2/kW would imply that the 1000 µW/cm2 limit would not be exceededanywhere near the ground for these conditions, since all the numerical values on the curve liebelow this threshold.
It is important to re-emphasize that the predicted values shown in Figures 6 - 15 areworst caseestimates (dipole elements) that represent themaximum predicted levels possiblefor any FM antenna using conventional element arrays. Therefore, they are primarily usefulas a conservative approximation that may serve to eliminate the need for further analysis inmany cases. It is very likely that use of most modern, commercially-available FM antennaswill result in actual ground-level power densities that are significantly lower than the valuesshown by the curves in these figures. More accurate predictions can be made for theseantennas by using the FM computer model and specifying an element type appropriate to theantenna system used.
15
For instances in which an FM antenna is mounted on a building or when the exposurelocation being analyzed is not on the ground, Tables 5 and 6 may not apply. For example, todetermine exposure in or on a nearby building or other structure that may be in the directline-of-sight of an FM antenna, field strength or power density in themain-beamof theantenna is more relevant for analytical purposes, and Figures 1 and 2 in Section 2 of Bulletin65 should be consulted. However, if the location of concern is the rooftop itself, where anantenna is mounted above the rooftop, then the minimum antenna heights in Tables 5 and 6could be used as if the rooftop represented the ground.
16
TotalH+VERP(kW)
Number of Bays
2 4 6 8 10 12
Meters from Center of Radiation
0.5 5.24.7*
8.1*8.1*
11.5*11.5*
14.9*14.9*
18.3*18.3*
21.7*21.7*
3 9.75.7
9.78.1*
11.5*11.5*
14.9*14.9*
18.3*18.3*
21.7*21.7*
10 16.28.6
16.08.1*
15.911.5*
15.814.9*
18.3*18.3*
21.7*21.7*
25 24.312.5
24.29.8
24.011.5*
23.714.9*
23.518.3*
23.321.7*
50 33.616.8
33.313.1
33.111.3
32.714.9*
32.418.3*
32.121.7*
75 40.720.1
40.315.6
4013.3
39.614.9*
39.218.3*
38.921.7*
100 46.622.9
46.317.7
45.915.1
45.413.7
45.018.3*
44.621.7*
125 51.925.4
51.519.6
51.116.6
50.615.1
50.018.3*
49.621.7*
150 56.727.6
56.221.2
55.818.0
55.216.4
54.618.3*
54.121.7*
175 61.129.7
60.522.7
60.119.3
59.517.5
58.816.3
58.321.7*
200 65.131.6
64.624.2
64.120.5
63.418.6
62.717.2
62.221.7*
Table 5 . Minimum height for single FM antenna compliance with occupational/controlledexposure limits. The above numbers apply to single FM antennas for which the base of thesupporting tower is at approximately the same level or higher than the surrounding terrain.For each entry, the higher number represents a "worst case" assuming a dipole-type elementin the antenna array. The lower number for each entry represents a typical "best case"achievable using modern, commercially-available antennas. For intermediate combinations ofpower or number of elements interpolation is acceptable, as explained in the text. See textfor explanation of entries with "*" symbol.
17
TotalH+VERP(kW)
Number of Bays
2 4 6 8 10 12
Meters from Center of Radiation
0.5 9.15.3
9.08.1*
11.5*11.5*
14.9*14.9*
18.3*18.3*
21.7*21.7*
3 19.310.1
19.28.1
19.011.5*
18.814.9*
18.718.3*
21.7*21.7*
10 33.616.8
33.313.1
33.111.3
32.714.9*
32.418.3*
32.121.7*
25 51.925.4
51.519.6
51.116.6
50.615.1
50.018.3*
49.621.7*
50 72.635.1
71.926.8
71.422.7
70.720.6
69.919.1
69.317.6
75 88.442.6
87.732.5
87.027.3
86.124.8
85.122.9
84.421.2
100 101.848.8
100.937.1
100.131.2
99.128.3
98.026.2
97.124.1
125 113.654.6
112.641.2
111.734.6
110.531.4
109.329.0
108.426.7
150 124.259.6
123.145.0
122.237.9
120.934.2
119.631.6
118.529.1
175 133.464.0
132.848.3
131.840.6
130.436.7
129.033.9
127.931.2
200 143.168.0
141.851.7
140.843.3
139.339.1
137.736.1
136.533.2
Table 6. Minimum height for single FM antenna compliance with generalpopulation/uncontrolled exposure limits. The above numbers apply to single FM antennas forwhich the base of the supporting tower is at approximately the same level or higher than thesurrounding terrain. For each entry, the higher number represents a "worst case" assuming adipole-type element in the antenna array. The lower number for each entry represents atypical "best case" achievable using modern, commercially-available antennas. Forintermediate combinations of power or number of elements interpolation is acceptable, asexplained in the text. See text for explanation of entries with "*" symbol.
18
Radiation Center Above Ground = 10 meters
Distance from Tower (meters)
1 10 100
Nor
mal
ized
Pow
er D
ensi
ty (
µW/c
m²)
/kW
0.1
1
10
100
1000
0.1
1
10
100
1000
200
2 Elem
ents
4 Elem
ents
Figure 6. Predicted "worst case" power density (@ 2 m above ground) for 10 m antenna height.
Radiation Center Above Ground = 20 meters
Distance from Tower (meters)
1 10 100
Nor
mal
ized
Pow
er D
ensi
ty (
µW/c
m²)
/kW
0.01
0.1
1
10
100
0.01
0.1
1
10
100
200
2 Elem
ents
4 Elem
ents
6 Elem
ents
8 Elem
ents
10 Elem
ents
Figure 7. Predicted "worst case" power density (@ 2 m above ground) for 20 m antenna height.
Radiation Center Above Ground = 30 meters
Distance from Tower (meters)
1 10 100
Nor
mal
ized
Pow
er D
ensi
ty (
µW/c
m²)
/kW
0.01
0.1
1
10
100
0.01
0.1
1
10
100
200
2 Elem
ents
4 Elem
ents
6 Elem
ents
8 Elem
ents
10 Elem
ents
12 Elem
ents
Figure 8. Predicted "worst case" power density (@ 2 m above ground) for 30 m antenna height.
Radiation Center Above Ground = 40 meters
Distance from Tower (meters)
1 10 100
Nor
mal
ized
Pow
er D
ensi
ty (
µW/c
m²)
/kW
0.01
0.1
1
10
100
0.01
0.1
1
10
100
200
12 Elem
ents10 E
lements
8 Elem
ents6 E
lements
4 Elem
ents
2 Elem
ents
Figure 9. Predicted "worst case" power density (@ 2 m above ground) for 40 m antenna height.
Radiation Center Above Ground = 50 meters
Distance from Tower (meters)
1 10 100
Nor
mal
ized
Pow
er D
ensi
ty (
µW/c
m²)
/kW
0.01
0.1
1
10
0.01
0.1
1
10
200
2 Elem
ents
4 Elem
ents
6 Elem
ents
8 Elem
ents
10 Elem
ents
12 Elem
ents
Figure 10. Predicted "worst case" power density (@ 2 m above ground) for 50 m antenna height.
Radiation Center Above Ground = 60 meters
Distance from Tower (meters)
1 10 100
Nor
mal
ized
Pow
er D
ensi
ty (
µW/c
m²)
/kW
0.01
0.1
1
10
0.01
0.1
1
10
200
12 Elem
ents10 E
lements
8 Elem
ents6 E
lements
4 Elem
ents
2 Elem
ents
Figure 11. Predicted "worst case" power density (@ 2 m above ground) for 60 m antenna height.
Radiation Center Above Ground = 70 meters
Distance from Tower (meters)
1 10 100
Nor
mal
ized
Pow
er D
ensi
ty (
µW/c
m²)
/kW
0.01
0.1
1
10
0.01
0.1
1
10
200
12 Elem
ents10 E
lements
8 Elem
ents6 E
lements
4 Elem
ents
2 Elem
ents
Figure 12. Predicted "worst case" power density (@ 2 m above ground) for 70 m antenna height.
Radiation Center Above Ground = 80 meters
Distance from Tower (meters)
1 10 100
Nor
mal
ized
Pow
er D
ensi
ty (
µW/c
m²)
/kW
0.01
0.1
1
10
0.01
0.1
1
10
200
2 Elem
ents
4 Elem
ents
6 Elem
ents
8 Elem
ents
10 Elem
ents
12 Elem
ents
Figure 13. Predicted "worst case" power density (@ 2 m above ground) for 80 m antenna height.
Radiation Center Above Ground = 90 meters
Distance from Tower (meters)
1 10 100
Nor
mal
ized
Pow
er D
ensi
ty (
µW/c
m²)
/kW
0.01
0.1
1
10
0.01
0.1
1
10
200
2 Elem
ents
4 Elem
ents
6 Elem
ents
8 Elem
ents
12 Elem
ents10 E
lements
Figure 14. Predicted "worst case" power density (@ 2 m above ground) for 90 m antenna height.
Radiation Center Above Ground = 100 meters
Distance from Tower (meters)
1 10 100
Nor
mal
ized
Pow
er D
ensi
ty (
µW/c
m²)
/kW
0.01
0.1
1
10
0.01
0.1
1
10
200
2 Elem
ents
4 Elem
ents
6 Elem
ents
8 Elem
ents
10 Elem
ents
12 Elem
ents
Figure 15. Predicted "worst case" power density (@ 2 m above ground) for 100 m antenna height.
SECTION 3Television Broadcast Stations
Antennas used for television broadcasting usually consist of an array of radiatingelements mounted on a tower. In comparison to elements used for FM antennas, the elementsused for television broadcasting are generally of a more complex design and radiate lessenergy downward than many FM antennas. Television broadcast antennas are also oftenmounted on higher towers than those used for FM radio broadcasting.
The computer model developed by the EPA for FM radio broadcast antennas,discussed previously, was not applied to television broadcast antennas due to theunavailability of complete vertical radiation patterns for these antennas. However, the EPAdid develop an alternative approach for analyzing television antenna systems based onavailable information. It should be noted that this model will have to be modified in thefuture if it is to be applied to digital television systems expected to be developed over thenext several years.
For VHF-TV antennas, the EPA reported that the most commonly used type ofradiating element appeared to be the "bat wing" type. For purposes of preliminary evaluationit can be assumed that all VHF-TV elements are of this design. Data obtained by EPAindicated that antennas using batwing elements may radiate approximately 20% as much inthe downward direction as in the main beam in terms of relative field strength. Therefore, therelative field factor, F (discussed in Section 2 of Bulletin 65), in the downward directioncould be assumed to be on the order of 0.2.8
Although detailed modeling was not performed, the EPA used typical values ofrelative field strength directly beneath the antenna, i.e., the shortest distance to ground, toarrive at its prediction model for ground-level fields due to VHF-TV antenna systems. Fordirections other than straight down, greater distances from the antenna would be involved,
8 The use of a relative field factor (F) allows a more accurate prediction for power density. If the relativefield factor is not known, a value of 1.0 could be assumed for avery conservative,worst-case approximation.The 20% level assumed by EPA for VHF-TV antennas in the downward direction is an average value and wouldnot necessarily apply in all cases. However, a value of 1.0 in the downward direction is unlikely for TVantennas. A 1.0 value for the field factor is more appropriate for evaluating main-beam exposure.
29
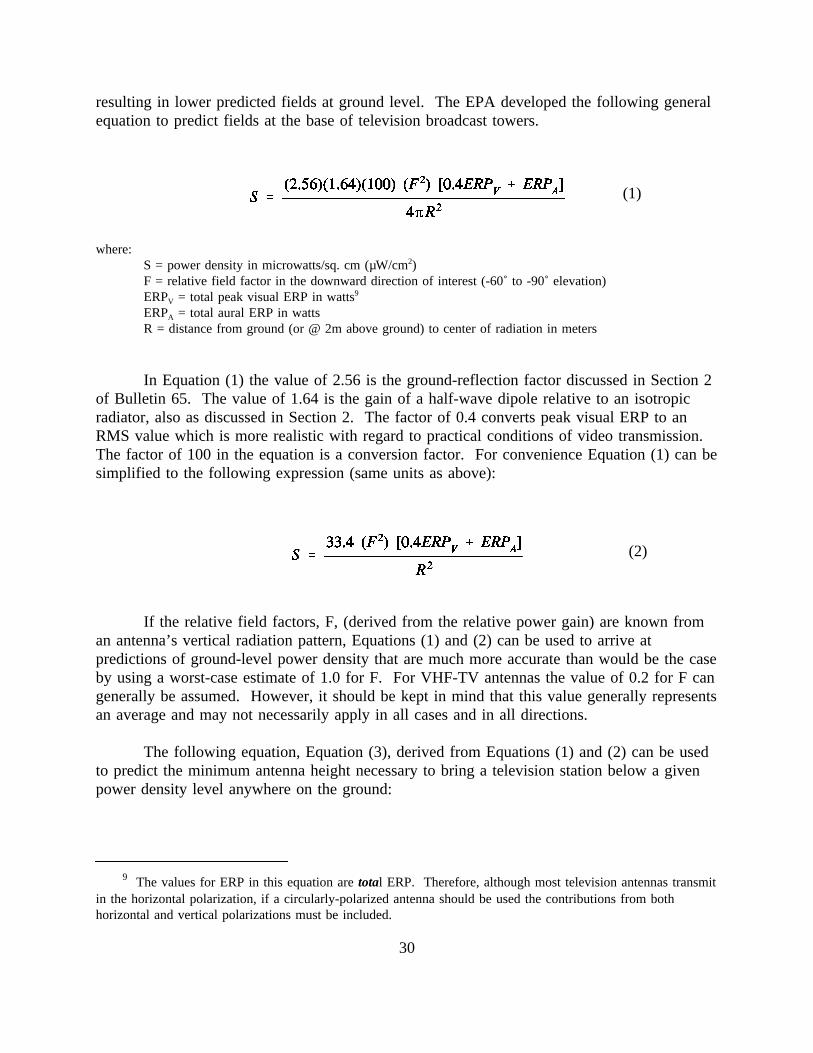
resulting in lower predicted fields at ground level. The EPA developed the following generalequation to predict fields at the base of television broadcast towers.
where:
(1)
S = power density in microwatts/sq. cm (µW/cm2)F = relative field factor in the downward direction of interest (-60˚ to -90˚ elevation)ERPV = total peak visual ERP in watts9
ERPA = total aural ERP in wattsR = distance from ground (or @ 2m above ground) to center of radiation in meters
In Equation (1) the value of 2.56 is the ground-reflection factor discussed in Section 2of Bulletin 65. The value of 1.64 is the gain of a half-wave dipole relative to an isotropicradiator, also as discussed in Section 2. The factor of 0.4 converts peak visual ERP to anRMS value which is more realistic with regard to practical conditions of video transmission.The factor of 100 in the equation is a conversion factor. For convenience Equation (1) can besimplified to the following expression (same units as above):
If the relative field factors, F, (derived from the relative power gain) are known from
(2)
an antenna’s vertical radiation pattern, Equations (1) and (2) can be used to arrive atpredictions of ground-level power density that are much more accurate than would be the caseby using a worst-case estimate of 1.0 for F. For VHF-TV antennas the value of 0.2 for F cangenerally be assumed. However, it should be kept in mind that this value generally representsan average and may not necessarily apply in all cases and in all directions.
The following equation, Equation (3), derived from Equations (1) and (2) can be usedto predict the minimum antenna height necessary to bring a television station below a givenpower density level anywhere on the ground:
9 The values for ERP in this equation aretotal ERP. Therefore, although most television antennas transmitin the horizontal polarization, if a circularly-polarized antenna should be used the contributions from bothhorizontal and vertical polarizations must be included.
30
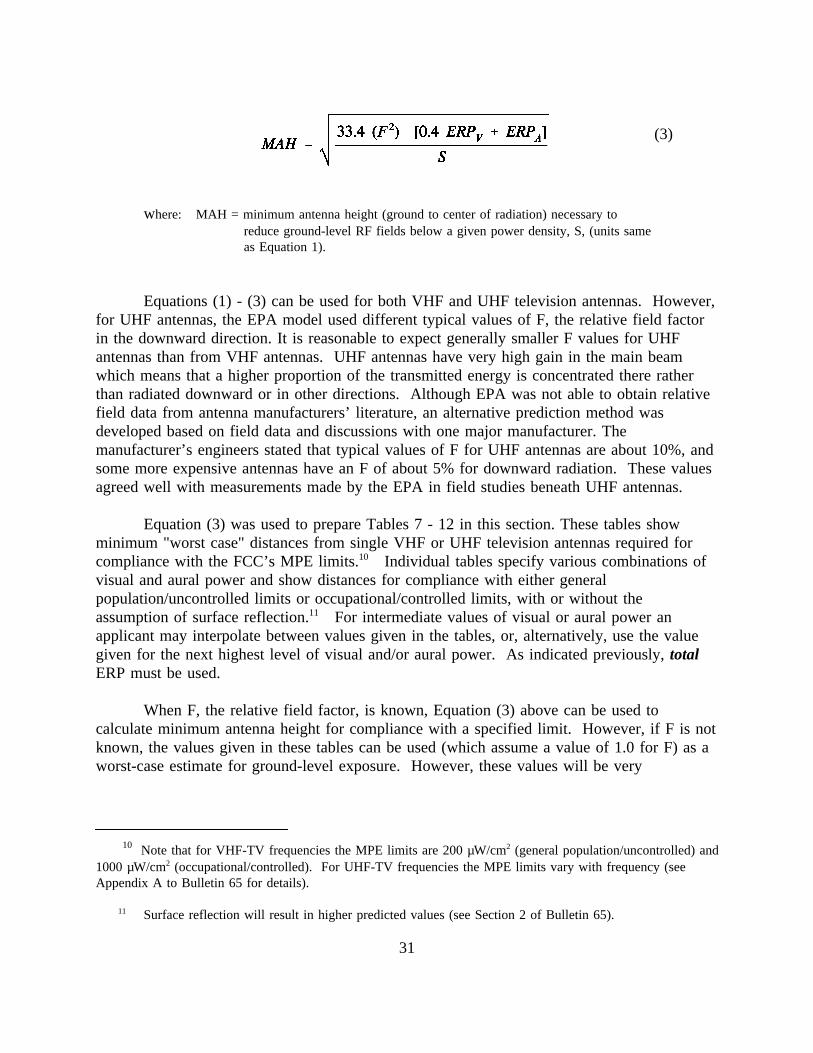
where: MAH = minimum antenna height (ground to center of radiation) necessary to
(3)
reduce ground-level RF fields below a given power density, S, (units sameas Equation 1).
Equations (1) - (3) can be used for both VHF and UHF television antennas. However,for UHF antennas, the EPA model used different typical values of F, the relative field factorin the downward direction. It is reasonable to expect generally smaller F values for UHFantennas than from VHF antennas. UHF antennas have very high gain in the main beamwhich means that a higher proportion of the transmitted energy is concentrated there ratherthan radiated downward or in other directions. Although EPA was not able to obtain relativefield data from antenna manufacturers’ literature, an alternative prediction method wasdeveloped based on field data and discussions with one major manufacturer. Themanufacturer’s engineers stated that typical values of F for UHF antennas are about 10%, andsome more expensive antennas have an F of about 5% for downward radiation. These valuesagreed well with measurements made by the EPA in field studies beneath UHF antennas.
Equation (3) was used to prepare Tables 7 - 12 inthis section. These tables showminimum "worst case" distances from single VHF or UHF television antennas required forcompliance with the FCC’s MPE limits.10 Individual tables specify various combinations ofvisual and aural power and show distances for compliance with either generalpopulation/uncontrolled limits or occupational/controlled limits, with or without theassumption of surface reflection.11 For intermediate values of visual or aural power anapplicant may interpolate between values given in the tables, or, alternatively, use the valuegiven for the next highest level of visual and/or aural power. As indicated previously,totalERP must be used.
When F, the relative field factor, is known, Equation (3) above can be used tocalculate minimum antenna height for compliance with a specified limit. However, if F is notknown, the values given in these tables can be used (which assume a value of 1.0 for F) as aworst-case estimate for ground-level exposure. However, these values will be very
10 Note that for VHF-TV frequencies the MPE limits are 200 µW/cm2 (general population/uncontrolled) and1000 µW/cm2 (occupational/controlled). For UHF-TV frequencies the MPE limits vary with frequency (seeAppendix A to Bulletin 65 for details).
11 Surface reflection will result in higher predicted values (see Section 2 of Bulletin 65).
31
conservative, as discussed previously. Tables using field factors less than 1.0, such as 0.2 or0.1, could also be constructed and may be included in future revisions of this supplement.
Using Tables 7 - 12 forestimating minimum antenna height can be useful in caseswhere the supporting tower is relatively short and there may be a greater contribution toground-level field strength from the lower part of the antenna. For main-beam exposure,where the field factor, F, may be closer to 1.0, the values in these tables are likely to beprovide more realistic predictions of exposure at a given distance. This type of analysis maybe required when nearby occupied structures or rooftops are in the path of the antenna’s mainbeam. In such cases it may or may not be reasonable to include the surface reflection factorin equation (3). For that reason the values in tables labeled "No Reflection" were calculatedwithout the reflection factor of 2.56 shown in Equation (1) and included in Equation (3).
32
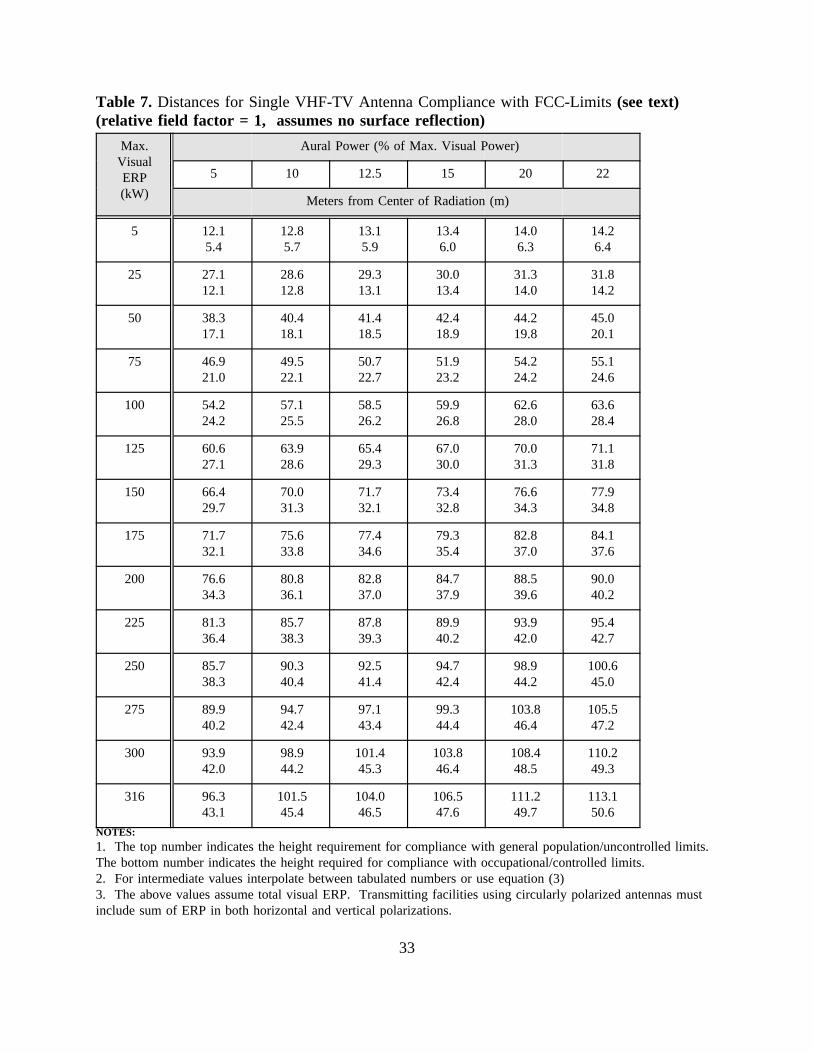
Table 7. Distances for Single VHF-TV Antenna Compliance with FCC-Limits(see text)(relative field factor = 1, assumes no surface reflection)
Max.VisualERP(kW)
Aural Power (% of Max. Visual Power)
5 10 12.5 15 20 22
Meters from Center of Radiation (m)
5 12.15.4
12.85.7
13.15.9
13.46.0
14.06.3
14.26.4
25 27.112.1
28.612.8
29.313.1
30.013.4
31.314.0
31.814.2
50 38.317.1
40.418.1
41.418.5
42.418.9
44.219.8
45.020.1
75 46.921.0
49.522.1
50.722.7
51.923.2
54.224.2
55.124.6
100 54.224.2
57.125.5
58.526.2
59.926.8
62.628.0
63.628.4
125 60.627.1
63.928.6
65.429.3
67.030.0
70.031.3
71.131.8
150 66.429.7
70.031.3
71.732.1
73.432.8
76.634.3
77.934.8
175 71.732.1
75.633.8
77.434.6
79.335.4
82.837.0
84.137.6
200 76.634.3
80.836.1
82.837.0
84.737.9
88.539.6
90.040.2
225 81.336.4
85.738.3
87.839.3
89.940.2
93.942.0
95.442.7
250 85.738.3
90.340.4
92.541.4
94.742.4
98.944.2
100.645.0
275 89.940.2
94.742.4
97.143.4
99.344.4
103.846.4
105.547.2
300 93.942.0
98.944.2
101.445.3
103.846.4
108.448.5
110.249.3
316 96.343.1
101.545.4
104.046.5
106.547.6
111.249.7
113.150.6
NOTES:1. The top number indicates the height requirement for compliance with general population/uncontrolled limits.The bottom number indicates the height required for compliance with occupational/controlled limits.2. For intermediate values interpolate between tabulated numbers or use equation (3)3. The above values assume total visual ERP. Transmitting facilities using circularly polarized antennas mustinclude sum of ERP in both horizontal and vertical polarizations.
33
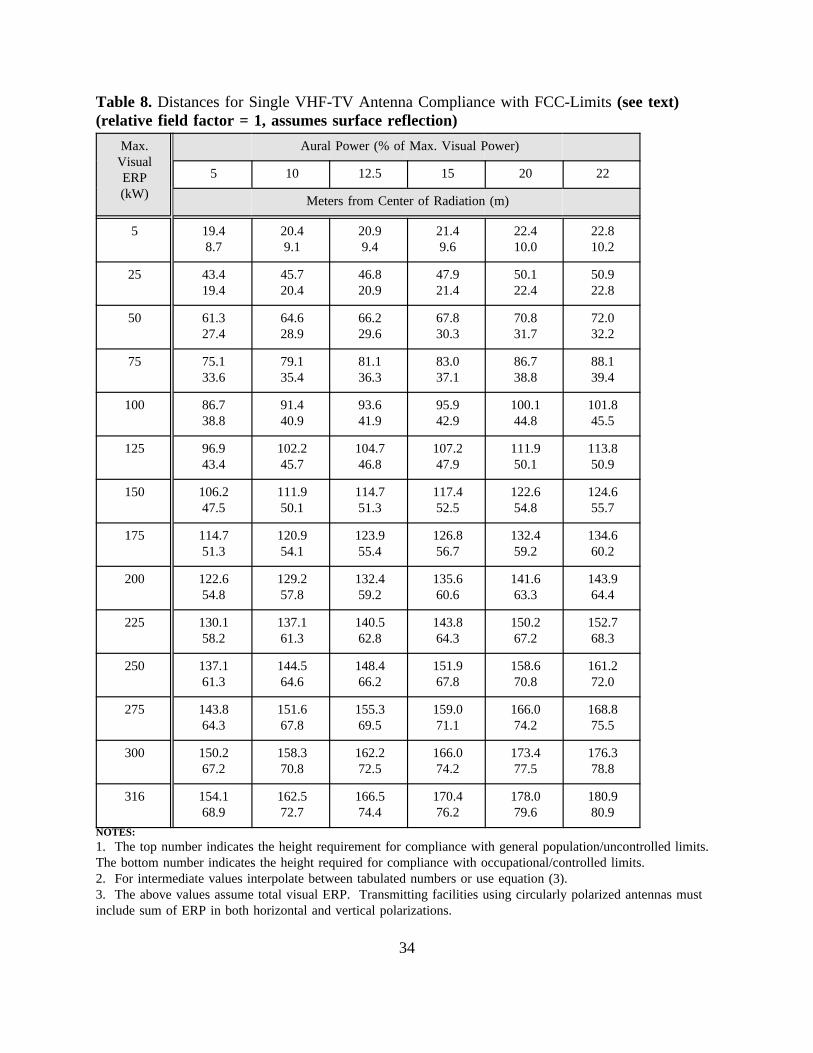
Table 8. Distances for Single VHF-TV Antenna Compliance with FCC-Limits(see text)(relative field factor = 1, assumes surface reflection)
Max.VisualERP(kW)
Aural Power (% of Max. Visual Power)
5 10 12.5 15 20 22
Meters from Center of Radiation (m)
5 19.48.7
20.49.1
20.99.4
21.49.6
22.410.0
22.810.2
25 43.419.4
45.720.4
46.820.9
47.921.4
50.122.4
50.922.8
50 61.327.4
64.628.9
66.229.6
67.830.3
70.831.7
72.032.2
75 75.133.6
79.135.4
81.136.3
83.037.1
86.738.8
88.139.4
100 86.738.8
91.440.9
93.641.9
95.942.9
100.144.8
101.845.5
125 96.943.4
102.245.7
104.746.8
107.247.9
111.950.1
113.850.9
150 106.247.5
111.950.1
114.751.3
117.452.5
122.654.8
124.655.7
175 114.751.3
120.954.1
123.955.4
126.856.7
132.459.2
134.660.2
200 122.654.8
129.257.8
132.459.2
135.660.6
141.663.3
143.964.4
225 130.158.2
137.161.3
140.562.8
143.864.3
150.267.2
152.768.3
250 137.161.3
144.564.6
148.466.2
151.967.8
158.670.8
161.272.0
275 143.864.3
151.667.8
155.369.5
159.071.1
166.074.2
168.875.5
300 150.267.2
158.370.8
162.272.5
166.074.2
173.477.5
176.378.8
316 154.168.9
162.572.7
166.574.4
170.476.2
178.079.6
180.980.9
NOTES:1. The top number indicates the height requirement for compliance with general population/uncontrolled limits.The bottom number indicates the height required for compliance with occupational/controlled limits.2. For intermediate values interpolate between tabulated numbers or use equation (3).3. The above values assume total visual ERP. Transmitting facilities using circularly polarized antennas mustinclude sum of ERP in both horizontal and vertical polarizations.
34
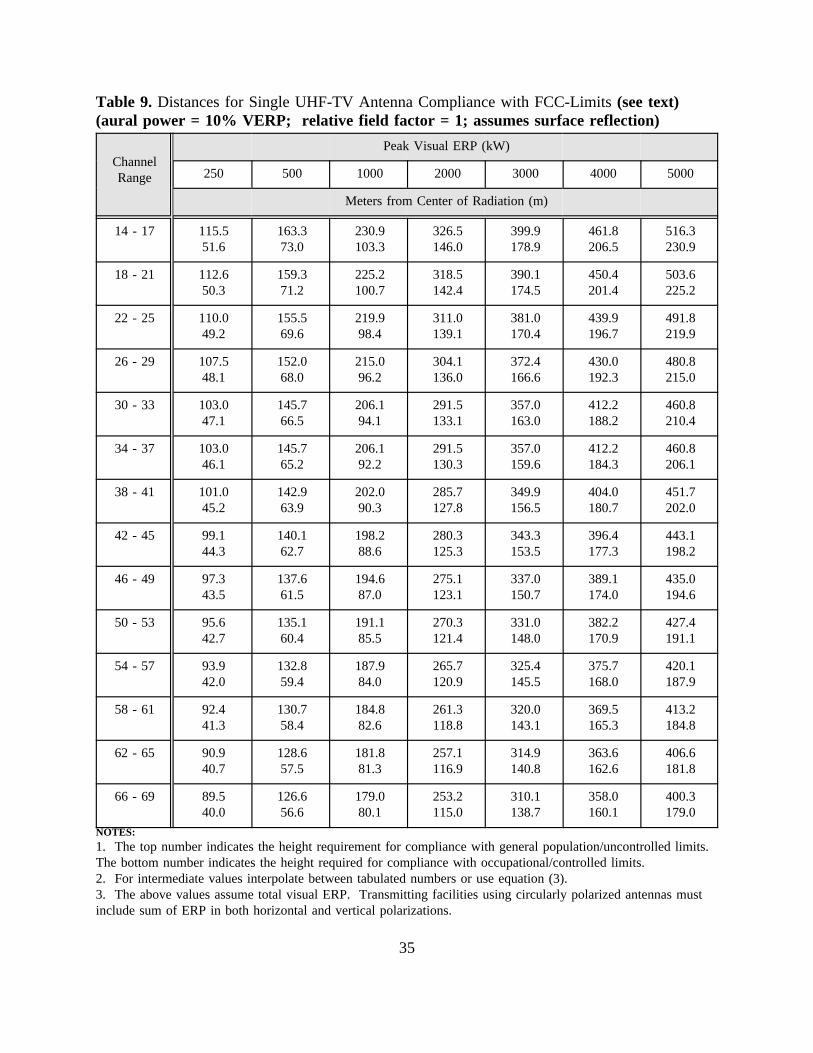
Table 9. Distances for Single UHF-TV Antenna Compliance with FCC-Limits(see text)(aural power = 10% VERP; relative field factor = 1; assumes surface reflection)
ChannelRange
Peak Visual ERP (kW)
250 500 1000 2000 3000 4000 5000
Meters from Center of Radiation (m)
14 - 17 115.551.6
163.373.0
230.9103.3
326.5146.0
399.9178.9
461.8206.5
516.3230.9
18 - 21 112.650.3
159.371.2
225.2100.7
318.5142.4
390.1174.5
450.4201.4
503.6225.2
22 - 25 110.049.2
155.569.6
219.998.4
311.0139.1
381.0170.4
439.9196.7
491.8219.9
26 - 29 107.548.1
152.068.0
215.096.2
304.1136.0
372.4166.6
430.0192.3
480.8215.0
30 - 33 103.047.1
145.766.5
206.194.1
291.5133.1
357.0163.0
412.2188.2
460.8210.4
34 - 37 103.046.1
145.765.2
206.192.2
291.5130.3
357.0159.6
412.2184.3
460.8206.1
38 - 41 101.045.2
142.963.9
202.090.3
285.7127.8
349.9156.5
404.0180.7
451.7202.0
42 - 45 99.144.3
140.162.7
198.288.6
280.3125.3
343.3153.5
396.4177.3
443.1198.2
46 - 49 97.343.5
137.661.5
194.687.0
275.1123.1
337.0150.7
389.1174.0
435.0194.6
50 - 53 95.642.7
135.160.4
191.185.5
270.3121.4
331.0148.0
382.2170.9
427.4191.1
54 - 57 93.942.0
132.859.4
187.984.0
265.7120.9
325.4145.5
375.7168.0
420.1187.9
58 - 61 92.441.3
130.758.4
184.882.6
261.3118.8
320.0143.1
369.5165.3
413.2184.8
62 - 65 90.940.7
128.657.5
181.881.3
257.1116.9
314.9140.8
363.6162.6
406.6181.8
66 - 69 89.540.0
126.656.6
179.080.1
253.2115.0
310.1138.7
358.0160.1
400.3179.0
NOTES:1. The top number indicates the height requirement for compliance with general population/uncontrolled limits.The bottom number indicates the height required for compliance with occupational/controlled limits.2. For intermediate values interpolate between tabulated numbers or use equation (3).3. The above values assume total visual ERP. Transmitting facilities using circularly polarized antennas mustinclude sum of ERP in both horizontal and vertical polarizations.
35
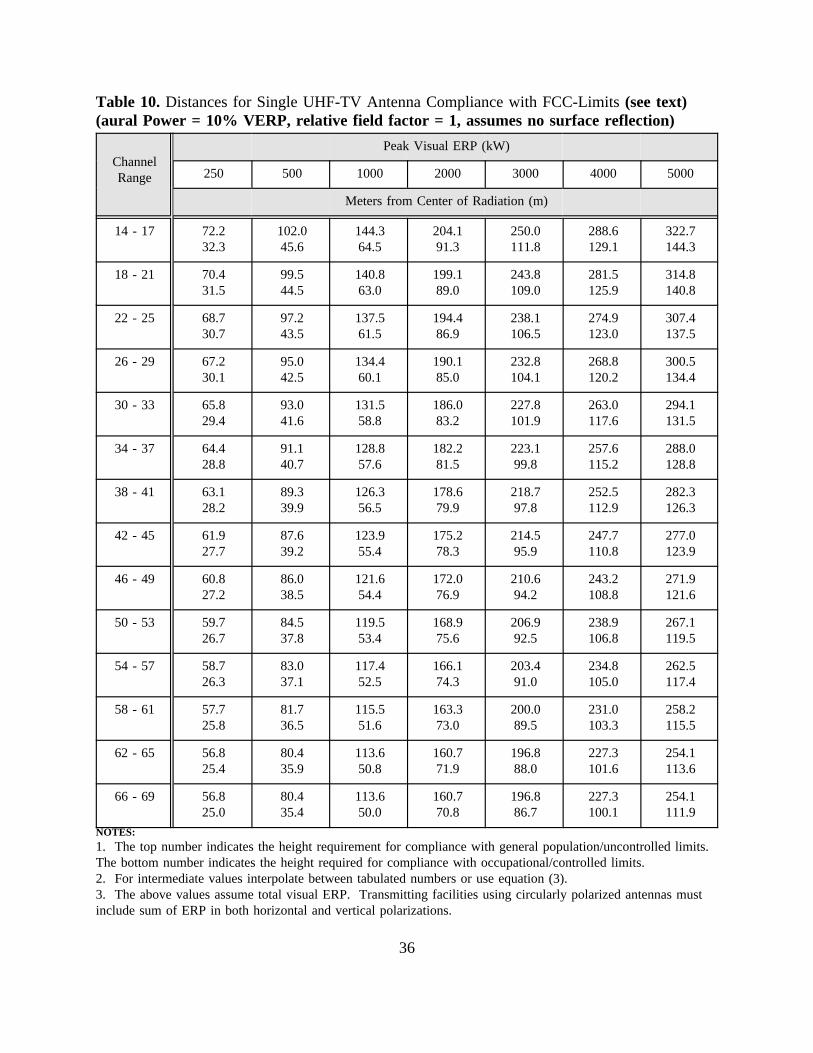
Table 10.Distances for Single UHF-TV Antenna Compliance with FCC-Limits(see text)(aural Power = 10% VERP, relative field factor = 1, assumes no surface reflection)
ChannelRange
Peak Visual ERP (kW)
250 500 1000 2000 3000 4000 5000
Meters from Center of Radiation (m)
14 - 17 72.232.3
102.045.6
144.364.5
204.191.3
250.0111.8
288.6129.1
322.7144.3
18 - 21 70.431.5
99.544.5
140.863.0
199.189.0
243.8109.0
281.5125.9
314.8140.8
22 - 25 68.730.7
97.243.5
137.561.5
194.486.9
238.1106.5
274.9123.0
307.4137.5
26 - 29 67.230.1
95.042.5
134.460.1
190.185.0
232.8104.1
268.8120.2
300.5134.4
30 - 33 65.829.4
93.041.6
131.558.8
186.083.2
227.8101.9
263.0117.6
294.1131.5
34 - 37 64.428.8
91.140.7
128.857.6
182.281.5
223.199.8
257.6115.2
288.0128.8
38 - 41 63.128.2
89.339.9
126.356.5
178.679.9
218.797.8
252.5112.9
282.3126.3
42 - 45 61.927.7
87.639.2
123.955.4
175.278.3
214.595.9
247.7110.8
277.0123.9
46 - 49 60.827.2
86.038.5
121.654.4
172.076.9
210.694.2
243.2108.8
271.9121.6
50 - 53 59.726.7
84.537.8
119.553.4
168.975.6
206.992.5
238.9106.8
267.1119.5
54 - 57 58.726.3
83.037.1
117.452.5
166.174.3
203.491.0
234.8105.0
262.5117.4
58 - 61 57.725.8
81.736.5
115.551.6
163.373.0
200.089.5
231.0103.3
258.2115.5
62 - 65 56.825.4
80.435.9
113.650.8
160.771.9
196.888.0
227.3101.6
254.1113.6
66 - 69 56.825.0
80.435.4
113.650.0
160.770.8
196.886.7
227.3100.1
254.1111.9
NOTES:1. The top number indicates the height requirement for compliance with general population/uncontrolled limits.The bottom number indicates the height required for compliance with occupational/controlled limits.2. For intermediate values interpolate between tabulated numbers or use equation (3).3. The above values assume total visual ERP. Transmitting facilities using circularly polarized antennas mustinclude sum of ERP in both horizontal and vertical polarizations.
36

Table 11. Distances for Single UHF-TV Antenna Compliance with FCC-Limits(see text)(aural power = 22% VERP, relative field factor = 1, assumes surface reflection)
ChannelRange
Peak Visual ERP (kW)
250 500 1000 2000 3000 4000 5000
Meters from Center of Radiation (m)
14 - 17 128.657.5
181.881.3
257.1115.0
363.6162.6
445.3199.2
514.2230.0
574.9257.1
18 - 21 125.456.1
177.379.3
250.8112.2
354.7158.6
434.4194.3
501.6224.3
560.8250.8
22 - 25 122.554.8
173.277.5
244.9109.5
346.4154.9
424.2189.7
489.8219.1
547.6244.9
26 - 29 119.753.5
169.375.7
239.4107.1
338.6151.4
414.7185.5
478.9214.2
535.4239.4
30 - 33 117.252.4
165.774.1
234.3104.8
331.4148.2
405.8181.5
468.6209.6
523.9234.3
34 - 37 112.551.3
159.172.6
225.0102.6
318.1145.1
389.6177.8
449.9205.3
503.0229.5
38 - 41 112.550.3
159.171.1
225.0100.6
318.1142.3
389.6174.3
449.9201.2
503.0225.0
42 - 45 110.349.4
156.169.8
220.798.7
312.1139.6
382.2170.9
441.4197.4
493.5220.7
46 - 49 108.348.4
153.268.5
216.796.9
306.4137.0
375.2167.8
433.3193.8
484.4216.7
50 - 53 106.447.6
150.567.3
212.895.2
301.0134.6
368.6164.9
425.6190.4
475.9212.8
54 - 57 104.646.8
147.966.2
209.293.6
295.9132.3
362.3162.0
418.4187.1
467.8209.2
58 - 61 102.946.0
145.565.1
205.892.0
291.0130.1
356.4159.4
411.5184.0
460.1205.8
62 - 65 101.245.3
143.264.0
202.590.5
286.3128.1
350.7156.8
404.9181.1
452.7202.5
66 - 69 99.744.6
141.063.0
199.389.1
281.9126.1
345.3154.4
398.7178.3
445.7199.3
NOTES:1. The top number indicates the height requirement for compliance with general population/uncontrolled limits.The bottom number indicates the height required for compliance with occupational/controlled limits.2. For intermediate values interpolate between tabulated numbers or use equation (3).3. The above values assume total visual ERP. Transmitting facilities using circularly polarized antennas mustinclude sum of ERP in both horizontal and vertical polarizations.
37
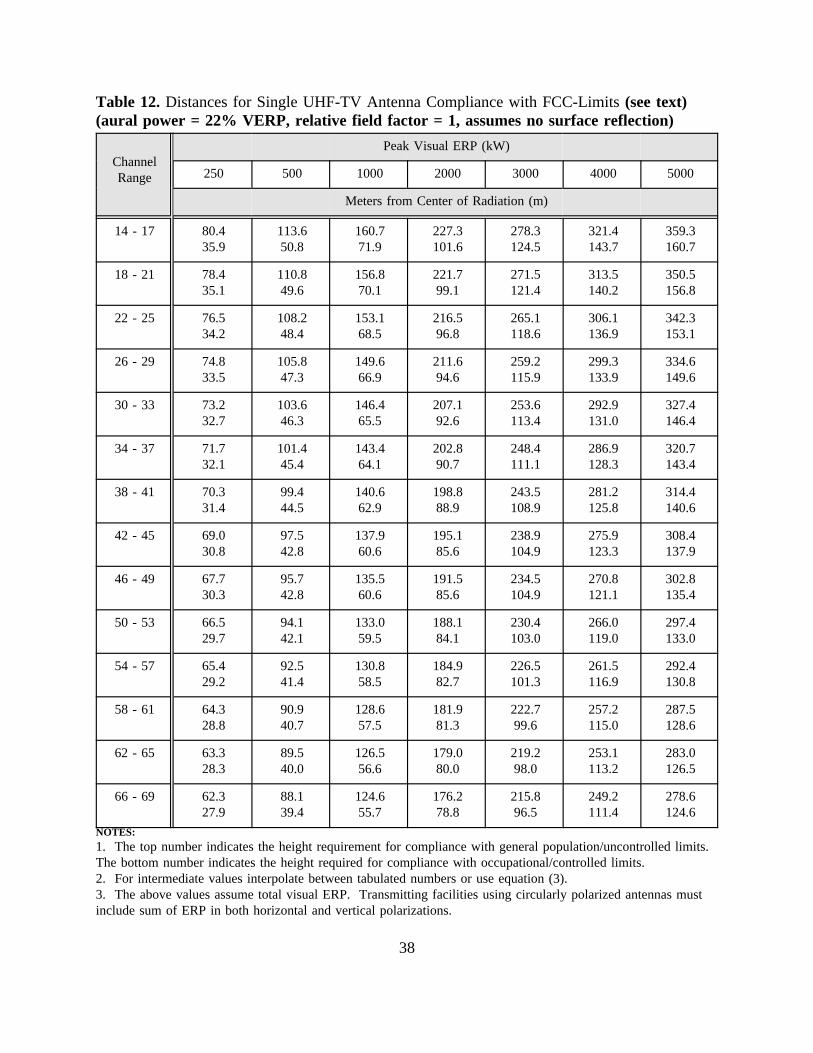
Table 12.Distances for Single UHF-TV Antenna Compliance with FCC-Limits(see text)(aural power = 22% VERP, relative field factor = 1, assumes no surface reflection)
ChannelRange
Peak Visual ERP (kW)
250 500 1000 2000 3000 4000 5000
Meters from Center of Radiation (m)
14 - 17 80.435.9
113.650.8
160.771.9
227.3101.6
278.3124.5
321.4143.7
359.3160.7
18 - 21 78.435.1
110.849.6
156.870.1
221.799.1
271.5121.4
313.5140.2
350.5156.8
22 - 25 76.534.2
108.248.4
153.168.5
216.596.8
265.1118.6
306.1136.9
342.3153.1
26 - 29 74.833.5
105.847.3
149.666.9
211.694.6
259.2115.9
299.3133.9
334.6149.6
30 - 33 73.232.7
103.646.3
146.465.5
207.192.6
253.6113.4
292.9131.0
327.4146.4
34 - 37 71.732.1
101.445.4
143.464.1
202.890.7
248.4111.1
286.9128.3
320.7143.4
38 - 41 70.331.4
99.444.5
140.662.9
198.888.9
243.5108.9
281.2125.8
314.4140.6
42 - 45 69.030.8
97.542.8
137.960.6
195.185.6
238.9104.9
275.9123.3
308.4137.9
46 - 49 67.730.3
95.742.8
135.560.6
191.585.6
234.5104.9
270.8121.1
302.8135.4
50 - 53 66.529.7
94.142.1
133.059.5
188.184.1
230.4103.0
266.0119.0
297.4133.0
54 - 57 65.429.2
92.541.4
130.858.5
184.982.7
226.5101.3
261.5116.9
292.4130.8
58 - 61 64.328.8
90.940.7
128.657.5
181.981.3
222.799.6
257.2115.0
287.5128.6
62 - 65 63.328.3
89.540.0
126.556.6
179.080.0
219.298.0
253.1113.2
283.0126.5
66 - 69 62.327.9
88.139.4
124.655.7
176.278.8
215.896.5
249.2111.4
278.6124.6
NOTES:1. The top number indicates the height requirement for compliance with general population/uncontrolled limits.The bottom number indicates the height required for compliance with occupational/controlled limits.2. For intermediate values interpolate between tabulated numbers or use equation (3).3. The above values assume total visual ERP. Transmitting facilities using circularly polarized antennas mustinclude sum of ERP in both horizontal and vertical polarizations.
38