Embed Size (px)
Citation preview

Evaluating Impacts of Air Pollution in China on Public Health: Implications for Future Air Pollution and Energy Policies
Xiaoping Wang 1,2 and Denise L. Mauzerall 1
Submitted to Atmospheric Environment
July 28, 2005
1 Science, Technology and Environmental Policy program
Woodrow Wilson School of Public and International Affairs
Princeton University
Princeton, NJ 08544
Tel: (609) 258-2498
Fax: (609) 258-6082
2 Presently at:
The World Bank
Mail Stop # H3-307,
1818 H Street NW, Washington, DC 20433
Tel: (202) 4739036
Fax: (202) 4738110

Abstract
Our objective is to establish the link between energy consumption and
technologies, air pollution concentrations and resulting impacts on public health in
eastern China. We use Zaozhuang, a city in eastern China heavily dependent on coal, as
a case study to quantify the impacts that air pollution in eastern China had on public
health in 2000 and the benefits in improved air quality and health that could be obtained
by 2020, relative to business-as-usual (BAU), through the implementation of best
available emission control technology (BACT) and advanced coal gasification
technologies (ACGT). We use an integrated assessment approach, utilizing state-of-the-
science air quality and meteorological models, engineering, epidemiology, and
economics, to achieve this objective. We find that total health damages due to year 2000
anthropogenic emissions from Zaozhuang, using the “willingness-to-pay” metric, was
equivalent to 10% of Zaozhuang’s GDP. If all health damages resulting from coal use
were internalized in the market price of coal, the year 2000 price would have tripled.
With no new air pollution controls implemented between 2000 and 2020 but with
projected increases in energy use, we estimate health damages from air pollution
exposure to be equivalent to 16% of Zaozhuang’s projected 2020 GDP. BACT and
ACGT (with only 24% penetration in Zaozhuang and providing 2% of energy needs in
three surrounding municipalities) could reduce the potential health damage of air
pollution in 2020 to 13% and 8% of projected GDP, respectively. Benefits to public
health, of substantial monetary value, can be achieved through the use of BACT; health
benefits from the use of ACGT could be even larger. Despite significant uncertainty
associated with each element of the integrated assessment approach, we demonstrate that
substantial benefits to public health could be achieved in this region of eastern China
through the use of additional pollution controls and particularly from the use of advanced
coal gasification technology. Without such controls, the impacts of air pollution on
public health, presently considerable, will increase substantially by 2020.
1

1. Introduction
Air pollution has become one of the most visible environmental problems in
China due to massive coal burning with inadequate emission controls. An understanding
of the link between energy consumption and technologies, air pollution and related
environmental impacts is necessary to evaluate different air pollution control options but
is lacking in China’s current policy decision making. Our objective is to establish such a
link by quantifying the impacts of air pollution in eastern China on public health in 2000,
and the benefits in improved air quality and health that could be obtained by 2020,
relative to business-as-usual (BAU), through the implementation of best available end-of-
pipe environmental controls (BACT) and advanced coal gasification technologies
(ACGT). This comparative health benefit assessment provides an important input to the
energy and environmental policy-making process necessary to maximize benefits of
regulatory actions or polices. It should be of interest to the energy and environment
authorities and local governments in charge of energy and environmental planning in
China.
We use an integrated assessment approach which utilizes state-of-the-science air
quality and meteorological models, engineering, epidemiology, and economics. A similar
approach has been used in other studies examining the environmental impacts and/or
costs associated with energy use (e.g. (Aunan et al., 2000; Aunan et al., 2004; Delucchi,
2000; EPA, 1997; EPA, 1999; Feng, 1999; Kunzli et al., 2000; Levy et al., 1999; Li et al.,
2004; Lvovsky et al., 2000; Ogden et al., 2004; Rabl and Spadaro, 2000; Rowe et al.,
1995a; Rowe et al., 1995b; Wang, 1997). However, these earlier studies either focus on
specific energy end-use sectors (e.g. coal-fired power plants or transportation) or fuel
types (e.g. coal and biomass fuels development), or a policy program such as the Clean
Air Act in the US. Our study makes some major advances in this approach which are
highlighted here. First, we have developed an emission inventory with high spatial and
temporal resolution that includes both sector specific anthropogenic and biogenic
emissions for 2000 and three emission scenarios for 2020 [see (Wang et al., 2005) for
details]. Second, we use a multi-pollutant, multi-scale air quality model, the Community
Multi-scale Air Quality Modeling System (CMAQ) Version 4.3, to simulate ambient
2

concentrations of pollutants across a multi-province domain. CMAQ simulates
atmospheric and land processes that affect the transport, transformation, and deposition
of atmospheric pollutants (Byun and Ching, 1999) and explicitly accounts for the
formation of secondary PM which has a significant impact on public health. Third, we
use concentration-response (CR) functions from long-term air pollution exposure studies
for our health impact assessment. The long term air pollution exposure studies
consistently show that the health effects from chronic exposure are nearly an order of
magnitude higher than those due to acute exposure alone (Abbey et al., 1999; Dockery et
al., 1993; Hoek et al., 2002; Pope III et al., 2002). Fourth, we measure mortality based
on both the number of deaths and on the life years lost due to air pollution exposure.
When an individual dies prematurely due to long term exposure to air pollution, he or she
may lose only a few years of his or her life. Thus, depending on whether economic
valuation is based on lives lost or years of life lost, the health benefits of an air pollution
control project may vary sufficiently to alter the results of a cost-benefit analysis.
Our paper is structured as follows. Section 2 describes the methods used to
calculate the changes in ambient concentrations, health impacts and associated economic
costs. Section 3 presents results of and Section 4 examines uncertainties in the integrated
assessment. Section 5 summarizes our main conclusions.
2. Integrated Assessment Approach
2.1 General framework
Our integrated assessment includes six steps: 1) define the study region and
energy technology scenarios, 2) estimate emissions of air pollutants for 2000 and three
scenarios for 2020, 3) simulate ambient air pollution concentrations and distributions, 4)
estimate human exposure to air pollutants, 5) estimate health impacts and 6) quantify the
economic costs of those impacts. The first three components have been described in
detail in (Wang et al., 2005) and are summarized below. The other components are
described in detail here.
3

2.2 Defining the study region and energy technology scenarios
We select Zaozhuang Municipality in Shandong Province of eastern China as a
case study because its coal-dominated energy structure and development level are
representative of many cities in China. Zaozhuang has rich coal reserves, and coal
accounts for more than 80% of its primary energy consumption. The Zaozhuang
population was 3.5 million in 2000 and is expected to increase by 17% in 2020; its per
capita gross domestic product (GDP) was $842 in 2000 and is expected to increase to
$4008 in 2020 (Zheng et al., 2003).
The region over which we quantify the health impacts of air pollution resulting
from energy use in Zaozhuang includes and surrounds Zaozhuang (solid green square in
Figure 1). The total population in the model region was 281 million in 2000.
In addition to the base year 2000, three types of energy and environmental control
scenarios for 2020 are examined: business-as-usual (BAU) which implies the
continuation of conventional coal combustion technologies used in 2000 with limited
environmental controls, addition of best available emission control technologies (BACT)
to the conventional combustion technologies in Zaozhuang, and the substitution of
advanced coal gasification technologies (ACGT). These three scenarios are summarized
in Table 1. We include ACGT because of its potential future strategic importance to
China. ACGT would facilitate continued use of China’s enormous carbon and sulfur rich
coal reserves while nearly eliminating emissions of air pollutants and permitting
underground sequestration of CO2 (Larson and Ren, 2003; Williams, 2001; Williams and
Larson, 2003; Zheng et al., 2003). All technology scenarios we consider are centered on
coal and are designed to meet the same level of energy service demand and socio-
economic development projected by the local governments. Energy service demand in
2020 is projected to increase by 150% over 2000 (Zheng et al., 2003). When replacing
BAU technologies in Zaozhuang in 2020, BACT technologies are assumed to cover all
sectors; ACGT technologies are projected to penetrate 24% of the energy service market
in Zaozhuang and provide 2% of the energy needs in three surrounding municipalities
with the rest of energy service demand in the modeling domain still met with BAU
technologies (Wang, 2004; Wang et al., 2005; Wang et al., in press 2005; Zheng et al.,
4

2003). Our results would need to be adjusted if actual ACGT penetration rates are larger
or smaller.
A high resolution emission inventory was developed for the study region (Wang
et al., 2005). The emission inventory includes annual total emissions at the municipality
level of carbon monoxide (CO), ammonia (NH3), nitrogen oxides (NOx= NO+NO2),
NMVOC (non-methane volatile organic compounds), sulfur dioxide (SO2), and
particulate matter smaller than 2.5 micrometers (PM2.5) and smaller than 10 micrometers
(PM10). The Sparse Matrix Operator Kernel Emissions Modeling System (SMOKE)
Version 1.3 was used to create the spatial and temporal distribution and chemical
speciation of the emission inventory that was used in CMAQ for this analysis. (Wang et
al., 2005) concludes that emissions of NH3 are projected to be 20% higher, NMVOC 50%
higher, and all other species 130%-250% higher in 2020 BAU than in 2000. Both
alternative 2020 emission scenarios would reduce emissions relative to BAU. Adoption
of ACGT which meets only 24% of energy service demand in Zaozhuang and provides
2% of energy needs in three surrounding municipalities in 2020 would reduce emissions
more than BACT with 100% penetration in Zaozhuang.
2.3 Simulating ambient concentrations
CMAQ takes emissions and meteorology as input and simulates hourly ambient
concentrations of more than 70 chemical species. Meteorology is generated using the
fifth-generation NCAR/Penn State Mesoscale Model (MM5) Version 3.5. A detailed
description of the MM5 and CMAQ configurations is provided in (Wang et al., 2005).
Changes in annual ambient concentrations required to evaluate the health impacts
of air pollution are calculated as the difference between two CMAQ simulations. First, in
order to represent each season, we conduct CMAQ simulations for 3-18 of January,
April, July and October 2000 and 2020 using the same meteorology for both years. The
first 4 days of each month are used as model spin-up and are discarded. We average
concentrations in the surface layer (18 m thick) over the four months to obtain annual
average pollutant concentrations necessary to evaluate the health impacts due to pollution
exposure.
5

(Wang et al., 2005) finds that total PM2.5 concentrations are highest in January
and lowest in July as a result of higher emissions of PM2.5 and its precursors such as SO2
and NOx in January. High PM2.5 concentrations occur in areas where emissions are large
due to high population density and/or industry. The 2020 BAU PM2.5 concentrations are
projected to be much higher than concentrations in 2000 in all four seasons.
(Wang et al., 2005) also evaluated the simulated PM2.5 and SO2 concentrations
for 2000 by comparing them with available observations. The simulated concentrations
agree reasonably well with observations in October, but the model frequently under-
predicts surface concentrations in April, and, to a lesser extent, in July. The
underestimates could potentially be due to several factors, including a mismatch of
geographical coverage of the model and the observations, missing sources in our
emission inventory, and/or a lack of specific Chinese emission characteristics for some
pollution sources.
2.4 Estimating population exposure
Due to long-range transport, the emission of air pollutants in Zaozhuang affects
populations residing both inside and outside the city. We have therefore defined a study
region which includes and surrounds Zaozhuang (Figure 1). Within each grid box of our
domain we calculate total exposure using both the population and the change in pollutant
concentrations occurring between two simulations. Our analysis may slightly
underestimate total impacts by excluding people exposed to air pollution originating from
Zaozhuang but residing outside of the model region.
The 2000 population is collected by county (The University of Michigan China
Data Center, 2003) and assigned to grid boxes (12 km *12 km each) within the model
region using an area weighting factor. The population in Shandong Province is predicted
to increase by approximately 17% between 2000 and 2020 (Zheng et al., 2003). We
apply this growth rate to the population in each grid box of our domain.
Epidemiological studies from which we obtain CR functions often target specific
age groups of a population. We include the same age groups for individual health
endpoints as in the original studies. We use the age distribution of the national Chinese
6

population (China Statistics Administration, 2002) to represent the age distribution within
each province. For mortality due to PM2.5 exposure, only those age 30 and above (53%
of the total population) are included in the analysis. This does not imply that air pollution
has no effect on the age groups that are not included; rather, they are excluded from our
analysis because CR functions are not available. As a result, we likely underestimate total
heath impacts.
2.5 Estimating total health impacts
We include both mortality and morbidity effects. Death and years of life lost are
alternative measures of mortality; illness is the measure of morbidity. We select PM
(PM2.5 or PM10) as a surrogate pollutant for estimating overall health impacts because PM
is the most often reported air pollution indicator in epidemiological studies and because
eastern China suffers from particularly elevated PM levels. There is no need to include
other pollutants such as SO2, NO2, CO or O3 as the concentrations of these pollutants are
often correlated with PM and inclusion of the impacts of all pollutants individually would
potentially overestimate the contribution of air pollution to mortality and morbidity
(Kunzli, 2002).
Given that in the observed range of ambient concentrations, the relationship
between concentrations and health outcomes is approximately linear without a threshold
below which no adverse health effects are expected (Daniels et al., 2000; Dominici et al.,
2003; Pope III, 2000b; Samoli et al., 2003), total mortality and morbidity due to air
pollution exposure is calculated as follows:
Δcases = Iref * POP* γ* ΔC (1)
where Iref = annual baseline mortality or morbidity rate of the study population, POP =
exposed population, γ = CR coefficient, ΔC = changes in annual ambient concentrations
due to changes in emissions of air pollutants, and Δcases = additional cases of mortality
or morbidity per year due to change in ambient concentration. The CR coefficient (γ) we
use for years-of-life-lost (YOLL) already incorporates the Chinese baseline mortality rate
(Leksell and Rabl, 2001). Thus the equation for estimating total YOLL becomes:
Δcases (YOLL) = POP* γ* ΔC (2)
7

2.5.1 Baseline mortality and morbidity rates (Iref)
We use the national average mortality rate of 0.645% in 2000 (China Statistics
Administration, 2002) for the baseline mortality rate for our study region because it
involves several provinces and rates for individual provinces was not available. Baseline
rates for various morbidity endpoints were neither available at the national level nor for
our study region; hence we use baseline morbidity rates for Shanghai which is nearby
(Table 2). For restricted activity days no baseline rates are available for China; we
therefore use baseline rates from the original studies. The use of baseline mortality rates
that are not specific to our region introduce uncertainty into our calculations which is
presently unavoidable.
2.5.2 Concentration-Response (CR) coefficients for death and illness
Concentration-response (CR) coefficients for both premature mortality and illness
endpoints included in our analysis are shown in Table 3. Asia differs from the United
States and Europe in the nature of its air pollution, the conditions and magnitude of
exposure to that pollution, and the health status of its populations. However, a recent
literature review of time-series studies conducted in Asia found that short-term exposure
to air pollution in the studied regions is associated with increases in daily mortality and
morbidity effects that are similar to those found in Western countries (HEI, April 2004)
supporting transferability of relative risks. We choose to use CR coefficients for adult
mortality obtained from a cohort study conducted in the United States (Pope III et al.,
2002) because no long-term studies have been conducted in China or other developing
countries and because time-series studies indicate that U.S. and Asian populations have a
similar response to air pollution exposure (HEI, April 2004). The outcomes of cohort
studies are a combination of acute and chronic effects which are not separable because
the outcomes accumulate over long time periods and could be triggered by either
cumulative or short-term peak exposures (Dominici et al., 2003; Kunzli et al., 2001).
Therefore, cohort studies more accurately represent the full effects of air pollution than
8

do time-series studies. In addition, among the existing cohort studies, (Pope III et al.,
2002) includes the largest cohort size and area coverage. We include the CR coefficient
of PM10 mortality for infants (one month to one year old) from (Woodruff et al., 1997)
which is the only cohort study that examines the association of infant mortality and long-
term air pollution exposure.
Studies on the association of morbidity and air pollution exposure are much less
comprehensive than mortality. Among the existing morbidity studies, fewer examine
chronic morbidity than acute morbidity. As a result, for most morbidity effects, we rely
on existing time–series studies, which likely leads to an underestimate of total morbidity.
We include morbidity endpoints from Chinese studies or pooled estimates whenever
available.
2.5.3 Concentration-Response coefficients for years of life lost
Existing epidemiological studies examine the increase of relative risk of
premature mortality as a result of exposure to air pollution for a given population, but do
not provide the age structure of the premature deaths. Thus, the derivation of years of life
lost (YOLL) requires assumptions and indirect estimates, and needs to take into account
the age distribution, baseline mortality rate, magnitude of change in PM concentrations,
relative risk due to changes in PM, and the length of exposure.
Several studies have attempted to estimate the YOLL in mortalities resulting from
chronic exposures based on either an actual life table of a population or a demographic
model simulating a life table. Essentially, these studies apply the CR coefficient from
(Pope III et al., 2002) to each age group of a population, calculated the life years lost for
each age group given the life expectancy of the population, and then derived the average
life years lost for the population. These studies show that for a 10 μg/m3 increase in PM2.5
concentration, the YOLL per person exposed for a population age 30 and above is in the
range of several months to more than one year (Brunekreef, 1997; EPA, 1997; Leksell
and Rabl, 2001; Pope III, 2000a). Since our analysis uses a single year of emission
perturbations from different energy technology scenarios to calculate health impacts, we
use the results from (Leksell and Rabl, 2001) for China. For exposure to 1 μg/m3
increase in PM2.5 the concentration-YOLL coefficient is 4.7e-4 YOLL for Chinese age
9

30 and above; and for a 1ug/m3 increase in PM10, the coefficient is 1.66e-5 YOLL for
Chinese 27 days to 1 year old.
2.6 Economic costs of mortality and morbidity
Economic costs of mortality and morbidity are estimated as the product of the
number of cases and value per case using the “willingness-to-pay” metric. Willingness to
pay (WTP) indicates the amount an individual is willing to pay to acquire (or avoid)
some good or service. WTP can be measured through revealed preference or stated
preference methods. Revealed preference data is either observed or reported actual
behavior and stated preference data is observed or expressed in response to hypothetical
scenarios. A commonly used form of stated preference that is used for WTP studies is
contingent valuation. Wang et al. (2001), the only contingent valuation study on the VSL
in China, found that the median WTP value to save one statistical life was $34,583 (1998
US$) in Chongqing City, China in 1998. For comparison, the mean value in the US was
$4.8 (1990 US$) million (EPA, 1997). If we only take into account the difference in per
capita income in 2000 between the US ($34,260) and China ($840) (World Bank, 2001)
and assume VSL is proportional to income, the Chinese VSL in 2000 would be $ 0.15
million (2000 US$).
We, however, make the conservative assumption that the VSL for Chongqing is
representative of China. Given that the inflation rate in China between 1998 and 2000
was -1% and that the per capita income in China is projected to increase from $840 in
2000 to $4008 in 2020, the resulting VSL is $34,235 in 2000 and $163,351 (2000 US$)
in 2020. There are great uncertainties involved in VSL valuations which we discuss in
Section 4.
There have been very few studies of the WTP to avoid morbidity in China. As a
result, we extrapolate from US values, based on the income difference between the two
countries. These inferred values may be higher than in-country survey values as in the
case of VSL ($0.15 million vs. $34,235). Using the in-country survey value for VSL and
the inferred value for morbidity may overweight the importance of morbidity in our
results. We thus mechanistically adjust the inferred values for morbidity to be consistent
10

with the in-country VSL by multiplying the morbidity values by the ratio of the in-
country VSL ($34,235) to the inferred VSL ($0.15 million). The results are shown in
Table 4.
3. Results and Discussion
Emission scenarios used to quantify changes in ambient concentrations of PM in
2020 resulting from the use of different energy technologies is shown in Table 5.
Scenarios with zero emissions from Zaozhuang in 2000 (B) and 2020 (D), although
unrealistic, are created to quantify the total effect of Zaozhuang’s emissions on ambient
concentrations across the modeling domain. Scenario B minus A and D minus C provide
concentration distributions resulting from anthropogenic emissions in Zaozhuang in 2000
and under 2020 BAU, respectively. Scenario E minus C gives the reduction in emissions
resulting from replacing 2020 BAU technologies with BACT technologies in Zaozhuang;
scenario F minus C provides the reduction in emissions resulting from replacing 24% of
2020 BAU technologies with ACGT technologies in Zaozhuang.
Total health costs are the sum of the economic values of death and illness.
Negative values for health impacts indicate health damages.
3.1 Health impacts of Zaozhuang’s air pollutant emissions in 2000
Emissions from Zaozhuang not only affect ambient pollutant concentrations in
Zaozhuang, but also areas outside of Zaozhuang due to air pollution transport. After
hypothetically eliminating all anthropogenic emissions from Zaozhuang, the entire model
region experiences a decrease in PM concentrations, and the Zaozhuang source region
experiences the largest reduction in both total and secondary PM2.5 concentrations (about
10-15 μg/m3 and 2-3 μg/m3 annual average decrease, respectively).
As shown in Table 6, the 2000 anthropogenic emissions of air pollutants from
Zaozhuang are estimated to have caused approximately an additional 6000 deaths (5,244
adults and 612 infants) in the model region related to total PM exposure, amounting to
about 42,000 years of life lost. 25% of all deaths resulting from total PM exposure are
11

estimated to occur in Zaozhuang, equivalent to a 6% increase of its natural mortality rate.
Secondary PM is estimated to be responsible for 48% of excess deaths due to PM
exposure. This is because secondary PM has a relatively long lifetime and is transported
further than primary PM from the source region thus affecting the health of more people
outside the source region than primary PM does.
The total economic damages of the resulting health impacts from 2000 are
estimated to be $0.28 billion. This is equivalent to 10% of Zaozhuang’s 2000 GDP. The
economic damage of illness accounts for 29% of the total health damages.
Health damages caused by coal use can be compared with the market price of
coal. The current coal price does not include the external cost to health and the
environment. Zaozhuang consumed 3.1 million tons of coal in 2000 and coal accounted
for 82% of its total energy consumption (Zheng, 2003). We estimate the upper bound of
the range of health damages associated with one ton of combusted coal by assuming the
emissions from the use of fuels other than coal is negligible; thus the value of damage
from coal is equal to the total health damage costs from air pollution divided by the total
tonnage of coal consumed. The lower bound of the range is obtained by assuming that
the emissions from the use of fuels other than coal is the same as the emissions from coal;
thus the health damage from coal is equal to 82% of the upper estimate. Because coal is
the dominant fuel in Zaozhuang, the range derived from this simple approach is narrow
and thus provides a meaningful indication of the health damages resulting from coal use.
We estimate that each ton of coal combusted in Zaozhuang incurred $90 of health
damages in 2000. These health damage costs are in striking contrast to the market price
of coal in China which was $30/ton (based on a market price of 248 Yuan/ton with
$1=8.3 Yuan) in 1997 (Fridley, 2001). If environmental externalities were reflected in
the market price, coal prices in China would have tripled.
3.2 Health impacts of Zaozhuang’s air pollutant emissions in 2020 BAU
The 2020 BAU anthropogenic emissions from Zaozhuang are estimated to cause
approximately 11,000 premature deaths or 75,000 YOLL due to PM exposure in the
12

model region, nearly doubling the 2000 figures (Table 6). 24% of the total mortalities
resulting from PM exposure are due to secondary PM. Secondary PM is projected to be a
smaller fraction of total PM emissions under 2020BAU than in 2000 due to a projected
relative increase in primary PM emissions in 2020 due to increases in residential coal use
(Wang et al., 2005). As a result, the percentage of mortalities attributed to secondary PM
under 2020 BAU is lower than that in 2000 (48%). Zaozhuang, the emission source, is
estimated to bear 33% of the total premature mortalities resulting from PM exposure
causing a 13% increase in baseline mortality rates. 16% of the excess deaths result from
secondary PM exposure.
The total economic value of the health damages resulting from the 2020 BAU
anthropogenic emissions from Zaozhuang are estimated to be $2.7 billion. This is
equivalent to 16% of the projected 2020 GDP in Zaozhuang and is 10 times larger than
the 2000 value due to projected increases in energy consumption and values of mortality
and morbidity.
We estimate the health damages associated with one ton of coal combusted using
the same approach for 2020 BAU as for 2000. Zaozhuang is projected to consume 11.5
million tons of coal in 2020 BAU (Zheng, 2003). We estimate that under 2020 BAU
each ton of coal burned in Zaozhuang will incur $230 of health damages resulting from
air pollution exposure. As the price of coal in the US is projected to be approximately
constant from now to 2025 (EIA, 2004), we assume the price of coal in China will also be
the same in 2020 as in 2000, approximately $30/ton. If environmental externalities were
truly reflected in the market price of coal, in 2020 in China the price of coal should be
seven times higher than in 2000.
3.3 Health benefits of potential technology changes in Zaozhuang in 2020
Significant benefits, including reduction in emissions, ambient PM concentrations
and air pollution exposure related mortalities and morbidities, could be achieved through
technology upgrades in Zaozhuang in 2020 (Figure 2 and Table 6). The benefits from
partially switching from BAU to ACGT (F minus C) are much larger than from switching
13

from BAU to BACT (E minus C) except for secondary PM2.5 concentrations (Figure 2d).
The increase in PM2.5 occurs under ACGT because when dimethyl ether (DME), a
product of ACGT, is used to replace coal in the rural residential sector, more NOx is
emitted than under BACT (Zheng et al., 2003). As a result, under ACGT NOx emissions
from the rural areas of Zaozhuang (where the residential sector is a large contributor to
total NOx emissions) are higher than under BACT and result in additional PM2.5
formation, even though total NOx emissions from Zaozhuang under ACGT are lower than
under BACT.
The total economic benefit of reduced health impacts resulting from a substitute
of E (BACT) for C (BAU) in Zaozhuang are estimated to be $0.6 billion, nearly half of
which would occur in Zaozhuang. The total economic benefit of reduced health impacts
resulting from F (ACGT) substituting C (BAU) in Zaozhuang are estimated to be $1.4
billion, 60% of which would occur in Zaozhuang itself. These results indicate that about
one-fifth to one-half of the total health damages related to air pollution from Zaozhuang
in 2020 BAU could be avoided by adopting the BACT or ACGT emission scenarios.
3.4 Health impacts by PM constituent and per kg emission of pollutant
We next attribute health impacts to the constituents of secondary PM and
calculate damages per unit of precursor emissions. As shown in Table 7, the health
impacts of sulfates in 2000 (2020 BAU) are estimated to be $47 ($248) million due to
death and illness. The combined health impacts of sulfates and nitrates dominate the
health impacts attributed to secondary PM. The health impacts of secondary
anthropogenic organic aerosols are negligible. In both 2000 and 2020 BAU, the health
impacts per kilogram primary PM emissions are highest, SO2 and NOx emissions second,
and NMVOC emissions lowest (“B-A” and “D-C”).
In terms of marginal health benefits from technology upgrades, under BACT
reducing primary PM emissions provides comparable benefit to reducing SO2 emissions.
Under ACGT reductions in primary PM emissions are of significantly larger benefit.
Notably, if Zaozhuang moves from BAU to BACT in 2020, SO2 emissions decrease
leading to increases in nitrate concentrations despite a decrease in NOx emissions. This
leads to net health damages rather than benefits (Table 7). This occurs because aerosol
14

formation is NH3-limited in the region and when SO2 emissions decrease, more
ammonium is available to form ammonium nitrate. In order to reduce the formation
efficiency of ammonium nitrate and thus nitrate concentrations, NH3 emissions, which
are primarily from the agricultural sector (Wang et al., 2004), must be reduced. Under
BAU, BACT and ACGT scenarios, NH3 emissions are the same. Therefore, we can not
calculate the health benefits of NH3 reduction here.
Our marginal health benefit calculation suggests that if the primary air pollution
control objective is to minimize the total health damages of air pollution from energy use,
and if NH3 emissions remain the same, high priority should be given to reducing primary
PM and SO2
emissions. Of course, as the air pollution composition changes over time,
control strategies will need to be adjusted accordingly. For example, in an advanced
energy system dominated by advanced coal gasification technologies, SO2
emissions
would be reduced to nearly zero. Much more NH3
would therefore be available to form
ammonium nitrate and controlling NH3
and NOx emissions would become more
important for reducing secondary PM concentrations. In addition, the control strategies
are specific to this region and caution should be taken when applying these findings to
other locations.
4. Uncertainty Analysis
Uncertainties exist at every step of the integrated assessment: emission estimates,
calculated ambient concentrations, epidemiological concentration - response
relationships, exposure estimates, health impacts and economic valuation. Despite these
uncertainties, we believe this analysis can provide valuable, policy-relevant information
on the relative benefits of different future emission scenarios and mitigation strategies.
As discussed in (Wang et al., 2005), the major source of uncertainty in emissions
is the Chinese government’s statistics on energy consumption. Other possible sources of
uncertainty in emissions include the use of aggregate coal quality data for an entire
province and extrapolation of the PM emission factors for the industrial sector from the
US Air Pollution (AP)-42 database.
15
Changes in ambient concentrations required for our health impact analysis are
obtained as the difference between two selected model simulations for which the
emissions from Zaozhuang and, in the ACGT case, from three other municipalities, are
the only input variables that differ. Thus the accuracy of the changes in PM
concentrations in response to changes in energy technologies largely depend on the
accuracy of the emission estimates for Zaozhuang. In addition, due to computational
limitations, simulations for only 12-days of each season were conducted which limits the
variability in meteorology that is represented.
Some in the health impact assessment community argue that it may not be
appropriate to apply a relative risk (RR) for PM estimated for one population to another if
the baseline health status for the two differs significantly (ie. U.S. and China). They
argue that using RR for specific cause of death categories would be preferable to using
total mortality as was done in this study. Unfortunately, cause-of-death data was not
available to us for our region of eastern China which precluded such an analysis. In
addition, our health effect estimates do not cover all areas that are potentially affected by
air pollution from Zaozhuang, do not account for health endpoints for which CR
coefficients from epidemiological studies or monetary valuation are not available, and
only include the age groups for which the CR coefficients for mortality and morbidity are
available from the original epidemiological studies. As a result, we potentially
underestimate the total health impacts of the air pollution from Zaozhuang.
The health impact estimates are affected by the background prevalence of health
outcomes. Due to lack of in-country data for China we have used the incidence rates of
some morbidity endpoints from the populations in the original epidemiological studies
which are likely different from those in China. A higher baseline incidence rate in China
may lead to an overestimate of the health impacts of outdoor air pollution. Exclusion of
some age groups in calculating air pollution exposure and use of time series studies for
morbidity endpoints may also lead to an underestimate of health impacts.
Substantial uncertainty also exists for the economic valuation of premature
mortality and morbidity; the WTP approach is heavily debated in the economic literature.
The fact that only one survey study on VSL in China is available makes the Chinese VSL
16

estimate of $34,235 used in this analysis highly uncertain. The uncertainty is further
illustrated by the fact that this estimate is only a fraction of a percent of the corresponding
US value, but is equivalent to 40 times the per capita GDP in China in 2000. However,
we believe only more in-country health valuation studies can solve this puzzle.
We conduct a preliminary analysis of the aggregate uncertainty embedded in three
key input parameters: ambient concentrations, CR coefficients and VSL, using Monte
Carlo simulations. We find that the uncertainty range of the excess mortality related to
the year 2000 anthropogenic emissions in Zaozhuang is about 40% of the mean value and
that the uncertainty range of the economic values of the associated health impacts is
about 1.1 times the mean value. Thus we have much higher confidence in the estimates
of physical health impacts than in their economic valuation.
5. Conclusions
We have quantitatively estimated the health impacts and damage costs for year
2000 and projected for year 2020 due to anthropogenic emissions of air pollutants from
Zaozhuang, China. The 2000 (2020 BAU) anthropogenic emissions in Zaozhuang are
estimated to have caused approximately an additional 6,000 (11,000) deaths in the model
region related to total PM exposure, amounting to approximately 42,000 (75,000) years
of life lost. 25% (33%) of all premature mortalities from PM exposure resulting from
Zaozhuang’s emissions in 2000 and under 2020BAU are estimated to occur in
Zaozhuang. This results in a 6% (13%) increase in the background death rate in the city.
The health costs due to year 2000 anthropogenic emissions from Zaozhuang are
estimated to be $ 0.28 billion, equivalent to 10% of Zaozhuang’s GDP. If these health
costs were internalized in the market price of coal, the coal price in 2000 would have
been triple the actual price. In 2020, if no additional controls are implemented and
energy consumption increases as projected, the resulting health costs due to
anthropogenic emissions from Zaozhuang are estimated to be $2.7 billion, equivalent to
16% of the projected 2020 GDP, 10 times larger than in 2000. Although final energy
demand is expected to increase by 150% from 2000 to 2020, because of rising incomes
the health damage costs due to anthropogenic emissions from Zaozhuang under BAU are
17
estimated to increase 4 times as fast as energy consumption. To include the
environmental externalities in the market price of coal in 2020 under BAU, the price of
coal should be seven times the projected price.
If Zaozhuang moves from BAU to BACT (with 100% market share of energy
services), the total health benefits would amount to $0.6 billion, 20% of the total health
damages related to air pollution from Zaozhuang in 2020 BAU or 13% of projected GDP.
If Zaozhuang moves from BAU to ACGT (with 24% market share of final energy
services demand in Zaozhuang and 2% in three surrounding municpalities) instead of
BACT, the health benefits from mortality and morbidity avoided would be $1.4 billion,
half of the total health damages related to air pollution from Zaozhuang under 2020 BAU
and approximately 8% of projected GDP.
Our assessment indicates that the economic costs of the health impacts from air
pollution arising from coal combustion in eastern China was large in 2000 and is
potentially enormous in 2020 if no additional controls are implemented. Public health
would clearly benefit from best available control technology and advanced coal
gasification technologies and hence better air quality. Furthermore, advanced coal
gasification technologies are even more effective in controlling local air pollution than
end-of-pipe controls and provide an opportunity to sequester CO2 underground. Our
marginal health benefit calculation suggests that if the primary air pollution control
objective is to minimize the total health damages of air pollution from energy use and if
NH3 emissions remain the same, the model region should focus on reduction in primary
PM and SO2 emissions.
Acknowledgements
We thank Robert Mendelsohn and Robert Williams for inspiration at the start of this
project, and Patrick Kinney and Michael Oppenheimer for comments on earlier versions
of the manuscript. We are pleased to acknowledge financial support from the Woodrow
Wilson School of Public and International Affairs at Princeton University.
.
18

References
Abbey, D., Nishino, N., Mcdonnell, W., Burchette, R., Knutsen, S., Beeson, W.L. and Yang, J.X., 1999. Long-term inhalable particles and other air pollutants related to mortality in nonsmokers. American Journal of Respiratory and Critical Care Medicine, 159: 373-382.
Aunan, K., Fang, J., Vennemo, H., Oye, K., Li, H. and Seip, H.M., 2000. Co-benefits from CO2-emission reduction measures in Shanxi, China--their importance in context of CDM, Policy reform and the environment in China, organized by PACE (Profeesional Association for China's Environment), Washington, DC.
Aunan, K., Fang, J., Vennemo, H., Oye, K. and Seip, H.M., 2004. Co-benefits of climate policy--lessons learned from a study in Shanxi, China. Energy Policy, 32: 567-581.
Brunekreef, B., 1997. Air pollution and life expectancy: is there a relation? Occupational and Environmental Medicine, 54: 781-784.
Byun, D.W. and Ching, J.K.S., 1999. Science Algorithms of the EPA Models-3 Community Multiscale Air Quality (CMAQ) Modeling System. EPA/600/R-99/030, Atmospheric Modeling Division, National Exposure Research Laboratory, U.S. Environmental Protection Agency, Research Triangle Park, NC.
Chen, C., Chen, D., Green, C. and Wu, C., 2002. Benefits of expanded use of natural gas for pollutant reduction and health improvement in Shanghai. The Sinosphere Journal, 5(2): 58-64.
China Statistics Administration, 2002. China Population Statistics Yearbook 2002. China Statistics Press, Beijing, 550 pp.
Cifuentes, L., Borja-Aburto, V.H., Gouveia, N., Thurston, G.D. and Davis, D.L., 2001. Assessing the health benefits of urban air pollution reductions associated with climate change mitigation (2000-2020): Santiago, Sao Paulo, Mexico City, and New York City. Environmental Health Perspectives, 109(Supplement 3): 419-425.
Daniels, M.J., Dominici, F., Samet, J.M. and Zeger, S.L., 2000. Estimating particulate matter-mortality dose-response curves and threshold levels: an analysis of daily time series for the 20 largest US cities. American Journal of Epidemiology, 152(5): 397-406.
Delucchi, M.A., 2000. Environmental Externalities of motor vehicle use in the US. Journal of Transportation Economics and Policy, 34(2): 135-168.
Dockery, D.W., Pope III, C.A., Xu, X., Spengler, J.D., Ware, J.H., Fay, M.E., Ferris, B.G. and Speizer, F.E., 1993. An Association between air pollution and mortality in six U.S. cities. The New England Journal of Medicine, 329(24): 1753-1759.
Dominici, F., Shepard, L. and Clyde, M., 2003. Health effects of air pollution: a statistical review. International Statistical Review, 71(2): 243-276.
EIA, 2004. Annual energy outlook 2004 with projections to 2025. DOE/EIA-0484(2001), Energy Information Agency.
EPA, 1997. The benefits and costs of the Clean Air Act, 1970-1990. EPA-410-R-97-002, United States Environmental Protection Agency Office of Air and Radiation Policy.
19

EPA, 1999. The benefits and costs of the Clean Air Act, 1990-2010. EPA-410-R-99-001, United States Environmental Protection Agency Office of Air and Radiation Policy.
Feng, T., 1999. Controlling air pollution in China: risk valuation and the definition of environmental policy. New Horizon in Environmental Economics. Edward Elgar, Cheltenham, UK and Northampton, MA, USA, 266 pp.
Fridley, D.G., 2001. China Energy Databook v. 5.0. Lawrence Berkeley national Laboratory.
HEI, April 2004. Health Effects of Outdoor Air Pollution in Developing Countries of Asia. Special Report 15, Health Effects Institute, Boston, MA.
Hoek, G., Brunekreef, B., Goldbohm, S., Fischer, P. and van der Brandt, P.A., 2002. Association between mortality and indicators of traffic-related air pollution in the Netherlands: a cohort study. The Lancet, 360: 1203-1209.
Jin, L.B., Qing, Y. and Xu, Z., 2000. Relationship between air pollution and acute and chronic respiratory disease in Benxi. Journal of Environment and Health, 17(5): 268-270.
Kunzli, N., 2002. The public health relevance of air pollution abatement. European Respiratory Journal, 20: 198-209.
Kunzli, N. et al., 2000. Public-health impact of outdoor and traffic-related air pollution: a European assessment. The Lancet, 356: 795-801.
Kunzli, N., Medina, S., Kaiser, R., Quenel, P., Horak, F. and Studnicka, M., 2001. Assessment of deaths attributable to air pollution: should we use risk estimates based on time series or on cohort studies? American Journal of Epidemiology, 153(11): 1050-1055.
Larson, E.D. and Ren, T., 2003. Synthetic fuel production by indirect coal liquefaction. Energy for Sustainable Development, 7(4): 21-44.
Leksell, I. and Rabl, A., 2001. Air pollution and mortality: quantification and valuation of years of life lost. Risk Analysis, 21(5): 843-857.
Levy, J.I., Hammitt, J.K., Yanagisawa, Y. and Spengler, J.D., 1999. Development of a new damage function model for power plants: methodology and applications. Environmental Science and Technology, 33(24): 4364-4372.
Li, J., Guttikunda, S.K., Carmichael, G.R., Streets, D.G., Chang, Y.-S. and Fung, V., 2004. Quantifying the human health benefits of curbing air pollution in Shanghai. Journal of Environmental Management, 70(1): 49-62.
Lvovsky, K., Hughes, G., Maddison, D., Ostro, B.D. and Pearce, D., 2000. Environmental costs of fossil fuels: a rapid assessment method with application to six cities, The World Bank.
Ma, H.B. and Hong, C.J., 1992. Effects of particulate air pollution on respiratory disease. Chinese Journal of Public Health, 11(4): 229-232.
Ogden, J.M., Williams, R.H. and Larson, E.D., 2004. Societal lifecycle costs of cars with alternative fuels/engines. Energy Policy, 32(1): 7-27.
Ostro, B.D., 1987. Air pollution and morbidity revisited: a specification test. Journal of Environmental Economics and Management, 14: 87-98.
Ostro, B.D., 1990. Associations between morbidity and alternative measures of particulate matter. Risk Analysis, 10(3): 421-427.
20

Pope III, C.A., 2000a. Epidemiology of fine particulate air pollution and human health: biologic mechanisms and who's at risk? Environmental Health Perspectives, 108(Supplement 4): 713-723.
Pope III, C.A., 2000b. Invited commentary: particulate matter-mortality exposure-response relations and threshold. American Journal of Epidemiology, 152(5): 407-412.
Pope III, C.A., Burnett, R.T., Thun, M.J., Calle, E.E., Krewski, D., Ito, K. and Thurston, G.D., 2002. Lung cancer, cardiopulmonary mortality, and long-term exposure to fine particulate air pollution. Journal of American Medical Association, 287(9): 1132-1141.
Rabl, A. and Spadaro, J.V., 2000. Public Health Impact of Air Pollution and Implications for the Energy System. Annual Review of Energy and The Environment, 25: 601-627.
Rowe, R.D., Lang, C.M., Chestnut, L.G., Latimer, D.A., Rae, D.S., Bernow, S.M. and White, D.E., 1995a. The New York Electricity Externality Study Volume I: Introduction and Methods, I. Oceania Publications Inc., 839 pp.
Rowe, R.D., Lang, C.M., Chestnut, L.G., Latimer, D.A., Rae, D.S., Bernow, S.M. and White, D.E., 1995b. The New York Electricity Externality Study Volume II: Appendices, II. Oceania Publications Inc., 720 pp.
Samet, J.M., Zeger, S.L., Dominici, F., Curriero, F., Coursac, I., Dockery, D.W., Schwartz, J. and Zanobetti, A., 2000. The national morbidity, mortality and air pollution study Part II: morbidity and mortality from air pollution in the United States. 94, Health Effects Institute, Cambridge, MA.
Samoli, E. et al., 2003. Investigating the dose-response relation between air pollution and total mortality in the APHEA-2 multicity project. Occupational and Environmental Medicine, 60(12): 977-982.
Spix, C. et al., 1998. Short-term effects of air pollution on hospital admissions of respiratory diseases in Europe: a quantitative summary of APHEA study results. Archives of Environmental Health, 53(1): 54-64.
The University of Michigan China Data Center, 2003. The complete collection of China 2000 provincial population census data assembly.
Wang, X., 1997. Comparison of constraints on coal and biomass fuels development in China's energy future. Ph.D. Thesis, University of California, Berkeley, Berkeley, 533 pp.
Wang, X., 2004. Evaluating Impacts of Air Pollution in China on Agriculture and Public Health: Implications for Air Pollution and Energy Policies. Ph.D. Thesis, Princeton University, Princeton, NJ.
Wang, X., Mauzerall, D.L., Hu, Y., Russell, A.G., Larson, E.D., Woo, J.-H., Streets, D.G. and Guenther, A., 2005. A High-Resolution Emission Inventory for Eastern China in 2000 and Three Scenarios for 2020. Atmospheric Environment, in press.
Wang, X., Mauzerall, D.L., Hu, Y., Russell, A.G., Larson, E.D., Woo, J.-H., Streets, D.G. and Guenther, A., in press 2005. A High-Resolution Emission Inventory for Eastern China in 2000 and Three Scenarios for 2020. Atmospheric Environment.
Williams, R.H., 2001. Toward zero emissions from coal in China. Energy for Sustainable Development, 5(4): 39-65.
21

Williams, R.H. and Larson, E.D., 2003. A comparison of direct and indirect liquefaction technologies for making fluid fuels from coal. Energy for Sustainable Development, 7(4): 103-129.
Woodruff, T.J., Grillo, J. and Schoendorf, K.C., 1997. The relationship between selected causes of postneonatal infant mortality an particulate air pollution in the United States. Environment and Health Perspectives, 105: 608-612.
World Bank, 2001. GDP per capita. Zheng, H., 2003. Case study of coal gasification-based energy supply system in
Zaozhuang City. Ph.D. Thesis, Tsinghua University, China, Beijing. Zheng, H., Li, Z., Ni, W., Ren, T. and Larson, E., 2003. Case study of coal gasification-
based energy supply system for China. Energy for Sustainable Development, 7(4): 30-38.
22
Table 1. Summary of 2020 energy technology scenarios (see (Wang et al., 2005) for
details). Final energy demand in 2020 is the same for all scenarios.
Scenario Main characteristics BAU Energy and environmental control technologies and emission factors
maintained at the year 2000 level. BACT Energy technologies same as year 2000, but equipped with best available
end-of-pipe controls such as desulphurization for power plants and catalytic converters on vehicles, specifically: • Power generation: continue to use low-sulfur coal (0.8% S content) as in
BAU, SO2 emissions cut by 90% (Zheng et al., 2003) and emissions of all other species by 20% (estimated by (Wang et al., 2005)) in coal-fired power plants
• Transport sector: CO, NOx and VOC emissions cut by 75% (Zheng et al., 2003), emission factors for other pollutants same as in 2000
• Residential and industrial sector: emissions of all species cut by 20% (estimated by (Wang et al., 2005))
ACGT Replace conventional coal combustion technologies with advanced coal gasification technologies with 24% penetration in Zaozhuang which supplies 2% of total energy needs (10% of the energy needs in the residential and commercial sectors) in three surrounding municipalities--Jining and Linyi in Shandong Province and Xuzhou in Jiangsu Province. The market share of the ACGT products are described in (Wang et al., 2005). Syngas, an intermediate energy product from coal gasification is burned for heat in the industrial sector, and used to generate electricity and produce dimethy ether (DME) as residential fuel and DME and methanol as transport fuels. • Power generation: although more abundant high-sulfur coal (3.7% S
content) is used, SO2 and other emissions are cut by approximately 99% from affected power plants in Zaozhuang (Zheng et al., 2003).
• Transport sector: CO, NOx and NMVOC emissions from methanol are 80% less than gasoline, and from DME 92% less than diesel (Zheng et al., 2003).
• Residential and industrial sector: SO2, CO and PM emissions from DME are nearly zero.
23

Table 2. Baseline mortality and morbidity rates in 2000
Health endpoint Rate1 Reference2
Total mortality 0.00645 (China Statistics Administration, 2002)
Mortality among 30+ yrs old 0.01013 (China Statistics Administration, 2002)
Infant mortality 0.0247 (China Statistics Administration, 2002)
Chronic bronchitis 0.0139 (Chen et al., 2002)
Respiratory hospital admissions 0.0124 (Chen et al., 2002)
Cardiovascular hospital admissions
(> 65 yrs old)
0.085 (Chen et al., 2002)
Acute bronchitis 0.39 (Chen et al., 2002)
Asthma attack (< 15 yrs old) 0.0693 (Chen et al., 2002)
Asthma attack (>= 15 yrs old) 0.0561 (Chen et al., 2002)
Restricted activity days 19 (Ostro, 1987) 1Units are cases per person per year. 2 All rates are for China except restricted activity days.
24

Table 3. Concentration - response (CR) coefficients for mortality and morbidity used in
this study
Health
endpoints
Pollutant
(µg/m3)
γa
(95% CIb )
Age group
Reference
Study Type
Adult
mortality
PM2.5 0.58%
(0.2%-1.04%)
Age 30+ (Pope III et al.,
2002)
Cohort
Infant
mortality
PM10 0.39%
(0.2%-0.68%)
1 month to
1 year old
(Woodruff et
al., 1997)
Cohort
Chronic
bronchitis
PM10 0.45%
(0.13%-0.77%)
All ages (Jin et al.,
2000; Ma and
Hong, 1992)
Time-series
Acute
bronchitis
PM10 0.55%
(0.19%-0.91%)
All ages (Jin et al.,
2000)
Time-series
Cardiovasc
ular HAb
PM10 0.1%
(0.067%-0.15%)
Age 65+ (Samet et al.,
2000)
Time-series
Respiratory
HAb
PM10 0.036%
(0.012%-0.06%)
All ages
(Spix et al.,
1998) c
Time-series
Restricted
activity
days
PM10 1.5%
(0.76%-2.35%)
Age 18-65 (Cifuentes et
al., 2001;
Ostro, 1990) d
Time-series
Asthma
attack
PM10 0.39%
(0.19%-0.59%)
Adults
(>=15 yrs)
(Chen et al.,
2002)
Time-series
Asthma
attack
PM10 0.44 %
(0.27%-0.62%)
Children
(< 15 yrs)
(Chen et al.,
2002)
Time-series a Units are % change in mortality and morbidity as a result of a 1 μg/m3 change in PM
concentration. b CI = confidence interval; HA = hospital admissions c Originally based on black smoke (BS), converted to PM10 by multiplying by 0.6. d The baseline morbidity rate has been incorporated into the CR coefficients by
(Cifuentes et al., 2001).
25
26
Chinese values
Table 4. Valuation of morbidity for China (2000 US$).
Health Endpoints US values
(EPA, 1997) 2000 2020
Chronic bronchitis 338,000 1,854 8,848
Respiratory hospital adm s 8,970 49 5 ission 23
Cardiovascular hospital admissions 12,350 68 323
Acute bronchitis 59 0.5 2
Asthma attack 42 0.2 2
Restricted activity days 108 0.6 3
Table 5. Emission scenarios for 2000 and 2020 used in CMAQ simulations
Technology scenario (market share*)
Emission
scenario
Year
Jining, Linyi and
Xuzhou
Rest of the
model region
Zaozhuang
A 2000 BAU (100%) BAU (100%) BAU (100%)
B
2000
Zero anthropogenic
emissions
BAU (100%)
BAU (100%)
C 2020 BAU (100%) BAU (100%) BAU (100%)
D 2020 Zero anthropogenic BAU (100%) BAU (100%)
emissions
E 020 BACT (100%) (100%) 2 BAU (100%) BAU
F 2020 ACGT (24%) and d
%) BAU (76%)
ACGT (2%) an
BAU (98
BAU (100%)
* Sha of techn -sp products ergy mare ology ecific energy in the final en rket

27
Regional health impacts from, and economic costs of, 2000 and 2020 BAU anthropogenic emissions from Zaozhuang and technology substitution in Zaozhuang in 2020. Emission scenarios are defined in Table 5.
Year 2000 2020 BAU
E (BACT) - C (BAU) F (ACGT and BAU) - C (BAU)
Pollutant PM
Secondary PMa PM
Secondary PM PM
Secondary PM PM PM
Secondary
Health impacts (100 cases) (% in Zaozhuang)Death -59 -28 -107 -26 -25 (29%) -8 (8%) -52 ( % -2 %36 ) (13 )
Years of life lost -421 -219 -745 -200 -174 (27%) -63 (8%) 347 -18 - (35%) (13%)Chronic bronchitis -361 -56 -856 -52 -177 (44%) -16 (8%) 496 ( % -- 44 ) 5 (13%)Acute bronchitis -1,2390 -1934 -29342 -1771 -6069 (44%) -553 (8%) -16994(44%) -157 (13%)Hospital admission -1569 -245 -3717 -224 -769 (44%) -70 (8%) -2153 (44%) -20 (13%)Restricted activity day -59611 -9307 -141170 -8520 -29201 (44%) -2662 (8%) -81759 (44%) -756 (13%)Asthma attack -1378 -215 -3263 -197 -675 (44%) -62 (8%) -1890 (44%) -17 (13%)
Health damage costs (million 2000 US$)Deathb -200 -97 -1,750 -423 -404 -132 38-841 -Illness b -80 -13 -904 -55 -187 -17 3 -5-52
Health damage costs as % of Zaozhuang’s GDPc
Death and illness -10% -4% -16% -3% -4% -1% -8% 0P
a Secondary PM includes sulfates, nitrates, ammonium, and secondary organic carbon, all of which are categorized
P
b Death and years of life lost are alternative measures of mortality. Illness is the measure of morbidity.
P
c Calculated as the total health costs (sum of death and illness) divided by the population and per capita GDP in Zaozhuang. The populatiZaozhuang was 3.5 million and 281 million in the model region in 2000 (China Statistics Administration, 2002) and to increase by 17% in 2020. The per capita GDP in Zaozhuang was $842 in 2000 and is projected to be $4008 in 2020 (Wor 001)
as P
ld Bank, 2
M2.5.
is projected .
on in
Table 6. potential health benefits from

Tab
attr
for
l M nitud ct ealth impacts per kg emitted pollutant
ib l m dary PM constituents Ox, and NMVOC)
va narios. Scen
enarmpared
Reduction in Emissions (kton/yr)
ea ts*
issions/yr)
e 7.
utab
rious s
ScCo
ag
e to pri
ce
e o
ary
f to
PM
tal
a
he
nd
arios are defined in Table 5.
alth
key
im
se
pa
con
s and h
(SO2, N
lth impacios
To(m
tal illio
hean
lthUS
im$/y
par)
cts H(2000 US$/kg em
Sulfates SO2 B – 6 A -47 5 -0.7 D – 2 C -248 24 -1.1 E – 115 C -149 -1.3 F – -31 152 C -0.2 Nitrates NOx B – A -34 13 -2.7 D – C -106 99 -1.1 E – C 7 30 0.2 F – C 0 50 0.0
rganics
S
o
ecant
onhr
daop
ry oge
nic NMVOC
B – A 0 31 0.0 D – C 0 47 0.0 E – C 0 17 0.0 F – C 0 4 0.0 M rima MPrimary P P ry P B – A -158 220 -0.7 D – 4 C -971 76 -2.0 E – -198 157 C -1.3 F -589 536 – C -1.1 ealth c 0 /k l health impacts
illion 2 US$/yr) / ction in emissions (kton lues are health
efits; positive values are hea mages.
ts p
on
S$* H
(m
ben
impa
000
er kg em
redu
issi s (20 0 U g emissi
/yr)
ons/
. Ne
yr) = tota
gative va
lth da
28
Figure 1. Map of China and model boundaries.
The reen rectangle d rcates the CMAQ domain with an area of
792*6 and a grid size of 12*12 km2 on which the health impact analysis is
focused; the solid gle dem CMAQ domain with an area of
1728*1728 km2 and a grid size of 36*36 km2. The dashed green and blue rectangles
repres M5 odel domains. Provinces labeled with numbers are those for which a
high-resolution em been compiled (Wang et al., 2005).
Note: solid g ema
48 km2
blue rectan arcates the
ent the M m
ission inventory has
29
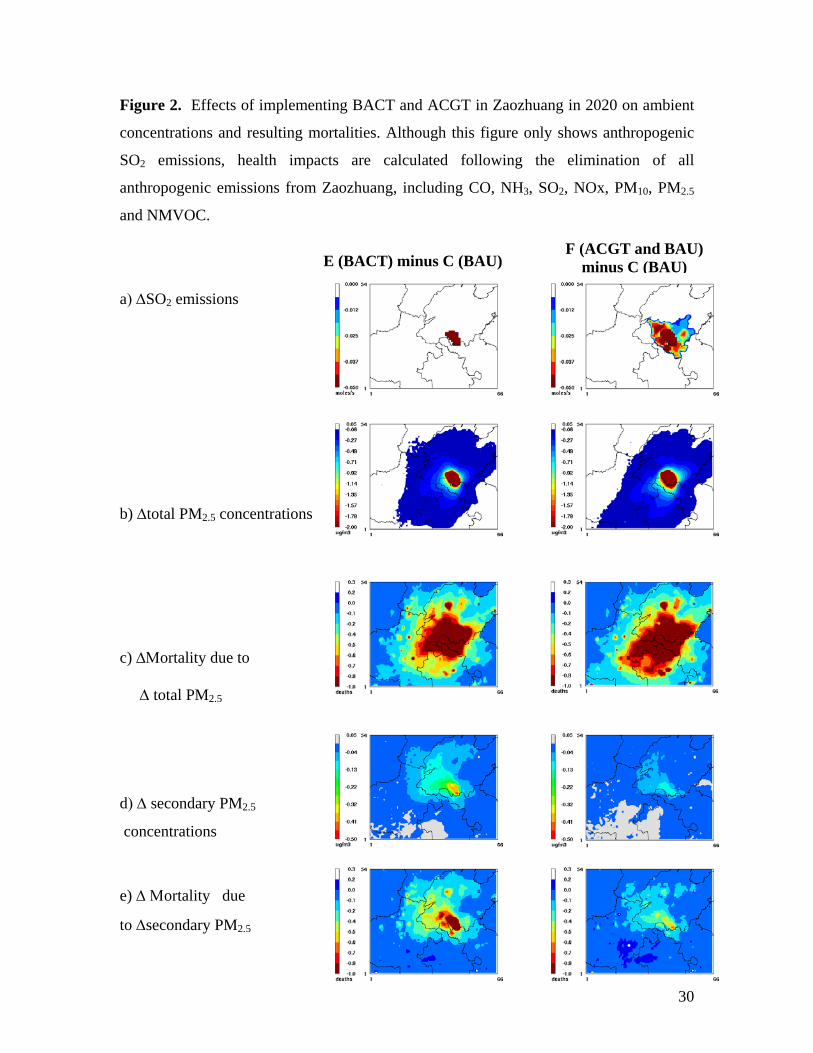
Figure 2. Effects of implementing BACT and ACGT in Zaozhuang in 2020 on ambient
oncen
O2 emissions, health impacts are calculated following the elimination of all
nthropogenic emissions from Zaozhuang, including CO, NH3, SO2, NOx, PM10, PM2.5
nd NMVOC.
) ΔSO2 emissions
) ΔΜortality due to
Δ total PM2.5
d) Δ secondary PM2.5
concentrations
e) Δ Μortality due
to Δsecondary PM2.5
c trations and resulting mortalities. Although this figure only shows anthropogenic
S
a
a
F (ACGT and BAU) minus C E (BACT) minus C (BAU) (BAU)
a
b) Δtotal PM2.5 concentrations
c
30