Embed Size (px)
Citation preview

Evaluating Profitability and Efficiency of Bank Performance: The Case of Kazakhstan Banks
Marzhan Tazhenova
Submitted to the Institute of Graduate Studies and Research
in partial fulfillment of the requirements for the Degree of
Master of Science in
Banking and Finance
Eastern Mediterranean University
June 2013 Gazimağusa, North Cyprus

Approval of the Institute of Graduate Studies and Research
Prof. Dr. Elvan Yılmaz
Director I certify that this thesis satisfies the requirements as a thesis for the degree of Master of Science in Banking and Finance.
Assoc. Prof. Dr. Salih Katircioğlu Chair, Department of Banking and Finance
We certify that we have read this thesis and that in our opinion it is fully adequate in scope and quality as a thesis for the degree of Master of Science in Banking and Finance.
Assoc. Prof. Dr. Mustafa Besim Supervisor
Examining Committee
1. Assoc. Prof. Dr. Eralp Bektaş 2. Assoc. Prof. Dr. Mustafa Besim
3. Assoc. Prof. Dr. Nesrin Özataç
iii
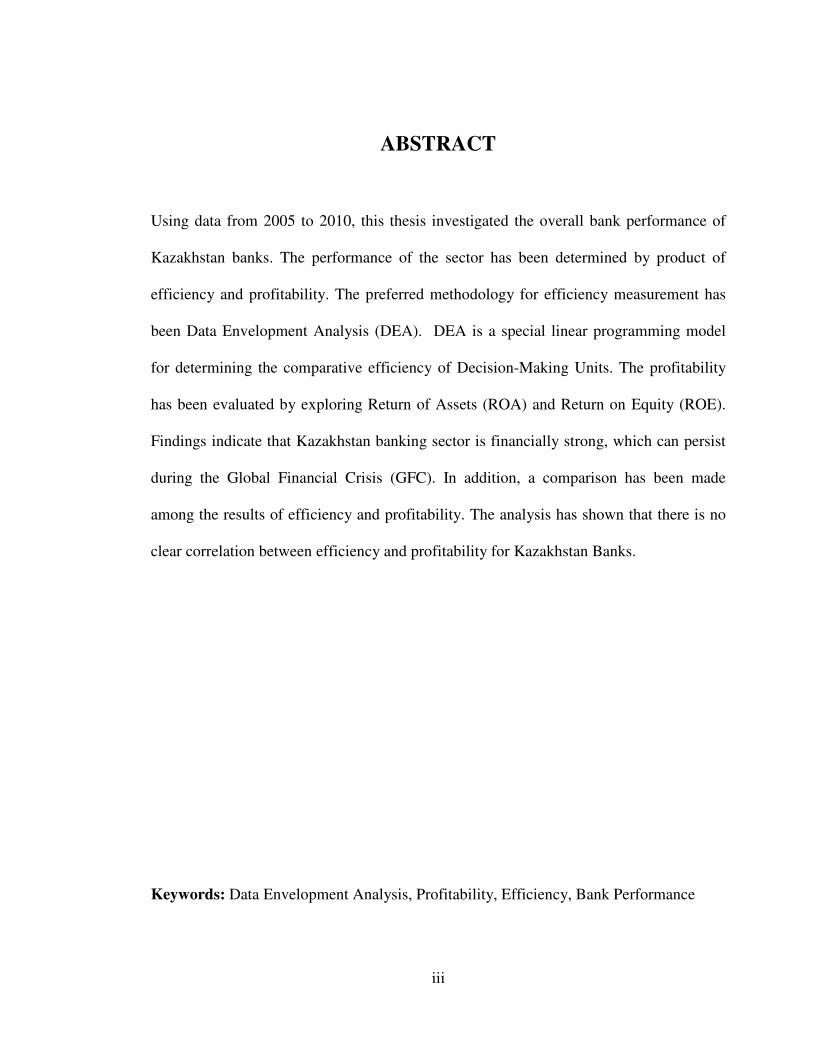
ABSTRACT
Using data from 2005 to 2010, this thesis investigated the overall bank performance of
Kazakhstan banks. The performance of the sector has been determined by product of
efficiency and profitability. The preferred methodology for efficiency measurement has
been Data Envelopment Analysis (DEA). DEA is a special linear programming model
for determining the comparative efficiency of Decision-Making Units. The profitability
has been evaluated by exploring Return of Assets (ROA) and Return on Equity (ROE).
Findings indicate that Kazakhstan banking sector is financially strong, which can persist
during the Global Financial Crisis (GFC). In addition, a comparison has been made
among the results of efficiency and profitability. The analysis has shown that there is no
clear correlation between efficiency and profitability for Kazakhstan Banks.
Keywords: Data Envelopment Analysis, Profitability, Efficiency, Bank Performance

iv
ÖZ
Bu tez Kazakistan bankalarının 2005-2010 yılları arasında genel banka performansını
incelemektedir. Sektörün performansı ürün verimliliği ve karlılıkla belirlenmiştir.
Verimliliği ölçmek için tercih edilen yöntem veri zarflama analizidir. Veri Zarflama
analizi karar verme birimlerinin karşılaştırmalı verimliliğini belirlemek için kullanılan
özel doğrusal programlama modelidir. Karlılık, varlık getirisi ve öz kaynak karlılığı
hesaplanarak değerlendirilmiştir. Sonuçlar Kazakistan bankacılık sektörünün finansal
yönden güçlü bir yapıya sahip olduğunu ve küresel finansal kriz dönemlerinde de bu
yapısını sürdüreceğini gösteriyor. Bunun yanında verimlilik ve karlılık sonuçları
karşılaştırılmıştır ve yapılan analizler sonucunda iki performans belirleyicisinin bağımsız
değişkenler olduğu saptanmıştır.
Anahtar Kelimeler: Veri Zarflama Analizi, Karlılık, Verimlilik, Banka Performansı

v
ACKNOWLEDGMENTS
I would like to thank my supervisor Assoc. Prof. Dr. Mustafa Besim for his contribution,
continuous support and guidance of this study. The study came to end only due to his
timely and professional supervision. Without his support all my efforts simply could fail.
I owe my personal success to my family, who was supporting me during these years in
North Cyprus. I would like to dedicate this study to my lovely mother and husband. I am
the happiest person to have such a great family.

vi
TABLE OF CONTENTS
ABSTRACT ..................................................................................................................... iii
ÖZ ..................................................................................................................................... iv
ACKNOWLEDGMENT .................................................................................................... v
LIST OF ABBREVIATIONS ........................................................................................... ix
LIST OF TABLES ............................................................................................................. x
LIST OF FIGURE ............................................................................................................. xi
1 INTRODUCTION .......................................................................................................... 1
1.1 Aim of the Study ...................................................................................................... 2
1.2 Method for the Study ................................................................................................ 2
1.3 Limitation of the Study ............................................................................................ 3
1.4 Structure of the Thesis .............................................................................................. 4
2 EXPERIENCE IN MEASURING BANK PROFITABILITY AND PERFORMANCE 5
2.1 Profitability in Banking Sector ................................................................................. 6
2.2 Efficiency of the Banking Sector ............................................................................. 7
2.3 Measuring Performance of a Bank ........................................................................... 9
2.4 Main findings of Literature Review ....................................................................... 14
3 DATA AND METHODOLOGY .................................................................................. 17
3.1 Republic of Kazakhstan ......................................................................................... 17
3.1.1 Background of Republic of Kazakhstan .......................................................... 17

vii
3.1.2 Economy of Kazakhstan .................................................................................. 18
3.1.3 Structure and Development of Banking Sector ............................................... 19
3.2 Data for the Study .................................................................................................. 20
3.3 Methodology .......................................................................................................... 21
3.3.1 DEA ................................................................................................................. 21
3.3.1.1 CCR Model .................................................................................................. 21
3.3.1.2 BCC Model .................................................................................................. 24
3.3.1.3 Application for DEA .................................................................................... 25
3.3.2 Profitability Measure Tools ............................................................................. 27
4 PROFITABILITY AND EFFICIENCY OF KAZAKHSTAN’S BANKS: EMPIRICAL
RESULTS ........................................................................................................................ 29
4.1 Efficiency Results .................................................................................................. 29
4.1.1 DEA: CCR Model ........................................................................................... 31
4.1.2 DEA: BCC Model ........................................................................................... 35
4.2 Profitability Results ........................................................................................... 38
4.2.1 ROA ........................................................................................................... 38
4.2.2 ROE ............................................................................................................ 41
4.3 Profitability vs. Efficiency ..................................................................................... 45
5 CONCLUSION ............................................................................................................. 49
REFERENCES ................................................................................................................. 53

viii
APPENDICES ................................................................................................................. 57
Appendix A: The software report of BBC Model Result for 2005…………………..57
Appendix B: The software report of BCC Model Result for 2005 .............................. 69
Appendix C: The table of Financial Parameters .......................................................... 81

ix
LIST OF ABBREVIATIONS
ATF bank JSC: ATF BTA bank JSC: BTA Kaspi bank JSC: KASPI Bank Center credit JSC: CCB Eurasian bank JSC: EURB Kazkommerts bank JSC: KKB Halyk bank JSC: HALYK Alliance bank JSC: ALB Nurbank JSC: NUR Temirbank JSC: TEMIR Bankpozitive Kazakhstan JSC: POZB KZI bank JSC: KZI Gross Domestic Product: GDP Global Financial Crisis: GFC Return on Assets: ROA Return on Equity: ROE Regional Financial Center Rating Agency: RFCR
Data Envelopment Analysis: DEA

x
LIST OF TABLES
Table 1: Efficiency Level of the Selected Banks According to the Bank Size ................ 30
Table 2: CCR Model Results ........................................................................................... 33
Table 3: Comparison of the pre-GFC and post-GFC Banking Performance Using CCR
Model ............................................................................................................................... 33
Table 4: BCC Model Result ............................................................................................. 35
Table 5: Comparison of the pre-GFC and post-GFC Banking Performance Using BCC
Model ............................................................................................................................... 37
Table 6: ROA Results ...................................................................................................... 38
Table 7: ROA by the Size of the Banks ........................................................................... 40
Table 8: ROE Results ....................................................................................................... 42
Table 9: ROE by the Size of the Banks............................................................................ 43
Table 10: ROE for the Period 2005 to 2010 (Inclusive and Exclusive year 2009) without
BTA and ALB banks ........................................................................................................ 44
Table 11: Comparison of the Average Annual Results .................................................... 45
Table 12: Comparison of Annual Average Results (Excluding BTA and ALB banks) .. 47

xi
LIST OF FIGURE
Figure 1: CCR Model Results .......................................................................................... 34
Figure 2: BCC Model Result............................................................................................ 37
Figure 3: ROA Results ..................................................................................................... 40
Figure 4: Comparison of Average Results ....................................................................... 46
Figure 5: Comparison of Adjusted Average Results........................................................ 47
1
Chapter 1
1. INTRODUCTION
Development of a country’s banking system is one of the most significant factors
affecting wealth of the economy. It plays a crucial role in the main operations of both
private as well as public sectors. Many studies have shown that development of the
banking sector has high positive correlation with the level of the economy development.
Republic of Kazakhstan has a very well developed banking system. The banking sector
contributes to the biggest part of Gross Domestic Product (GDP) and playing crucial role
in the country’s economy. Any changes in banking system will have crucial effect on the
economy of the country.
Recent Global Financial Crisis (GFC), 2007-2009, had a tremendous negative effect on
Kazakhstan’s economy. The main hit was taken by the country’s banking sector. There
were several main reasons why the sector was so vulnerable to the crisis including:
1. The amount of foreign borrowings of the Kazakhstan’s banks was so high that
the banks were unable to meet their obligations when foreign investors suddenly
started to claim their money.
2. There were a lot of shortcomings in the assessment of credit risk
3. The total quantity of non-performing loans increased tremendously

2
According to the report of Regional Financial Center Rating Agency (RFCRA) for 2012
the banking sector is largest and dominate segment in financial sector. However it has a
tendency to decrease, as from 2010 it was 68 % of the GDP, from 2011 it was 62.3 of
the GDP and in 2012 it is 55.1% of the GDP. The date shows a decline effect of the
financial segment coverage.
1.1 Aim of the Study
As it was mentioned before the banking sector plays a crucial role in the economy of the
Republic of Kazakhstan. The study is therefore concentrates in the banking sector of the
country. The aim of the study is to analyze the productivity and efficiency of the
banking performance in Kazakhstan for the period from 2005 till 2010. This will be
done by using both the main accounting concepts as well as the economic approach.
Also, the study will present correlation between results of both methods.
1.2 Method for the Study
The common assumption is that the successful financial performance of an operating
resource is reflected by the high level of profitability. In this study we will evaluate the
profitability by frequently used tools such as Return on Assets (ROA) and Return on
Equity (ROE). The study examines twelve randomly chosen commercial banks of
different scale with the purpose to receive the annual average values. The analysis would
also conduct Data Envelopment Analysis (DEA) in order to determine the efficiency rate
of these twelve banks performance. The efficiency rate would be estimated by using
model exhibiting constant return to scale is called CCR (Charnes, Cooper, Rhodes)

3
model, the second module used to analyze the efficiency rate is BCC (Banker, Charnes
and Cooper) model that analyses banking sector efficiency using variable returns to
scale.
The inputs of the DEA such as interest income, non-interest income, interest expense
and non-interest expense were used to evaluate profitability and efficiency level. The
statistical variables were taken from annual financial statements of the banks.
1.3 Limitation of the Study
An unavailability of data has prevented this study to disaggregate banks according to the
size of their assets, structure, or type. Particularly the data was missing for many banks
for the period from year 2005 till year 2012. The current study analyses 12 banks that
were chosen randomly in attempt to determine average performance of the banking
sector. The financial area of the banking structure is analyzed using sample of five
biggest banks, few small branches of the foreign banks, new banks that started to operate
in recent years and one government bank.
Another limitation of this study was the fact that factors that to compare finding results
with word result there was no available data for all countries, the data was collected and
based from several publishing work for different year. Also, one of the indicator which
usually using for DEA analysis is labor force, as it was difficulties to find this data that
indicator was not added to application as an output.

4
1.4 Structure of the Thesis
The thesis consists of five chapters. Chapter 1 is introduction part which focuses on the
objective of the study, method of the study, limitation of the study and structure of the
thesis. Chapter 2 focuses on the literature review, which examines existent academic
publications discussing efficiency and profitability of banking sector, methodology tools
to measure efficiency and profitability level, factors which have internal effect and
variables that have an influence on results. Also, this chapter includes the main findings
of these academic publications. Chapter 3 is the biggest part of the thesis and consists of
two main parts. The first part attempts to introduce Republic of Kazakhstan, economy of
the country, structure and development of banking sector, and initial data for the
analysis. The purpose of the second part is to explain methodology, the both models of
DEA measurement tool in more details. The second part of the current study will also
explain the software application for DEA. The last part of Chapter 3 discussing the
measurements tools to determine a profitability level of bank’s performance. Chapter 4
focuses on empirical results of the study. Chapter 4 consists of four parts. The first part
presents and explains the results of the CCR and BCC models of DEA. It also
investigates factors which had significant effect. The second part of this chapter
examines profitability result which was measured by ROA and ROE. The third part
compares the results of the two previous parts to show that efficiency and profitability
rates are positively correlated to each other. The Chapter 5 summarizes the results and
the main finding of this thesis.
5
Chapter 2
2. EXPERIENCE IN MEASURING BANK PROFITABILITY
AND PERFORMANCE
In this part of the thesis, the literature on bank efficiency and bank profitability will be
reviewed. Efficiency of the banking industry is a significantly important issue for both
developed economies and economies that are in transition. This chapter focuses on
theoretical and empirical studies indicating efficiency in banking sector in developed
and developing countries. There are many researches referring to measurement and
evaluation of the overall performance of banking sector in terms of both profitability and
efficiency. For the last period both developed and developing transition counties have
experienced banking crisis in different periods which affected economic growth. For
example: Chile, Argentina, and Mexico in 1980s; Sweden in 1990s; Thailand, Malaysia,
Korea, Philippines, and Indonesia in 1997; Paraguay in 1995-98; Russia in 1998; Turkey
in 1994, 2000, and 2001; Argentina in 2001; Kazakhstan in 2007-10.
The financial sector has a crucial role in the economic growth of a country. Therefore,
efficiency and profitability of banking sector have been linked with development of
economies. There are some studies leading into the relation between financial institution
and economy development (Levin and King, 1993; Levin, 2004). Due to the objective
of the thesis the literature review will be concentrated on the profitability and the
efficiency of banking sector in regards to determining performance.

6
2.1 Profitability in Banking Sector
The goal of any bank is to generate revenues that will be sufficient to cover their
expenditures. Moreover banks just like any businesses aim for profit. The main source of
income comes from interest charge on loans. Profitability is the primary goal of all
business ventures, which is important for viability in the long-run. In this respect, it is
extremely important to evaluate past, current and future profitability, in order to predict
and avoid negative consequences. The factors which determine profitability are income
and expenditure which significantly shown in financial statements during annual period.
Gul et al. (2011) examine the profitability of 15 Pakistani commercial banks using bank-
specific and macro-economic determinants over the period of 2005-2009. Using Pooled
Ordinary Least Squares (POLS), their results prove that the internal (bank size, capital,
loan and deposits) and external factors (GDP, inflation and stock market capitalization)
have strong influence on the profitability.
Davydenko (2011) studied profitability of bank performance in Ukrainian banking
sector by implementing the internal and externals variables that play a huge role defining
bank profitability. Using a panel data, he utilizes the frame time of 2005-2009.
According to Davidenko results, the Ukrainian banking sector suffered a big blow on the
quality of loans and is not able at the end to reconstruct their profits based on the
growing flow of deposits. According to Davidenko, credit risk, liquidity, deposits,
inflation as well as foreign ownership all have negative effect on profitability of the ban
which is regressed separately. Davydenko has not only found negative causes but also

7
positive factors such as of capital, bank size, concentration rate and exchange rate
depreciation.
Sing and Chaudhary (2009) analyze the profitability of Indian’s banking sector from
three different perspectives: Private, Public and Foreign banks. The result of this analyze
is that profitability of Indian banks has significantly increased over the past years. The
grows of macroeconomics determinants as exports , income per capita and foreign
exchange reserves have influence to profitability.
Anwar and Herwanay (2006) work on the subject of bank profitability of Indonesian
Provincial Government’s banks and Private Non-foreign Exchange banks for the period
of 1993-2000. To determine the profitability of the Indonesian banking sector they used
ROA and ROE as dependent variables. There are main finding that Total Asset and
Loans to Deposits Ratio are the ones which affecting the profitability positively.
2.2 Efficiency of the Banking Sector
Efficiency is one of the central terms used in assessing and measuring the performance
of organizations (Mouzas, 2006). Efficiency is concerned with minimizing the cost and
deals with the distribution of assets across best alternative uses.
Efficiency determines the level of output achieved with a given amount of input, such as
cost per unit. A more efficient unit means it obtains a higher level of output using the
same amount of input, or it obtains the same level of output using a lower level of input.

8
An efficient bank can be defined as the one that can create a relatively high volume of
income-generating assets and liabilities the same as the one that can create a relatively
high level of income from service and intermediation operations with the given level of
inputs.
Efficiency analysis is essential for the evaluation of bank performance. There are many
tools to evaluate efficiency. Among them Stochastic Cost Frontier, CAMEL (Capital
Adequacy, Asset Quality, Management, Earnings and Liquidity), and Data Envelopment
Analysis. Most following researchers commonly used Data Envelopment Analysis
(DEA) approach for evaluating efficiency of banks. The DEA is non-parametric
approach, which is most popular for evaluating efficiency in the banking sector. There
are two model of DEA method. The first method was developed by Charnes et al. (1978)
which are based on Farrell’s (1957) efficiency measures and is it call CCR (Charnes,
Cooper and Rhodes) model. CCR model was developed under the assumption of
constant returns to scale (CRS). On the other hand, the second model is BCC (Banker,
Charnes and Cooper) model, introduced by Banker et al. (1984) as an extension of the
CCR model. BCC model was developed under the assumption of variable returns to
scale (VRS). The primary steps in constructing a DEA method is selecting decision-
making units (DMU’s) that computes a comparative ratio of outputs to inputs for each
unit. Avkiran (1999) stated that: “DEA identifies a unit as either efficient or inefficient
compared to other units in its reference set, where the reference set comprises efficient
units most similar to that unit in their configuration of inputs and outputs” (p.999).

9
Previous researcher for evaluating the efficiency of bank performance used two
approaches. The first approach is the intermediation approach where bank present
oneself as a financial intermediaries. In this approach from perspective of cost-revenue
management, where bank’s major business activity is to borrow funds from depositors
and lends those funds to other for spread. There are inputs and outputs on this approach
(Al-Faraj et al., 2006). There are; 1) net interest expense; 2) non-interest expense; 3) net
interest income; 4) non interest income.
The second approach is production approach where usually as inputs are labor and
capital and outputs are loans and deposits. Avkiran (2000) argued that for analyzing
bank efficiency it is better to use intermediation approach. The DEA methodology will
be considering more detail on Chapter 3.
2.3 Measuring Performance of a Bank
Vassiloglou and Giokas (1990) assessed the relative efficiency of bank branches at the
Commercial Bank of Greece through DEA method. As a result only nine from twenty
branches had maximum efficiency score of 1. The other branches had less than 1.
However, the authors did not evaluate average mean of efficiency score of all branches
of Commercial Bank. One explanation of variation between efficiency ratings is
distinguished among centers and province branches. There is a trend of a general
increase in the inefficiency level moving from the central branches toward small
branches located outside of the main cities. Another explanation is that branches
processing a larger number of transactions are found to be more efficient than branches
with fewer transactions. However, Vassiloglou and Giokas (1990) found that “this
10
explanation was rejected after examination of the distribution of inefficient branches
among branches with varying volumes of production” (p.594). Vassiloglou and Giokas
(1990) stated that “efficiency ratings are determined by the inputs each of them utilizes
most efficiently” (p. 595).
In a similar manner, Golany and Storbeck (1999) analyzed the efficiencies of selected
branches of a large US bank over six consecutive quarters, from second quarter 1992 to
the third quarter of 1993. They were measured by DEA analysis to evaluate the relative
efficiencies of selected Big Bank branches. The results showed that 92 branches were
fully efficient in the third quarter of 1993, and only five fell below 70 percent efficiency.
One of the important aspects of their study was to group branches into meaningful
division with the objective of understanding the performance of each group.
Vujčić and Jemrić (2001) used DEA to in order to conduct a comprehensive analysis of
the efficiency performance of the Croatian banking sector, by two major DEA models:
(1) the CCR ratio model and (2) the BCC model. They used data on Croatian banks in a
period from 1995 to 2000 separately for each year. They also divided data by according
to the size of the analyzed banks, establishment date, structure of the board, and assets
quality. According to Vujčić and Jemrić analysis, foreign owned banks were on average
most efficient banks in Croatia. They also identified new banks to be more efficient than
the old ones. Moreover, the study had discovered that small banks are characterized by
higher global wise efficiency while large banks are more efficient in the local context.
Another conclusion from the same study shows that those banks which have less non-
performing loans are more efficient relative to the other.

11
The Russian Federation is a developing economy. Caner and Kontorovich (2004)
compared efficiency level in the Russian Federation with international performance and
also estimated the contributions of different factors which affect the level of efficiency
of Russian banking sector. The authors used parametric method called the stochastic
frontier model for measuring efficiency score over the 1999-2003 periods. The
researchers have identified that the internal determinants of the banks efficiency include
capital adequacy ratio, assets quality and earning performance. A range of risk factors
including interest rate risk, exchange rate risk, inflation risk, and the real exchange rates
fluctuations also play a significant role. The research found that real exchange rates had
a negative relationship with bank efficiency and non performing loans significantly and
negatively have influenced the bank efficiency. They also found that Russian banks have
very low efficiency scores compared to the banks in selected developed and developing
market. As authors stated “We find that equity to assets ratio, ratio of non-performing
loans, interest rate volatility, inflation rate volatility and real effective exchange rate
volatility significantly affect intermediation efficiency of banks in the Russia
Federation”.
Ozkan-Gunay and Tektas (2006) assessed the technical efficiency of non-public
commercial banks covering 1997 to 2001period of Turkish banking sector. They used
DEA method for evaluate the performance of bank. In their article authors focused more
on pre-crisis and crisis period which resulted in changes in banking sector. The study
found that the mean efficiency and number of efficient banks had a declining tendency
during the analysis period. According to research study, the decline has been caused by
the crises, as a result of declining income defined as output variable.

12
Al-Faraj, Bu-Bshait and Al-Muhammad (2006) investigated the performance of the
Saudi commercial banking industry. They evaluated and compared world mean
efficiency score with technical efficiency of Saudi banks for 2002 year. The Saudi
Arabia has an oil-based economy with significant control by the government over main
activities. The researchers used DEA method by Frontier Analyst Professional Software,
especially the intermediation approach to measure the level of productivity of banks.
They determined output variables as net interest income which is difference between
interest income and interest expense. As a second variable non-interest income which
includes fees from service, dividend income, trading income, exchange income and
other operating income were used. On the other hand, input variables which were
interest expense paid for borrowed money and non-interest expense including salaries
and employees’ benefits, rent, depreciation, and other administrative expenses. The
mean efficiency score of Saudi banks under CRS (constant return to scale) assumption
was 93.85 percent and 97.44 percent under VRC (variable return to scale) assumption.
The mean efficiency score of Saudi banks were higher compare with world mean
efficiency which value 86 percent according to research of Sathye (2003).
Wozniewska (2008) analyzed the biggest bank performance in Poland for the period
2000-2007. The Poland economy is one of the fastest growing economies in Europe. The
main idea was to evaluate efficiency by two methods; one being the classical analysis of
financial indicator and the other DEA methods. Both methods gave similar results which
means the DEA method is valuable and worth applying in evaluating bank performance.
Both methods showed decline trend in 2002-2003 and later until 2007 a recovery period.

13
Yang (2009) evaluated 240 branches of one big Canadian bank in Greater Toronto Area
by using DEA approach. According to the study, the average efficiency score of the
bank is 0.89. This means that the bank branches could use about 11 percent less labor
and expenses to produce their outputs. The author noted that it is very important to
evaluate the correlation between inputs and outputs for measuring performance,
otherwise sensitivity analysis on the impact of including and excluding variables is need
to be prepared.
Tsolas (2010) evaluated the overall performance of bank branches of a large commercial
bank in Greece in terms of profitability efficiency and effectiveness through a two-stage
DEA model. From the estimated model, they found that the overall efficiency level
regulated mostly by profitability efficiency level, which means positive correlation
between overall efficiency and profitability efficiency.
Rehman and Raoof (2010) compared overall efficiency score of Pakistan banks between
public, private and foreign ones over the period from 1998 to 2007. It is necessary to
underline a fact that Pakistan has a transition an economy. Because of financial reforms
and privatization policy, number of private banks emerged during the last decade and
amount of public banks declined significantly. According to data the results show not a
consistent performance of banking sector. In 1998, the overall efficiency score was very
well, being 0.81. This is just under world efficiency score. However, from 1999 and
2001 efficiency score declined to low levels compare with world efficiency standard.
Due the remaining period the efficiency score of Pakistan banks is inconsistent.
Moreover, in 2002 the mean efficiency is calculated as 0.80, which was again less than

14
world score. Also the result of 2004 showed the result 0.62 and in 2005 as 0.82. Rehman
and Raoof (2010) also argued that financial reforms and privatization policy do not
always have positive effect to bank performance. The effect of regulations and
government regulators the performance of banking sector was unsatisfactory.
Tanko (2011) decomposed efficiency using the non parametric approach DEA. The
author measured productivity growth using Malmquist Productivity Index (MPI) of
Nigerian commercial banks for more than 5 years. In this article the author categorized
banks into two groups according to ownership; one being state and the other being
privately owned. According to data private banks perform better than the state owned
bank.
2.4 Main findings of Literature Review
The aim of this part is to summarize literature review and to outline finding to highlights
aspects which play important role in evaluation of efficiency of bank performance and to
take into consideration factors which can influence to this analysis. From the review of
previous studies, it has been observed that developed countries faced rather higher
efficiency ratings than transition economies. In other words developed countries had the
rates that are closer to the world efficiency rates as compared to the developing
countries.
The other finding from the review is that very important for evaluating branches
performance researchers have to divide branches into meaningful division and

15
specification. This is done for understanding the performance of each group to correct
interpreting the result.
It is also important to determine and divide data according to the following criteria; a) a
bank size, b) an ownership structure, c) a data of the establishment and d) quality of
assets. Comparison between close to each other units is important to reach
comprehensible result.
Banks that have a lower level of non-performing loans have a higher efficiency rate as
compared to the banks that have relatively high level of non-performing loans.
Another conclusion is that volatility of interest rate; inflation rate and real effective
exchange rate have significantly effect on bank performance. However, this research
made by frontier stochastic approach and not takes into consideration DEA method.
In Turkish banking sector, declining trend was effect of increasing in output variables
are defined as income. That means that income is one of the meaningful output variables
and has to be included in evaluation.
The other result is positive correlation between overall efficiency and profitability
efficiency, which means if profitability raise it automatically increases efficiency rate.
But it does not mean that all inputs utilized in efficiently way.

16
As a result, according to article Rehman and Raoof (2010) regulations and more
involvement of government regulators as a financial reforms and privatization policy
have negative effect to bank performance.
Vassiloglou and Giokas (1990) stated that efficiency ratings are “determined by the
inputs each of them utilizes most efficiently” (p. 595). This factor depends on proper
management and distribution of assets, labor force and technology.
Finally, important result of literature review is that DEA method is valuable and worth
applying in evaluation of bank performance both in economically developed economies
countries and in developed countries.

17
Chapter 3
3. DATA AND METHODOLOGY
This chapter focuses on background of Republic of Kazakhstan including establishment
of economic environment and developing of banking sector. Additionally considering
methodology for evaluating efficiency rating of banking performance in Kazakhstan in
comparison between different levels of the bank’s in Kazakhstan’s banking sector and
additional to compare with other countries banking performance and data for evaluation
efficiency level and investigation.
3.1 Republic of Kazakhstan
3.1.1 Background of Republic of Kazakhstan
The Republic of Kazakhstan was a part of the Soviet Union and declared her
independence, on 16 December 1991. The Republic of Kazakhstan is a transcontinental
country in Central Asia and Eastern Europe. The Republic of Kazakhstan is ranked as
the ninth largest country in the world, it is landlocked territory of 2,727300 square
kilometers, and bordered with Russian Federation, China, Kyrgyzstan, Uzbekistan,
Turkmenistan, and also significant part of the Caspian Sea. The capital was moved from
Almaty which is largest city and financial center to Astana in 1998. For the last few
years the infrastructure of capital city significantly developed and economically grown.
Officially estimated population of Kazakhstan is 16 500 000 as of April, 2011, of which
46% is rural and 54% urban population.

18
3.1.2 Economy of Kazakhstan
The Republic of Kazakhstan has made significant and simultaneous progress in it is
economic transition after the collapse of the Soviet Union and increase for the small
episode the countries competitiveness and expand the benefits of the economic growth.
In the contemporary period of social development in the Republic of Kazakhstan is
characterized by features of the transition period. This is primarily due to the deep
qualitative changes in the whole system of social and economic relations based on the
market performance.
The Republic of Kazakhstan possesses enormous fossil fuel reserves and plentiful
supplies of other minerals and metals, such as uranium, copper, and zinc. It also has a
large part of agricultural sector featuring livestock and grain. Energy is the leading
economic sector and production of crude oil and natural gas condensate and present
significant part of export income.
In 2000 Kazakhstan become the first former Soviet Republic to repay all of it is debt to
the International Monetary Fund according to 7 years schedule. In March 2000 the U.S.
Department of Commerce granted Kazakhstan market economy status under U.S. Trade
Law. This change in status recognized substantive market economy reforms in the areas
of currency convertibility, wage rate determination, openness to foreign investment, and
government control over the means of production and allocation of resources. In
accordance with World Bank data the Kazakhstan’s economy grew by 7.3 percent in
2010 and by 7.1 percent in the first half of 2011. According to FDI indicators of last few

19
years, Kazakhstan stands on leading positions in CIS region. The main resources
attracting foreign investors to Kazakhstan are energy.
In spite of the strong economy of Kazakhstan for most of the first decade of 21 century,
the global financial crisis of 2008-2009 has exposed some central weaknesses in the
overall sector of economy. This period was complicated phase for banking sector and
had very serious examination for bank liquidity and capital adequacy.
Regarding RFCA Rating agency report for 2012 the total GDP for 2012 is 23 126.5
milliard tenge (Kazakhstan national currency).
3.1.3 Structure and Development of Banking Sector
The banking system of the Republic of Kazakhstan is important part of financial system
and represents the set of different interrelated banks and other credit institution and
existing under single financial mechanism.
In two-tier banking system in the first level is the Central bank, and on the second level
are state-owned banks, commercial banks and other credit organization. The central
bank is National Bank of Republic Kazakhstan and represents the upper level of the
banking system of the Republic of Kazakhstan. Central bank is representing the
relationship with banks in other countries, international banks and other financial
institution; however it is not profit organization. The other bank is second level banks,
except the Development Bank of Kazakhstan, which has specific legal status.

20
According to RFCA ratings despite substantial government assistance after GFC effect
the most of the banks have shown negative returns as of 01.01.2011. Since the beginning
of 2008 the loan portfolio of banks increased by 5%, but since July 2009 it decreased by
9%. Big banks of Kazakhstan have started to restructure their loan portfolios by
reviewing the extension of time and the revision of interest rates. This allows them to
accumulate liquidity. The liquidity, however is not directed toward new lending, instead
they maintain conservative credit policies. The share of the liquid assets in the banks
portfolios is increasing through reduction of the share of the loan portfolio; therefore,
there is a reduction in the interest income and the interest margin. Liquidity accumulated
for the purpose of coverage of further possible losses as well as for making provisions.
Market participants also noted that asset quality will deteriorate due to bad loans and
loans that lie in the risk zone.
3.2 Data for the Study
As discussed earlier, the research aims to measure the profitability and efficiency level
of commercial banks in Kazakhstan. The research uses performance data of the
commercial bank for the period of 2005-2010. In order to assess and compare banks
profitability and performance efficiency, 11 banks were chosen randomly. There are
total of 38 banks that operate in the banking sector of Kazakhstan. The total asset of
banking sector in 2012 is 1.303 trillion tenge. The banking sector is dominated by five
banks whose asset size exceeds 1 trillion of tenge. These five banks are included in this
study. The detail financial statistics of the banks studied in this thesis is provided in
Appendix C.
21
3.3 Methodology
Based on the literature review, in this thesis following method will be employed.
3.3.1 DEA
DEA is non-parametric approach that measures the relatively efficient production
frontier, based on the Decision Making Units (DMUs) which involve multiple outputs
that are produced with multiple inputs or undefined relation between inputs and outputs.
Important to note that DEA method only evaluates the relative efficiency of the
observation data and do not take into account absolute efficiency. DEA compares the
input and output levels of every one of DMUs in the analysis set at value and determine
the efficient frontier by the classifying the relatively best-practice DMUs. In DEA the
best practice or efficient unit which rating equal to 100 percent or E=1, inefficient unit
will be less than 100 percent or E<1. As mention on Chapter 2 first method was
developed by Charnes et al. (1978) which is based on Farrell’s (1957) efficiency
measures and call CCR model. CCR model was developed under the assumption of
constant returns to scale (CRS) later the second model is BBC model, introduced by
Banker et al. (1984) as an extension of the CCR model. BBC model was developed
under the assumption of variable returns to scale (VRS).
3.3.1.1 CCR Model
“Charnes, Cooper and Rhodes (CCR) (1978a, 1979) introduced a ratio definition of
efficiency, also called the CCR ratio definition of efficiency, which generalizes the
single-output to single-input classical engineering-science ratio definition to multiple
outputs and inputs without requiring reassigned weight.”

22
Vujčić and Jemrić (2001) described CCR model of a linear program which compares the
efficiency of each comparable unit by weighted output with weighted inputs.
Max h0=0
01
1i
m
i i
s
r rr
xv
yu
∑
∑
=
=
(3.1)
subject to 1ij
m
i i
s
r rjr
xv
yu
∑
∑
=
=≥
1
1
,j=1,….,n, (3.2)
with ur, vi>01 i=1,….,m; r=1,…s. (3.3)
Where:
h0= relative efficiency of the DMU
s= number of output produced by the DMU
m= number of inputs employed by the DMU
yrj, >0 represent output data for DMU
xij>0 represent input data for DMU
ur= output weights
vi= input weights
Following the Charnes-Cooper transformation (1962) one can select a representative
solution (u,v) for which
∑ ==
m
i ioi xv1
1 (3.4)

23
To obtain a linear programming problem that is equivalent to the linear fractional
programming problem. Thus, denominator in the above efficiency measure h0 is set to
equal one and the transformed linear problem for DMU0 can be written:
max ∑ ==
s
r rr yuz1 00 (3.5)
subject to
∑ ∑= ==≤−
s
r
m
i ijirjr njxvyu1 1
,...,2,1;0 (3.6)
∑ ==
m
i ioi xv1
1 (3.7)
ur =1,2,..,s (3.8)
vi 0, i=1,2,..,m. (3.9)
For the above linear programming problem, the dual can be written (for the given
DMU0) as:
minλz0=θ0 (3.10)
subject to
,1∑ =
≥n
j rorjj yyλr=1,2,…,s (3.11)
∑ =≥−
n
j ijji oxx100 ,λθ
i=1,2,…,m (3.12)
,0≥jλj=1,2,…,n (3.13)
These two linear problems described above yield same optimal solution of 0. This is the
efficiency score for any specific DMU0. The efficiency score for the whole range can be

24
obtained through repetition for each DMUj, j=1,2,…n. The value of optimal solution of
0 must be less than or equal unity. DMUs with θ*<1 can be described as a relatively
inefficient while DMUs with θ*=1 can be said to be relatively efficient, with the virtual
input-output combination points lying on the frontier. The linear facets that are spanned
by the efficient data units in turn create a frontier and the corresponding frontier
production function. This function is obtained under implicit constant return-to-scale
assumption and has no parameters that are unknown.
3.3.1.2 BCC Model
Vujčić and Jemrić (2001) also explained that constant returns-to –scale imply that there
are zero constraints on the weights λj, except the positivity conditions explained above.
In order to allow for the variable returns to scale it is required to impose the convexity
condition for the λj i.e. to include in the model (3.10)-(3.13) the constraint:
∑ ==
n
j j11λ
(3.14)
The resulting DEA model will exhibit variable returns to scale and is called BCC model
for the DMU0. These can be written as:
minλ z0=θ0 (3.15)
subject to
,1∑ =
≥n
j rorjj yyλr=1,2,…,s (3.16)
∑ =≥−
n
j ijji oxx100 ,λθ
i=1,2,…,m (3.17)

25
∑ ==
n
j j11λ
(3.18)
,0≥jλ j=1,2,…,n (3.19)
BCC-efficiency scores are obtained by running the above model for each DMU.
3.3.1.3 Application for DEA
The information and instruction regarding software was uploaded on web page. Frontier
Analyst software will be used for measure the efficiency level of bank performance.
Frontier Analyst is a performance measurement tool made by Banxia Software LTD,
which is based on the DEA technique. Frontier Analyst is a software program which
allowances the use of both CCR model and BBC model. Also, Frontier Analyst includes
two plots that allow you to identify correlation between indicated input and output
variables, and between the variables and the efficiency scores to identify factors that are
effectively representing the same criteria and factors that are identical with efficiency.
Frontier Analyst is determining the comparative efficiency of the inputs and outputs and
creates an overall efficiency score for each unit by using linear programming. Those
units doing best in any particular ratio are considered as “efficient”, for the rest of the
units it tries to optimize their performance to compare with their “efficient peers”. The
benefits of Frontier Analyst are: easy to use, integrates easily into existing systems,
variety of reporting options, peer based analysis, established technique, objective and
comparative analysis.

26
Application of DEA requires a number of units which a performing a similar process.
Also necessary identify and determine properly basis of variables of inputs and outputs
to efficient study and accurate assesse. Only those inputs and outputs should be
included to this analysis which is most relevant to desired research. The selection of the
input and output can be following controlled input, uncontrolled input and output.
Controlled output or input is that which management of bank unit can control and as a
result can amend the amount of fund resource used. Uncontrolled inputs or outputs are
variables that management cannot control, therefore cannot predict the fund resource
used. Output are the result of consumption of units which generating from inputs.
In case of this research the controlled inputs and outputs are considered Interest income
and Interest expenses, uncontrolled inputs and outputs are considered Non-interest
income and Non-interest expenses.
Additionally, Frontier Analysis allows assessing the relative efficiency by either model
which are CCR model (constant returns to scale) or BCC model (variable return to
scale). In the Constant returns outputs directly reflect to input level (i.e. doubling input
produces exactly double outputs). On the other hand, in the Variable returns outputs fall
off as input level rise (i.e. doubling input produces less than double outputs). In this
research will be compared results of both models.
27
3.3.2 Profitability Measure Tools
The most common method to evaluate how profitable banks are Return on Book Assets
(ROA) and Return on Book Equity (ROE) and Return on Sale (ROS).These ratios are
universally applied in financial analysis and are appropriate for evaluating the
profitability and the efficiency of bank performance under a given period of time and
compare to other market participants. The main advantages of financial tools it is
availability of data, simplicity and universality of applications.
ROA ratio is an indicator of how profitable an organization is relative to it is assets and
shows how efficient they exercise their assets for earning profit. The ROA ratio measure
by dividing a company’s net income by it is total assets, and it displayed as a percentage.
ROE ratio measures a corporation’s profitability by calculating how much profit a
company generates in regards to the investment made by the shareholders. This shows
how organizations effectively use shareholders money. The result is also expressed in
terms of percentage, and calculated by dividing net income by it is total shareholders’
equity.
The ROS or Profit Margin is a ratio of financial result to a bank income. This measure
providing how much profit is being produced per dollar of sales. The result is also
expressed in terms of percentage and calculated by dividing net income before interest
and tax by it is total sales.

28
Another group of financial indicator of profitability is margin rates which are Net
Interest Margin which is ratio of interest result to assets and Interest Spread which is
interpretation of differences among the average interest assets and the average
expenditure of interest-bearing liabilities. The Net income represents the amount of cash
flow remaining after all operating expenditures, taxes, interest and preferred stock
dividends have been deducted from total revenue of the company. However, this study
will be not applying these tools for measurements.
29
Chapter 4
4. PROFITABILITY AND EFFICIENCY OF
KAZAKHSTAN’S BANKS: EMPIRICAL RESULTS
This chapter outlines the main findings of the study. The methodology and data
described in chapter three have been used to determine and measure profitability and
efficiency level of the Kazakhstan’s banking industry. The non-parametric approach,
DEA was used to analyze revenue and cost efficiency of the 11 banks in Kazakhstan.
The chapter is classified into three parts. The first part derives the results of the selected
banks efficiency level analysis. The second part evaluates the profitability level of the
selected banks. The last part compares annualized efficiency and profitability levels of
the banks in attempt to determine existence/absence of the relation between these two
variables.
4.1 Efficiency Results
The Frontier Analyst software was used to analyze the performance of the selected
sample of banks through linear programming method. The CCR and BCC methods of
the DEA were used to derive the results of the efficiency level of the selected banks in
Kazakhstan. The data sample includes historical data for the period from 2005 till 2010.
Both methods of the analysis revealed high efficiency level of the selected banks. The
average efficiency range varied from 53.16 percent to 94.01 percent for the period from
2005 to 2010. The only exception occurs in year 2007, when average efficiency level

30
dropped to 60.15 and 63.32 percent using CCR and BCC models, and 2009, when
average efficiency level dropped to 63.42 and 77.86 percent using CCR and BCC
models, respectively. In general BCC model shows higher efficiency level than the CCR
method. The result of BCC and CCR model can be different due to the scale effect since
CCR model assumes constant returns to scale while the BCC model assumes variable
returns to scale.
The average efficiency levels for the period of 5 years from 2005 to 2010 according to
the banks size are presented in column 2 and column 3 of the table 1 below for the CCR
and BCC model, respectively. The average efficiency level excluding the outstanding
variable (year 2009) is presented in column 4 and column 5 of the table 1 below for the
CCR and BCC model, respectively.
Table 1: Efficiency Level of the Selected Banks According to the Bank Size
Size of the Bank
(1)
Efficiency Level (CCR Model)
(2)
Efficiency Level (BCC Model)
(3)
Efficiency Level
Excluding year 2009
(CCR Model)
(4)
Efficiency Level
Excluding year 2009
(BCC Model)
(5) Big 0.6544 0.8881 0.6642 0.9132
Medium 0.5118 0.6468 0.4910 0.6345
Small 0.7277 0.8396 0.7439 0.8512
The results of the analysis using CCR method revealed that there is no correlation
between the size of the bank and the efficiency level, hence the variables are

31
independent. The sample of the small banks results the highest efficiency level at 72.77
percent. The lowest performance resulted by the medium banks at 51.18 percent. An
attempt was made to determine if year 2009 (outstanding variable due to effect of global
financial crisis) breaks the correlation between variables. If year 2009 is excluding from
the sample the best efficiency performance is again described by the small size banks
with 74.39 percent efficiency level, followed by the big size banks with 66.42 percent.
The middle size banks are again characterized by the lowest performance level at 49.10
percent.
The BCC model, however, derives different results of the analysis. The most efficient
banks are the big banks with the average efficiency level of 88.81 percent, compared to
the lowest performance of the middle size banks of 64.68 percent. When year 2009 is
excluded from the analysis the big banks again show the best efficiency level at 91.32
percent followed by the small banks with the efficiency level of 85.12 percent. The
middle size banks still show the weakest performance by 63.45 percent.
In general under CCR model small banks are described by higher efficiency level, while
under BCC model the big banks are more effective. The same trend remains even if year
2009 is excluded from the data sample. The middle size banks are characterized by the
weakest efficiency performance under both CCR and BCC models.
4.1.1 DEA: CCR Model
Under the constant return to scale assumption banking performance characterized with
lower level of the efficiency compared to the variable returns to scale. Table 2 presents

32
the annual efficiency level for the period from 2005 to 2010 for each of the selected
banks. It also contains the average annual efficiency rating result of total bank
performance. Detail of the calculations can be followed in Appendix A. These
annualized average efficiency levels will later be used to determine the relation between
annual average efficiency levels and annual average profitability levels.
The findings indicate that the annual average levels of efficiency are significantly high
showing positive result. The significant drop in year 2009 can be explained as a result of
the GFC. According to the figures in Table 2 the GFC affected the efficiency of all the
banks except KZI bank and ATF bank.
The Committee for the Control and Supervision of the Financial Market and Financial
Organizations of the National Bank of the Republic of Kazakhstan during the GFC
stated that BTA and ALB banks’ assets did not cover their liabilities and that the capital
adequacy ratio of the both banks were violated. These two banks were the biggest banks
in the country and the effect of their crash could result on the overall collapse of the
financial system and effect country’s economy in great deal. The government took a
decision to nationalize BTA and ALB banks in an attempt to prevent the bankruptcy of
the banking sector. In the process of nationalization the government through the
recapitalization of funds became the main shareholder of the banks. They restricted their
debt to minimize and prolong the payments. This decision by the monetary authorities
have affected the efficiency performance of these two banks; BTA and ALB positively
(Table 2).

33
Table 2: CCR Model Results
Size of the bank
Efficiency CCR Model Years
Bank 2005 2006 2007 2008 2009 2010 Big
BTA 0.2678 0.2783 0.597 0.811 0.4637 0.482
Big KKB
0.3254 0.2982 0.69 0.869 0.4384 0.4833
Big HALYK
0.2649 0.9073 0.1875 0.198 0.8127 1
Big ALB
0.2331 0.3622 0.481 0.715 0.3964 0.5435
Middle ATF
1 0.9163 1 0.1723 1 0.991
Middle KASPI
0.2541 0.969 0.602 0.874 0.7849 0.8487
Middle NUR
0.2995 0.3641 0.774 0.554 0.1991 1
Small TEMIR
0.2034 0.2841 0.573 0.751 0.6896 0.5598
Small EURB
1 1 0.622 0.693 0.5179 0.5244
Small POZB
1 1 0.4391 0.799 0.6736 0.4667
Small KZI
1 1 1 1 1 1
Average
0.531 0.671 0.643 0.676 0.634 0.718
Table 3: Comparison of the pre-GFC and post-GFC Banking Performance Using CCR Model
Size of the Bank (1)
Pre-GFC average efficiency
(2)
Post-GFC average efficiency
(3) Big 0.62 0.65
Medium 0.44 0.68
Small 0.77 0.63
Table 3 above presents the average efficiency level of the banks according to the size of
the banks in year 2008 (before the GFC) and year 2010 (after the GFC). The BTA and

34
ALB banks were excluded from the analysis due to the financial injection from the
Kazakhstan’s government.
The big banks have the positive gap between pre-GFC and post-GFC performance of
approximately 3 percentage points. The medium banks were able to recover better
compared to the small and big banks. The positive gap between pre-GFC and post-GFC
is approximately 24 percentage points. In fact two out of three middle size banks were
managed to improve their performance in year 2010 compared to year 2008. As for the
small banks the results are opposite, having a negative gap of 14 percentage points. This
indicates that recovery process for small banks have been harder relative to bigger
banks.
Figure 1: CCR Model Results
The result in Figure 1 shows that most of the banks have high level of efficiency level.
It is only in 2005 and 2006 were low efficiency I observed. This can be explained by the
0
0.1
0.2
0.3
0.4
0.5
0.6
0.7
0.8
0.9
1
2005 2006 2007 2008 2009 2010
ATF
BTA
KASPI
EURB
KKB
HALYK
HALYK
ALB
NUR
TEMIR
POZB
35
establishment period for economy and financial service overall. Also few banks such as
ALB, NUR and KB had lower than 30 % GFC effect.
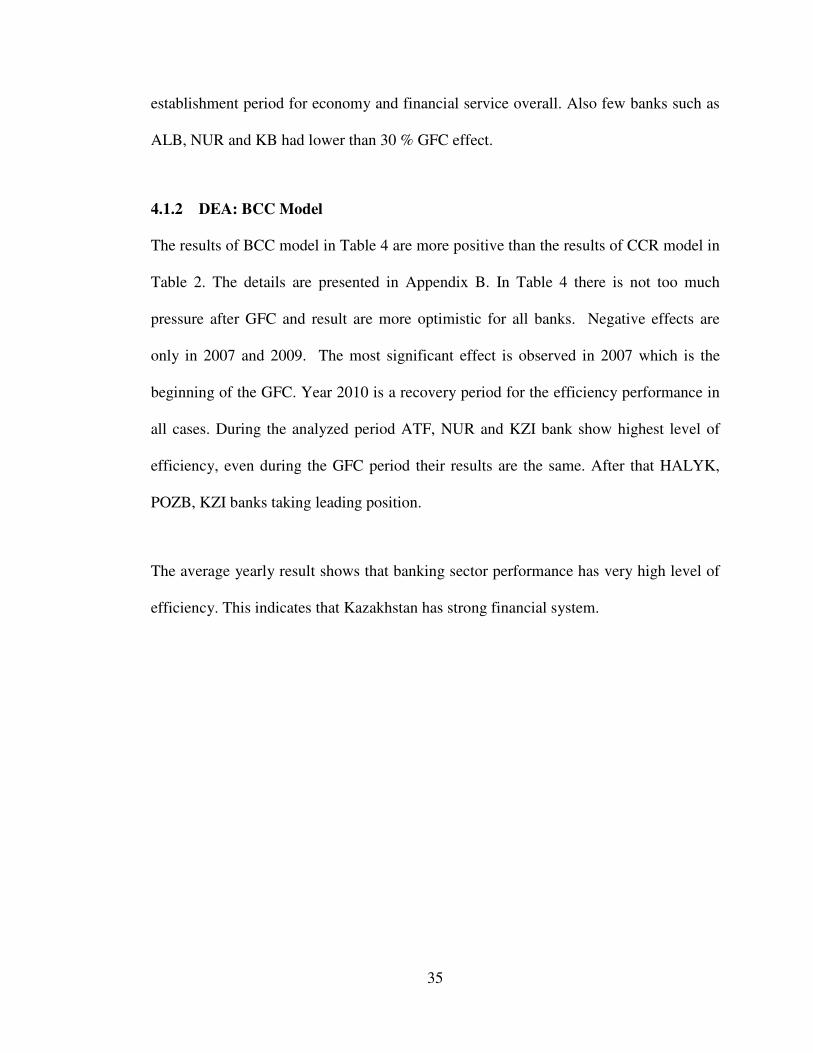
4.1.2 DEA: BCC Model
The results of BCC model in Table 4 are more positive than the results of CCR model in
Table 2. The details are presented in Appendix B. In Table 4 there is not too much
pressure after GFC and result are more optimistic for all banks. Negative effects are
only in 2007 and 2009. The most significant effect is observed in 2007 which is the
beginning of the GFC. Year 2010 is a recovery period for the efficiency performance in
all cases. During the analyzed period ATF, NUR and KZI bank show highest level of
efficiency, even during the GFC period their results are the same. After that HALYK,
POZB, KZI banks taking leading position.
The average yearly result shows that banking sector performance has very high level of
efficiency. This indicates that Kazakhstan has strong financial system.
36
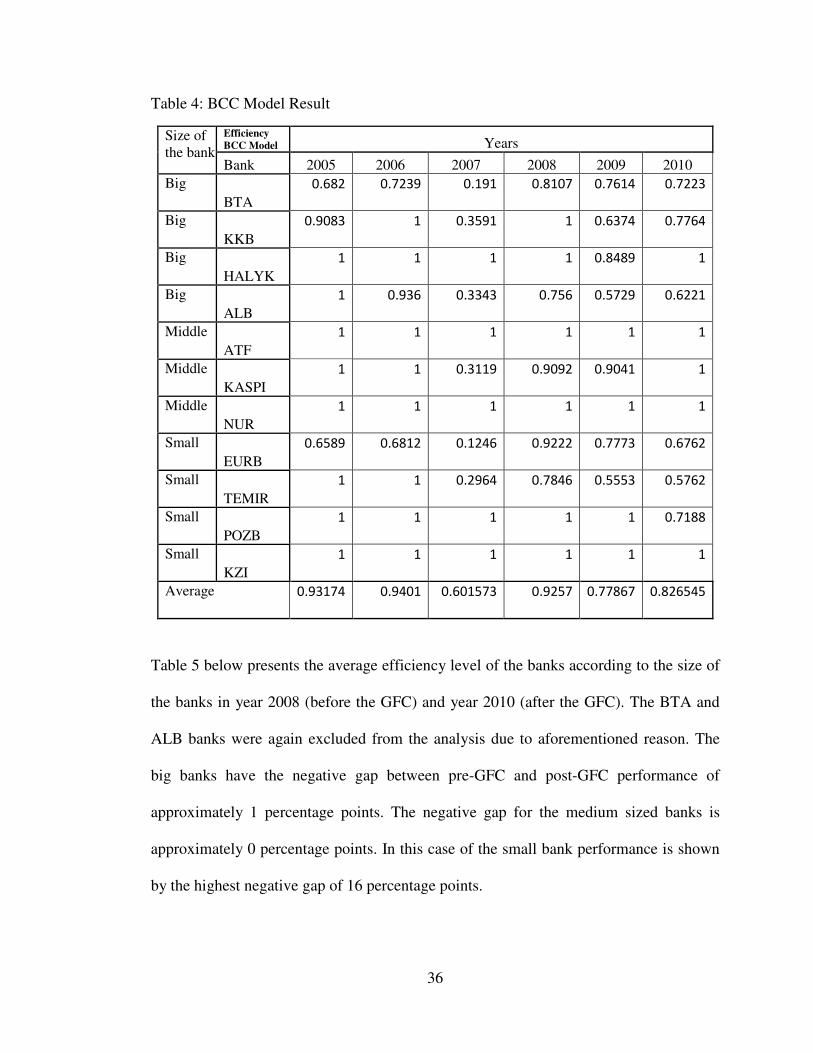
Table 4: BCC Model Result
Size of the bank
Efficiency BCC Model Years
Bank 2005 2006 2007 2008 2009 2010 Big
BTA 0.682 0.7239 0.191 0.8107 0.7614 0.7223
Big KKB
0.9083 1 0.3591 1 0.6374 0.7764
Big HALYK
1 1 1 1 0.8489 1
Big ALB
1 0.936 0.3343 0.756 0.5729 0.6221
Middle ATF
1 1 1 1 1 1
Middle KASPI
1 1 0.3119 0.9092 0.9041 1
Middle NUR
1 1 1 1 1 1
Small EURB
0.6589 0.6812 0.1246 0.9222 0.7773 0.6762
Small TEMIR
1 1 0.2964 0.7846 0.5553 0.5762
Small POZB
1 1 1 1 1 0.7188
Small KZI
1 1 1 1 1 1
Average 0.93174 0.9401 0.601573 0.9257 0.77867 0.826545
Table 5 below presents the average efficiency level of the banks according to the size of
the banks in year 2008 (before the GFC) and year 2010 (after the GFC). The BTA and
ALB banks were again excluded from the analysis due to aforementioned reason. The
big banks have the negative gap between pre-GFC and post-GFC performance of
approximately 1 percentage points. The negative gap for the medium sized banks is
approximately 0 percentage points. In this case of the small bank performance is shown
by the highest negative gap of 16 percentage points.

37
Table 5: Comparison of the pre-GFC and post-GFC Banking Performance Using BCC Model
Size of the Bank (1)
Pre-GFC average efficiency
(2)
Post-GFC average efficiency
(3) Big 0.95 0.94
Medium 0.63 0.63
Small 0.88 0.72
In general the middle banks are performing better under the variable returns to scale
assumption as compared to the big and small size banks. Two out of four small banks
did not have any decrease in the efficiency level during the GFC.
Most of the derived results are in range between 0.50 and 1 of efficiency level before
GFC, though the lower bound is 0.12.
Figure 2: BCC Model Result
0
0.1
0.2
0.3
0.4
0.5
0.6
0.7
0.8
0.9
1
2005 2006 2007 2008 2009 2010
ATF
BTA
KASPI
EURB
KKB
HALYK
ALB
NURB
TEMIR
POZB
38
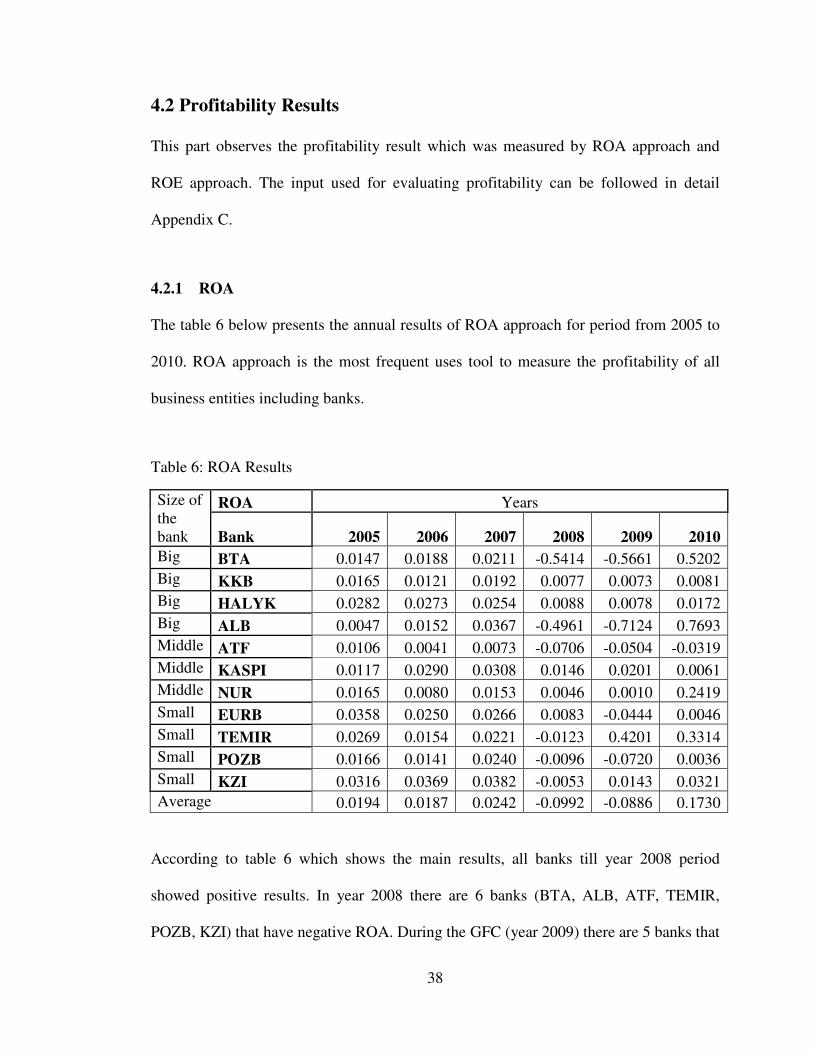
4.2 Profitability Results
This part observes the profitability result which was measured by ROA approach and
ROE approach. The input used for evaluating profitability can be followed in detail
Appendix C.
4.2.1 ROA
The table 6 below presents the annual results of ROA approach for period from 2005 to
2010. ROA approach is the most frequent uses tool to measure the profitability of all
business entities including banks.
Table 6: ROA Results
Size of the bank
ROA Years
Bank 2005 2006 2007 2008 2009 2010 Big BTA 0.0147 0.0188 0.0211 -0.5414 -0.5661 0.5202 Big KKB 0.0165 0.0121 0.0192 0.0077 0.0073 0.0081 Big HALYK 0.0282 0.0273 0.0254 0.0088 0.0078 0.0172 Big ALB 0.0047 0.0152 0.0367 -0.4961 -0.7124 0.7693 Middle ATF 0.0106 0.0041 0.0073 -0.0706 -0.0504 -0.0319 Middle KASPI 0.0117 0.0290 0.0308 0.0146 0.0201 0.0061 Middle NUR 0.0165 0.0080 0.0153 0.0046 0.0010 0.2419 Small EURB 0.0358 0.0250 0.0266 0.0083 -0.0444 0.0046 Small TEMIR 0.0269 0.0154 0.0221 -0.0123 0.4201 0.3314 Small POZB 0.0166 0.0141 0.0240 -0.0096 -0.0720 0.0036 Small KZI 0.0316 0.0369 0.0382 -0.0053 0.0143 0.0321 Average 0.0194 0.0187 0.0242 -0.0992 -0.0886 0.1730
According to table 6 which shows the main results, all banks till year 2008 period
showed positive results. In year 2008 there are 6 banks (BTA, ALB, ATF, TEMIR,
POZB, KZI) that have negative ROA. During the GFC (year 2009) there are 5 banks that

39
have negative ROA. The TEMIR bank managed to increase ROA from -0.0123 to
0.4201, which is actually the highest coefficient for the bank for the period from 2005 to
2010. KZI bank was also able to increase ROA form -0.0053 to 0.0143. However, ROA
of EUBR bank decreased from 0.0083 to -0.0444. In average year 2008 was more
financially stressful for the banks as compared to the year 2009. The average financial
performance in 2008 was -0.0992 as compared to -0.0886 in 2009.
In 2010 only one bank has negative result which is ATF Bank. The main reason of that
is high level of impairment losses, personal expenses and general administrative
expenses. On the Figure 3 shows that the result of average rate of banks performance
were mostly affected by BTA, ALB and ATF banks results. This happened because of
decreasing level of interest income and non-interest indicators resulting on negative
effects in 2008 and 2009. These banks recovered in 2010, partially due to the
government support (in case of BTA and ALB banks). The ATF banks have the same
picture during 2008 and 2009, but recovered slower and in 2010 ROA is still negative.

40
Figure 3: ROA Results
Table 7 below compares the average profitability level of the selected banks for the
period from 2005 to 2010 and for the period from 2005 to 2010, exclusive of year 2009,
according to the size of the banks.
Table 7: ROA by the Size of the Banks
Size of the Bank (1)
ROA (2)
ROA (exclusive of year 2009)
(3) Big -3.04% 2.67%
Medium 1.49% 1.99%
Small 4.10% 3.33%
The results of the analysis revealed that the best financial performance according to the
size of the banks was shown by the small banks in both cases. This, perhaps, can be
explained by the high level of efficiency of the small banks. The average ROA of the big

41
banks for the period from 2005 to 2010 is negative; however, if year 2009 is excluded
from the sample the ROA is positive. This finding reveals that big banks are more
vulnerable to significant level of stress in the financial markets, such as GFC. The
performance of middle size banks is positive in both cases, although the big banks have
better ROA if year 2009 is excluded from the sample.
Another interesting finding is that the efficiency level of all the banks in the sample was
not significantly affected in pre-GFC year (2007), however, the profitability level was
more affected in year 2008 as compared to year 2009. In addition profitability level of
BTA and ALB banks dropped even further in year 2009 compared to year 2008,
although both of the banks received significant financial support from the government.
4.2.2 ROE
Table 8 below presents the annual results of the profitability analysis using ROE
approach for the period from 2005 to 2010. All of the analyzed banks have positive
results during 2005-2007 periods; however, after this period the GFC resulted on
decrease in profitability level for all analyzed banks.
The situation is almost the same in year 2009 except that figures such as additional paid
in capital and shareholder of the parent also became negative. There is a reduction in the
negative coefficients in 2010 showing an improvement in the overall situation. This is
due to the fact that the accumulated deficit, treasures shares and quantity of investment
securities available for sale in reserve went to negative level. The stable ROE result is
show by four banks, HALYK, KKB, KASPI and NUR. Similarly ROA results of the

42
same banks are positive during the GFC does not drop below negative level. Based on
these results, those four banks have shown to have the strongest financial structure and
professional level of management during the GFC.
Table 8: ROE Results
Size of the bank
ROE Year
Bank 2005 2006 2007 2008 2009 2010 Big BTA 0.1688 0.2007 0.1431 -1.5994 -6.5980 -9.4367 Big KKB 0.2244 0.1121 0.1809 0.0642 0.0488 0.0531 Big HALYK 0.2456 0.2251 0.2516 0.0761 0.0565 0.1139 Big ALB 0.0569 0.1750 0.2684 1.6997 -0.5679 -3.1321 Middle ATF 0.1397 0.0750 0.0967 -0.7509 -0.8764 -0.8773 Middle KASPI 0.1110 0.2117 0.2016 0.0886 0.1587 0.0528 Middle NUR 0.1431 0.0662 0.0818 0.0332 0.0072 0.9942 Small EURASION 0.2927 0.2016 0.1286 0.0476 -0.5896 0.0642 Small TEMIR 0.1936 0.1372 0.1530 -0.0818 -1.8834 1.4540 Small POZITIVE 0.0888 0.1229 0.0725 -0.0279 -0.1964 0.0099 Small KZI 0.0608 0.0773 0.1181 -0.0115 0.0276 0.0565
Average 0.1568 0.1459 0.1542 -0.0420 -0.9466 -0.9679
The weakest performance is shown by the BTA bank. ROE coefficients during year
2009 and year 2010 are -6.6 and -9.44, respectively. Such a huge negative ROE in these
two years is explained by both negatives equity, showing huge amounts of borrowing,
and a negative income. The latest, however, partially can be explained by the takeover of
the bank by the government of Kazakhstan. In February 2009 the government of
Kazakhstan within the framework of anti-crisis measures through national fund
“Samruk-Kazina” bought 75.1 percent of the total shares of the bank. In the same
respect share of the bank equity hold by the “Samruk-Kazina” fund increased to 81.48
percent. By the end of 2009 the share of the government “Samruk-Kazina” fond

43
increased to 97.3 percent. The takeover of this giant bank by the government had a
negative impact on the financial performance of the bank. BTA banks depositors were
trying to withdraw maximum possible amount of their savings. Bank had a huge
liquidity problem. Almost the same situation occurred with the ALB bank.
Table 9 below compares the average profitability level of the selected banks for the
period from 2005 to 2010 and for the period from 2005 to 2010 exclusive of year 2009,
according to the size of the banks.
Table 9: ROE by the Size of the Banks
Size of the Bank (1)
ROA (2)
ROA (exclusive of year 2009)
(3) Big -70.71% -49.54%
Medium -0.24% 4.45%
Small 2.15% 15.79%
The best performance in both cases (with and without year 2009) is again shown by the
small banks. Moreover, average ROE of small banks was the only positive number if
year 2009 was included in the sample. If year 2009 is excluded from the sample the
profitability performance of the small banks is three times above the average ROE of the
middle size banks 15.79 percent compared to 4.45 percent.
The average ROA of the big banks for the period from 2005 to 2010 is a quite high
negative number in both cases. This finding again confirms that big banks are more
vulnerable to significant level of stress in the financial markets. The performance of
44
middle sized banks is negative if year 2009 is included to the sample and equal to -0.24
percent. However, if year 2009 is excluded from the sample the ROE becomes positive
at 4.45 percent.
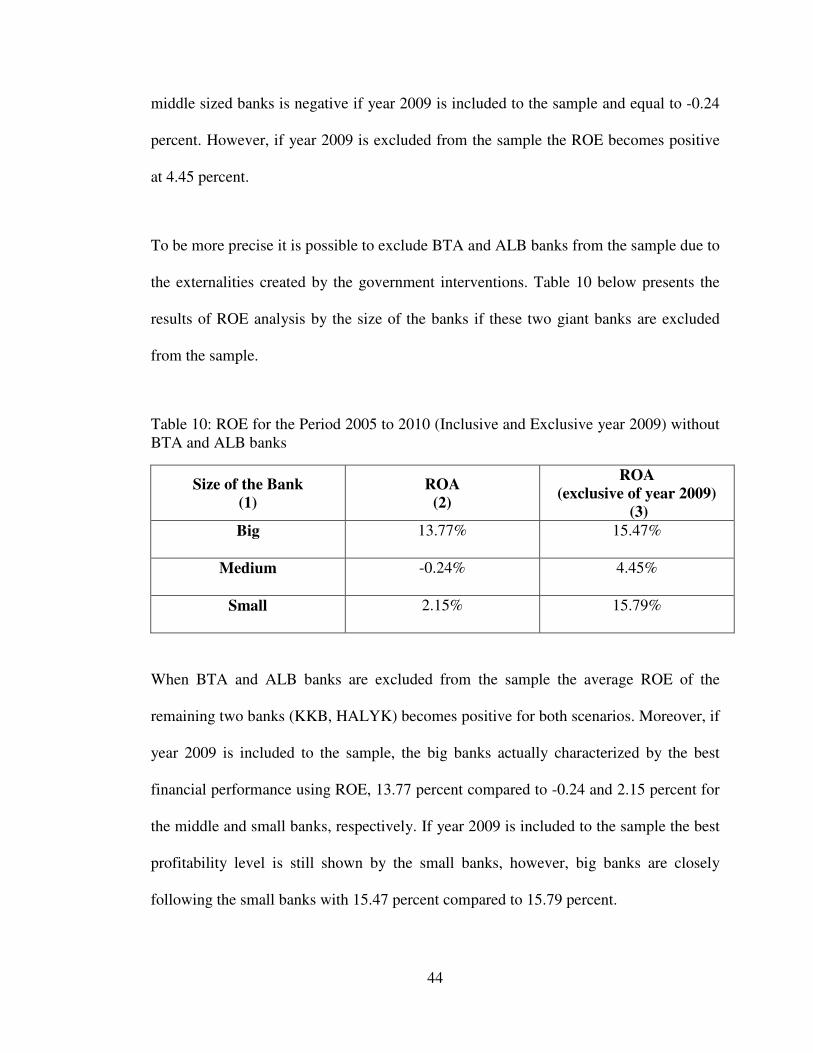
To be more precise it is possible to exclude BTA and ALB banks from the sample due to
the externalities created by the government interventions. Table 10 below presents the
results of ROE analysis by the size of the banks if these two giant banks are excluded
from the sample.
Table 10: ROE for the Period 2005 to 2010 (Inclusive and Exclusive year 2009) without BTA and ALB banks
Size of the Bank (1)
ROA (2)
ROA (exclusive of year 2009)
(3) Big 13.77% 15.47%
Medium -0.24% 4.45%
Small 2.15% 15.79%
When BTA and ALB banks are excluded from the sample the average ROE of the
remaining two banks (KKB, HALYK) becomes positive for both scenarios. Moreover, if
year 2009 is included to the sample, the big banks actually characterized by the best
financial performance using ROE, 13.77 percent compared to -0.24 and 2.15 percent for
the middle and small banks, respectively. If year 2009 is included to the sample the best
profitability level is still shown by the small banks, however, big banks are closely
following the small banks with 15.47 percent compared to 15.79 percent.

45
In general the exclusion of the BTA and ALB banks allows excluding negative impact
of the government interventions from the sample and obtaining more solid figures. If
this is done the most vulnerable to the financial stress (such as GFC) section of the
banking sector is middle size banks. This conclusion is also confirmed by the ROA
method of profitability estimation.
4.3 Profitability vs. Efficiency
In this part of Chapter 4 two performance measurement approaches, profitability and
efficiency will be evaluated together and compared with each other. Also, as was
mentioned before, the government influence may result in some outstanding variables
involved into the analysis that should be removed to be more precise. Therefore, two
samples of the data will be observed in this part; the results of the analysis with the full
data sample and the results without BTA and ALB banks.
Table 11 shows average annual result of ROA, ROE, BCC and CCR methods that were
used to derive the results of this study. Table 5 includes full sample of the banks.
Table 11: Comparison of the Average Annual Results
2005 2006 2007 2008 2009 2010 ROA 0,019494 0,018762 0,024285 -0,09922 -0,0886 0,173017 ROE 0,156888 0,145947 0,154253 -0,04201 -0,94662 -0,96793
Efficiency BCC Model 0.931745 0.9401 0.601573 0.842702 0.778673 0.826545 Efficiency
CCR Model 0.531655 0.618855 0.278227 0.179718 0.634209 0.718127

46
The Figure 4 demonstrates the pattern of the average results of ROA, ROE, BCC and
CCR model for the historical data sample. The ROA and CCR coefficients have the
same historical trend. ROE and BCC coefficient are the outstanding variable as it can be
seen from the diagram, however, the movement of ROE coefficient may be explained by
the behavior of the BTA and ALB banks. Through nationalization of two giant banks by
government intervention may result in a significant change in the balance of the
financial system of Kazakhstan. The movement of BCC can be explained by the fact that
BCC method is more sensitive to the crisis effect in 2007 when was the first wave of
GFC.
Figure 4: Comparison of Average Results
Table 12 presents average annual results of ROA, ROE, BCC and CCR Model excluding
BTA and ALB banks. The government intervention had a huge negative effect on ROE
of these two banks through restriction and recapitalization of the banks’ assets in 2009.
-1
-0.5
0
0.5
1
2005 2006 2007 2008 2009 2010
ROA
ROE
efficiency BCC model
efficiency CCR model

47
Table 12: Comparison of Annual Average Results (Excluding BTA and ALB banks)
2005 2006 2007 2008 2009 2010
ROA 0,021655 0,019149 0,023251 -0,00598 0,033773 0,06817
ROE 0,166667 0,13662 0,142795 -0,06249 -0,36077 0,213519 Efficiency BCC Model
0.926766 0.926788 0.5842444 0.909188 0.824433 0.812844
Efficiency CCR Model
0.58036 0.74635 0.61128 0.6681 0.70431 0.7129
The Figure 5 demonstrates the historical trend of these four methods. The analysis
revealed that if BTA and ALB banks are excluded from the analysis the historical trend
of the four coefficients is different and showing that efficiency and profitability again
are independent from each other. Whereas one would expected to see a relationship
between efficiency and profitability are clear.
Figure 5: Comparison of Adjusted Average Results
All four measures have almost a straight line behavior till year 2007 when there is a
negative trend by BCC in year 2007, followed by the recovery in year 2008 and again
-0.5
0
0.5
1
2005 2006 2007 2008 20092010
ROA
ROE
efficiency BCC model
efficiency CCR model

48
falling in 2009. ROA, BCC and CCR model have more stable structure compared to the
ROE coefficient. This finding again confirms that the government intervention and
nationalization of the two major banks had a significant effect on the average
performance of the banking industry in Kazakhstan. It also confirms that exclusion of
such extreme variables, arising due to the externalities evolved in the financial sector of
the country, should be excluded from the analysis to obtain a more reliable and precise
conclusion.

49
Chapter 5
5. CONCLUSION
This study was directed to evaluate efficiency and profitability of Kazakhstan banking
sector performance using sample of eleven banks, including four big banks, three
medium size banks and four small banks. The result of the analysis revealed that the
banking sector can be described by strong financial system with high level of efficiency.
This fact is also supported by the profitability analysis result, which shows quite positive
results even taking into consideration the effect of GFC and the time that was required
by the banks to recover after GFC. The analysis also revealed that GFC had a very
significant effect on the performance of the banking sector particular during year 2009.
The average results of CCR model revealed that the only middle banks are characterized
by the negative gap between pre-GFC and post-GFC performance of approximately 2
percentage points. The small banks have positive gap between pre-GFC and post-GFC
by approximately 1.62 percentage points. The big banks are also close to the small size
banks with a positive gap of only 1 percent.
According to the average results of BCC model, the small banks have the positive gap
between pre-GFC and post-GFC performance of approximately 1.16 percentage points.
The negative gap for the medium sized banks is exactly the same as in the case of CCR
model. However, in this case the best performance is shown by the big banks with only

50
2.5 percentage point of a positive gap. In general the big banks are performing better
under the variable returns to scale assumption as compared to the small and medium size
banks. All banks show results indicating that their efficiency level under BCC
assumption has increased.
The profitability analysis of the banking sector performance using ROA analysis
revealed that the best financial performance according to the size of the banks was
shown by the small banks. Two cases were analyzed by the study. The first case includes
the historical data for the period from 2005 to 2010. The second case includes the same
historical sample with exclusion of year 2009. This was done in an attempt to exclude an
extreme variable that arises due to the effect of the GFC. In both of these cases, small
banks have shown the best financial performance using ROA method. This, perhaps, can
be explained by the high efficiency level of the small banks.
The average ROA of the big banks for the period from 2005 to 2010 is negative;
however, if year 2009 is excluded from the sample the ROA becomes positive. This
finding reveals that big banks are more vulnerable to significant level of stress in the
financial markets, such as GFC.
The performance of middle size banks is positive in both cases, although the big banks
have better ROA if year 2009 is excluded from the sample. The additional interesting
finding is that the efficiency level of all the banks in the sample was not significantly
affected in pre-GFC year (2008); however, the profitability level was more affected in
year 2008 as compared to year 2009.
51
Small banks in both of the scenarios, inclusive and exclusive of year 2009, are again
characterized by the best performance using ROE approach. Moreover, average ROE of
small banks was the only positive number if year 2009 was included in the sample. If
year 2009 is excluded from the sample the profitability performance of the small banks
is three times above the average ROE of the middle size banks being 15.79 percent
compared to 4.45 percent.
The average ROE of the big banks for the period from 2005 to 2010 is quite a high
negative number in both cases. This finding again confirms that big banks are more
vulnerable to significant level of stress in the financial markets. After excluding BTA
and ALB banks ROE averages became positive for both scenarios. This is due to the fact
that the remaining two big banks, KKB and HALYK, had a positive financial
performance during the whole analyzed historical period. The performance of middle
sized banks is negative if year 2009 is included to the sample and equal to -0.24 percent,
however, if year 2009 is excluded from the sample the ROE becomes positive at 4.45
percent.
The overall results of the analysis revealed that the ROA, BCC and CCR coefficients
have the same historical trend. ROE coefficient is the only measure that, deviates from
the other. However, the study also revealed that the movement of ROE coefficient is
significantly affected by the financial performance of BTA and ALB banks. These two
giants in the banking sector of Kazakhstan were nationalized by the government, which
in turn may affect the performance of the banks, particularly during the first years after
nationalization is over. All of the four coefficients have steeper recovery effect

52
compared to the ROE have almost a straight line behavior till year 2008, there is a
negative trend in year 2009, followed by the recovery in year 2010. ROA, BCC and
CCR model have a steeper recovery relative to the ROE coefficient. Also, the fact that
government positive intervention due to GFC and supported banking had positive effect
on the overall efficiency rate, whereas it had negative effect to profitability rating as
total equity of the banks directed to negative numbers. In summary the efficiency and
profitability results of the banking sector performance have not proved to have clear
dependency or correlation between each other for the case of Kazakhstan.

53
REFERENCES
[1] Abbasoglu, Osman Furkan; Ayasan, Ahmet Faruk and Gunes, Ali (2007).
Concentration, competition, efficiency & profitability of the Turkish Banking
Sector in the Post-Crises Period pp. 1-19.
[2] Charnes, W.W. Cooper and E. Rhodes (1979). Palgrave Macmillan. Short
communication: measuring the efficiency of decision making units.
[3] Ana Canhoto & Jean Dermine (2000). Forthcoming Journal of Banking &
Finance. A note on Banking efficiency in Portugal, New vs. Old Banks pp.1-16
[4] Anthony N. Rezitis (2006) Journal of Applied Economics, pp. 119-138
[5] ATSUSHI IIMI. (2003) Pakistan Development Review, 42:1, pp. 41-57.
[6] Dr. Sushil Kumar Mehta, Dr. Hari Govind Mishra & Mr. Amrinder Singh, Asstt.
Professor, (2011). International Conference on Economics and Finance Research
IPEDR vol.4 (2011) IACSIT Press, Singapore
[7] European Journal of Operational Research 98 (1997) 395-407. Efficiency analysis
in banking firms: An international comparison 396-406

54
[8] Grazyna Wozniewska. ISSN 1392-1258. Ekonomika 2008. Methods of measuring
the efficiency of commercial banks: an example of Polish Banks pp. 81-91
[9] Jemric Igor, Vijcic Boris, Dubrovnik, June 2001. Efficiency of Banks in
Transition: A DEA Approach 1-26.
[10] “Interfaces” (May-June 1999), the inform Journal on the practice of Information
research, vol.29, No 3.
[11] Holly S. Lewis, Feature Editor, May 2000. Pensilvania State University. DEA:
Models and Extensions Decision Line.
[12] http://www.banker.kz/index.php/topic/38839-reiting-bankov-kazahstana-po-
dohodnosti-aktiv/ (2011)
[13] http:///www.elsevier.com/locate/econbase (2005) Journal of Banking and Finance
29 (2005) 31-53
[14] http:/// www.eurojournals.com/finance.htm (2010). Efficiencies of Pakistan
Sector: A Corporative Study. International Research Journal of Finance and
Economics. ISSN 1450-2887. Issue 46.
[15] http:///www.jstor.org Journal of the Operational Research Society Vol. 41, No.7,
pp. 591-596.
55
[16] http:///www.rfcaratings.kz (2010) Rating Agency RFCA Ratings.
[17] http:///www.rfcaratings.kz (2011) Rating Agency RFCA Ratings.
[18] http:///www.rfcaratings.kz (2012) Rating Agency RFCA Ratings.
[19] King, R. G., and R. Levine (1993). “Finance and Growth: Schumpeter Might Be
Right”. Quarterly Journal of Economics, 108(3), 717—737.
[20] Mouzas, S (2006) “Efficiency versus Effectiveness in Business Network”. Journal
of Business Research, vol.59: 1124-1132.
[21] Munich Personal RePEc Archive (2011). MPRA paper No: 33560.
[22] N.K. Avkiran. (1999) Journal of Banking and Finance 23 991-1013 (999 p).
[23] Ozkan-Gunay & Tektas: Turkish banking sector efficiency analysis: A DEA
APPROACH p.418-431
[24] Robert King, Ross Levine (1993). Finance, entrepreneurship and growth: Theory
and evidence. Journal of Monetary Economics 1993, vol.32, issue 3, pages 513-
542.
[25] The Pakistan Development Review 42:1 (2003) pp. 41-57

56
[26] Zijang Yang. Proceedings of the International MultiConference of Engineers &
Computer Scientists 2009 Vol II IMECS 2009, Hong Kong. Bank Branch
Operating Efficiency: A DEA Approach

57
APPENDICES
Appendix A: The software report of CCR Model Result for 2005
90.83% BTA BANK Peers: 2
References: 0
Potential Improvements
Variable Actual TargetPotential Improvement
INTEREST EXPENCES 45699000000.00 45699000000.00 0.00 %
INTEREST INCOME 78286000000.00 86192113590.71 10.10 %
NON-INTEREST EXPENCES18894000000.001384524740.81 -92.67 %
NON-INTEREST INCOME5487000000.00 13241919007.74 141.33 %
Peer Contributions
HALYK BANK INTEREST EXPENCES 0.29 %
HALYK BANK INTEREST INCOME 0.38 %
HALYK BANK NON-INTEREST EXPENCES 8.92 %
HALYK BANK NON-INTEREST INCOME 0.21 %
KKB BANK INTEREST EXPENCES 99.71 %
KKB BANK INTEREST INCOME 99.62 %
KKB BANK NON-INTEREST EXPENCES 91.08 %
KKB BANK NON-INTEREST INCOME 99.79 %

58
Input / Output Contributions
INTEREST EXPENCES 100.00 % Input
NON-INTEREST EXPENCES 0.00 % Input
INTEREST INCOME 100.00 % Output
NON-INTEREST INCOME 0.00 % Output
Peers
HALYK BANK
KKB BANK
100.00% HALYK BANK Peers: 0
References: 3
Potential Improvements
Variable Actual TargetPotential Improvement
INTEREST EXPENCES 21155947000.00 21155947000.00 0.00 %
INTEREST INCOME 52384623000.00 52384623000.00 0.00 %
NON-INTEREST EXPENCES19559716000.0019559716000.00 0.00 %
NON-INTEREST INCOME4418850000.00 4418850000.00 0.00 %
Peer Contributions
HALYK BANK INTEREST EXPENCES 100.00 %
HALYK BANK INTEREST INCOME 100.00 %
HALYK BANK NON-INTEREST EXPENCES 100.00 %
HALYK BANK NON-INTEREST INCOME 100.00 %

59
Input / Output Contributions
INTEREST EXPENCES 100.00 % Input
NON-INTEREST EXPENCES 0.00 % Input
INTEREST INCOME 100.00 % Output
NON-INTEREST INCOME 0.00 % Output
Peers
HALYK BANK
100.00% ALB BANK Peers: 0
References: 1
Potential Improvements
Variable Actual TargetPotential Improvement
INTEREST EXPENCES 11604000000.00 11604000000.00 0.00 %
INTEREST INCOME 17858000000.00 17858000000.00 0.00 %
NON-INTEREST EXPENCES4630000000.004630000000.00 0.00 %
NON-INTEREST INCOME10243000000.0010243000000.00 0.00 %
Peer Contributions
ALB BANK INTEREST EXPENCES 100.00 %
ALB BANK INTEREST INCOME 100.00 %
ALB BANK NON-INTEREST EXPENCES 100.00 %
ALB BANK NON-INTEREST INCOME 100.00 %

60
Input / Output Contributions
INTEREST EXPENCES 31.39 % Input
NON-INTEREST EXPENCES 68.61 % Input
INTEREST INCOME 0.00 % Output
NON-INTEREST INCOME 100.00 % Output
Peers
ALB BANK
100.00% KZI BANK Peers: 0
References: 1
Potential Improvements
Variable Actual TargetPotential Improvement
INTEREST EXPENCES 3645000.00 3645000.00 0.00 %
INTEREST INCOME 221338000.00 221338000.00 0.00 %
NON-INTEREST EXPENCES227199000.00 227199000.00 0.00 %
NON-INTEREST INCOME189437000.00 189437000.00 0.00 %
Peer Contributions
KZI BANK INTEREST EXPENCES 100.00 %
KZI BANK INTEREST INCOME 100.00 %
KZI BANK NON-INTEREST EXPENCES 100.00 %
KZI BANK NON-INTEREST INCOME 100.00 %
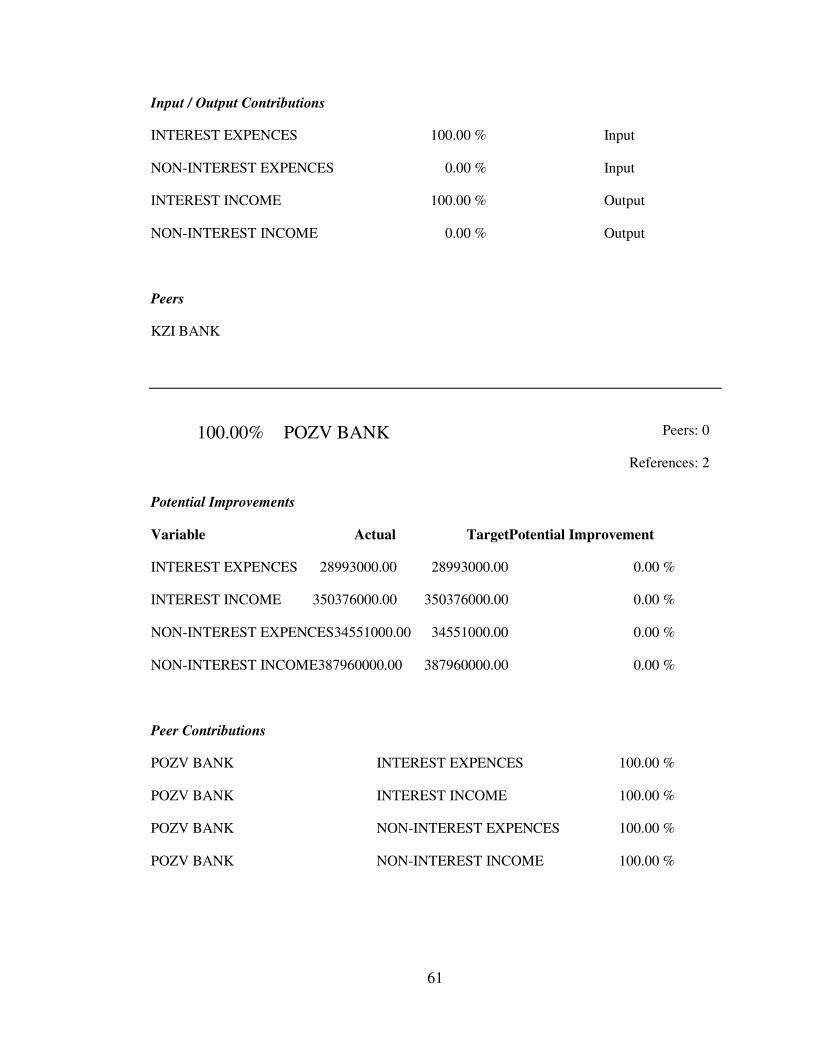
61
Input / Output Contributions
INTEREST EXPENCES 100.00 % Input
NON-INTEREST EXPENCES 0.00 % Input
INTEREST INCOME 100.00 % Output
NON-INTEREST INCOME 0.00 % Output
Peers
KZI BANK
100.00% POZV BANK Peers: 0
References: 2
Potential Improvements
Variable Actual TargetPotential Improvement
INTEREST EXPENCES 28993000.00 28993000.00 0.00 %
INTEREST INCOME 350376000.00 350376000.00 0.00 %
NON-INTEREST EXPENCES34551000.00 34551000.00 0.00 %
NON-INTEREST INCOME387960000.00 387960000.00 0.00 %
Peer Contributions
POZV BANK INTEREST EXPENCES 100.00 %
POZV BANK INTEREST INCOME 100.00 %
POZV BANK NON-INTEREST EXPENCES 100.00 %
POZV BANK NON-INTEREST INCOME 100.00 %

62
Input / Output Contributions
INTEREST EXPENCES 0.00 % Input
NON-INTEREST EXPENCES 100.00 % Input
INTEREST INCOME 0.00 % Output
NON-INTEREST INCOME 100.00 % Output
Peers
POZV BANK
100.00% TEMIR BANK Peers: 0
References: 1
Potential Improvements
Variable Actual TargetPotential Improvement
INTEREST EXPENCES 3929952000.00 3929952000.00 0.00 %
INTEREST INCOME 6127998000.00 6127998000.00 0.00 %
NON-INTEREST EXPENCES106572000.00 106572000.00 0.00 %
NON-INTEREST INCOME3982974000.00 3982974000.00 0.00 %
Peer Contributions
TEMIR BANK INTEREST EXPENCES 100.00 %
TEMIR BANK INTEREST INCOME 100.00 %
TEMIR BANK NON-INTEREST EXPENCES 100.00 %
TEMIR BANK NON-INTEREST INCOME 100.00 %

63
Input / Output Contributions
INTEREST EXPENCES 0.00 % Input
NON-INTEREST EXPENCES 100.00 % Input
INTEREST INCOME 100.00 % Output
NON-INTEREST INCOME 0.00 % Output
Peers
TEMIR BANK
65.89% NUR BANK Peers: 3
References: 0
Potential Improvements
Variable Actual TargetPotential Improvement
INTEREST EXPENCES 6284040000.00 6284040000.00 0.00 %
INTEREST INCOME 10443871000.00 15849878573.14 51.76 %
NON-INTEREST EXPENCES4681668000.004681668000.00 0.00 %
NON-INTEREST INCOME1914037000.00 3370215371.72 76.08 %
Peer Contributions
KASPI BANK INTEREST EXPENCES 74.67 %
KASPI BANK INTEREST INCOME 80.71 %
KASPI BANK NON-INTEREST EXPENCES 98.92 %
KASPI BANK NON-INTEREST INCOME 84.08 %
KKB BANK INTEREST EXPENCES 25.24 %
KKB BANK INTEREST INCOME 18.86 %

64
KKB BANK NON-INTEREST EXPENCES 0.94 %
KKB BANK NON-INTEREST INCOME 13.65 %
POZV BANK INTEREST EXPENCES 0.09 %
POZV BANK INTEREST INCOME 0.44 %
POZV BANK NON-INTEREST EXPENCES 0.15 %
POZV BANK NON-INTEREST INCOME 2.28 %
Input / Output Contributions
INTEREST EXPENCES 74.82 % Input
NON-INTEREST EXPENCES 25.18 % Input
INTEREST INCOME 100.00 % Output
NON-INTEREST INCOME 0.00 % Output
Peers
KASPI BANK
KKB BANK
POZV BANK
100.00% KKB BANK Peers: 0
References: 4
Potential Improvements
Variable Actual TargetPotential Improvement
INTEREST EXPENCES 45855000000.00 45855000000.00 0.00 %
INTEREST INCOME 86407000000.00 86407000000.00 0.00 %
NON-INTEREST EXPENCES1269000000.001269000000.00 0.00 %

65
NON-INTEREST INCOME13298000000.0013298000000.00 0.00 %
Peer Contributions
KKB BANK INTEREST EXPENCES 100.00 %
KKB BANK INTEREST INCOME 100.00 %
KKB BANK NON-INTEREST EXPENCES 100.00 %
KKB BANK NON-INTEREST INCOME 100.00 %
Input / Output Contributions
INTEREST EXPENCES 93.91 % Input
NON-INTEREST EXPENCES 6.09 % Input
INTEREST INCOME 100.00 % Output
NON-INTEREST INCOME 0.00 % Output
Peers
KKB BANK
100.00% EURB BANK Peers: 0
References: 1
Potential Improvements
Variable Actual TargetPotential Improvement
INTEREST EXPENCES 2585731000.00 2585731000.00 0.00 %
INTEREST INCOME 6877091000.00 6877091000.00 0.00 %
NON-INTEREST EXPENCES2881614000.002881614000.00 0.00 %
NON-INTEREST INCOME2920447000.00 2920447000.00 0.00 %

66
Peer Contributions
EURB BANK INTEREST EXPENCES 100.00 %
EURB BANK INTEREST INCOME 100.00 %
EURB BANK NON-INTEREST EXPENCES 100.00 %
EURB BANK NON-INTEREST INCOME 100.00 %
Input / Output Contributions
INTEREST EXPENCES 98.71 % Input
NON-INTEREST EXPENCES 1.29 % Input
INTEREST INCOME 0.00 % Output
NON-INTEREST INCOME 100.00 % Output
Peers
EURB BANK
68.20% ATF BANK Peers: 3
References: 0
Potential Improvements
Variable Actual TargetPotential Improvement
INTEREST EXPENCES 16137346000.00 16137346000.00 0.00 %
INTEREST INCOME 24421411000.00 35808420229.50 46.63 %
NON-INTEREST EXPENCES7384165000.007384165000.00 0.00 %
NON-INTEREST INCOME2888186000.00 5629766849.01 94.92 %

67
Peer Contributions
HALYK BANK INTEREST EXPENCES 21.84 %
HALYK BANK INTEREST INCOME 24.37 %
HALYK BANK NON-INTEREST EXPENCES 44.12 %
HALYK BANK NON-INTEREST INCOME 13.07 %
KASPI BANK INTEREST EXPENCES 24.40 %
KASPI BANK INTEREST INCOME 29.98 %
KASPI BANK NON-INTEREST EXPENCES 52.62 %
KASPI BANK NON-INTEREST INCOME 42.23 %
KKB BANK INTEREST EXPENCES 53.76 %
KKB BANK INTEREST INCOME 45.66 %
KKB BANK NON-INTEREST EXPENCES 3.25 %
KKB BANK NON-INTEREST INCOME 44.69 %
Input / Output Contributions
INTEREST EXPENCES 86.79 % Input
NON-INTEREST EXPENCES 13.21 % Input
INTEREST INCOME 100.00 % Output
NON-INTEREST INCOME 0.00 % Output
Peers
HALYK BANK
KASPI BANK
KKB BANK

68
100.00% KASPI BANK Peers: 0
References: 3
Potential Improvements
Variable Actual TargetPotential Improvement
INTEREST EXPENCES 6111666000.00 6111666000.00 0.00 %
INTEREST INCOME 16661546000.00 16661546000.00 0.00 %
NON-INTEREST EXPENCES6031854000.006031854000.00 0.00 %
NON-INTEREST INCOME3690745000.00 3690745000.00 0.00 %
Peer Contributions
KASPI BANK INTEREST EXPENCES 100.00 %
KASPI BANK INTEREST INCOME 100.00 %
KASPI BANK NON-INTEREST EXPENCES 100.00 %
KASPI BANK NON-INTEREST INCOME 100.00 %
Input / Output Contributions
INTEREST EXPENCES 100.00 % Input
NON-INTEREST EXPENCES 0.00 % Input
INTEREST INCOME 94.01 % Output
NON-INTEREST INCOME 5.99 % Output

69
Peers
KASPI BANK
Appendix B: The software report of BCC Model Result for 2005
32.54% BTA BANK Peers: 2
References: 0
Potential Improvements
Variable Actual TargetPotential Improvement
INTEREST EXPENCES 45699000000.00 45699000000.00 0.00 %
INTEREST INCOME 78286000000.00 240600631121.52 207.34 %
NON-INTEREST EXPENCES18894000000.0018894000000.00 0.00 %
NON-INTEREST INCOME5487000000.00211519775260.00 3754.93 %
Peer Contributions
KKB BANK INTEREST EXPENCES 66.86 %
KKB BANK INTEREST INCOME 23.93 %
KKB BANK NON-INTEREST EXPENCES 4.48 %
KKB BANK NON-INTEREST INCOME 4.19 %
POZV BANK INTEREST EXPENCES 33.14 %
POZV BANK INTEREST INCOME 76.07 %
POZV BANK NON-INTEREST EXPENCES 95.52 %
POZV BANK NON-INTEREST INCOME 95.81 %

70
Input / Output Contributions
INTEREST EXPENCES 31.18 % Input
NON-INTEREST EXPENCES 68.82 % Input
INTEREST INCOME 100.00 % Output
NON-INTEREST INCOME 0.00 % Output
Peers
KKB BANK
POZV BANK
25.41% HALYK BANK Peers: 2
References: 0
Potential Improvements
Variable Actual TargetPotential Improvement
INTEREST EXPENCES 21155947000.00 21155947000.00 0.00 %
INTEREST INCOME 52384623000.00 206138581768.73 293.51 %
NON-INTEREST EXPENCES19559716000.0019559716000.00 0.00 %
NON-INTEREST INCOME4418850000.00219527879574.52 4867.99 %
Peer Contributions
KKB BANK INTEREST EXPENCES 22.95 %
KKB BANK INTEREST INCOME 4.44 %
KKB BANK NON-INTEREST EXPENCES 0.69 %
KKB BANK NON-INTEREST INCOME 0.64 %
POZV BANK INTEREST EXPENCES 77.05 %
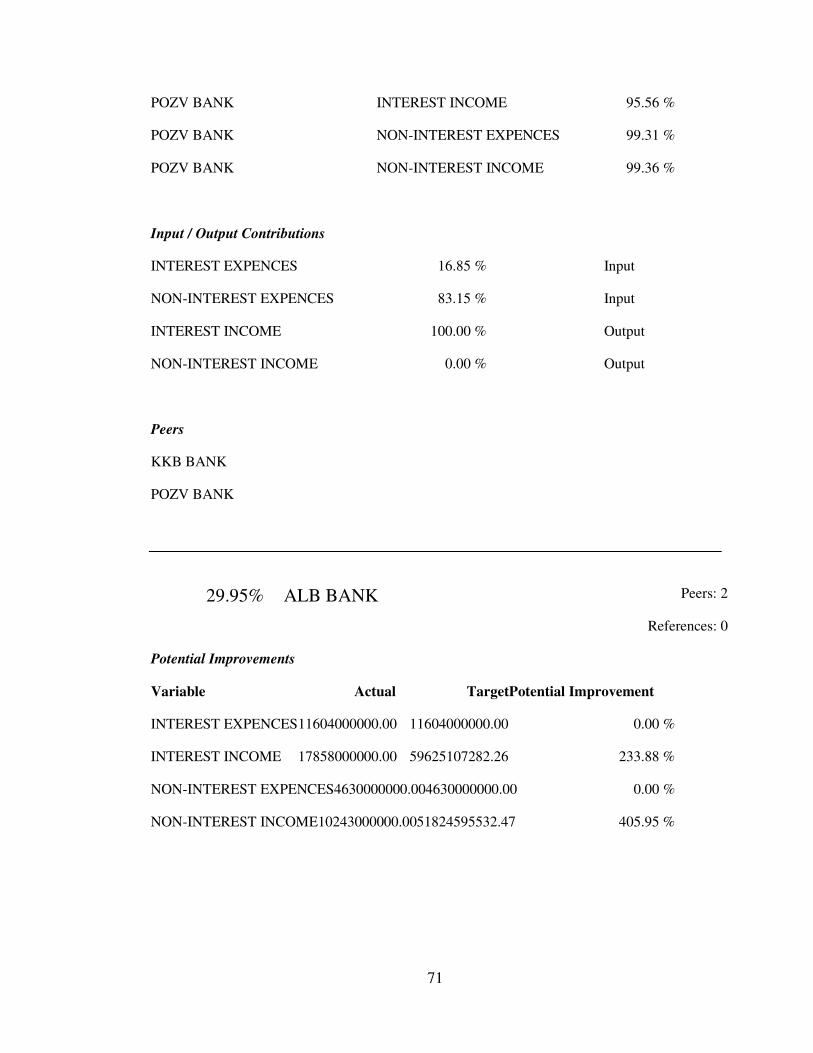
71
POZV BANK INTEREST INCOME 95.56 %
POZV BANK NON-INTEREST EXPENCES 99.31 %
POZV BANK NON-INTEREST INCOME 99.36 %
Input / Output Contributions
INTEREST EXPENCES 16.85 % Input
NON-INTEREST EXPENCES 83.15 % Input
INTEREST INCOME 100.00 % Output
NON-INTEREST INCOME 0.00 % Output
Peers
KKB BANK
POZV BANK
29.95% ALB BANK Peers: 2
References: 0
Potential Improvements
Variable Actual TargetPotential Improvement
INTEREST EXPENCES 11604000000.00 11604000000.00 0.00 %
INTEREST INCOME 17858000000.00 59625107282.26 233.88 %
NON-INTEREST EXPENCES4630000000.004630000000.00 0.00 %
NON-INTEREST INCOME10243000000.0051824595532.47 405.95 %

72
Peer Contributions
KKB BANK INTEREST EXPENCES 68.10 %
KKB BANK INTEREST INCOME 24.97 %
KKB BANK NON-INTEREST EXPENCES 4.72 %
KKB BANK NON-INTEREST INCOME 4.42 %
POZV BANK INTEREST EXPENCES 31.90 %
POZV BANK INTEREST INCOME 75.03 %
POZV BANK NON-INTEREST EXPENCES 95.28 %
POZV BANK NON-INTEREST INCOME 95.58 %
Input / Output Contributions
INTEREST EXPENCES 31.95 % Input
NON-INTEREST EXPENCES 68.05 % Input
INTEREST INCOME 100.00 % Output
NON-INTEREST INCOME 0.00 % Output
Peers
KKB BANK
POZV BANK
100.00% KZI BANK Peers: 0
References: 1
Potential Improvements
Variable Actual TargetPotential Improvement
INTEREST EXPENCES 3645000.00 3645000.00 0.00 %

73
INTEREST INCOME 221338000.00 221338000.00 0.00 %
NON-INTEREST EXPENCES227199000.00 227199000.00 0.00 %
NON-INTEREST INCOME189437000.00 189437000.00 0.00 %
Peer Contributions
KZI BANK INTEREST EXPENCES 100.00 %
KZI BANK INTEREST INCOME 100.00 %
KZI BANK NON-INTEREST EXPENCES 100.00 %
KZI BANK NON-INTEREST INCOME 100.00 %
Input / Output Contributions
INTEREST EXPENCES 100.00 % Input
NON-INTEREST EXPENCES 0.00 % Input
INTEREST INCOME 100.00 % Output
NON-INTEREST INCOME 0.00 % Output
Peers
KZI BANK
100.00% POZV BANK Peers: 0
References: 8
Potential Improvements
Variable Actual TargetPotential Improvement
INTEREST EXPENCES 28993000.00 28993000.00 0.00 %
INTEREST INCOME 350376000.00 350376000.00 0.00 %

74
NON-INTEREST EXPENCES34551000.00 34551000.00 0.00 %
NON-INTEREST INCOME387960000.00 387960000.00 0.00 %
Peer Contributions
POZV BANK INTEREST EXPENCES 100.00 %
POZV BANK INTEREST INCOME 100.00 %
POZV BANK NON-INTEREST EXPENCES 100.00 %
POZV BANK NON-INTEREST INCOME 100.00 %
Input / Output Contributions
INTEREST EXPENCES 13.59 % Input
NON-INTEREST EXPENCES 86.41 % Input
INTEREST INCOME 100.00 % Output
NON-INTEREST INCOME 0.00 % Output
Peers
POZV BANK
100.00% TEMIR BANK Peers: 0
References: 1
Potential Improvements
Variable Actual TargetPotential Improvement
INTEREST EXPENCES 3929952000.00 3929952000.00 0.00 %
INTEREST INCOME 6127998000.00 6127998000.00 0.00 %
NON-INTEREST EXPENCES106572000.00 106572000.00 0.00 %
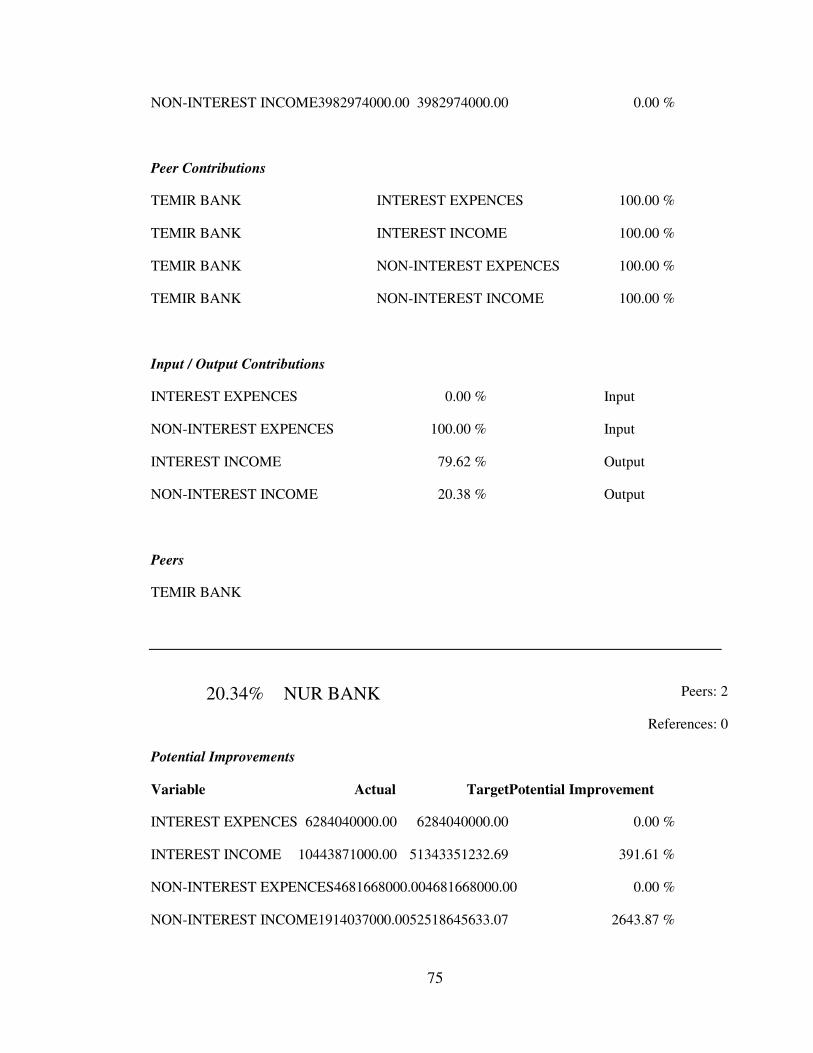
75
NON-INTEREST INCOME3982974000.00 3982974000.00 0.00 %
Peer Contributions
TEMIR BANK INTEREST EXPENCES 100.00 %
TEMIR BANK INTEREST INCOME 100.00 %
TEMIR BANK NON-INTEREST EXPENCES 100.00 %
TEMIR BANK NON-INTEREST INCOME 100.00 %
Input / Output Contributions
INTEREST EXPENCES 0.00 % Input
NON-INTEREST EXPENCES 100.00 % Input
INTEREST INCOME 79.62 % Output
NON-INTEREST INCOME 20.38 % Output
Peers
TEMIR BANK
20.34% NUR BANK Peers: 2
References: 0
Potential Improvements
Variable Actual TargetPotential Improvement
INTEREST EXPENCES 6284040000.00 6284040000.00 0.00 %
INTEREST INCOME 10443871000.00 51343351232.69 391.61 %
NON-INTEREST EXPENCES4681668000.004681668000.00 0.00 %
NON-INTEREST INCOME1914037000.00 52518645633.07 2643.87 %
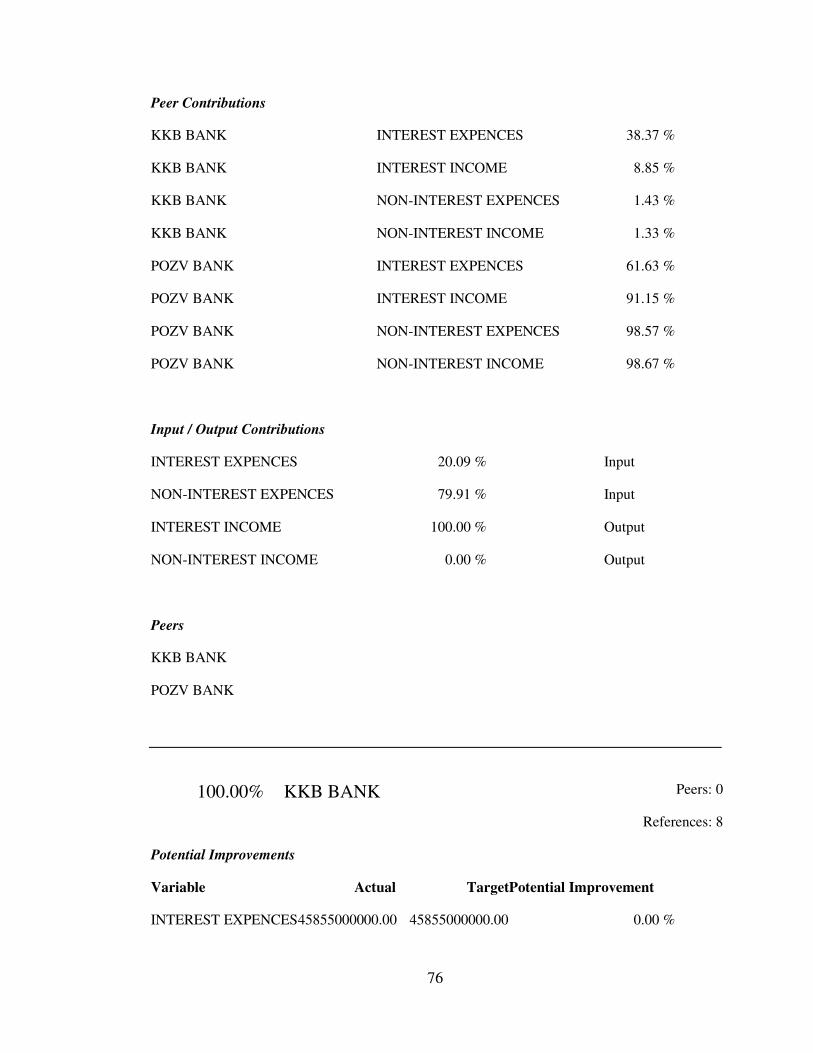
76
Peer Contributions
KKB BANK INTEREST EXPENCES 38.37 %
KKB BANK INTEREST INCOME 8.85 %
KKB BANK NON-INTEREST EXPENCES 1.43 %
KKB BANK NON-INTEREST INCOME 1.33 %
POZV BANK INTEREST EXPENCES 61.63 %
POZV BANK INTEREST INCOME 91.15 %
POZV BANK NON-INTEREST EXPENCES 98.57 %
POZV BANK NON-INTEREST INCOME 98.67 %
Input / Output Contributions
INTEREST EXPENCES 20.09 % Input
NON-INTEREST EXPENCES 79.91 % Input
INTEREST INCOME 100.00 % Output
NON-INTEREST INCOME 0.00 % Output
Peers
KKB BANK
POZV BANK
100.00% KKB BANK Peers: 0
References: 8
Potential Improvements
Variable Actual TargetPotential Improvement
INTEREST EXPENCES 45855000000.00 45855000000.00 0.00 %

77
INTEREST INCOME 86407000000.00 86407000000.00 0.00 %
NON-INTEREST EXPENCES1269000000.001269000000.00 0.00 %
NON-INTEREST INCOME13298000000.0013298000000.00 0.00 %
Peer Contributions
KKB BANK INTEREST EXPENCES 100.00 %
KKB BANK INTEREST INCOME 100.00 %
KKB BANK NON-INTEREST EXPENCES 100.00 %
KKB BANK NON-INTEREST INCOME 100.00 %
Input / Output Contributions
INTEREST EXPENCES 87.13 % Input
NON-INTEREST EXPENCES 12.87 % Input
INTEREST INCOME 100.00 % Output
NON-INTEREST INCOME 0.00 % Output
Peers
KKB BANK
23.31% EURB BANK Peers: 2
References: 0
Potential Improvements
Variable Actual TargetPotential Improvement
INTEREST EXPENCES 2585731000.00 2585731000.00 0.00 %
INTEREST INCOME 6877091000.00 29497250473.17 328.92 %

78
NON-INTEREST EXPENCES2881614000.002881614000.00 0.00 %
NON-INTEREST INCOME2920447000.00 32352984116.26 1007.81 %
Peer Contributions
KKB BANK INTEREST EXPENCES 6.64 %
KKB BANK INTEREST INCOME 1.10 %
KKB BANK NON-INTEREST EXPENCES 0.16 %
KKB BANK NON-INTEREST INCOME 0.15 %
POZV BANK INTEREST EXPENCES 93.36 %
POZV BANK INTEREST INCOME 98.90 %
POZV BANK NON-INTEREST EXPENCES 99.84 %
POZV BANK NON-INTEREST INCOME 99.85 %
Input / Output Contributions
INTEREST EXPENCES 14.39 % Input
NON-INTEREST EXPENCES 85.61 % Input
INTEREST INCOME 100.00 % Output
NON-INTEREST INCOME 0.00 % Output
Peers
KKB BANK
POZV BANK
26.78% ATF BANK Peers: 2
References: 0

79
Potential Improvements
Variable Actual TargetPotential Improvement
INTEREST EXPENCES 16137346000.00 16137346000.00 0.00 %
INTEREST INCOME 24421411000.00 91203182638.92 273.46 %
NON-INTEREST EXPENCES7384165000.007384165000.00 0.00 %
NON-INTEREST INCOME2888186000.00 82702874887.90 2763.49 %
Peer Contributions
KKB BANK INTEREST EXPENCES 63.07 %
KKB BANK INTEREST INCOME 21.03 %
KKB BANK NON-INTEREST EXPENCES 3.81 %
KKB BANK NON-INTEREST INCOME 3.57 %
POZV BANK INTEREST EXPENCES 36.93 %
POZV BANK INTEREST INCOME 78.97 %
POZV BANK NON-INTEREST EXPENCES 96.19 %
POZV BANK NON-INTEREST INCOME 96.43 %
Input / Output Contributions
INTEREST EXPENCES 29.05 % Input
NON-INTEREST EXPENCES 70.95 % Input
INTEREST INCOME 100.00 % Output
NON-INTEREST INCOME 0.00 % Output
Peers
KKB BANK
POZV BANK

80
26.49% KASPI BANK Peers: 2
References: 0
Potential Improvements
Variable Actual TargetPotential Improvement
INTEREST EXPENCES 6111666000.00 6111666000.00 0.00 %
INTEREST INCOME 16661546000.00 62892164729.93 277.47 %
NON-INTEREST EXPENCES6031854000.006031854000.00 0.00 %
NON-INTEREST INCOME3690745000.00 67707088579.03 1734.51 %
Peer Contributions
KKB BANK INTEREST EXPENCES 17.59 %
KKB BANK INTEREST INCOME 3.22 %
KKB BANK NON-INTEREST EXPENCES 0.49 %
KKB BANK NON-INTEREST INCOME 0.46 %
POZV BANK INTEREST EXPENCES 82.41 %
POZV BANK INTEREST INCOME 96.78 %
POZV BANK NON-INTEREST EXPENCES 99.51 %
POZV BANK NON-INTEREST INCOME 99.54 %
Input / Output Contributions
INTEREST EXPENCES 15.95 % Input
NON-INTEREST EXPENCES 84.05 % Input
INTEREST INCOME 100.00 % Output
NON-INTEREST INCOME 0.00 % Output
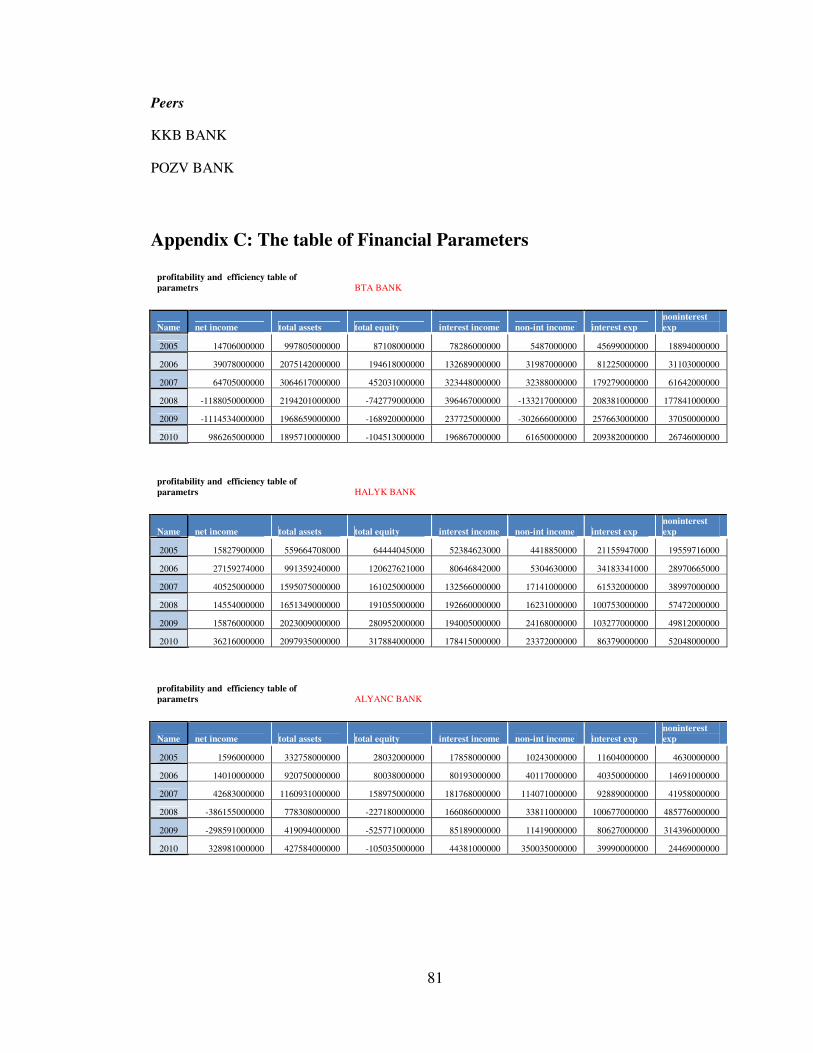
81
Peers
KKB BANK
POZV BANK
Appendix C: The table of Financial Parameters
profitability and efficiency table of parametrs BTA BANK
Name net income total assets total equity interest income non-int income interest exp noninterest exp
2005 14706000000 997805000000 87108000000 78286000000 5487000000 45699000000 18894000000
2006 39078000000 2075142000000 194618000000 132689000000 31987000000 81225000000 31103000000
2007 64705000000 3064617000000 452031000000 323448000000 32388000000 179279000000 61642000000
2008 -1188050000000 2194201000000 -742779000000 396467000000 -133217000000 208381000000 177841000000
2009 -1114534000000 1968659000000 -168920000000 237725000000 -302666000000 257663000000 37050000000
2010 986265000000 1895710000000 -104513000000 196867000000 61650000000 209382000000 26746000000
profitability and efficiency table of parametrs HALYK BANK
Name net income total assets total equity interest income non-int income interest exp noninterest exp
2005 15827900000 559664708000 64444045000 52384623000 4418850000 21155947000 19559716000
2006 27159274000 991359240000 120627621000 80646842000 5304630000 34183341000 28970665000
2007 40525000000 1595075000000 161025000000 132566000000 17141000000 61532000000 38997000000
2008 14554000000 1651349000000 191055000000 192660000000 16231000000 100753000000 57472000000
2009 15876000000 2023009000000 280952000000 194005000000 24168000000 103277000000 49812000000
2010 36216000000 2097935000000 317884000000 178415000000 23372000000 86379000000 52048000000
profitability and efficiency table of parametrs ALYANC BANK
Name net income total assets total equity interest income non-int income interest exp noninterest exp
2005 1596000000 332758000000 28032000000 17858000000 10243000000 11604000000 4630000000
2006 14010000000 920750000000 80038000000 80193000000 40117000000 40350000000 14691000000
2007 42683000000 1160931000000 158975000000 181768000000 114071000000 92889000000 41958000000
2008 -386155000000 778308000000 -227180000000 166086000000 33811000000 100677000000 485776000000
2009 -298591000000 419094000000 -525771000000 85189000000 11419000000 80627000000 314396000000
2010 328981000000 427584000000 -105035000000 44381000000 350035000000 39990000000 24469000000

82
profitability and efficiency table of parametrs KZI BANK
Name net income total assets total equity interest income non-int income interest exp noninterest exp
2005 140435000 4438015000 2306907000 221338000 189437000 3645000 227199000
2006 201672000 5458766000 2606869000 336270000 257128000 6950000 299870000
2007 349284000 9126161000 2956153000 560992000 350257000 15608000 9970000
2008 -33689000 6266885000 2922464000 641266000 366716000 29305000 10078000
2009 156669000 10955549000 5657881000 608366000 334729000 58717000 577036000
2010 361341000 11248930000 6384187000 590318000 451534000 9101000 618113000
profitability and efficiency table of parametrs Bank Positiv
Name net income total assets total equity interest income non-int income interest exp noninterest exp
2005 118505000 7102939000 1334434000 350376000 387960000 28993000 34551000
2006 186993000 13236741000 1520921000 675538000 1252979000 125400000 36640000
2007 351665000 14641572000 4848679000 896385000 1222048000 124027000 1588680000
2008 -131958000 13716126000 4717555000 1373250000 921662000 921662000 2212133000
2009 -922303000 12799052000 4695252000 1037886000 666771000 173640000 2646287000
2010 56720000 15364714000 5701972000 572867000 831927000 146454000 1185191000
profitability and efficiency table of parametrs Temir Bank
Name net income total assets total equity interest income non-int income interest exp noninterest exp
2005 2045591000 75945363000 10565342000 6127998000 3982974000 3929952000 106572000
2006 3071810000 198362162000 22375577000 14977283000 3600504000 8235308000 91203000
2007 7391176000 333783003000 48295655000 44328070000 6576769000 23226489000 11158194000
2008 -3653479000 294933908000 44642176000 41095263000 5288570000 27113447000 12777702000
2009 95173172000 226505811000 -50530996000 35026054000 -20422600000 30129117000 9289980000
2010 80862935000 243998561000 55612645000 27977437000 659109000 24119785000 8769649000
profitability and efficiency table of parametrs NURBANK
Name net income total assets total equity interest income non-int income interest exp noninterest exp
2005 2009099000 121482387000 14039573000 10443871000 1914037000 6284040000 4681668000
2006 1624983000 202685358000 24540541000 15037716000 3722502000 9336153000 5363599000
2007 3042057000 198694564000 37150146000 23434285000 784704000 13434908000 6355838000
2008 1392362000 298758566000 41905513000 26752961000 3696544000 16277397000 8718761000
2009 314256000 297079155000 43117967000 34218602000 3991452000 20926890000 9552613000
2010 69234306000 286103398000 69636406000 27085030000 -547681000 19175841000 13408123000

83
profitability and efficiency table of parametrs KAZKOMMERTSBANK
Name net income total assets total equity interest income non-int income interest exp noninterest exp
2005 19815000000 1194869000000 88271000000 86407000000 13298000000 45855000000 1269000000 2006 29586000000 2444302000000 263926000000 147250000000 27295000000 83115000000 1672000000 2007 57751000000 2997232000000 319219000000 3164580000000 15029000000 171762000000 19177000000 2008 20164000000 2614805000000 313862000000 380777000000 36890000000 181265000000 34735000000 2009 19023000000 2587873000000 389588000000 372939000000 78462000000 179737000000 19592000000 2010 21988000000 2688108000000 413746000000 291515000000 30316000000 152091000000 9726000000
profitability and efficiency table of parametrs
EURASIAN BANK
Name net income total assets total equity interest income non-int income interest exp noninterest exp
2005 3797986000 105862273000 12975558000 6877091000 2920447000 2585731000 2881614000 2006 3818147000 152320926000 18930480000 10416198000 3495299000 4733927000 4629117000 2007 5603329000 210612230000 43556401000 18047157000 3844137000 10440658000 9261677000 2008 2373320000 285726876000 49858784000 19375947000 3344440000 12378309000 11024974000 2009 -14286168000 321280617000 24230234000 24784533000 4709931000 20562033000 25524634000 2010 1662642000 355551849000 25892876000 28391885000 6491358000 22545268000 10750190000
profitability and efficiency table of parametrs CASPIAN BANK
Name net income total assets total equity interest income non-int income interest exp noninterest exp
2005 1777662000 151524878000 16004122000 16661546000 3690745000 6111666000 6031854000 2006 5786498000 198886959000 27325092000 29342153000 4215733000 11771116000 991492000 2007 8313603000 269246980000 41238202000 36003099000 6284166000 14635297000 1780092000 2008 3916494000 267071409000 44178002000 37804742000 7687118000 18734148000 3001078000 2009 6281656000 311135306000 39581227000 39394888000 9455352000 24517785000 4392581000 2010 2215993000 361776315000 41899568000 51451790000 7168438000 26669870000 1566183000
profitability and efficiency table of parametrs ATF BANK
Name net income total assets total equity interest income non-int income interest exp noninterest exp
2005 3815548000 359172089000 27303878000 24421411000 2888186000 16137346000 7384165000 2006 4295410000 1047338196000 57225161000 52523712000 2778397000 34883093000 10985724000 2007 7244026000 984654421000 74900464000 103734083000 9645838000 72308447000 20288377000 2008 -72012026000 1019577514000 95892749000 116625129000 14607612000 75068035000 22601070000 2009 -53045393000 1051560940000 60520453000 117751359000 20919338000 74339719000 125028483000 2010 -30926553000 968604195000 35251475000 86156261000 15471345000 57966077000 75572919000