Embed Size (px)
Citation preview

CS109A Introduction to Data SciencePavlos Protopapas, Natesh Pillai
Evaluating Significance of Predictors Hypothesis Testing
CS109A, PROTOPAPAS, PILLAI
Outline
Part A and B: Assessing the Accuracy of the Coefficient Estimates
Bootstrapping and confidence intervals
Part C: How well do we know !𝒇
The confidence intervals of #𝑓
Part D: Evaluating Significance of Predictors
Does the outcome depend on the predictors?
Hypothesis testing
1
CS109A, PROTOPAPAS, PILLAI
How reliable are the model interpretation
Suppose our model for advertising is: 𝑦 = 1.01𝑥 + 120
Where y is the sales in $1000, x is the TV budget.
Interpretation: for every dollar invested in advertising gets you 1.01 back in sales, which is 1% net increase.
But how certain are we in our estimation of the coefficient 1.01?
Now you know how certain you are in your estimates, will you want to change your answer?
2
CS109A, PROTOPAPAS, PILLAI
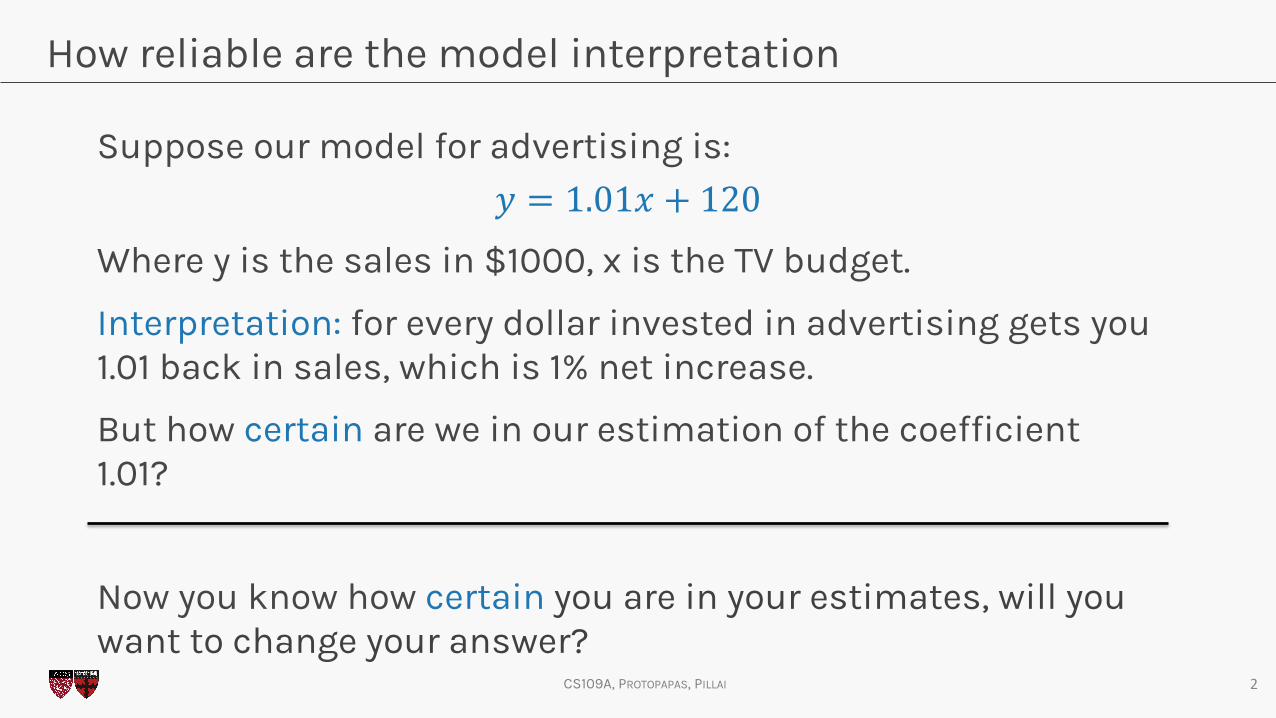
Feature importance
3
Now we know how to generate these distributions we are ready to answer two important questions:
A. Which predictors are most important?B. And which of them really affects the outcome?
𝜇!! = 0.03𝜎!!=0.13
𝜇!! = 0.033𝜎!!=0.01
𝜇!! = 0.23𝜎!!=0.25
CS109A, PROTOPAPAS, PILLAI
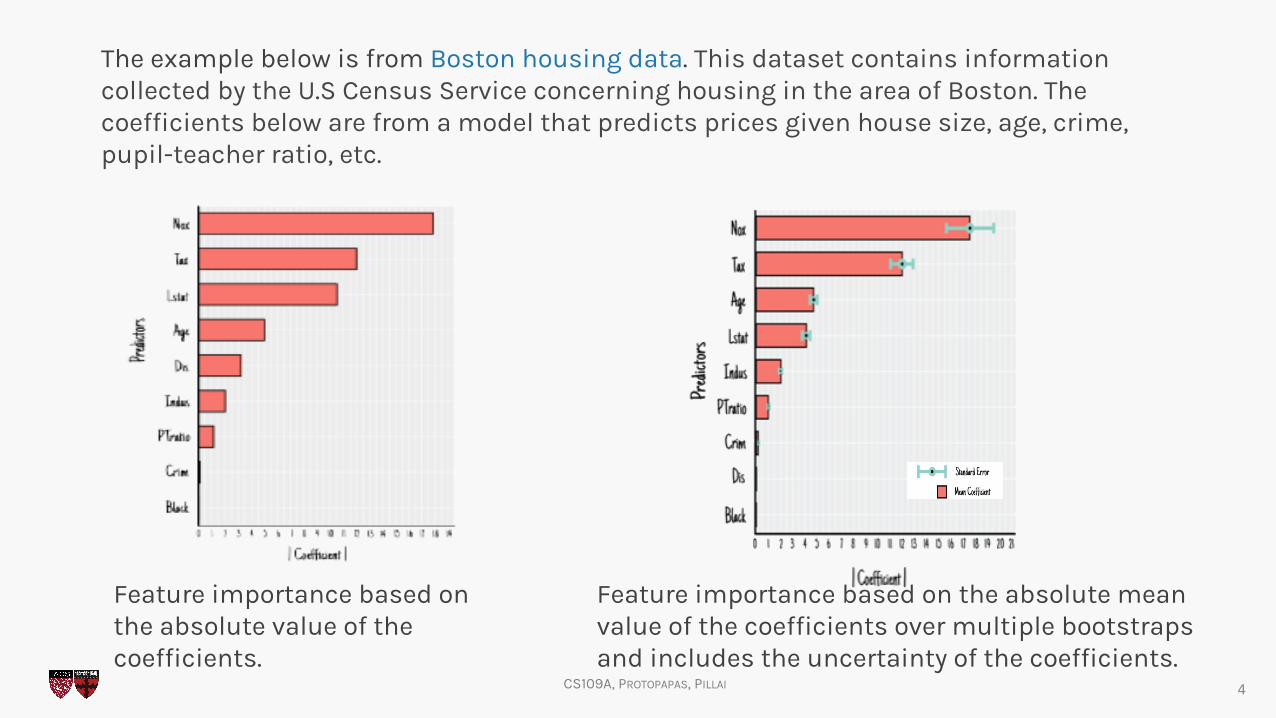
The example below is from Boston housing data. This dataset contains information collected by the U.S Census Service concerning housing in the area of Boston. The coefficients below are from a model that predicts prices given house size, age, crime, pupil-teacher ratio, etc.
4
Feature importance based on the absolute value of the coefficients.
Feature importance based on the absolute mean value of the coefficients over multiple bootstraps and includes the uncertainty of the coefficients.
CS109A, PROTOPAPAS, PILLAI 5
CS109A, PROTOPAPAS, PILLAI
Feature Importance
6
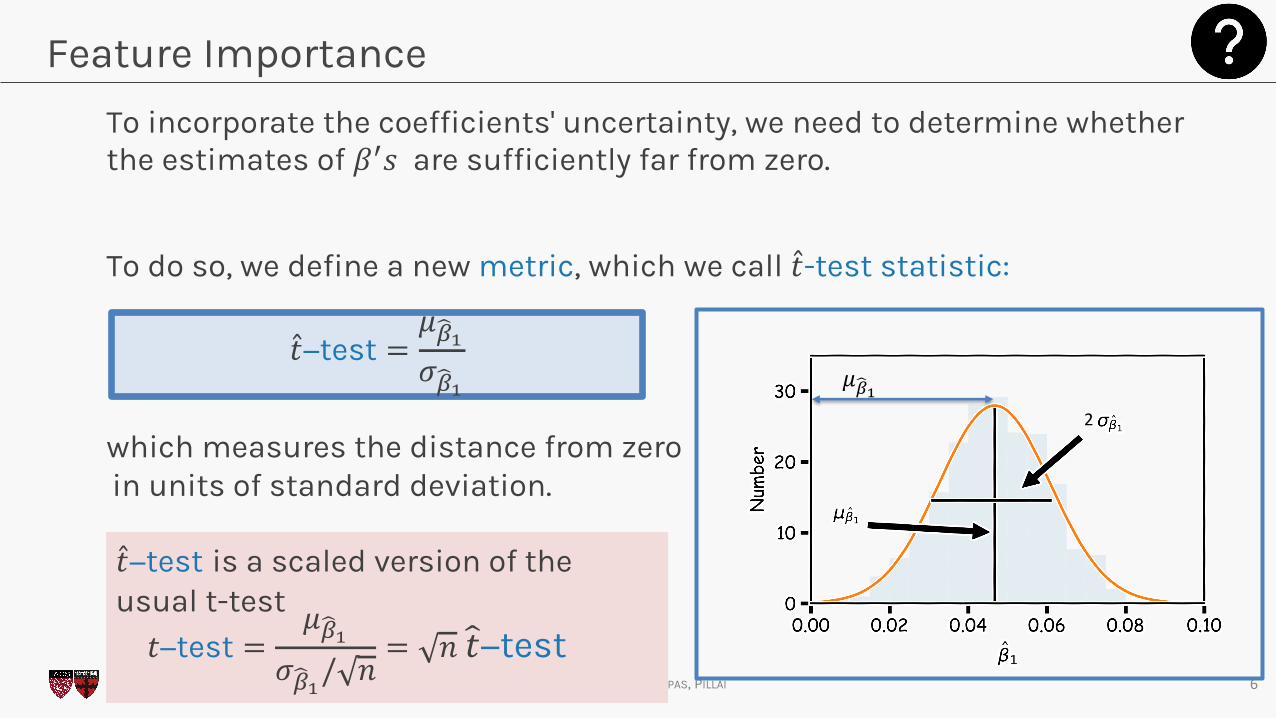
To incorporate the coefficients' uncertainty, we need to determine whether the estimates of 𝛽(𝑠 are sufficiently far from zero.
To do so, we define a new metric, which we call �̂�-test statistic:
which measures the distance from zeroin units of standard deviation.
�̂�−test =𝜇)*!𝜎)*! 𝜇"!!
2
�̂�−test is a scaled version of the usual t-test𝑡−test =
𝜇)*!𝜎)*!/ 𝑛
= 𝑛 )𝑡−test
CS109A, PROTOPAPAS, PILLAI 7
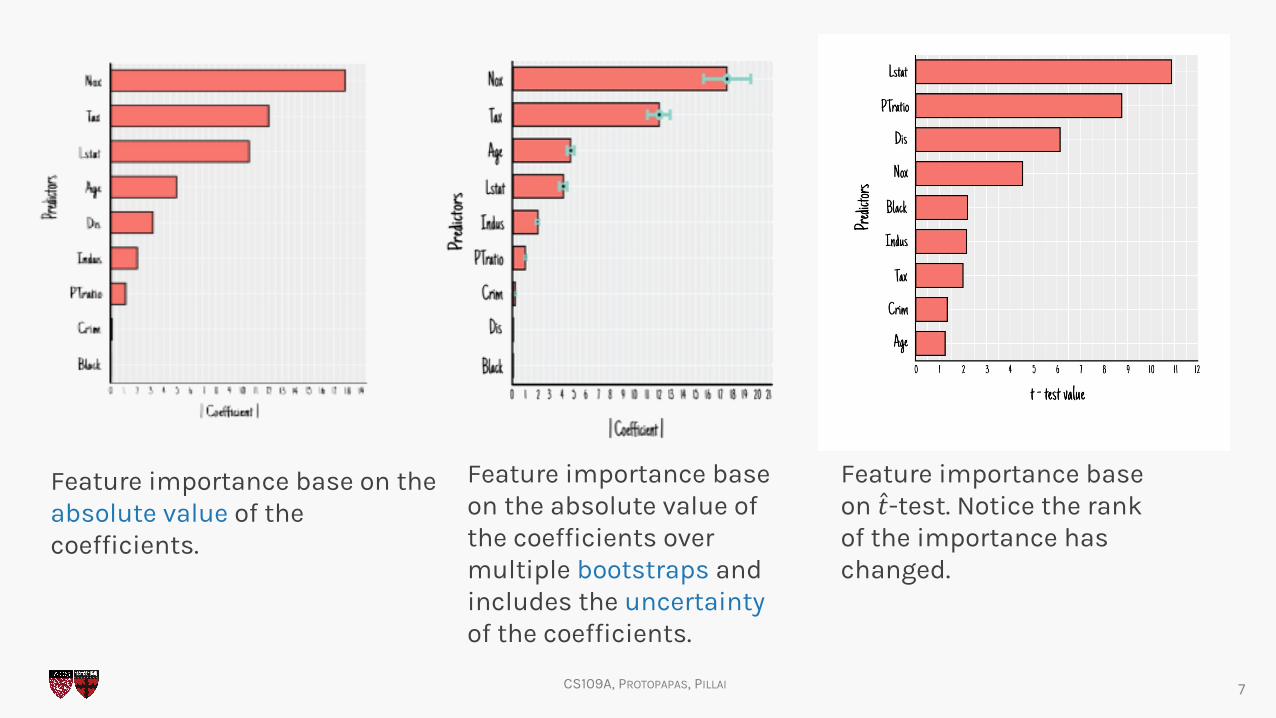
Feature importance base on the absolute value of the coefficients.
Feature importance base on the absolute value of the coefficients over multiple bootstraps and includes the uncertaintyof the coefficients.
Feature importance base on �̂�-test. Notice the rank of the importance has changed.
CS109A, PROTOPAPAS, PILLAI
Feature Importance
Because a predictor is ranked as the most important, it does not necessarily mean that the outcome depends on that predictor.
How do we assess if there is a true relationship between outcome and predictors?
As with R-squared, we should compare its significance (�̂�-test) to the equivalent measure from a dataset where we know that there is no relationship between predictors and outcome.
We are sure that there will be no such relationship in data that are randomly generated. Therefore, we want to compare the �̂�-test of the predictors from our model with �̂�-test values calculated using randomdata.
8
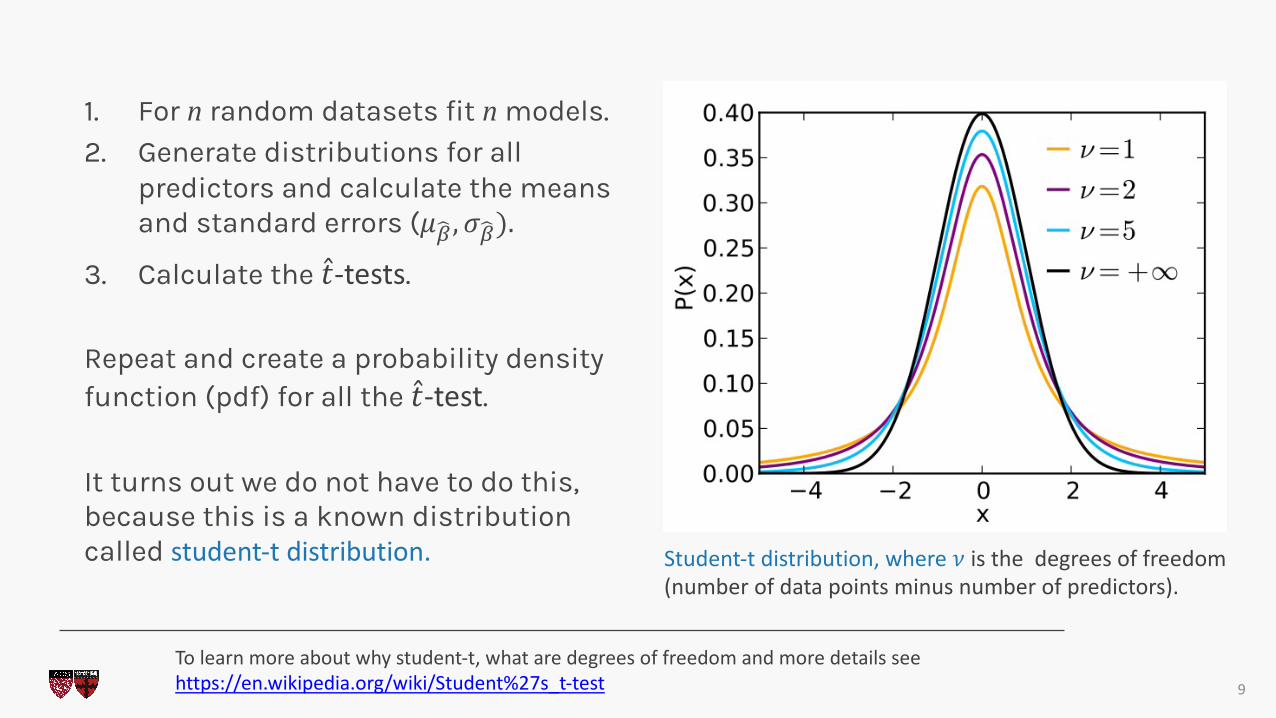
1. For n random datasets fit n models.2. Generate distributions for all
predictors and calculate the means and standard errors (𝜇!" , 𝜎!").
3. Calculate the �̂�-tests.
Repeat and create a probability density function (pdf) for all the �̂�-test.
It turns out we do not have to do this, because this is a known distribution called student-t distribution.
9
Student-t distribution, where 𝜈 is the degrees of freedom (number of data points minus number of predictors).
To learn more about why student-t, what are degrees of freedom and more details seehttps://en.wikipedia.org/wiki/Student%27s_t-test
CS109A, PROTOPAPAS, PILLAI
P-value
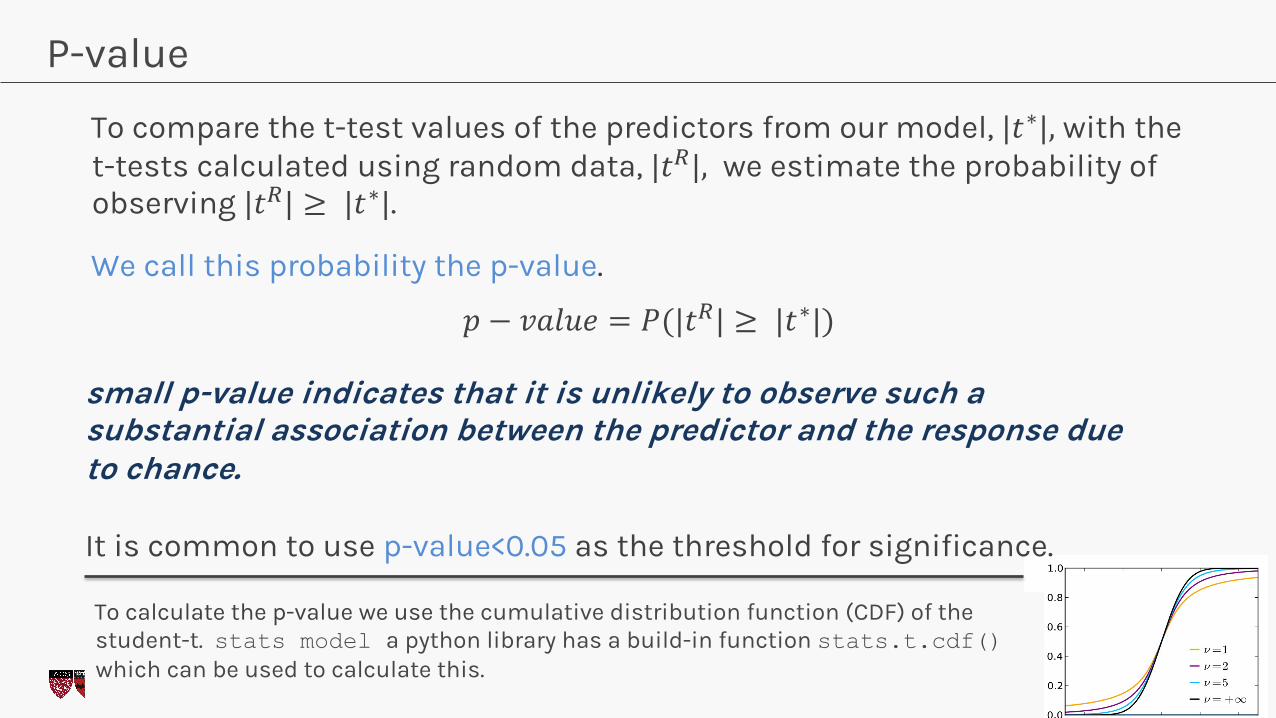
To compare the t-test values of the predictors from our model, |𝑡∗|, with the t-tests calculated using random data, |𝑡-|, we estimate the probability of observing |𝑡-| ≥ |𝑡∗|.
We call this probability the p-value.
𝑝 − 𝑣𝑎𝑙𝑢𝑒 = 𝑃(|𝑡-| ≥ |𝑡∗|)
10
small p-value indicates that it is unlikely to observe such a substantial association between the predictor and the response due to chance.
It is common to use p-value<0.05 as the threshold for significance.
To calculate the p-value we use the cumulative distribution function (CDF) of the student-t. stats model a python library has a build-in function stats.t.cdf() which can be used to calculate this.
CS109A, PROTOPAPAS, PILLAI 11
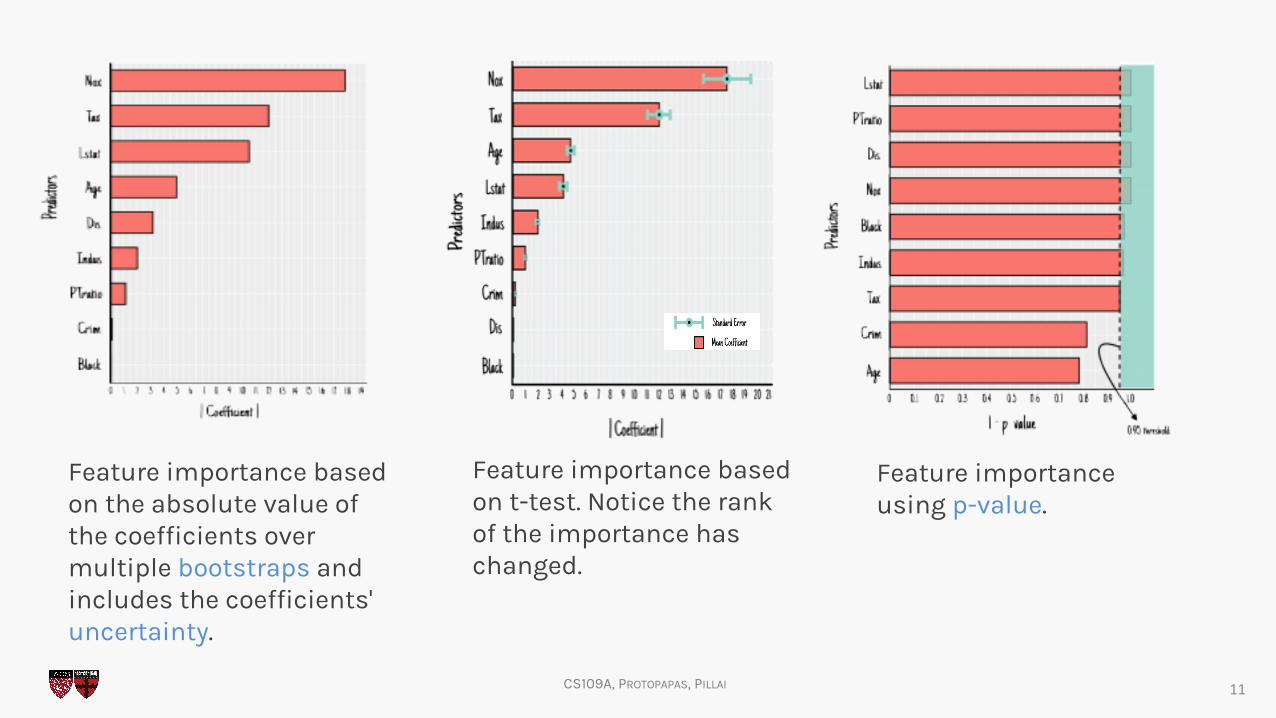
Feature importance based on the absolute value of the coefficients over multiple bootstraps and includes the coefficients' uncertainty.
Feature importance based on t-test. Notice the rank of the importance has changed.
Feature importance using p-value.
CS109A, PROTOPAPAS, PILLAI
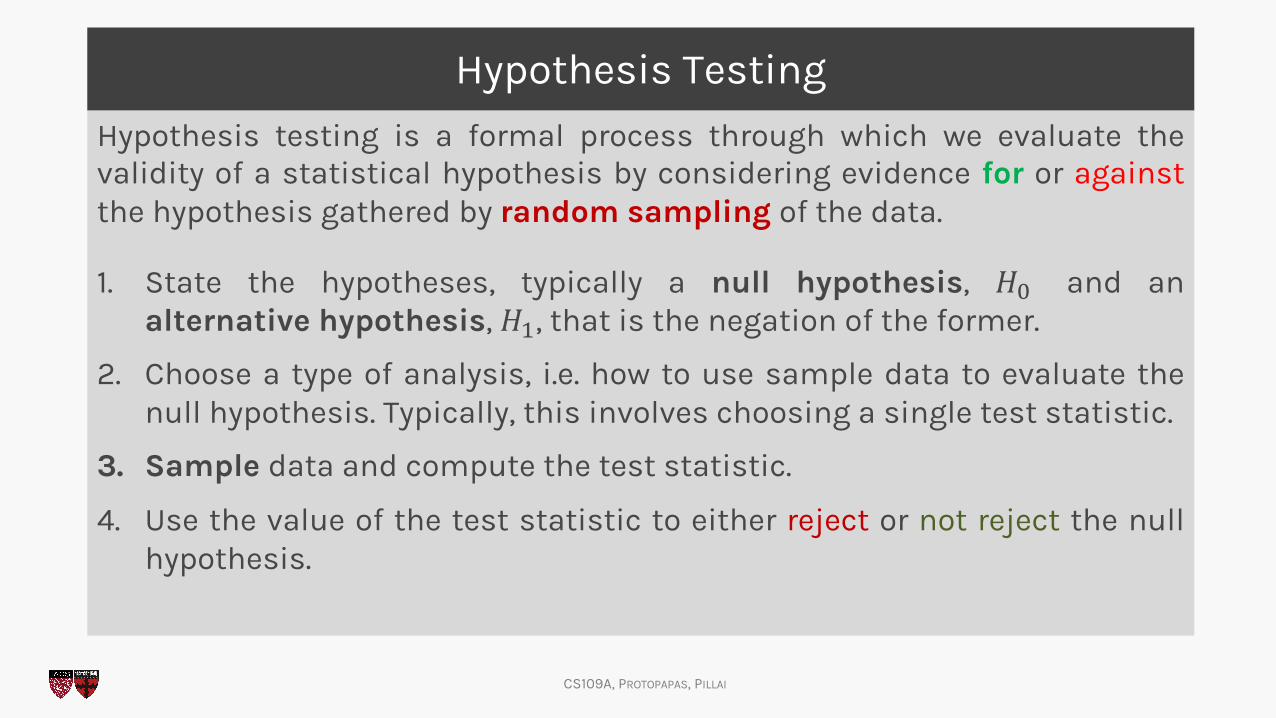
Hypothesis TestingHypothesis testing is a formal process through which we evaluate thevalidity of a statistical hypothesis by considering evidence for or againstthe hypothesis gathered by random sampling of the data.
1. State the hypotheses, typically a null hypothesis, 𝐻. and analternative hypothesis, 𝐻/, that is the negation of the former.
2. Choose a type of analysis, i.e. how to use sample data to evaluate thenull hypothesis. Typically, this involves choosing a single test statistic.
3. Sample data and compute the test statistic.
4. Use the value of the test statistic to either reject or not reject the nullhypothesis.
CS109A, PROTOPAPAS, PILLAI
Hypothesis testing
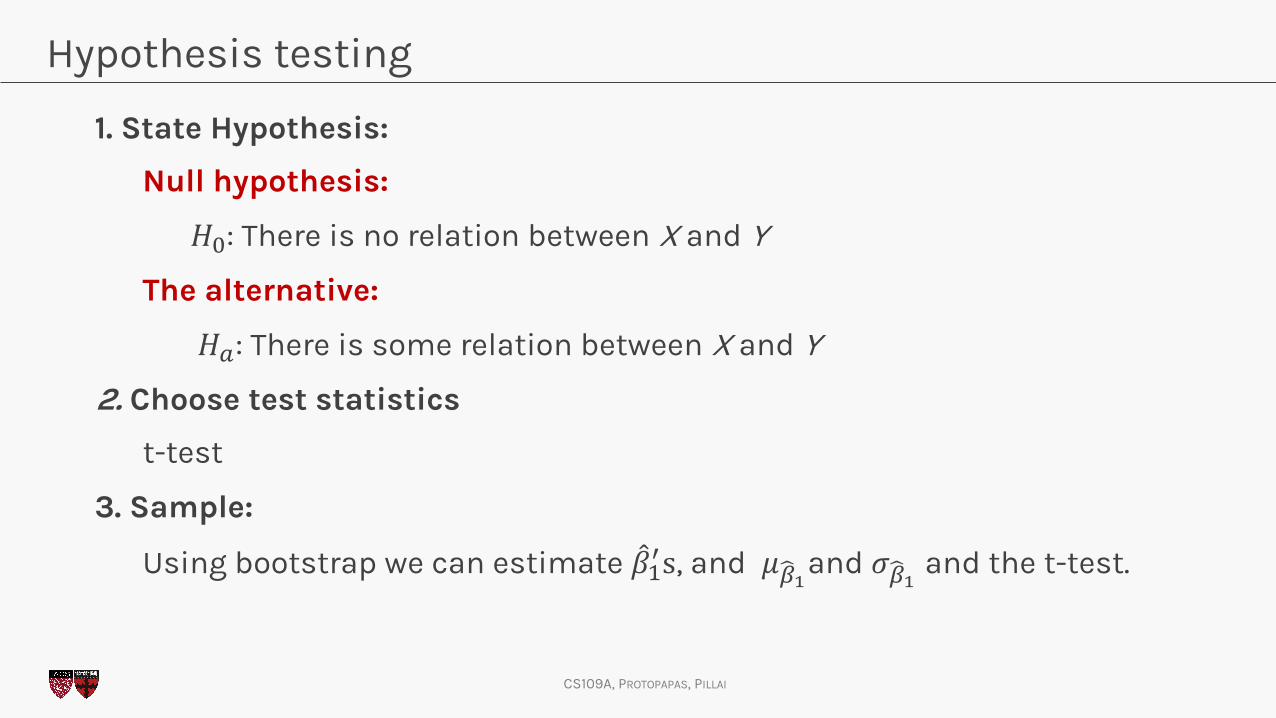
1. State Hypothesis:
Null hypothesis:
𝐻.: There is no relation between X and Y
The alternative:
𝐻0: There is some relation between X and Y
2. Choose test statistics
t-test
3. Sample:
Using bootstrap we can estimate #𝛽/(s, and 𝜇)*!and 𝜎)*! and the t-test.
CS109A, PROTOPAPAS, PILLAI
Hypothesis testing
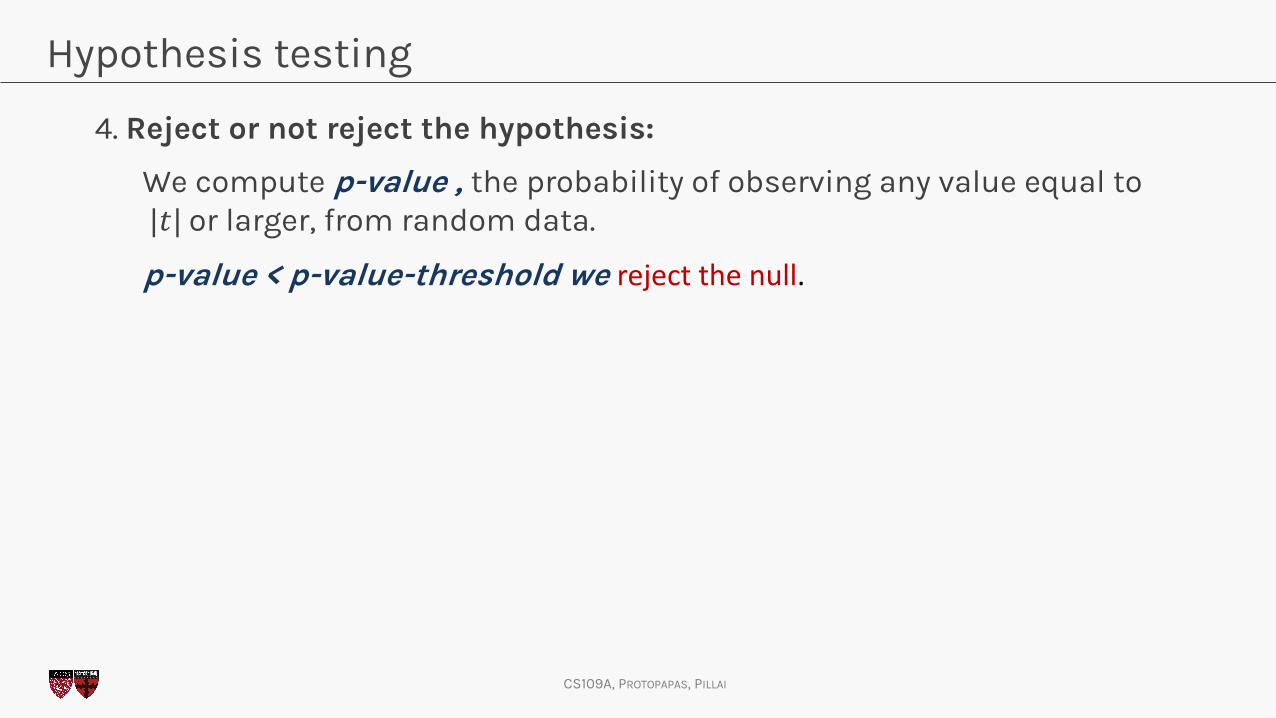
4. Reject or not reject the hypothesis:
We compute p-value , the probability of observing any value equal to |𝑡| or larger, from random data.
p-value < p-value-threshold we reject the null.

CS109A, PROTOPAPAS, PILLAI
Thank you
15

16