Embed Size (px)
Citation preview

1
Evaluating Strategic Project and Portfolio Performance Abstract
To assess performance at the portfolio level, it is vital to measure the performance of individual projects and consolidate the measurements in a mathematically meaningful way that reflects the strategic importance of the member projects. Beyond the traditional metrics, obvious questions are how to: (1) derive project strategic performance using traditional performance measurements, (2) synthesise individual project measurements into meaningful strategic performance measurements at the portfolio level, and (3) assess current project and portfolio strategic performance with respect to continued expectation of achieving strategic objectives as they progress through implementation. This article proposes solutions for the first two questions and suggests a means of approaching the third. Keywords Project portfolio performance; strategic benefit; analytic hierarchy process; strategic portfolio performance; project performance; project portfolio metrics Introduction Project portfolio management (PPM) does not guarantee success in achieving strategic goals and objectives. However, an effective PPM process can increase the chances of selecting and completing the projects that best accomplish organisational objectives and contribute to achieving the organisation’s vision. Key factors in achieving these objectives are (1) selecting the projects that best support strategic objectives, (2) monitoring performance during implementation to ensure the portfolio remains on track to deliver strategic benefits and (3) adjusting strategy and the portfolio when changes in strategy or performance dictate. After selecting and implementing the optimal project portfolio, the organisation must monitor and control project and portfolio performance. Key factors in achieving these objectives are: (1) selecting the projects that best support strategic objectives; (2) monitoring performance during implementation to ensure the portfolio remains on track to deliver strategic benefits; and (3) adjusting strategy and the portfolio when changes in strategy or performance dictate. To assess performance at the portfolio level, it is vital to measure the performance of individual projects and consolidate the measurements in a mathematically meaningful way that reflects the strategic importance of the member projects. Traditional metrics and methods emphasise performance relative to cost, schedule and sometimes quality or scope baselines (Kerzner, 2006). They do not assess whether projects and portfolios remain on track to deliver the strategic benefit for which they were selected. Beyond the traditional metrics, obvious questions are how to: (1) derive project strategic performance using traditional performance measurements; (2) synthesise individual project measurements into meaningful strategic performance measurements at the portfolio level; and (3) assess current project and portfolio strategic performance with respect to continued expectation of achieving strategic objectives as they progress through implementation. This article addresses the first two questions and suggests a means of approaching the third.
2
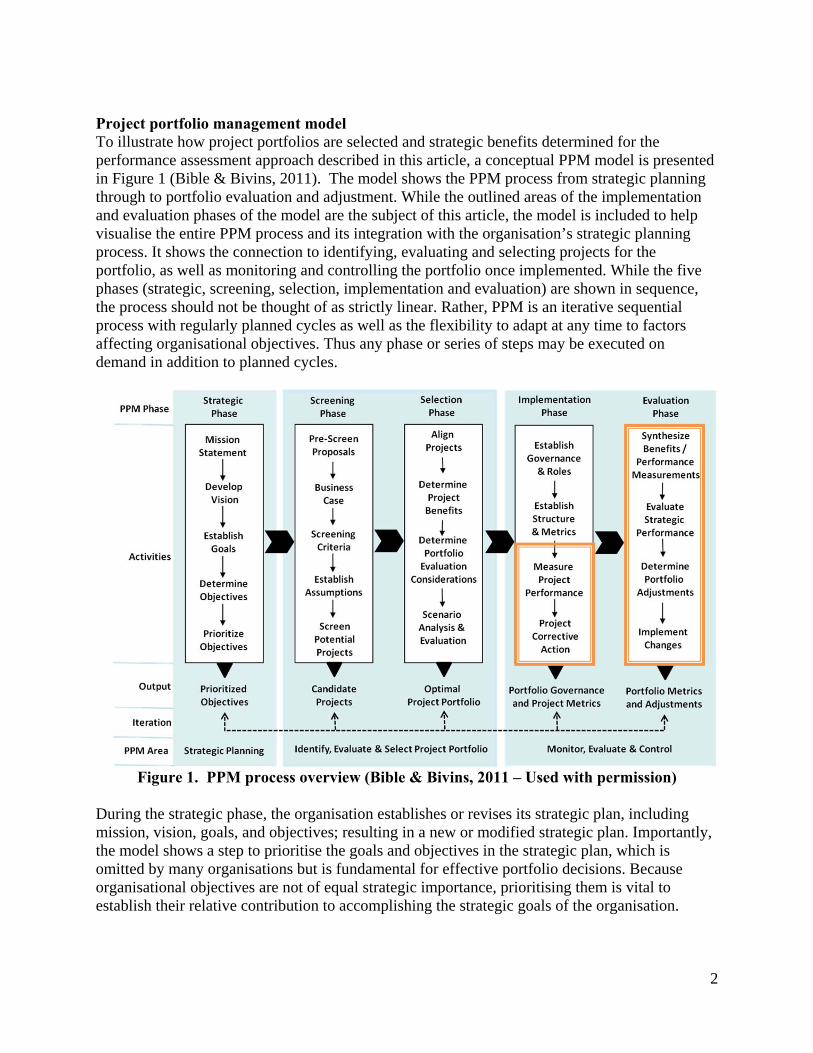
Project portfolio management model To illustrate how project portfolios are selected and strategic benefits determined for the performance assessment approach described in this article, a conceptual PPM model is presented in Figure 1 (Bible & Bivins, 2011). The model shows the PPM process from strategic planning through to portfolio evaluation and adjustment. While the outlined areas of the implementation and evaluation phases of the model are the subject of this article, the model is included to help visualise the entire PPM process and its integration with the organisation’s strategic planning process. It shows the connection to identifying, evaluating and selecting projects for the portfolio, as well as monitoring and controlling the portfolio once implemented. While the five phases (strategic, screening, selection, implementation and evaluation) are shown in sequence, the process should not be thought of as strictly linear. Rather, PPM is an iterative sequential process with regularly planned cycles as well as the flexibility to adapt at any time to factors affecting organisational objectives. Thus any phase or series of steps may be executed on demand in addition to planned cycles.
Figure 1. PPM process overview (Bible & Bivins, 2011 – Used with permission)
During the strategic phase, the organisation establishes or revises its strategic plan, including mission, vision, goals, and objectives; resulting in a new or modified strategic plan. Importantly, the model shows a step to prioritise the goals and objectives in the strategic plan, which is omitted by many organisations but is fundamental for effective portfolio decisions. Because organisational objectives are not of equal strategic importance, prioritising them is vital to establish their relative contribution to accomplishing the strategic goals of the organisation.
3
During the screening phase, project proposals are analyzed to identify candidate projects for the selection phase. Screening provides a structured process for reducing a large number of project proposals to a manageable and feasible number of serious candidates for the portfolio, each of which supports at least one objective (Levine, 2005). During the selection phase, each candidate project is mapped to the strategic objective(s) it supports and prioritised against all other projects using pairwise comparisons or other approaches, such as rating scales that approximate pairwise comparisons. This allows the participants to determine the relative priorities of the projects with respect to the objectives they support, and with respect to the overall goal. The relative priority of each candidate project is thus expressed as its relative benefit in achieving organisational strategy. Since this relative strategic benefit is a key aspect of the portfolio performance measurement approach specified in this article, we discuss how it is determined in the following section. The primary deliverable of the selection phase is the optimal portfolio. This does not mean that the projects with the highest relative strategic benefit are selected in turn until funding is exhausted. Rather, the portfolio selected contains the combination of projects that provide maximum total relative benefit subject to the specified budget and organisational constraints. Organisational constraints can include, among others, critical resources, project dependencies, and balance and coverage targets across competing objectives. During the implementation phase, once the organisation has established its metrics and processes, the projects selected for funding are launched, monitored and controlled. Of course, with an ongoing portfolio, the launch occurs with the commencement of each project rather than all at once, as may be the case the first time the organisation selects a portfolio. The evaluation phase, which runs concurrently with the implementation phase, serves to assess the performance of the projects and portfolios and to determine necessary changes or modifications. During the evaluation phase, performance results from all projects are assembled, the results synthesised considering their relative importance, and adjustments made to address performance issues and/or changes in organisational strategy. Determining strategic benefits Portfolio decisions are complex. They involve many elements, and require making decisions in an environment that by definition contains conflicting objectives and involves both quantitative and qualitative factors. To effectively select, measure and manage the performance of a portfolio, each objective must have a mathematically sound relative importance with respect to each of the other objectives in achieving the overall strategic goal, and each project must have a mathematically sound relative benefit with respect to each of the other projects and the strategic goal. Many commonly used decision methods and ranking and scoring models for project selection fall short, meaning they are not mathematically sound, for reasons we will describe. Decision methods Many of us have experienced the frustration of interminable meetings about project selection, which often end in decisions made in exhaustion, by decree or by the loudest voice. This decision technique is commonly known as BOGSAT (Bunch of Guys/Gals Sitting around Talking, Urban Dictionary, 2012). A major reason BOGSAT fails as a decision technique is that,

4
as psychologists have found, the average human brain can discriminate among only seven elements, plus or minus two, and can hold in short-term memory only seven objects, plus or minus two (Miller, 1994). In other words, we can remember about seven numbers in the order read to us and can discriminate or make judgments about, for example, seven musical tones, with each sound associated with a letter or number. Most business decisions can involve dozens of elements, such as ‘issues, pros, cons, objectives, criteria …’ (Forman, 2001). To reduce the use of BOGSAT, many organisations use ranking and scoring models. But rankings are ordinal numbers and thus indicate only order. If 20 projects are ranked from 1st to 20th, how much more important is the first than the second project, or the second project compared with the last project? Performing arithmetic operations on ordinal numbers yields mathematically meaningless results. Weighting and scoring are often used when there are multiple criteria, for example, least cost and highest net present value. Most business decisions involve multiple objectives, making the assignment of weights and scores difficult, arbitrary and with no sound bases for differentiation. Yet many organisations insist upon averaging or adding rankings and weighted scores on multiple criteria to make important business choices. Appropriate use of numbers ‘Even if there is no intent to misuse numbers, numerical representations are not always what they seem, and may be used, accidentally or purposely, to give credence to nonsense’ (Bible & Bivins, 2011. p. 39). As identified in social science research (Trochim, 2006 and others), the four numerical scales of measurement are nominal, ordinal, interval and ratio. We will very briefly discuss the four ways that numbers are used as levels of measurement, and select one of the four as the basis for comparing the importance of objectives and alternatives for complex decision making, and, specifically for selecting project portfolios. Each scale retains the properties of all the prior scales while adding some unique properties. The nominal scale uses numbers in name only, hence the term “nominal”. Nominal numbers are used for identification only, such as Project 1, Project 2 and so on. Employee numbers and zip codes are also nominal numbers. Performing any mathematical operation on nominal scale numbers, such as adding zip codes, produces meaningless results. Ordinal numbers indicate the order of the evaluation, whether increasing or decreasing. They assign rank order and can be used to sort data, but say nothing meaningful about the size of the intervals between them. Performing mathematical operations on ordinal numbers also results in nonsense, or at least misleading information. Think of the surveys that rank retirement cities or vacation destinations on, for example, ten features, and then average or add the rankings to achieve an overall value. The results are enthusiastically accepted because they are numeric; however, they are mathematically meaningless. The intervals between numbers on the interval scale are meaningful. Air temperatures are interval scale numbers; for example, the interval between 5 degrees Celsius and 15 degrees Celsius is 10 degrees Celsius, the same as the interval between 30 degrees Celsius and 40 degrees Celsius. However, these temperatures are not ratio-scale numbers; for example, it is meaningless to compare 15 degrees Celsius and 30 degrees Celsius and say that the latter is twice as hot as the former.
5
On the other hand, ratio-scale numbers such as duration or size are comparable, and have a meaningful zero point to indicate the absence of any value. We can say that a duration of 6 minutes is twice as long as 3 minutes, and a rectangle that measures 3 centimeters by 3 centimeters is half as large in area as a rectangle that measures 6 cm by 3 cm. Measurements can be actual or relative. There are no restrictions on the use of mathematical operations on ratio-scale numbers, and thus, decision methods based on them are mathematically sound as well as ‘the most flexible and accurate’ (Forman, 2001, p. 35). As the highest order level of measurement, we recommend that portfolio selection decisions be based on ratio-scale numbers. Structuring conflict and complexity To make portfolio decisions even more difficult, strategic objectives are often conflicting, such as short-term profit versus investment in employee benefits to attract and retain the best talent. To address conflicting objectives, we need to choose a conflict-confronting decision strategy, one that allows us to make trade-offs (Hogarth, 1987). For example, in considering which airline ticket to buy, we may consider both price and the number of stops – if price is more important to us than the number of stops, we might choose the lower-priced ticket that may require two stops or plane changes; if time is more important, we make the trade-off and agree to pay more for a flight that gets us to our destination faster. We can also break down these complex decisions into simpler parts, structured in the form of hierarchies in which each level contains no more than seven (plus or minus two) elements. Herbert Simon noted that hierarchical subdivision occurs in all complex systems and is how humans with limited cognitive powers can address complexity (Simon, 1960). Lancelot Whyte noted that the human mind uses hierarchies as the prevailing method for classifying what we observe (Whyte, 1969). Now that we’ve introduced the need for ratio-scale numbers and hierarchies for producing meaningful decisions, we will briefly introduce the analytic hierarchy process (AHP) as the means we use in this article to develop meaningful relative strategic benefits or priorities for projects in a portfolio. AHP is one of the most widely used decision methodologies in the world. In their 2008 article on assessing bibliographic references for multiple criteria decision making tools, Wallenius et al noted that ‘the growth in AHP-related publications is enormous’ (Wallenius, 2008, pp. 1339-1340) and that AHP was referenced considerably more than all other commonly used methods. AHP provides a method to structure major decisions into hierarchies of objectives and alternatives, and compare them, to simplify complex decisions, including prioritisation of project portfolio candidates for an organisation. Overview of the analytic hierarchy process Developed by Thomas Saaty at the Wharton School of Business in the 1970s (Saaty, 1980), AHP is a conceptual process that allows people to structure complex decisions, and to incorporate both qualitative and quantitative assessments, as well as intuition, into the process of decision making.
AHP and the software tools that support it present simplified decisions to the evaluators with a series of pairwise comparisons or rating scales that mimic pairwise comparisons, and then perform the mathematical calculations to properly produce the ratio-scale results by synthesising the input of the individuals participating in the evaluation process.
6
Through a series of complex mathematical calculations, which are today easily performed accurately by widely available computer software, AHP allows comparisons of decision objectives to establish their relative importance, and comparisons of alternatives to establish the relative degree to which each alternative satisfies the objectives. The use of AHP involves three basic steps: decomposition or structuring, making comparative judgments or measuring, and combining or synthesising (Forman, 2008). The structuring or decomposition step breaks down a complex problem into hierarchies or related clusters, much like a deliverable work breakdown structure is created to refine the products and work packages for a large project. The measuring or comparative judgment step compares the relative importance of each element in a cluster to each of the other elements of the cluster ‘with respect to the parent of the cluster’ (Forman, 2001, p. 51) to derive the priorities of those elements. The synthesising step combines the results of the individual comparative judgments into a mathematically meaningful group result. AHP synthesises these results using mathematical processes for computing eigenvectors, methods that have been subjected to testing and have proven to be extremely accurate (Forman, 2001). Thus it is possible to use both subjective and objective data and observations in pairwise comparisons. This process forms the framework for determining the amount of benefit each project provides in relation to other projects and strategic objectives. Applying AHP to determine relative project benefit Because an organisation’s objectives are not of equal importance, we added the step of prioritising objectives to the strategic phase of PPM shown in Figure 1. Using AHP, the evaluators, usually senior executives, are asked to prioritise the objectives in a series of pairwise comparisons. The individual judgments are then synthesised to produce ratio-scale relative priorities for the objectives (and sub-objectives, if any). To determine the relative strategic benefit for projects during the portfolio selection process, each alternative (i.e. candidate project) is mapped to the objective(s) it supports and compared pairwise to each of the other projects supporting the same objective(s) to determine the relative importance of each project in achieving the objective. By determining the relative importance of each project through the pairwise comparison process or, in the case of large numbers of projects, using a rating scale that simulates the pairwise comparisons, the organisation specifies the ratio-scale relative benefit of the project in achieving the objectives. The most important projects supporting the most important objectives will thus have the highest relative strategic benefit (priority), with less important projects having lower relative strategic benefit. All these calculations are performed in accordance with the mathematics supporting AHP, normally with the aid of available software tools. For more information about calculating relative benefit, see Bible and Bivins (2011, chapters 4 and 7) and Saaty (2008). Although these tools enable complex decisions, human beings still make them, and iteration is easy when the results do not seem intuitively correct. The ratio-scale relative priorities derived using AHP form the foundation for considering the candidate projects. The optimal project portfolio can then be selected; the optimal portfolio is defined as the combination of projects at a given budget that yields the maximum total benefit
7
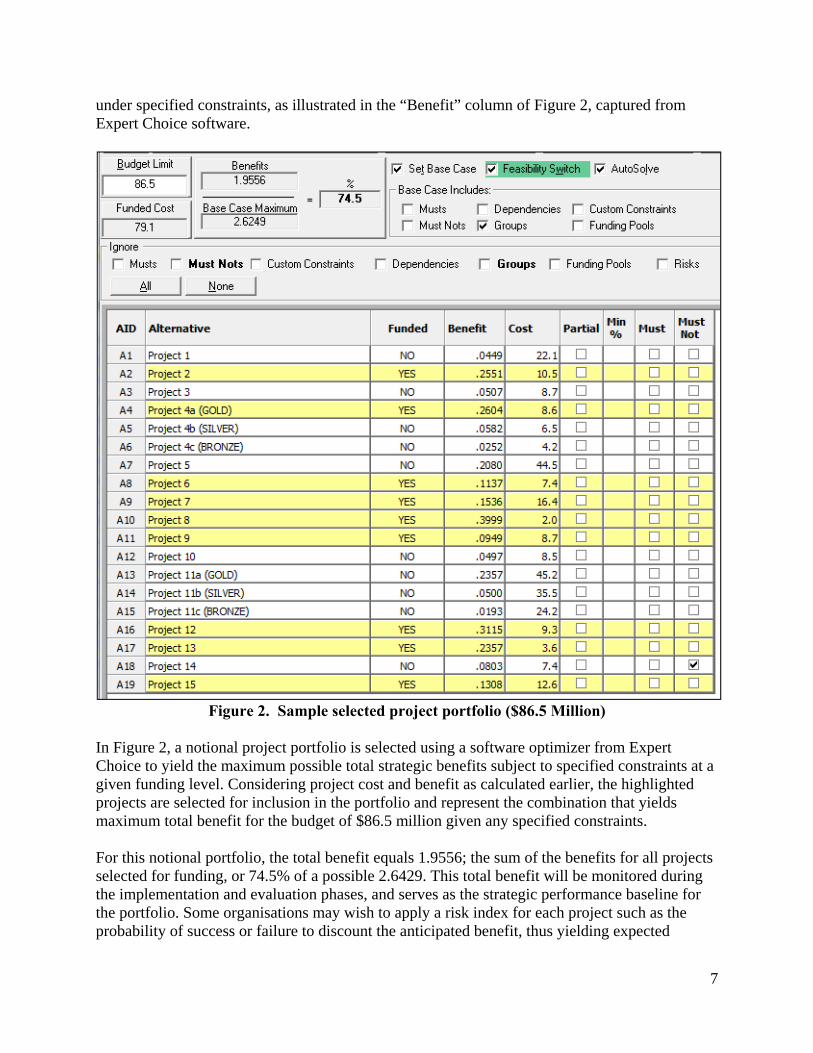
under specified constraints, as illustrated in the “Benefit” column of Figure 2, captured from Expert Choice software.
Figure 2. Sample selected project portfolio ($86.5 Million)
In Figure 2, a notional project portfolio is selected using a software optimizer from Expert Choice to yield the maximum possible total strategic benefits subject to specified constraints at a given funding level. Considering project cost and benefit as calculated earlier, the highlighted projects are selected for inclusion in the portfolio and represent the combination that yields maximum total benefit for the budget of $86.5 million given any specified constraints. For this notional portfolio, the total benefit equals 1.9556; the sum of the benefits for all projects selected for funding, or 74.5% of a possible 2.6429. This total benefit will be monitored during the implementation and evaluation phases, and serves as the strategic performance baseline for the portfolio. Some organisations may wish to apply a risk index for each project such as the probability of success or failure to discount the anticipated benefit, thus yielding expected
8
relative strategic benefit rather than anticipated relative strategic benefit. In this case, the total expected benefit is used to select the optimal portfolio and serve as the strategic performance baseline. Measuring project performance -- traditional metrics To implement the portfolio, the organisation must have defined the project metrics or performance indicators to be used, and have distributed the acceptable limits of those metrics through the organisation’s portfolio management plan or equivalent. As well, the planned baselines must have been established. The project performance indicators are used to monitor ongoing project performance and control the project when measurement variances are outside acceptable tolerances. To illustrate the performance measurement approach, we use earned value management (EVM) and quality performance metrics, although the approach in this article can be applied using most other project performance indicators. Earned value management As a technique endorsed by the Project Management Institute (PMI), and referenced in the PMBOK (PMI, 2008), many organisations use EVM as a systematic means of evaluating project progress that measures schedule and cost performance to answer the question: What have we received for the money spent? EVM comprises four primary metrics: Budget At Completion (BAC), Planned Value (PV), Earned Value (EV), and Actual Cost (AC), shown in Figure 3.
9
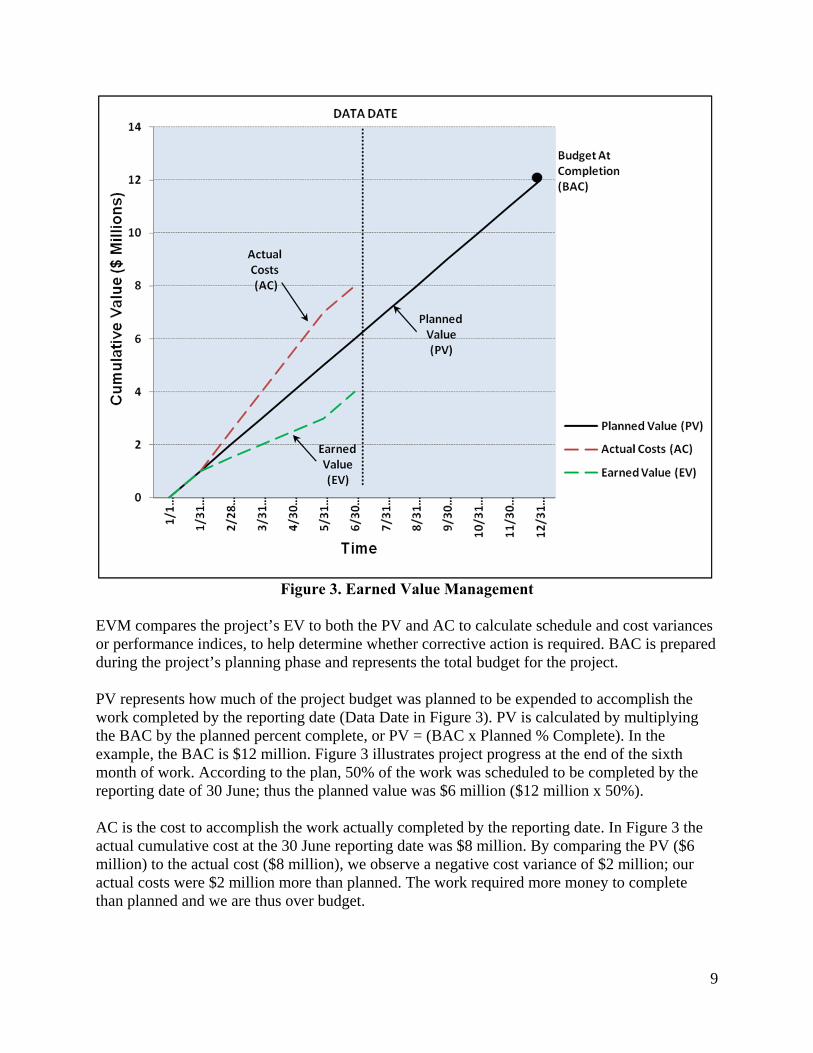
Figure 3. Earned Value Management
EVM compares the project’s EV to both the PV and AC to calculate schedule and cost variances or performance indices, to help determine whether corrective action is required. BAC is prepared during the project’s planning phase and represents the total budget for the project. PV represents how much of the project budget was planned to be expended to accomplish the work completed by the reporting date (Data Date in Figure 3). PV is calculated by multiplying the BAC by the planned percent complete, or PV = (BAC x Planned % Complete). In the example, the BAC is $12 million. Figure 3 illustrates project progress at the end of the sixth month of work. According to the plan, 50% of the work was scheduled to be completed by the reporting date of 30 June; thus the planned value was $6 million ($12 million x 50%). AC is the cost to accomplish the work actually completed by the reporting date. In Figure 3 the actual cumulative cost at the 30 June reporting date was $8 million. By comparing the PV ($6 million) to the actual cost ($8 million), we observe a negative cost variance of $2 million; our actual costs were $2 million more than planned. The work required more money to complete than planned and we are thus over budget.

10
EV is the budgeted cost for the work that has actually been accomplished on the project and is calculated by multiplying the BAC by the actual percent of work completed (EV = BAC x actual % complete). The actual % work completed is determined by the organisation’s method for estimating work completed1. Using our example in Figure 3, as of the reporting date of 30 June, presume we have completed approximately 33% of the work using one of the actual work completed estimating methods described. To calculate EV, we multiply BAC ($12 million) by actual percent complete (33%), which equals $4 million. In comparing the PV ($6 million) to the EV ($4 million), we notice a negative schedule variance of $2 million; i.e., the EV (budgeted cost of the work we actually completed) is less than the PV (budgeted cost of the work we scheduled). This indicates we have not earned as much value as planned and are thus behind schedule. Each project’s EV measurements form the basis for determining performance indices and monitoring project performance relative to cost and schedule baselines. Schedule performance index and cost performance index Since cost and schedule variances are absolute, they cannot be compared for different projects. Indices rather than variances can be used for comparative purposes. EVM metrics, known as the Schedule Performance Index (SPI) and Cost Performance Index (CPI), can be calculated from EVM measurements to monitor project performance relative to cost and schedule baselines. Cost performance index is calculated as CPI = EV/AC. A value less than 1.0 indicates cost overrun while a value greater than 1.0 indicates a cost under run. Using the example from Figure 3, EV = $6 million while AC equaled $8 million. Using the formula we derive a CPI = 0.75, indicating a major cost overrun. Schedule performance index is calculated as SPI = EV/PV. Similar to the CPI, a value less one 1.0 indicates the project is behind schedule while a value greater than 1.0 indicates the project is ahead of schedule. Again, referring to the example in Figure 3, the EV equaled $4 million while the PV equaled $6 million. Using the formula, we derive a SPI = 0.67 indicating the project is considerably behind schedule. Quality performance index While EVM provides a useful and powerful method for capturing project cost and schedule performance, it does not account for meeting specifications or the customer’s expectations. A project can be performing well in terms of cost and schedule, but if it is not meeting specifications2 or customer expectations, then project success is negatively affected. Nearly any project measurements, derived from subjective assessments, can be combined with traditional EVM measurement to provide meaningful performance metrics. To demonstrate the flexibility of the portfolio performance measurement approach in this article, we include a method for measuring project quality.
1 Meredith and Mantel (2006) note the 50-50, 0-100, critical input use and the proportionality rule as common methods for estimating work package completion percentages. 2 Although some treat scope as separate from quality, in the authors’ view, quality is a measure of conformance to specifications, and specifications represent the scope. Also, the specifications should be aligned with customer expectations. Those who wish to have separate performance indicators for scope, customer satisfaction or any other metric can apply them to the discussion in this article in the same manner as the EVM and quality metrics.
11
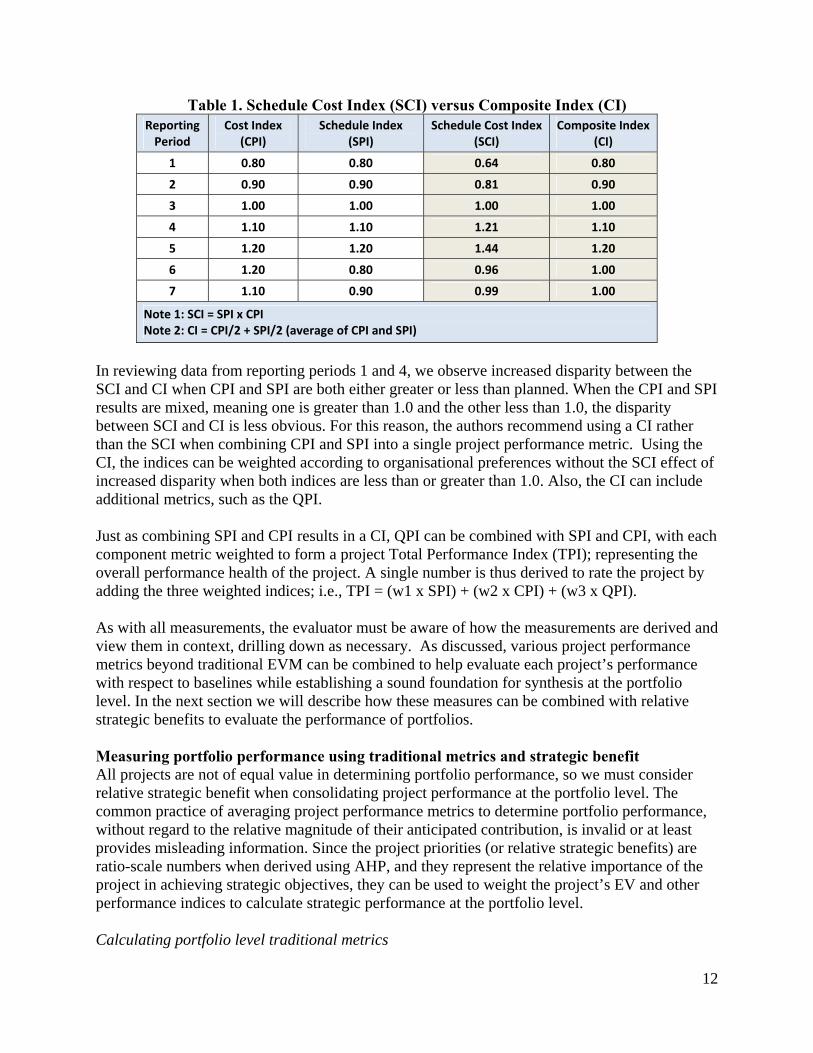
Nisenboim (2002) suggests the use of a Quality Performance Index (QPI) as measure of how well the product appears to be conforming to customer requirements, or specifications. Nisenboim also suggests deriving this measure during project implementation using a simple rating review conducted informally by a peer or subject matter expert. A rating of 0.90, for example, would mean that, in the opinion of the reviewer(s), for the components of the developing product that are available for review, conformance to requirements is 90%. Another more formal method is comparing work package deliverables against contract specifications and assessing compliance directly or by using a rating scale. Measuring and interpreting QPI results differs from EVM in that the QPI rarely, if ever, exceeds 1.0. That is, a QPI of 1.0 represents the project as delivering 100% of project baseline specifications. A value higher than 1.0 would indicate the project is delivering more, in terms of specifications, than scope baseline -- a rare occurrence in projects. An advantage of QPI is that this metric forces the project manager and the organisation’s PPM system to consider conformance to specifications when measuring project and portfolio performance. Delivering a work package and project within cost and schedule baselines will not result in a successful project if the project fails to achieve its intended purposes (e.g. meeting specifications). QPI does not specifically include customer satisfaction; an additional metric can be used for this purpose. Composite traditional project metrics Individual metrics can be combined to yield a single composite metric, but caution is advised to ensure that the context and results are understood. The two EVM indices, SPI and CPI, can be combined in two ways to yield a single index of performance for a project, such as the schedule cost index (SCI) or a weighted index simply known as a composite index (CI). The project’s SCI represents the total project performance using earned value measures of schedule (SPI) and cost (CPI) as the basis. SCI is calculated by multiplying the project’s current CPI by the current SPI (Christensen, 1996). For instance, if CPI = 0.80 and SPI = 1.20, the SCI = 0.80 x 1.20 = 0.96. This value indicates that the project is moderately underperforming relative to cost and schedule baselines. When the organisation values some measurement components more than others, it can use the CI (Christensen, 1996). The CI is calculated as CI = (w1 * SPI) + (w2 * CPI). For instance, CI can equally weight schedule and cost to produce an average when the organisation deems them to be equally important, or can weight one more heavily than the other; for example, cost at 70% and schedule at 30% when cost is more critical than schedule. Determining the relative importance of these factors could itself be subjected to an AHP evaluation. In the earlier example of CPI = 0.80 and SPI = 1.20, the CI = ((0.80 * 0.70) + (1.20 * 0.30)) = 0.92. Note that SCI and CI often produce different values as shown in Table 1. The method used to calculate metrics and interpret the results is as important as the choice of metrics. In Table 1, the CI was derived by weighting each performance index equally and the SCI was calculated as the product of the CPI and the SPI. When compared to an equally weighted CI, as Table 1 shows, using the SCI yields a more pessimistic result when the CPI and SPI are both less than 1.0 and a more optimistic result when the CPI and SPI are both greater than 1.0.
12
Table 1. Schedule Cost Index (SCI) versus Composite Index (CI) Reporting Period
Cost Index (CPI)
Schedule Index (SPI)
Schedule Cost Index (SCI)
Composite Index (CI)
1 0.80 0.80 0.64 0.80
2 0.90 0.90 0.81 0.90
3 1.00 1.00 1.00 1.00
4 1.10 1.10 1.21 1.10
5 1.20 1.20 1.44 1.20
6 1.20 0.80 0.96 1.00
7 1.10 0.90 0.99 1.00
Note 1: SCI = SPI x CPI Note 2: CI = CPI/2 + SPI/2 (average of CPI and SPI)
In reviewing data from reporting periods 1 and 4, we observe increased disparity between the SCI and CI when CPI and SPI are both either greater or less than planned. When the CPI and SPI results are mixed, meaning one is greater than 1.0 and the other less than 1.0, the disparity between SCI and CI is less obvious. For this reason, the authors recommend using a CI rather than the SCI when combining CPI and SPI into a single project performance metric. Using the CI, the indices can be weighted according to organisational preferences without the SCI effect of increased disparity when both indices are less than or greater than 1.0. Also, the CI can include additional metrics, such as the QPI. Just as combining SPI and CPI results in a CI, QPI can be combined with SPI and CPI, with each component metric weighted to form a project Total Performance Index (TPI); representing the overall performance health of the project. A single number is thus derived to rate the project by adding the three weighted indices; i.e., TPI = (w1 x SPI) + (w2 x CPI) + (w3 x QPI). As with all measurements, the evaluator must be aware of how the measurements are derived and view them in context, drilling down as necessary. As discussed, various project performance metrics beyond traditional EVM can be combined to help evaluate each project’s performance with respect to baselines while establishing a sound foundation for synthesis at the portfolio level. In the next section we will describe how these measures can be combined with relative strategic benefits to evaluate the performance of portfolios. Measuring portfolio performance using traditional metrics and strategic benefit All projects are not of equal value in determining portfolio performance, so we must consider relative strategic benefit when consolidating project performance at the portfolio level. The common practice of averaging project performance metrics to determine portfolio performance, without regard to the relative magnitude of their anticipated contribution, is invalid or at least provides misleading information. Since the project priorities (or relative strategic benefits) are ratio-scale numbers when derived using AHP, and they represent the relative importance of the project in achieving strategic objectives, they can be used to weight the project’s EV and other performance indices to calculate strategic performance at the portfolio level. Calculating portfolio level traditional metrics
13
To measure strategic portfolio performance, individual project performance metrics, such as SPI and CPI, require minor notation modifications to accommodate consolidation of several projects across the portfolio. Accordingly, project SPI, CPI and CI are hereafter designated SPIPRO
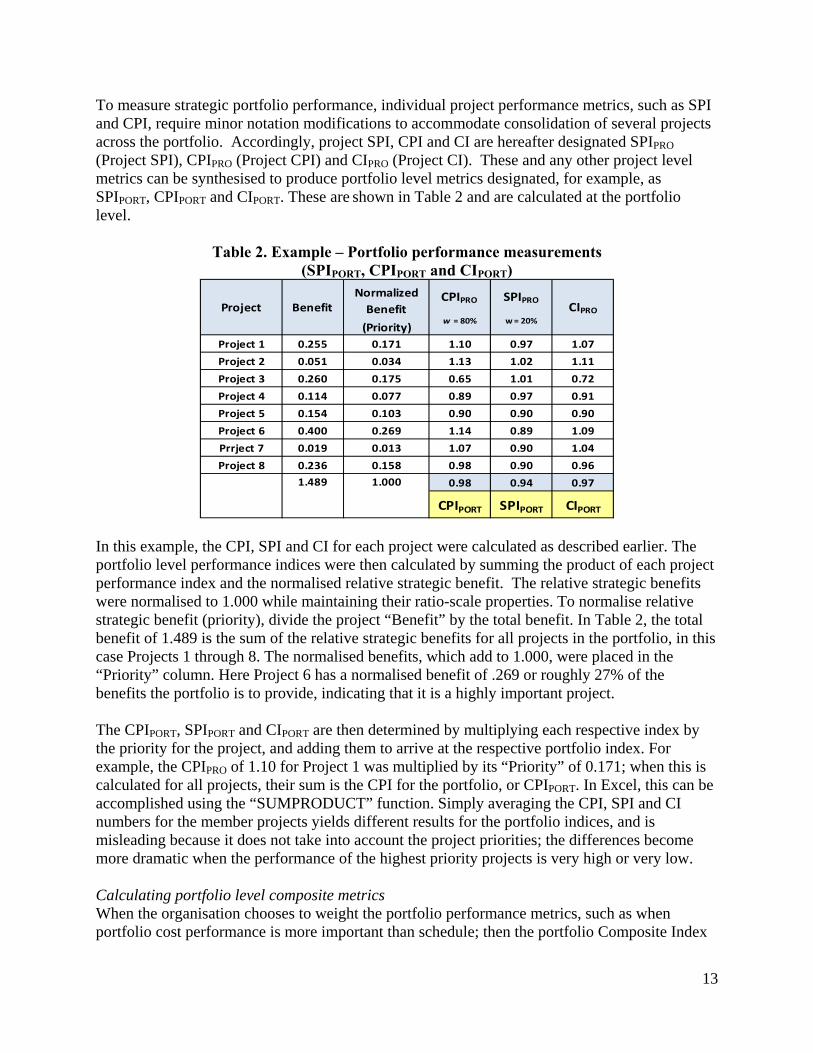
(Project SPI), CPIPRO (Project CPI) and CIPRO (Project CI). These and any other project level metrics can be synthesised to produce portfolio level metrics designated, for example, as SPIPORT, CPIPORT and CIPORT. These are shown in Table 2 and are calculated at the portfolio level.
Table 2. Example – Portfolio performance measurements (SPIPORT, CPIPORT and CIPORT)
Normalized
Benefit
(Priority)
Project 1 0.255 0.171 1.10 0.97 1.07
Project 2 0.051 0.034 1.13 1.02 1.11
Project 3 0.260 0.175 0.65 1.01 0.72
Project 4 0.114 0.077 0.89 0.97 0.91
Project 5 0.154 0.103 0.90 0.90 0.90
Project 6 0.400 0.269 1.14 0.89 1.09
Prrject 7 0.019 0.013 1.07 0.90 1.04
Project 8 0.236 0.158 0.98 0.90 0.96
0.98 0.94 0.97
CPIPORT SPIPORT CIPORT
SPIPRO
w = 20%
CIPRO
1.000
Project BenefitCPIPRO
w = 80%
1.489
In this example, the CPI, SPI and CI for each project were calculated as described earlier. The portfolio level performance indices were then calculated by summing the product of each project performance index and the normalised relative strategic benefit. The relative strategic benefits were normalised to 1.000 while maintaining their ratio-scale properties. To normalise relative strategic benefit (priority), divide the project “Benefit” by the total benefit. In Table 2, the total benefit of 1.489 is the sum of the relative strategic benefits for all projects in the portfolio, in this case Projects 1 through 8. The normalised benefits, which add to 1.000, were placed in the “Priority” column. Here Project 6 has a normalised benefit of .269 or roughly 27% of the benefits the portfolio is to provide, indicating that it is a highly important project. The CPIPORT, SPIPORT and CIPORT are then determined by multiplying each respective index by the priority for the project, and adding them to arrive at the respective portfolio index. For example, the CPIPRO of 1.10 for Project 1 was multiplied by its “Priority” of 0.171; when this is calculated for all projects, their sum is the CPI for the portfolio, or CPIPORT. In Excel, this can be accomplished using the “SUMPRODUCT” function. Simply averaging the CPI, SPI and CI numbers for the member projects yields different results for the portfolio indices, and is misleading because it does not take into account the project priorities; the differences become more dramatic when the performance of the highest priority projects is very high or very low. Calculating portfolio level composite metrics When the organisation chooses to weight the portfolio performance metrics, such as when portfolio cost performance is more important than schedule; then the portfolio Composite Index
14
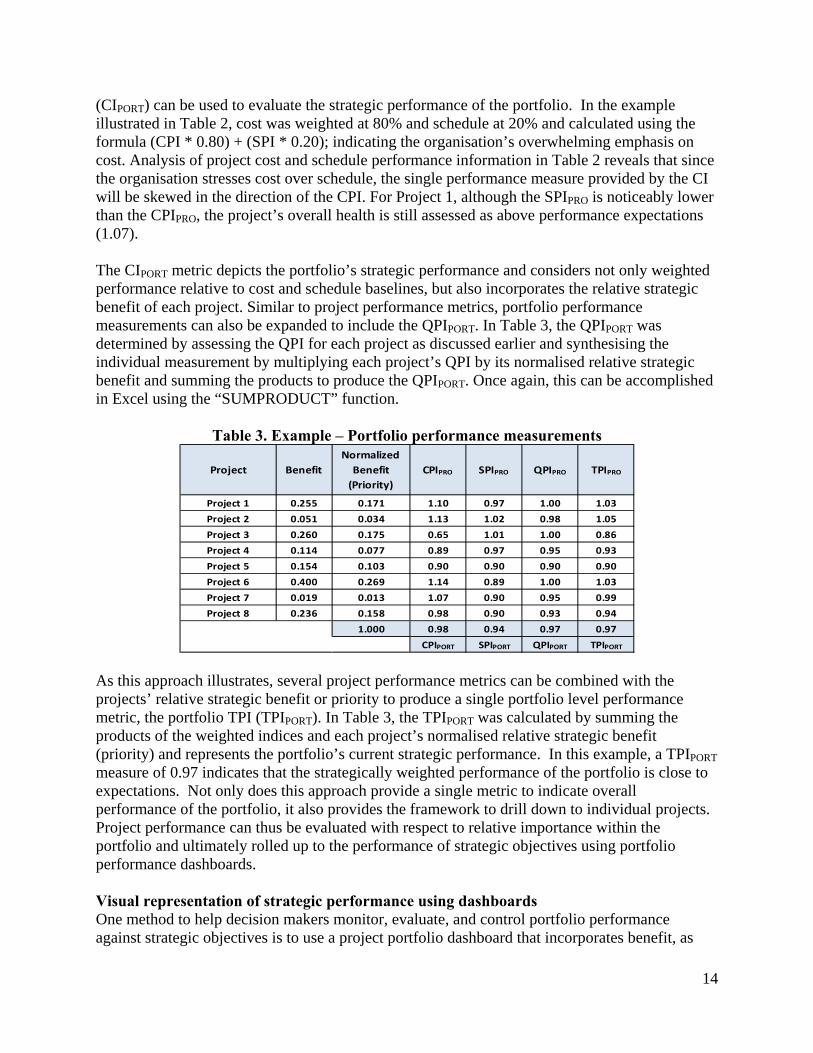
(CIPORT) can be used to evaluate the strategic performance of the portfolio. In the example illustrated in Table 2, cost was weighted at 80% and schedule at 20% and calculated using the formula (CPI * 0.80) + (SPI * 0.20); indicating the organisation’s overwhelming emphasis on cost. Analysis of project cost and schedule performance information in Table 2 reveals that since the organisation stresses cost over schedule, the single performance measure provided by the CI will be skewed in the direction of the CPI. For Project 1, although the SPIPRO is noticeably lower than the CPIPRO, the project’s overall health is still assessed as above performance expectations (1.07). The CIPORT metric depicts the portfolio’s strategic performance and considers not only weighted performance relative to cost and schedule baselines, but also incorporates the relative strategic benefit of each project. Similar to project performance metrics, portfolio performance measurements can also be expanded to include the QPIPORT. In Table 3, the QPIPORT was determined by assessing the QPI for each project as discussed earlier and synthesising the individual measurement by multiplying each project’s QPI by its normalised relative strategic benefit and summing the products to produce the QPIPORT. Once again, this can be accomplished in Excel using the “SUMPRODUCT” function.
Table 3. Example – Portfolio performance measurements
Project 1 0.255 0.171 1.10 0.97 1.00 1.03
Project 2 0.051 0.034 1.13 1.02 0.98 1.05
Project 3 0.260 0.175 0.65 1.01 1.00 0.86
Project 4 0.114 0.077 0.89 0.97 0.95 0.93
Project 5 0.154 0.103 0.90 0.90 0.90 0.90
Project 6 0.400 0.269 1.14 0.89 1.00 1.03
Project 7 0.019 0.013 1.07 0.90 0.95 0.99
Project 8 0.236 0.158 0.98 0.90 0.93 0.94
1.000 0.98 0.94 0.97 0.97
CPIPORT SPIPORT QPIPORT TPIPORT
Project Benefit CPIPRO SPIPRO QPIPRO TPIPRO
Normalized
Benefit
(Priority)
As this approach illustrates, several project performance metrics can be combined with the projects’ relative strategic benefit or priority to produce a single portfolio level performance metric, the portfolio TPI (TPIPORT). In Table 3, the TPIPORT was calculated by summing the products of the weighted indices and each project’s normalised relative strategic benefit (priority) and represents the portfolio’s current strategic performance. In this example, a TPIPORT measure of 0.97 indicates that the strategically weighted performance of the portfolio is close to expectations. Not only does this approach provide a single metric to indicate overall performance of the portfolio, it also provides the framework to drill down to individual projects. Project performance can thus be evaluated with respect to relative importance within the portfolio and ultimately rolled up to the performance of strategic objectives using portfolio performance dashboards. Visual representation of strategic performance using dashboards One method to help decision makers monitor, evaluate, and control portfolio performance against strategic objectives is to use a project portfolio dashboard that incorporates benefit, as
15
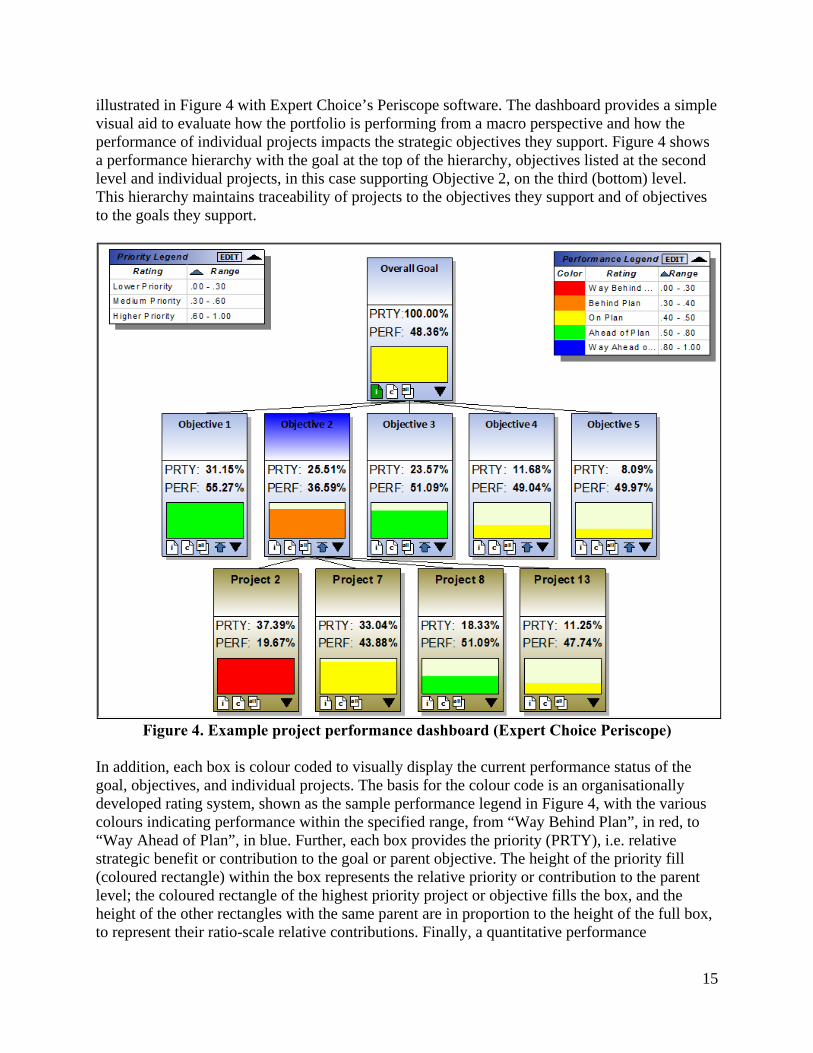
illustrated in Figure 4 with Expert Choice’s Periscope software. The dashboard provides a simple visual aid to evaluate how the portfolio is performing from a macro perspective and how the performance of individual projects impacts the strategic objectives they support. Figure 4 shows a performance hierarchy with the goal at the top of the hierarchy, objectives listed at the second level and individual projects, in this case supporting Objective 2, on the third (bottom) level. This hierarchy maintains traceability of projects to the objectives they support and of objectives to the goals they support.
Figure 4. Example project performance dashboard (Expert Choice Periscope)
In addition, each box is colour coded to visually display the current performance status of the goal, objectives, and individual projects. The basis for the colour code is an organisationally developed rating system, shown as the sample performance legend in Figure 4, with the various colours indicating performance within the specified range, from “Way Behind Plan”, in red, to “Way Ahead of Plan”, in blue. Further, each box provides the priority (PRTY), i.e. relative strategic benefit or contribution to the goal or parent objective. The height of the priority fill (coloured rectangle) within the box represents the relative priority or contribution to the parent level; the coloured rectangle of the highest priority project or objective fills the box, and the height of the other rectangles with the same parent are in proportion to the height of the full box, to represent their ratio-scale relative contributions. Finally, a quantitative performance
16
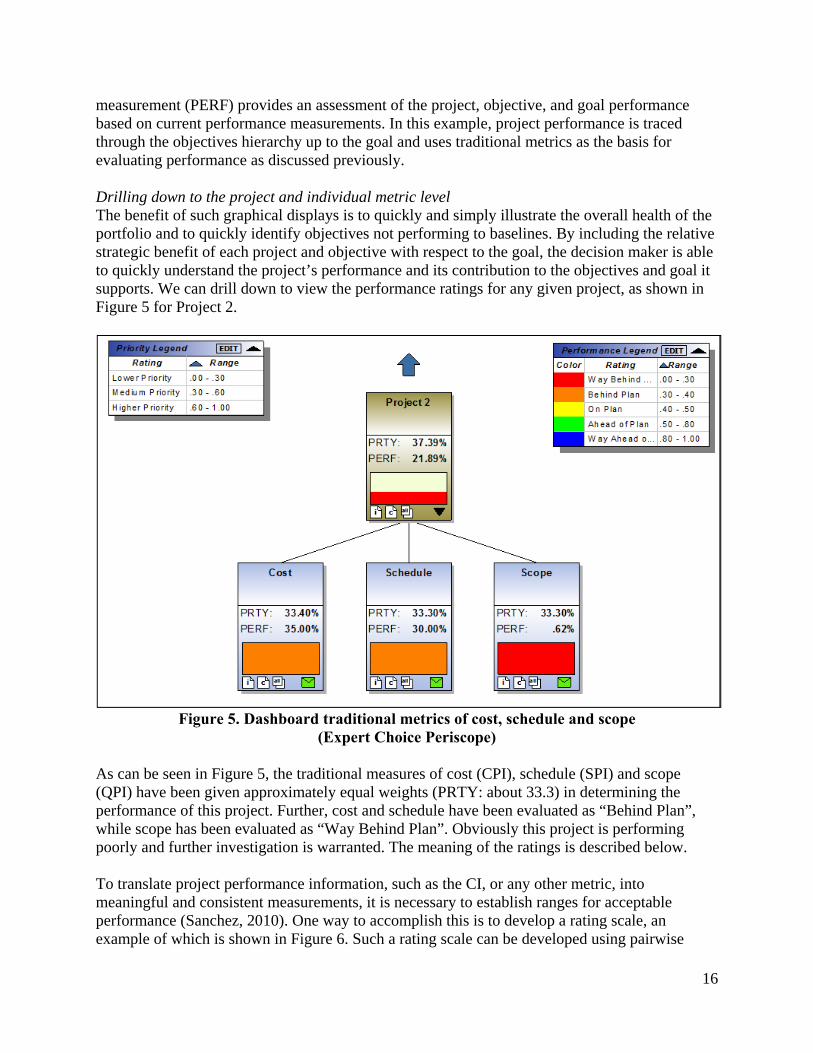
measurement (PERF) provides an assessment of the project, objective, and goal performance based on current performance measurements. In this example, project performance is traced through the objectives hierarchy up to the goal and uses traditional metrics as the basis for evaluating performance as discussed previously. Drilling down to the project and individual metric level The benefit of such graphical displays is to quickly and simply illustrate the overall health of the portfolio and to quickly identify objectives not performing to baselines. By including the relative strategic benefit of each project and objective with respect to the goal, the decision maker is able to quickly understand the project’s performance and its contribution to the objectives and goal it supports. We can drill down to view the performance ratings for any given project, as shown in Figure 5 for Project 2.
Figure 5. Dashboard traditional metrics of cost, schedule and scope
(Expert Choice Periscope) As can be seen in Figure 5, the traditional measures of cost (CPI), schedule (SPI) and scope (QPI) have been given approximately equal weights (PRTY: about 33.3) in determining the performance of this project. Further, cost and schedule have been evaluated as “Behind Plan”, while scope has been evaluated as “Way Behind Plan”. Obviously this project is performing poorly and further investigation is warranted. The meaning of the ratings is described below. To translate project performance information, such as the CI, or any other metric, into meaningful and consistent measurements, it is necessary to establish ranges for acceptable performance (Sanchez, 2010). One way to accomplish this is to develop a rating scale, an example of which is shown in Figure 6. Such a rating scale can be developed using pairwise
17
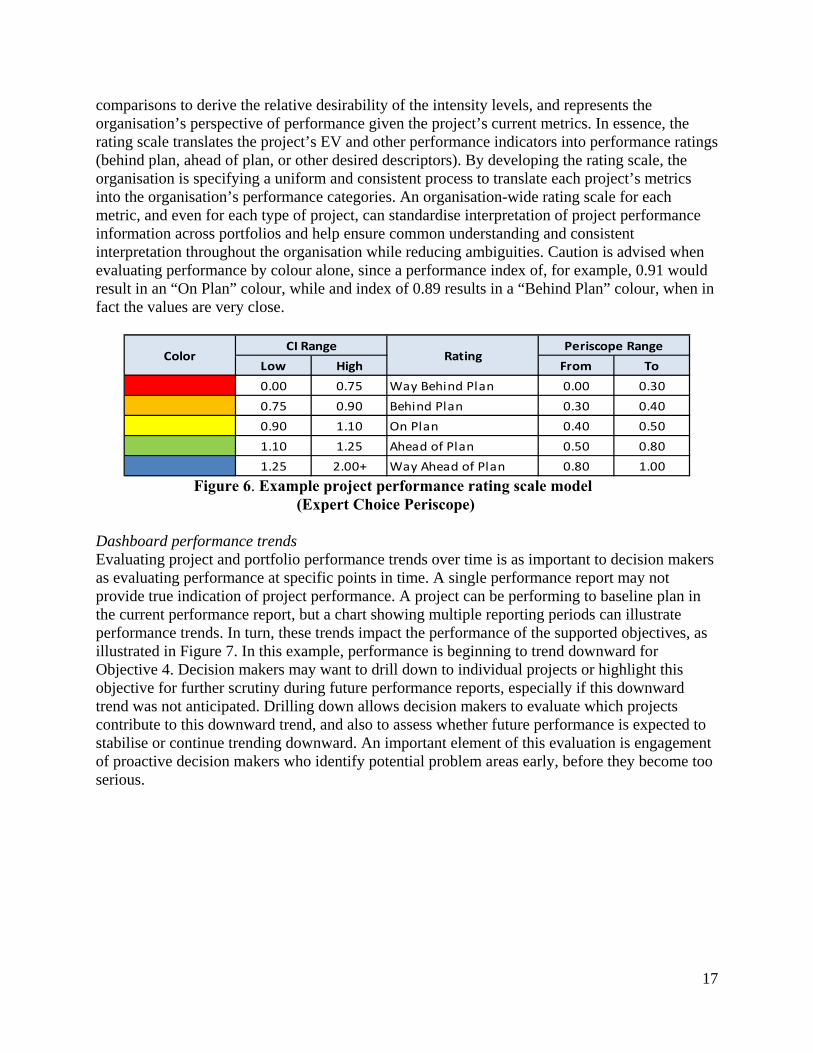
comparisons to derive the relative desirability of the intensity levels, and represents the organisation’s perspective of performance given the project’s current metrics. In essence, the rating scale translates the project’s EV and other performance indicators into performance ratings (behind plan, ahead of plan, or other desired descriptors). By developing the rating scale, the organisation is specifying a uniform and consistent process to translate each project’s metrics into the organisation’s performance categories. An organisation-wide rating scale for each metric, and even for each type of project, can standardise interpretation of project performance information across portfolios and help ensure common understanding and consistent interpretation throughout the organisation while reducing ambiguities. Caution is advised when evaluating performance by colour alone, since a performance index of, for example, 0.91 would result in an “On Plan” colour, while and index of 0.89 results in a “Behind Plan” colour, when in fact the values are very close.
Low High From To
0.00 0.75 0.00 0.30
0.75 0.90 0.30 0.40
0.90 1.10 0.40 0.50
1.10 1.25 0.50 0.80
1.25 2.00+ 0.80 1.00
ColorCI Range
RatingPeriscope Range
Way Behind Plan
Behind Plan
Ahead of Plan
Way Ahead of Plan
On Plan
Figure 6. Example project performance rating scale model
(Expert Choice Periscope) Dashboard performance trends Evaluating project and portfolio performance trends over time is as important to decision makers as evaluating performance at specific points in time. A single performance report may not provide true indication of project performance. A project can be performing to baseline plan in the current performance report, but a chart showing multiple reporting periods can illustrate performance trends. In turn, these trends impact the performance of the supported objectives, as illustrated in Figure 7. In this example, performance is beginning to trend downward for Objective 4. Decision makers may want to drill down to individual projects or highlight this objective for further scrutiny during future performance reports, especially if this downward trend was not anticipated. Drilling down allows decision makers to evaluate which projects contribute to this downward trend, and also to assess whether future performance is expected to stabilise or continue trending downward. An important element of this evaluation is engagement of proactive decision makers who identify potential problem areas early, before they become too serious.

18
Figure 7. Example project performance dashboard trend chart
(Expert Choice Periscope) Project portfolio dashboard advantages Dashboards can be prepared that show individual performance indices, or multiple indices weighted and combined into composite performance measurements. From the perspective of the decision maker, this visual dashboard display helps provide context for how the overall portfolio, or portfolios, are performing relative to the goal. By providing a hierarchical representation of the strategic plan and supporting projects, decision makers can quickly identify problem areas and determine corrective action by drilling down deeper into the portfolio and even into individual metrics. From Figure 5, it is easy to see that Project 2 is not performing well and is a major contributor to the Behind Plan status of Objective 2. As indicated in the dashboard, Project 2 is the most important project supporting the objective and accounts for 32.25% of the benefits for this objective. By presenting this information in a simple visual display, the dashboard becomes a powerful tool to help make informed and reasoned decisions. Such graphical displays emphasise that the priority, or relative strategic benefit, of the member projects plays a required role in reporting portfolio performance. Determining portfolio adjustments Monitoring performance is a key aspect of and contributor to the PPM process. Monitoring provides the information necessary for project and portfolio managers to evaluate performance and to take corrective actions within their decision authority, which is normally confined to changes that do not affect cost, schedule and specification baselines. Monitoring also provides valuable input to help decision makers at a higher level determine changes that do affect portfolio baselines. As each project’s performance information is reported, it is combined with other projects and reported to the organisation’s project portfolio management office to provide a snapshot of the
19
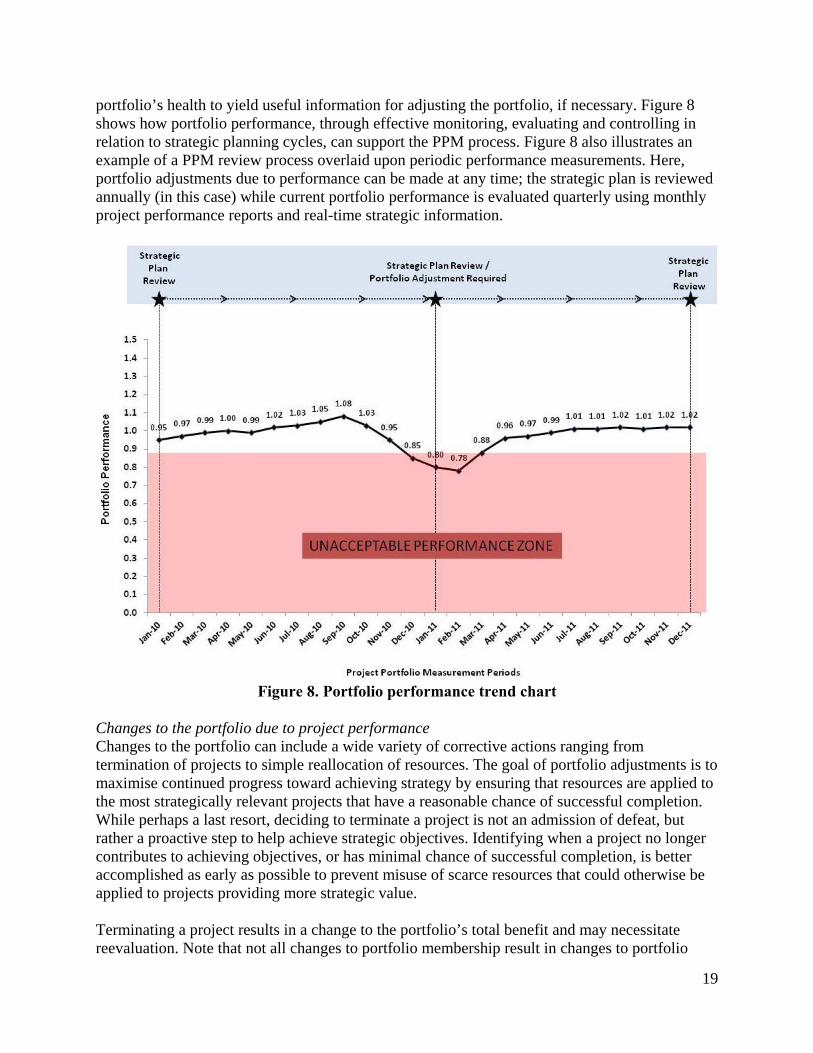
portfolio’s health to yield useful information for adjusting the portfolio, if necessary. Figure 8 shows how portfolio performance, through effective monitoring, evaluating and controlling in relation to strategic planning cycles, can support the PPM process. Figure 8 also illustrates an example of a PPM review process overlaid upon periodic performance measurements. Here, portfolio adjustments due to performance can be made at any time; the strategic plan is reviewed annually (in this case) while current portfolio performance is evaluated quarterly using monthly project performance reports and real-time strategic information.
Figure 8. Portfolio performance trend chart
Changes to the portfolio due to project performance Changes to the portfolio can include a wide variety of corrective actions ranging from termination of projects to simple reallocation of resources. The goal of portfolio adjustments is to maximise continued progress toward achieving strategy by ensuring that resources are applied to the most strategically relevant projects that have a reasonable chance of successful completion. While perhaps a last resort, deciding to terminate a project is not an admission of defeat, but rather a proactive step to help achieve strategic objectives. Identifying when a project no longer contributes to achieving objectives, or has minimal chance of successful completion, is better accomplished as early as possible to prevent misuse of scarce resources that could otherwise be applied to projects providing more strategic value. Terminating a project results in a change to the portfolio’s total benefit and may necessitate reevaluation. Note that not all changes to portfolio membership result in changes to portfolio
20
baselines; the organisation may wish to report performance against original targets rather than readjusting them. Changes to the portfolio due to changes in strategy The priorities of the objectives and the priorities (or relative strategic benefit) of the alternatives are relative ratio-scale numbers that are only meaningful as long as the organisational strategy remains the same or the magnitude of the change is small enough that executives do not feel that reprioritising objectives is required; and only as long as the set of prioritised portfolio candidates, whether funded or not, remains the same. When the strategy changes significantly, or new objectives are introduced, reprioritisation is required; this not only changes the relative priorities of the objectives and sub-objectives; it changes the relative priorities of the alternatives that support them, as well. Such a change in strategy may also necessitate the introduction of new projects into the portfolio selection process. Summary and Conclusion This article describes a potential solution to the challenge of establishing and evaluating project and portfolio strategic performance that goes beyond the traditional reliance on cost, schedule and quality. Sanchez and Robert (2010) describe measuring portfolio strategic performance using key performance indicators to determine the contribution of projects to objectives and the performance of individual projects during execution. They propose a network of objectives and projects and suggest using AHP or scoring models to establish relative benefit, measuring achievement periodically, and using a dashboard to report results (Sanchez, 2010). They recommend that a tool be developed to integrate these concepts. In their PMI Research Conference paper on integrating project and portfolio performance measures, Anbari, Cioffi and Forman ask, in part, “what are the currently anticipated benefits” (Anbari, 2010); they take a similar approach to that described in this paper but do not address how to assess changes in relative strategic benefit. Levine (2005, p. 100) acknowledges risk and uncertainty and advises that project and portfolio benefit be considered in terms of risk, but does not address how changes in uncertainty can be used to measure strategic performance. This article has described how project performance information could be combined to produce portfolio performance measurements that reflect strategic benefit. We proposed a specific approach to synthesise individual project performance measurements and relative strategic benefit to produce strategic portfolio level performance metrics, and showed how to visually illustrate them in a dashboard that displays project and portfolio performance with respect to the strategic objectives they support. We have used AHP and tools from Expert Choice, Inc. that integrate the concepts mentioned by Sanchez and address the question asked by Anbari. With this information, managers can make proactive decisions about necessary adjustment of projects within the portfolio, or the portfolio as a whole. While the approach discussed in this article provides a method for measuring and evaluating portfolio performance against strategic benefits, this alone is insufficient to predict the probability of success in delivering these benefits. In selecting the optimal portfolio subject to constraints, the organisation has chosen the combination of projects that provides the highest total anticipated or expected benefit. Once selected and implemented, there are no guarantees that the total expected benefit of the portfolio or that of individual projects will remain static as

21
the portfolio moves through implementation. Benefits can change due to reevaluation when the organisation’s strategy changes, or when more promising project candidates come along, resulting in reprioritisation and reselection, or major adjustments to the portfolio. In addition, estimates and assumptions made within the business cases prior to portfolio selection may prove to be vastly under- or overstated, representing greater risk or opportunity than foreseen at the time of selection. Actual delivery of benefit does not generally occur until after projects or major phases are completed and transitioned to operations. Strategic performance metrics can indicate the degree to which projects and portfolios in flight remain on track to deliver the strategic benefit for which they were selected. However, project relative benefit also can change even while the strategy and list of portfolio candidates remains constant for a period of time, due to risk or opportunity events that negatively or positively affect projects and thus, in aggregate, performance of the portfolio. A means to account for strategic performance during and after such changes must be devised to continue measuring the portfolio’s strategic performance. The authors are researching methods to adapt and extend the concepts proposed in this article into methods to predict continued expectation of delivery of strategic benefit for projects and portfolios during and after execution.
References Anbari, F. T., Cioffi, B. F., & Forman, E. H. (2010, July). Integrating performance measures to exert effective
leadership in managing project portfolios. Paper presented at PMI Research Conference, Washington, DC. Bible, Michael J., Bivins, Susan S. (2011). Mastering Project Portfolio Management: A Systems Approach to
Achieving Strategic Objectives. Fort Lauderdale, Florida. J Ross Publishing, Inc. BibleForman, E.H, & Selly, M.A. (2001). Decision by objectives. River Edge, NJ: World Scientific Pub Co Inc. Reproduced with permission from World Scientific Publishing Co. Pte. Ltd. Forman, E.H (2008). (Professor, The George Washington University). Project Prioritisation and Portfolio
Management, Lecture 3. Washington, DC. [PowerPoint]. Hogarth, Robin (1987). Judgment and Choice, New York, NY. John Wiley & Sons. Kerzner, Kerzner, H. (2006). Project management, a systems approach to planning, scheduling, and controlling.
Hoboken, NJ. John Wiley & Sons. Levine, H. (2005). Project portfolio management. San Francisco, CA: Jossey-Bass. Meredith, J.R. & Mantel, S.J. (2006). Project Management – A Managerial Approach (6th Ed). New Jersey: John
Wiley & Sons. Miller, GA. (1994). The Magical number seven, plus or minus two: some limits on our capacity for processing
information. Psychological Review, 101(2), 343-352. Nisenboim, Shawn (2002). The Practical Use of Earned Value, Available:
http://www.timetiger.com/practicalev.asp (Accessed October 31, 2010) Project Management Institute (PMI), (2008). The Guide to the Project Management Body of Knowledge (PMBOK®
Guide), Fourth Edition. Saaty, T.L. (1980). The Analytic Hierarchy Process: Planning, Priority Setting, Resource Allocation. New York,
NY. McGraw Hill, Reprinted by RWS Publications, Pittsburgh, PA, (1996). Saaty, T.L. (2008). ‘Decision making with the analytic hierarchy process’, Int. J. Services Sciences, Vol. 1, No. 1,
pp. 83–98, Available: http://colorado.edu/geography/leyk/geog_5113/readings/saaty_2008.pdf (Accessed 03/21/2012).
Sanchez, H., & Robert, B. (2010). Measuring portfolio strategic performance using key performance indicators. Project Management Journal, Vol. 41 No. 5, 64-73. doi: 10.1002/pmj.20165
Simon, Herbert A. (1960). "The New Science of Management Decision", New York, N.Y. Harper Brothers. Whyte, LL. (1969). Hierarchical Structures, New York, N.Y., American Elsevier. Trochim, William M., The Research Methods Knowledge Base, 2nd Edition. Available:
http://www.socialresearchmethods.net/kb/ (Accessed 10/20/2006).

22
Urban Dictionary (2012). Available: http://www.urbandictionary.com/define.php?term=BOGSAT (Accessed 04/03/2012).
Wallenius, J., Dyer, J. S., Fishburn, P. C., steuer, R. E., Ziont, S., & Deb, K. (2008). Multiple criteria decision making, multiattribute utility theory: recent accomplishments and what lies ahead. Management Science, Vol. 54 No. 7, 1336-1349.