Embed Size (px)
Citation preview
Evaluating the core microbiota in complexcommunities: A systematic investigation
Carmen Astudillo-Garc�ıa,1,2 James J. Bell,3
Nicole S. Webster,4 Bettina Glasl,5
Jamaluddin Jompa,6 Jose M. Montoya7 and
Michael W. Taylor1,8*1School of Biological Sciences, University of Auckland,
Auckland, New Zealand.2Institute of Marine Science, University of Auckland,
Auckland, New Zealand.3School of Biological Sciences, Victoria University of
Wellington, Wellington, New Zealand.4Australian Institute of Marine Science, Townsville,
Australia.5AIMS@JCU, Australian Institute of Marine Science,
College of Science and Engineering, James Cook
University, Townsville, Australia.6Research and Development Centre on Marine, Coastal
and Small Islands, Hasanuddin University, Makassar,
Indonesia.7Ecological Networks and Global Change Group,
Experimental and Theoretical Ecology Station,
CNRS-University Paul Sabatier, Moulis, France.8Maurice Wilkins Centre for Molecular Biodiscovery,
University of Auckland, Auckland, New Zealand.
Summary
The study of complex microbial communities
poses unique conceptual and analytical challenges,
with microbial species potentially numbering in the
thousands. With transient or allochthonous microor-
ganisms often adding to this complexity, a ‘core’
microbiota approach, focusing only on the stable and
permanent members of the community, is becoming
increasingly popular. Given the various ways of
defining a core microbiota, it is prudent to examine
whether the definition of the core impacts upon the
results obtained. Here we used complex marine
sponge microbiotas and undertook a systematic eval-
uation of the degree to which different factors used
to define the core influenced the conclusions.
Significant differences in alpha- and beta-diversity
were detected using some but not all core definitions.
However, findings related to host specificity and envi-
ronmental quality were largely insensitive to major
changes in the core microbiota definition. Further-
more, none of the applied definitions altered our
perception of the ecological networks summarising
interactions among bacteria within the sponges.
These results suggest that, while care should still be
taken in interpretation, the core microbiota approach
is surprisingly robust, at least for comparing micro-
biotas of closely related samples.
Introduction
Microbial communities in nature are often highly complex,
comprising hundreds or even thousands of species across
a diverse array of taxa. Exemplary in this regard are the
microbiotas of soil (Ramirez et al., 2014), the human gut
(B€ackhed et al., 2012; Huse et al., 2012) and marine inver-
tebrates such as sponges (Thomas et al., 2016). Each of
these ecosystems harbours members of the Bacteria,
Archaea and Eukarya domains, as well as innumerable
viruses (Fierer et al., 2007; Taylor et al., 2007; Arumugam
et al., 2011; Laffy et al., 2016). Such complexity poses for-
midable conceptual and analytical challenges, with each
ecosystem member potentially capable of interacting with
all others. These challenges are further amplified when
one considers transient or allochthonous community mem-
bers (Savage, 1977), which may contribute little to the
functionality of the system but are still detected by today’s
sensitive molecular approaches. The concept of a ‘core’
microbiota, which only considers persistent (and some-
times abundant) members of a microbial community, has
thus garnered increasing research attention (Shade and
Handelsman, 2012).
Consideration of the core microbiota may be particularly
beneficial in the study of host-microbe associations. Some
holobiont associations involve highly specific partnerships
between a single host and a single microbe, such as the
well-known mutualism between the squid Euprymna sco-
lopes and the bioluminescent bacterium Vibrio fischeri
(Nyholm and McFall-Ngai, 2004). These relatively ‘simple’
symbiotic systems have provided many unique insights
Received 27 June, 2016; revised 14 December, 2016; accepted 15December, 2016. *For correspondence: E-mail [email protected]; Tel. 164 9 3737599 x82280; Fax 164 9 3737416.
VC 2017 Society for Applied Microbiology and John Wiley & Sons Ltd
Environmental Microbiology (2017) 19(4), 1450–1462 doi:10.1111/1462-2920.13647
into the mechanisms of interaction; however, more com-
plex systems involving a greater number of participants
are ubiquitous in nature. In this context, host-microbe inter-
action networks offer fascinating insights into the ecology
and evolution of symbiosis due to the key role these taxo-
nomically diverse microbial communities play within their
hosts. Among the most commonly studied host-microbe
interaction systems are those comprised of vertebrates
and their gut microbes which play an important role in host
nutrition and pathogen defence. Such interactions have
been described for fishes (Sullam et al., 2012), birds
(Waite and Taylor, 2014), reptiles (Martin et al., 2010) and
mammals (Ley et al., 2008), as well as being a primary
focus of research in humans (Turnbaugh et al., 2007; Ham-
ady and Knight, 2009; Shafquat et al., 2014). The Human
Microbiome Project utilised a core species approach to
identify stable and consistent associations, facilitating the
identification of correlations between changes in the micro-
biota and human health (Turnbaugh et al., 2007; Hamady
and Knight, 2009; Huse et al., 2012).
Invertebrates have also been the focus of research into
host-microbe interactions, both in terrestrial (e.g. insects
(Dillon and Dillon, 2004)) and marine (e.g. corals (Bourne
et al., 2016)) ecosystems. In marine systems, the hosts
are in direct contact with seawater and the myriad of micro-
organisms within it. Hence, evaluating the host microbiota
demands consideration of potential transient organisms,
including those serving as food for prodigious filter feeders
such as ascidians and marine sponges. Many sponges
harbour highly diverse and abundant microbial communi-
ties (Taylor et al., 2007; Hentschel et al., 2012; Thomas
et al., 2016), which can comprise up to 35% of sponge bio-
mass and whose collective genomes ultimately define the
sponge’s phenotype (Webster and Thomas, 2016). The
nature of the relationship between sponges and microbes
ranges from pathogens/parasites (Webster et al., 2002;
Webster, 2007) to mutualistic symbionts (Freeman et al.,
2013). However, the great complexity of the marine sponge
microbiota poses challenges when one considers the
entire microbial community, as microbial species may num-
ber in the thousands (Webster et al., 2010; Thomas et al.,
2016). One way to approach this challenge is to identify
and analyse core species; that is, persistent and abundant
species (Magurran and Henderson, 2003) either through
time or among different environments, hosts or geographic
locations.
We hypothesise that detection of changes in highly
diverse systems, such as the marine sponge microbiota,
may be affected by noise arising from this very diversity,
only revealing true patterns when permanent and stable
units, i.e. the core microbiota, are considered. Here we
test this hypothesis by applying different core microbiota
definitions to study the influence of environmental quality
and sponge species identity on the sponge microbiota.
Although some definitions of the core microbiota did lead
to significant differences among groups of samples, our
overall findings were remarkably resistant to the particular
core microbiota definition which was applied.
Results and discussion
Given the increasingly widespread use of the core micro-
biota concept in microbial systems including the human
gut (Hamady and Knight, 2009; Huse et al., 2012; Zhang
et al., 2014; Cheng et al., 2016), plant roots (Lundberg
et al., 2012; Yeoh et al., 2016) and marine invertebrates
(Schmitt et al., 2012; Ainsworth et al., 2015; Thomas et al.,
2016), it is prudent to examine whether the definition of the
core microbiota may impact the results obtained (and
therefore the conclusions drawn) from a study. To achieve
this, we analysed the high-diversity microbial communities
of three closely related species of the marine sponge
genus Xestospongia, which hosts microbes spanning 14
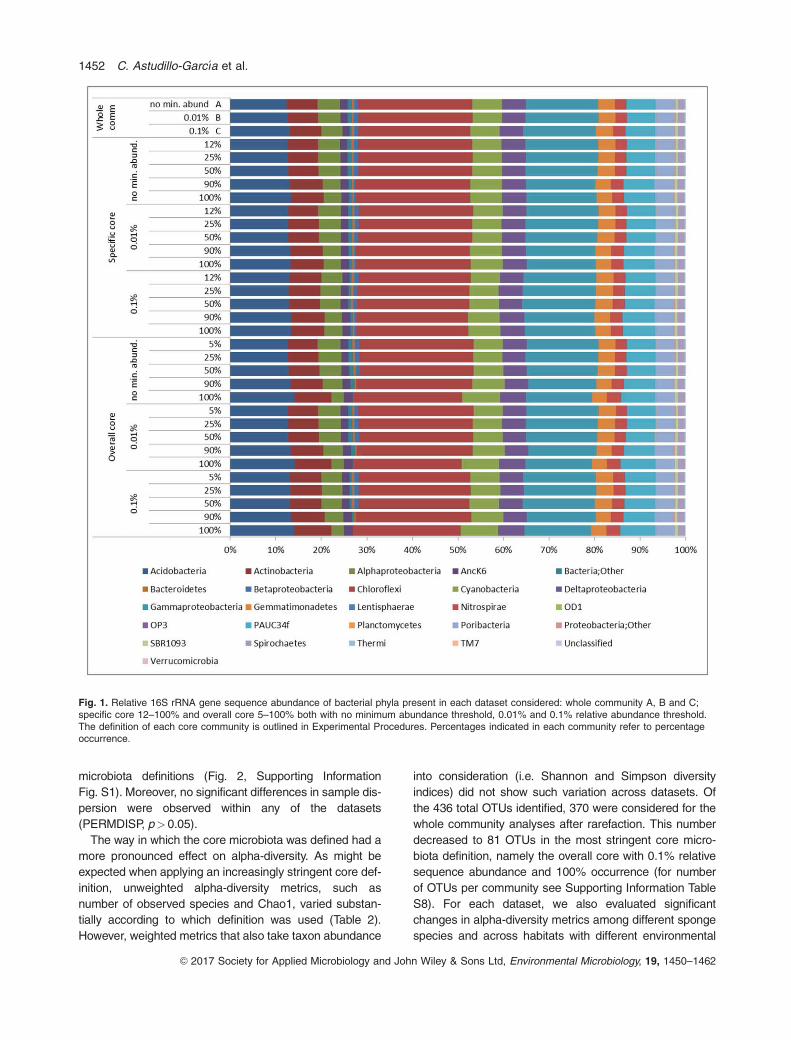
bacterial phyla and 8 candidate phyla (Fig. 1). These anal-
yses were conducted within the broader – and highly
topical – ecological framework of determining how micro-
biotas respond to variation in environmental quality
(C�ardenas et al., 2014; Zeglin, 2015).
Robustness of the core microbiota approach
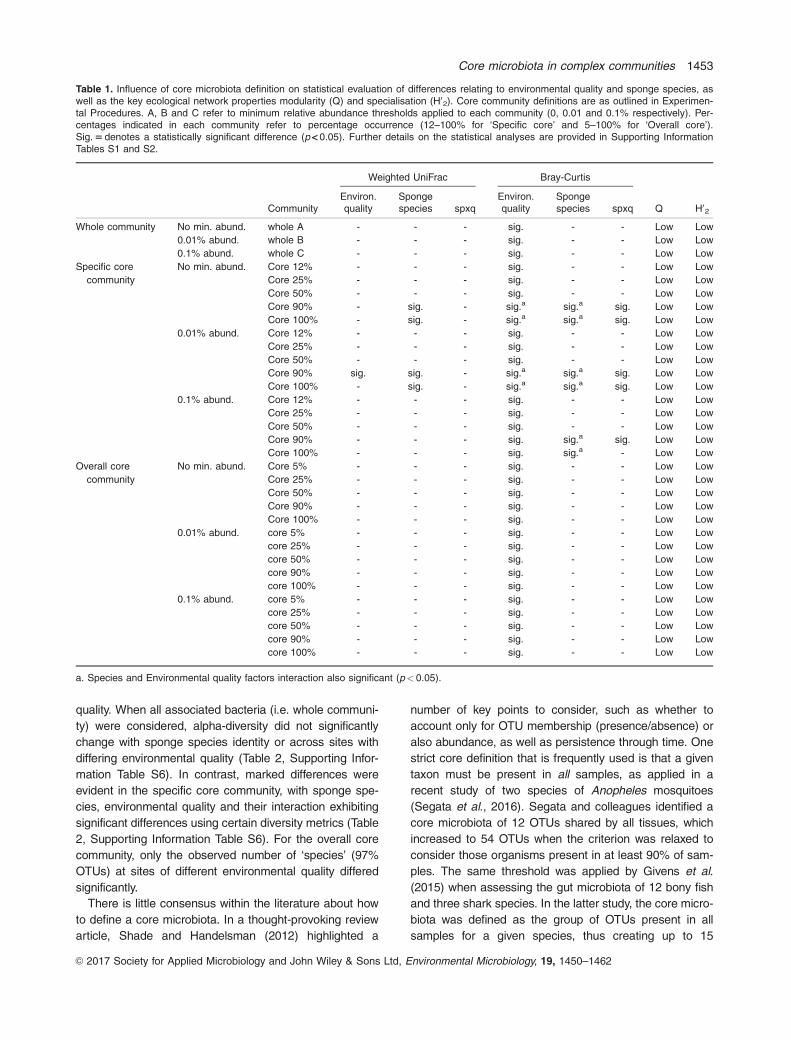
Overall, we found that even very substantial changes to
the core microbiota definition did not overtly influence find-
ings of beta-diversity within the Xestospongia spp.
microbiota (Table 1, Supporting Information Tables S1 and
S2). Indeed, for many of the applied core definitions, even
varying the percentage occurrence from 12% to 100% had
negligible effect on the results obtained. This was particu-
larly true for the ‘overall core’ communities, although there
were some beta-diversity differences among the more
stringent (90% and 100% core definitions) ‘specific core’
communities. Such stringent, species-specific criteria
inherently select for OTUs exclusively associated with
each host species, with the risk of artificially inflating differ-
ences between the respective microbiotas. In contrast to
the robustness of core definition, choice of diversity metric
had a larger effect, at least when examining the influence
of environmental quality. With use of the Bray-Curtis dis-
similarity metric, a significant effect of environment was
obtained irrespective of core definition, whereas for weighted
UniFrac only one out of the 33 community types yielded
a significant result (Table 1, Supporting Information Tables
S1 and S2. For pairwise comparisons see Supporting
Information Tables S3–S5). However, the two metrics were
more similar (though not identical) when examining the
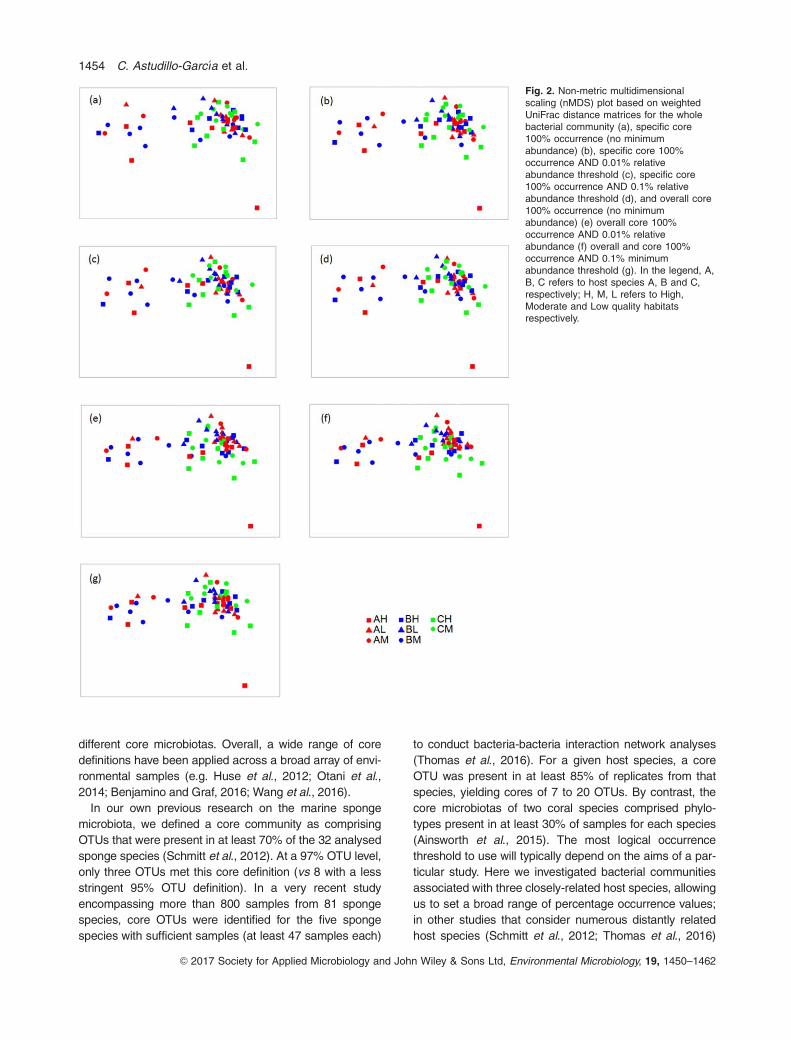
effect of sponge species. nMDS ordination did not reveal
specific groupings corresponding to host species identity
or environmental quality for any of the applied core
Core microbiota in complex communities 1451
VC 2017 Society for Applied Microbiology and John Wiley & Sons Ltd, Environmental Microbiology, 19, 1450–1462
microbiota definitions (Fig. 2, Supporting Information
Fig. S1). Moreover, no significant differences in sample dis-
persion were observed within any of the datasets
(PERMDISP, p>0.05).
The way in which the core microbiota was defined had a
more pronounced effect on alpha-diversity. As might be
expected when applying an increasingly stringent core def-
inition, unweighted alpha-diversity metrics, such as
number of observed species and Chao1, varied substan-
tially according to which definition was used (Table 2).
However, weighted metrics that also take taxon abundance
into consideration (i.e. Shannon and Simpson diversity
indices) did not show such variation across datasets. Of
the 436 total OTUs identified, 370 were considered for the
whole community analyses after rarefaction. This number
decreased to 81 OTUs in the most stringent core micro-
biota definition, namely the overall core with 0.1% relative
sequence abundance and 100% occurrence (for number
of OTUs per community see Supporting Information Table
S8). For each dataset, we also evaluated significant
changes in alpha-diversity metrics among different sponge
species and across habitats with different environmental
Fig. 1. Relative 16S rRNA gene sequence abundance of bacterial phyla present in each dataset considered: whole community A, B and C;specific core 12–100% and overall core 5–100% both with no minimum abundance threshold, 0.01% and 0.1% relative abundance threshold.The definition of each core community is outlined in Experimental Procedures. Percentages indicated in each community refer to percentageoccurrence.
1452 C. Astudillo-Garc�ıa et al.
VC 2017 Society for Applied Microbiology and John Wiley & Sons Ltd, Environmental Microbiology, 19, 1450–1462
quality. When all associated bacteria (i.e. whole communi-
ty) were considered, alpha-diversity did not significantly
change with sponge species identity or across sites with
differing environmental quality (Table 2, Supporting Infor-
mation Table S6). In contrast, marked differences were
evident in the specific core community, with sponge spe-
cies, environmental quality and their interaction exhibiting
significant differences using certain diversity metrics (Table
2, Supporting Information Table S6). For the overall core
community, only the observed number of ‘species’ (97%
OTUs) at sites of different environmental quality differed
significantly.
There is little consensus within the literature about how
to define a core microbiota. In a thought-provoking review
article, Shade and Handelsman (2012) highlighted a
number of key points to consider, such as whether to
account only for OTU membership (presence/absence) or
also abundance, as well as persistence through time. One
strict core definition that is frequently used is that a given
taxon must be present in all samples, as applied in a
recent study of two species of Anopheles mosquitoes
(Segata et al., 2016). Segata and colleagues identified a
core microbiota of 12 OTUs shared by all tissues, which
increased to 54 OTUs when the criterion was relaxed to
consider those organisms present in at least 90% of sam-
ples. The same threshold was applied by Givens et al.
(2015) when assessing the gut microbiota of 12 bony fish
and three shark species. In the latter study, the core micro-
biota was defined as the group of OTUs present in all
samples for a given species, thus creating up to 15
Table 1. Influence of core microbiota definition on statistical evaluation of differences relating to environmental quality and sponge species, aswell as the key ecological network properties modularity (Q) and specialisation (H02). Core community definitions are as outlined in Experimen-tal Procedures. A, B and C refer to minimum relative abundance thresholds applied to each community (0, 0.01 and 0.1% respectively). Per-centages indicated in each community refer to percentage occurrence (12–100% for ‘Specific core’ and 5–100% for ‘Overall core’).Sig. 5 denotes a statistically significant difference (p < 0.05). Further details on the statistical analyses are provided in Supporting InformationTables S1 and S2.
Weighted UniFrac Bray-Curtis
CommunityEnviron.quality
Spongespecies spxq
Environ.quality
Spongespecies spxq Q H02
Whole community No min. abund. whole A - - - sig. - - Low Low
0.01% abund. whole B - - - sig. - - Low Low
0.1% abund. whole C - - - sig. - - Low Low
Specific core
community
No min. abund. Core 12% - - - sig. - - Low Low
Core 25% - - - sig. - - Low Low
Core 50% - - - sig. - - Low Low
Core 90% - sig. - sig.a sig.a sig. Low Low
Core 100% - sig. - sig.a sig.a sig. Low Low
0.01% abund. Core 12% - - - sig. - - Low Low
Core 25% - - - sig. - - Low Low
Core 50% - - - sig. - - Low Low
Core 90% sig. sig. - sig.a sig.a sig. Low Low
Core 100% - sig. - sig.a sig.a sig. Low Low
0.1% abund. Core 12% - - - sig. - - Low Low
Core 25% - - - sig. - - Low Low
Core 50% - - - sig. - - Low Low
Core 90% - - - sig. sig.a sig. Low Low
Core 100% - - - sig. sig.a - Low Low
Overall core
community
No min. abund. Core 5% - - - sig. - - Low Low
Core 25% - - - sig. - - Low Low
Core 50% - - - sig. - - Low Low
Core 90% - - - sig. - - Low Low
Core 100% - - - sig. - - Low Low
0.01% abund. core 5% - - - sig. - - Low Low
core 25% - - - sig. - - Low Low
core 50% - - - sig. - - Low Low
core 90% - - - sig. - - Low Low
core 100% - - - sig. - - Low Low
0.1% abund. core 5% - - - sig. - - Low Low
core 25% - - - sig. - - Low Low
core 50% - - - sig. - - Low Low
core 90% - - - sig. - - Low Low
core 100% - - - sig. - - Low Low
a. Species and Environmental quality factors interaction also significant (p< 0.05).
Core microbiota in complex communities 1453
VC 2017 Society for Applied Microbiology and John Wiley & Sons Ltd, Environmental Microbiology, 19, 1450–1462
different core microbiotas. Overall, a wide range of core
definitions have been applied across a broad array of envi-
ronmental samples (e.g. Huse et al., 2012; Otani et al.,
2014; Benjamino and Graf, 2016; Wang et al., 2016).
In our own previous research on the marine sponge
microbiota, we defined a core community as comprising
OTUs that were present in at least 70% of the 32 analysed
sponge species (Schmitt et al., 2012). At a 97% OTU level,
only three OTUs met this core definition (vs 8 with a less
stringent 95% OTU definition). In a very recent study
encompassing more than 800 samples from 81 sponge
species, core OTUs were identified for the five sponge
species with sufficient samples (at least 47 samples each)
to conduct bacteria-bacteria interaction network analyses
(Thomas et al., 2016). For a given host species, a core
OTU was present in at least 85% of replicates from that
species, yielding cores of 7 to 20 OTUs. By contrast, the
core microbiotas of two coral species comprised phylo-
types present in at least 30% of samples for each species
(Ainsworth et al., 2015). The most logical occurrence
threshold to use will typically depend on the aims of a par-
ticular study. Here we investigated bacterial communities
associated with three closely-related host species, allowing
us to set a broad range of percentage occurrence values;
in other studies that consider numerous distantly related
host species (Schmitt et al., 2012; Thomas et al., 2016)
Fig. 2. Non-metric multidimensionalscaling (nMDS) plot based on weightedUniFrac distance matrices for the wholebacterial community (a), specific core100% occurrence (no minimumabundance) (b), specific core 100%occurrence AND 0.01% relativeabundance threshold (c), specific core100% occurrence AND 0.1% relativeabundance threshold (d), and overall core100% occurrence (no minimumabundance) (e) overall core 100%occurrence AND 0.01% relativeabundance (f) overall and core 100%occurrence AND 0.1% minimumabundance threshold (g). In the legend, A,B, C refers to host species A, B and C,respectively; H, M, L refers to High,Moderate and Low quality habitatsrespectively.
1454 C. Astudillo-Garc�ıa et al.
VC 2017 Society for Applied Microbiology and John Wiley & Sons Ltd, Environmental Microbiology, 19, 1450–1462
this may be less appropriate, as the number of shared
OTUs may be much lower.
Here, we included a range of core microbiota definitions
for our comparison, some of which take into account the
relative abundance of individual OTUs and/or the percent-
age occurrence, while others do not. It is important to
acknowledge the arbitrary nature of any core microbiota
definition. Whilst it is not our intention here to advocate for
a particular core definition, we draw attention to the poten-
tial for disparate conclusions when different definitions are
applied, and encourage adopters of the core microbiota
approach to explore the sensitivity of their data to the vari-
ous definitions of ‘core’.
Networking symbionts: elucidating interactions within themarine sponge holobiont
Despite the ubiquity of interactions between prokaryotes
and other species present in a given environment, ecologi-
cal links between eukaryotes and prokaryotes have been
poorly studied (Ings et al., 2009). This knowledge gap cer-
tainly extends to the interactions between marine sponges
and their associated microbial communities. Other ecosys-
tems rivalling in complexity to host-bacteria multispecies
interactions tend to be dominated by specialist species,
with a small number of generalists (Montoya et al., 2006;
Bascompte, 2009; Bj€ork et al., 2013). However, our results
showed a low degree of specialism at the network level
(Table 1; Supporting Information Table S7), much lower
than what has been reported for free-living mutualistic net-
works, including pollination and seed dispersal networks,
and ant-myrmecophyte and ant-nectar plant interaction
systems (Bl€uthgen et al., 2007). Our network results are
consistent with those of Thomas and colleagues (Thomas
et al., 2016), in that their core sponge microbiotas were
stable and characterized by generalist symbionts exhibiting
amensal and/or commensal interactions. The low degree
of specialism found in our study indicates that OTUs pre-
sent in these communities are not particularly host
selective, and that host-microbe networks allow for more
generalism to occur than in other ecological networks. In
addition, while multivariate analyses identified significant
differences (depending on core community definition and
diversity metric considered) between bacterial communi-
ties from different host species and different environmental
conditions, deeper ecological network analyses revealed
that these differences were not mapped into the existence
of network modules or compartments (Table 1; Supporting
Information Table S7). Network visualisation of core com-
munities showed that the OTUs comprising these cores
were distributed across all sponge species, across sites of
different environmental quality and among each sponge
species within each quality site (see representative exam-
ples in Supporting Information Fig. S2). The use of
different core community definitions had negligible effects
on the outcomes of these ecological network analyses
(Table 1, Supporting Information Table S7). Other ecologi-
cal networks, in particular food webs (Ings et al., 2009;
Th�ebault and Fontaine, 2010) and host-phage networks
(Flores et al., 2011), are highly modular, and functional
group diversity tends to increase with modularity in food
webs (Montoya et al., 2015). The failure to detect any such
modules in our sponge-associated bacterial community
network suggests that, in addition to the low degree of spe-
cialism, the system may not have a well-defined network
structure. Our study, however, focused on phylogenetically
closely related host species, so both generalism and lack
of modularity is likely to occur. Closely related sponge
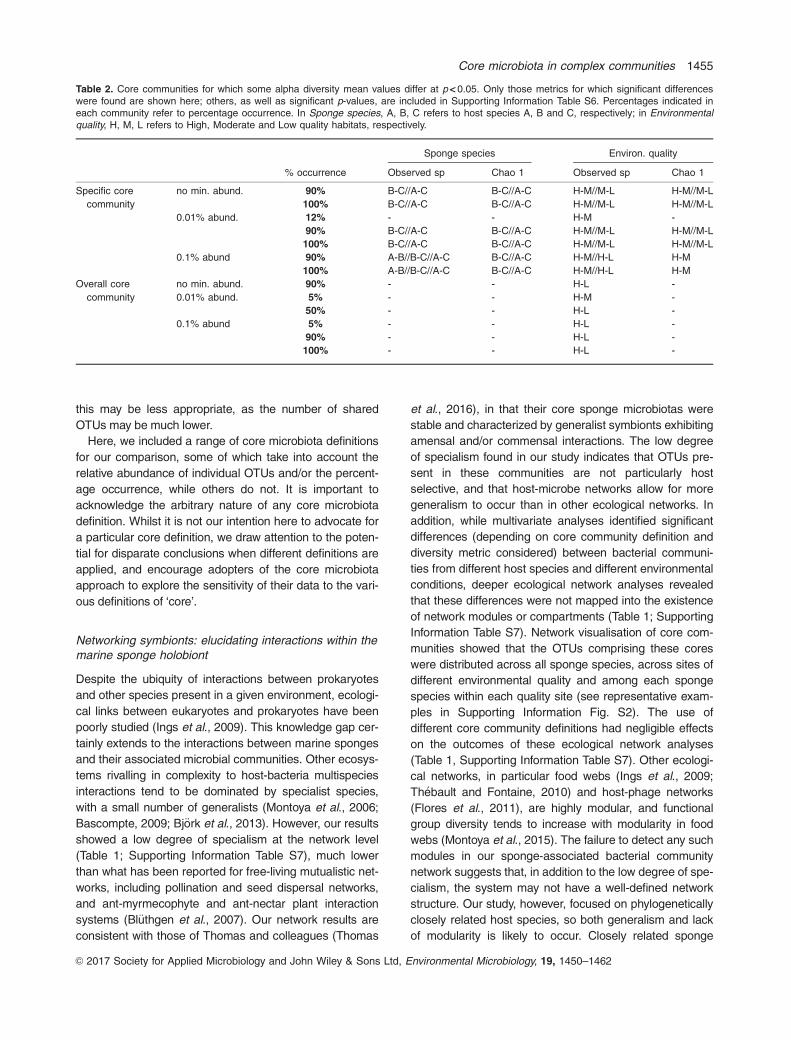
Table 2. Core communities for which some alpha diversity mean values differ at p < 0.05. Only those metrics for which significant differenceswere found are shown here; others, as well as significant p-values, are included in Supporting Information Table S6. Percentages indicated ineach community refer to percentage occurrence. In Sponge species, A, B, C refers to host species A, B and C, respectively; in Environmentalquality, H, M, L refers to High, Moderate and Low quality habitats, respectively.
Sponge species Environ. quality
% occurrence Observed sp Chao 1 Observed sp Chao 1
Specific core
community
no min. abund. 90% B-C//A-C B-C//A-C H-M//M-L H-M//M-L
100% B-C//A-C B-C//A-C H-M//M-L H-M//M-L
0.01% abund. 12% - - H-M -
90% B-C//A-C B-C//A-C H-M//M-L H-M//M-L
100% B-C//A-C B-C//A-C H-M//M-L H-M//M-L
0.1% abund 90% A-B//B-C//A-C B-C//A-C H-M//H-L H-M
100% A-B//B-C//A-C B-C//A-C H-M//H-L H-M
Overall core
community
no min. abund. 90% - - H-L -
0.01% abund. 5% - - H-M -
50% - - H-L -
0.1% abund 5% - - H-L -
90% - - H-L -
100% - - H-L -
Core microbiota in complex communities 1455
VC 2017 Society for Applied Microbiology and John Wiley & Sons Ltd, Environmental Microbiology, 19, 1450–1462
species commonly harbour similar microbial communities.
For instance, analysis of full-length 16S rRNA gene
sequences derived from two geographically distant Xesto-
spongia species (X. muta and X. testudinaria) revealed
similar bacterial community structures (Montalvo and Hill,
2011), and the microbiotas of two Ircinia species (I. fasci-
culata and I. variabilis) were also found to be highly similar
(Erwin et al., 2012). This relationship between bacterial
community similarity and sponge phylogenetic relatedness
has also been observed at higher taxonomic levels, for
example, within the family Geodiidae (Sch€ottner et al.,
2013). However, factors specific to each host (e.g. nutrient
levels, depth, morphology, internal structure of the sponge)
may also influence the associated microbial community.
Thomas et al. (2016) showed that most sponge species
maintained low variability within communities, thus indicat-
ing a selective habitat at the host species level. Greater
selection of microbes by hosts leading to high specialisa-
tion is observed among unrelated host species (e.g. Bj€ork
et al., 2013), and thus we can hypothesise that host relat-
edness modulates specificity in host-microbe systems.
Host species, environmental quality and theXestospongia spp. microbiota
The dominant bacterial phyla found within Xestospongia
spp. in this study reflected those commonly reported for
marine sponges, namely Proteobacteria (Gamma-, Delta-
and Alphaproteobacteria), Chloroflexi, Acidobacteria, Acti-
nobacteria, Cyanobacteria and the candidate phylum
PAUC34f (Fig. 1). Many of these phyla feature so-called
sponge-specific (SC) and sponge-and-coral-specific
(SCC) clusters (Hentschel et al., 2002; Taylor et al., 2007;
Simister et al., 2012b). While not found exclusively within
sponges (Webster et al., 2010; Taylor et al., 2013), the
microorganisms represented by such clusters do tend to
be heavily enriched in sponges (and corals). Within both
the entire community and the core microbiota, we
observed similar patterns for these clusters to those
described above for analyses of alpha- and beta-diversity
metrics. The percentage of OTUs assigned to SC and, to a
lesser extent, SCC was higher when considering the core
microbiota (Supporting Information Table S8). This is con-
sistent with other studies that described these clusters as
a stable and persistent group of microorganisms, which
were much more highly represented in sponges than in
other, non-sponge habitats (Hentschel et al., 2002; Simi-
ster et al., 2012a; Bj€ork et al., 2013).
In order to explore the Xestospongia spp. microbiota in
more detail, we also conducted an indicator value analysis
(IndVal) to identify key OTUs that significantly discriminate
between different sample types (Supporting Information
Table S9; Fig. S3). A total of seven OTUs, affiliated with
Acidobacteria, Bacteroidetes, ‘Poribacteria’ and Alpha-
and Gammaproteobacteria, differentiated between the dif-
ferent sponge species, although there was only one strict
indicator per host species. A total of 29 OTUs affiliated
with Acidobacteria, Actinobacteria, Bacteroidetes, Chloro-
flexi, Cyanobacteria, Gemmatimonadetes, ‘Poribacteria’
and Alpha-, Delta- and Gammaproteobacteria, were addi-
tionally identified as indicators of environmental quality. Of
these, three and 13 strict indicators were associated with
high and low quality sites, respectively. No indicator OTU
was found exclusively for moderate quality (Supporting
Information Table S9; Fig. S3). While we did not employ
the IndVal approach for defining a core microbiota, in cer-
tain contexts this may also be useful and warrants further
investigation.
Concluding remarks
A focus on the core microbiota can facilitate discrimination
of the stable and permanent members of a microbial com-
munity. Here we evaluated the impact of different core
microbiota definitions when interrogating highly diverse
microbial systems. While due caution must be exercised
when defining core communities, overall results are rela-
tively insensitive to changing core definitions. Analysis of
the core microbiota of closely related Xestospongia spp.
found that OTUs present in these communities exhibit a
high level of generalism and vary with the environmental
quality of their habitat.
Experimental procedures
In order to test our hypothesis about the core microbiota, we
generated a sample dataset comprising three closely related
species of marine sponge that occur across a gradient of envi-
ronmental quality.
Sample collection and processing
Samples from three putatively different sponge species (spe-
cies A, B and C) within the genus Xestospongia were
collected at the Wakatobi Marine National Park, in southeast
Sulawesi, Indonesia, in June 2012. These three Xestospongia
species are considered to be cryptic species based on their
assignment to three genetic groups using microsatellite data
(see Bell et al., 2014). A similar pattern of cryptic speciation
has also been shown for other local Xestospongia species
with the use of mitochondrial markers (Setiawan et al., 2016).
Samples of the three species in our study were collected from
sites experiencing different environmental conditions based
on observations of live coral presence, water turbidity, fish
abundance and distance to human populations, as previously
described (McMellor and Smith, 2010; Bell et al., 2014; Powell
et al., 2014). Seven sites were used based on their environ-
mental conditions, ranging from high (Kerang Gurita and
Tomea 2) to low (Wanci Harbour and Sampela) quality areas,
together with sites of intermediate quality (Kaladupa Double
Spur, the Ridge, and Tomea 1) (Supporting information Table
1456 C. Astudillo-Garc�ıa et al.
VC 2017 Society for Applied Microbiology and John Wiley & Sons Ltd, Environmental Microbiology, 19, 1450–1462
S10). Each sponge species was collected from each site
(n 5 8 individuals per putative sponge species at each envi-
ronmental condition area), except for species C that was not
found at the lowest quality sites. Samples were preserved in
100% ethanol and stored at 48C until processing. Previous
research has shown that storage of sponge samples in abso-
lute ethanol is appropriate for subsequent assessment of
microbial communities (Reveillaud et al., 2014).
DNA extraction and PCR amplification
of 16S rRNA genes
Bacterial DNA extraction from approximately 30 mg of sponge
tissue was carried out using the PowerSoilVR -htp 96 Well Soil
DNA Isolation Kit, following the manufacturer’s protocol
(MoBio Inc., Carlsbad, CA, USA). DNA yield and quality were
evaluated using Nanodrop 2000 (Thermo Scientific) and
extracts were normalised to a concentration of 5 ng/mL prior to
PCR amplification. The hypervariable V4-V5 region of the 16S
rRNA gene was targeted using primers (533F and 907R) and
thermal cycling conditions optimised for the sponge microbiota
(Simister et al., 2012a; C�ardenas et al., 2014). Specific Illu-
mina adaptor nucleotide sequences were also added to the
primers. Correct-sized PCR products were purified using
AMPure XP beads (Agencourt). DNA was quantified using
Qubit, with DNA quality and quantity measured for a random
selection of samples using the Agilent Bioanalyzer 2100. A
second PCR to attach dual indices and Illumina sequencing
adaptors, as well as the subsequent amplicon sequencing,
was performed by the Centre for Genomics, Proteomics and
Metabolomics through NZ Genomics at the University of Auck-
land, using the MiSeq Illumina sequencing platform.
Sequence data were deposited in the NCBI Sequence Read
Archive under accession number SRP064500.
Sequence data processing
A total of 4,162,130 16S rRNA gene sequences were
processed using mothur (Schloss et al., 2009) to join demulti-
plexed paired-end reads and to conduct subsequent quality
trimming and data dereplication. After initial processing,
1,334,891 unique sequences were then considered for down-
stream analyses. The UPARSE pipeline (Edgar, 2013) was
used for de novo OTU-picking, using USEARCH_64 (Edgar,
2010) cluster_otu command to construct a set of OTU repre-
sentative sequences from the amplicon reads, with a 97%
similarity threshold. Detection and removal of putative chime-
ras was done with uchime_ref, using SILVA as the reference
database, identifying three chimeras among the 439 OTUs
previously defined. The original (fasta) file of joined sequences
was then mapped against the representative OTU sequences
to include abundance data into the dataset, using the
usearch_global command. The file created was converted to a
biom table using biom software (McDonald et al., 2012), with
–convert function, to run further analyses within QIIME 1.9
(Caporaso et al., 2010). Taxonomic assignment for each
sequence was performed using the RDP classifier in QIIME
1.9, with Greengenes (version 13.5) (DeSantis et al., 2006) as
the reference database. In addition, to evaluate the specificity
of the sponge-associated microbes, all OTUs were assessed
for their affiliation with previously defined sponge- or sponge-
coral – specific clusters (Simister et al, 2012b). Assignment to
such clusters was carried out as described previously (Taylor
et al., 2013).
Defining the core microbiota
A central aim of this study was to determine whether apply-
ing different definitions of the ‘core’ microbiota had an
influence on the results obtained. To do so we evaluated
the effect on the core communities of three factors for OTU
selection: (1) percentage of occurrence, i.e. the percentage
of samples in which an OTU has to be present in order to
be considered for further analysis; (2) a minimum relative
sequence abundance; and (3) the sample set used to cal-
culate (1). To resolve which factor had the largest effect,
we defined different core communities so that each of
these three factors could be isolated and examined
independently:
To evaluate the impact of percentage of occurrence, mini-
mum abundance threshold and sample set must be held
constant. To do so, we applied five different occurrence per-
centages to two different core definitions (‘specific core’ and
‘overall core’, see below).
To evaluate the impact of minimum abundance threshold,
the percentage of occurrence and sample set must be held
constant. To do so, we applied two different abundance
thresholds to the whole community dataset, and to the two
types of core definition.
To evaluate the impact of the sample set selection, one
must apply the same conditions, i.e. the same percentage of
occurrence and relative abundance threshold, to all datasets.
This is already covered with the analyses mentioned above.
To address the above, we generated and analysed 33 differ-
ent communities, namely:
Whole community, considering different relative abun-
dance thresholds
Whole community A – all detected bacterial OTUs were
included in the analysis.
Whole community B – only OTUs with �0.01% relative
sequence abundance across the entire dataset.
Whole community C – only OTUs with �0.1% relative
sequence abundance across the entire dataset.
Specific core community – we constructed 15 different
core microbiotas considering:
Only those OTUs that were present in �12% (1 sample),
25% (2), 50% (4), 90% (7) and 100% (8), of samples for a giv-
en sponge species/environmental quality combination (i.e. we
effectively created 8 different core microbiotas 5 one for each
combination and then combined all of them for the subsequent
analyses).
Only those OTUs with �0.01% relative sequence abun-
dance across the entire dataset AND that were present in
�12%, 25%, 50%, 90% and 100% samples for a given
sponge species/environmental quality combination.
Only those OTUs with �0.1% relative sequence abundance
across the entire dataset AND that were present in �12%,
25%, 50%, 90% and 100% samples for a given sponge spe-
cies/environmental quality combination.
Core microbiota in complex communities 1457
VC 2017 Society for Applied Microbiology and John Wiley & Sons Ltd, Environmental Microbiology, 19, 1450–1462
This definition of core microbiota is specific in the sense
that each treatment combination (of sponge species and envi-
ronmental quality category) has its own core microbiota,
based on occurrence - i.e., presence/absence – and in defini-
tions b. and c. also on abundance.
Overall core community – we constructed 15 core micro-
biotas considering:
Only those OTUs that were present in �5% (3 samples),
25% (16), 50% (32), 90% (58) and 100% (64) of all samples.
Only those OTUs with �0.01% relative sequence abun-
dance across the entire dataset PLUS each OTU had to be
present in �5%, 25%, 50%, 90% and 100% of samples.
Only those OTUs with �0.1% relative sequence abundance
across the entire dataset PLUS each OTU had to be present
in �5%, 25%, 50%, 90% and 100% of samples.
In this case, the definitions were based on both occurrence
and abundance across the overall community (64 samples),
thus defining different overall cores.
Two relative sequence abundance thresholds, of 0.01% and
0.1%, were chosen with the aim of retaining many rare taxa
but discarding transient bacteria and accounting for sequenc-
ing errors.
Data representing each of these community types were
selected from the original dataset, and all statistical analyses
and comparisons described below (with the exception of Indi-
cator Value Analyses) were conducted with the whole
community and all of the different core microbiota datasets.
Statistical analyses of sequence data
Bacterial community analyses and statistical tests were con-
ducted in QIIME 1.9. Alpha- and beta-diversity analyses were
conducted after sample normalisation. To normalise sequenc-
ing depth, different rarefaction thresholds were applied to the
different datasets (Supporting Information Table S9) to reflect
the lowest sequencing depth for each dataset.
For alpha-diversity, unweighted species-based measures
such as Chao1 (Chao, 1984) and number of observed spe-
cies, and weighted species-based measures such as
Shannon and Simpson diversity indices, were compared
among sites of contrasting environmental quality and across
sponge species. Beta-diversity analyses were based on both
Bray-Curtis (Bray and Curtis, 1957) and weighted UniFrac dis-
tance (Lozupone and Knight, 2005). The latter takes into
account both the lineages contained in each group and the rel-
ative abundance of each type of organism, thus revealing
community differences that are due to changes in relative tax-
on abundance. Both weighted UniFrac and Bray-Curtis
distance matrices were used to draw non-metric multidimen-
sional scaling (nMDS) ordinations and to conduct
permutational analyses of variance (PERMANOVA) (Ander-
son, 2001). PERMANOVA analyses were conducted in
PRIMER 6/PERMANOVA1 (Clarke and Gorley, 2006) to test
differences in microbial community abundance and composi-
tion among the three sponge species and amongst sites of
differing environmental quality. Two fixed factors were consid-
ered (Species, Sp, and Quality, Q) as well as their interaction
(Sp x Q). R (R Core Team, 2014) was used to construct nMDS
plots representing the similarity between samples, based on
species abundance and composition.
To further explore the structure of the whole community,
and with the aim of identifying relevant OTUs significantly
associated with either different sponge species or different
environmental qualities, we conducted Indicator Value Analy-
sis (IndVal, De C�aceres and Legendre, 2009) following a
previously described approach (Glasl et al., 2016).
Ecological network analyses
Ecological network analyses are becoming increasingly
widely used within microbial ecology (Berry and Widder,
2014; Coyte et al., 2015). We therefore wanted to explore
the influence of the core microbiota definition on the proper-
ties of the ecological network. This was undertaken using
the Bipartite package (Dormann et al., 2008) in R (R Core
Team, 2014).
Nodes in the network correspond to hosts and microbes,
with links indicating the presence of a microbe in a host.
Modularity and the presence of modules were calculated
using the Quanbimo algorithm (Dormann and Strauss,
2014) for binary bipartite and weighted networks. Clusters
or modules correspond to a group of species more con-
nected with each other than with the rest of the system,
and their presence can be interpreted as evidence of non-
random assembly processes. Modularity Q was calculated
as follows:
Q51
2m
X
ij
Aij 2 Kij
� �d ci ; cj
� �
where m is half the total number of observed links in the
network, Aij is the weighted edge matrix, with values of 1 if
a link between i and j exists, and 0 otherwise; and Kij the
matrix of expected weights, based on the null model. ci and
cj represent the module to which a species i or j is
assigned. Additionally, we calculated the degree of special-
ism of the network (H20). This was calculated by taking into
account interaction frequencies, i.e. the relative abundance
of each microbe on each host. We used an information the-
ory metric developed by Bl€uthgen et al. (2006) that, in
contrast to other quantitative metrics, is scale independent.
The degree of specialisation in each web is defined as the
deviation from an expected probability distribution of interac-
tions (see Supporting Information for its calculation). The
degree of specialisation ranges from 0 (high generalism
degree) to 1.0 (high specialism degree).
Acknowledgements
CAG was supported by an Encouraging and Supporting Inno-
vation Doctoral Scholarship in Marine Science awarded by the
University of Auckland. NSW was funded through an Austra-
lian Research Council Future Fellowship FT120100480. JMM
acknowledges support by the Laboratory of Excellence
“TULIP” (ANR-10-LABX-41; ANR-11-IDEX-002-02) and the
Midi-Pyrenees Region. The Victoria University of Wellington
University Research Fund provided funding for the collection
of the specimens. Luke Thomas helped with the sample
collections.
1458 C. Astudillo-Garc�ıa et al.
VC 2017 Society for Applied Microbiology and John Wiley & Sons Ltd, Environmental Microbiology, 19, 1450–1462
References
Ainsworth, T.D., Krause, L., Bridge, T., Torda, G., Raina, J.B.,
Zakrzewski, M., et al. (2015) The coral core microbiome
identifies rare bacterial taxa as ubiquitous endosymbionts.
ISME J 9: 2261–2274.Anderson, M.J. (2001) A new method for non-parametric mul-
tivariate analysis of variance. Austral Ecol 26: 32–46.Arumugam, M., Raes, J., Pelletier, E., Le Paslier, D., Yamada,
T., Mende, D.R., et al. (2011) Enterotypes of the human gut
microbiome. Nature 473: 174–180.B€ackhed, F., Fraser, C.M., Ringel, Y., Sanders, M.E., Sartor,
R.B., Sherman, P.M., et al. (2012) Defining a healthy human
gut microbiome: current concepts, future directions, and
clinical applications. Cell Host Microbe 12: 611–622.Bascompte, J. (2009) Disentangling the web of life. Science
325: 416–419.
Bell, J.J., Smith, D.J., Hannan, D., Haris, A., Jompa, J., and
Thomas, L. (2014) Resilience to disturbance despite limited
dispersal and self-recruitment in tropical barrel sponges:
implications for conservation and management. PLoS One
9: e91635.Benjamino, J., and Graf, J. (2016) Characterization of the
core and caste-specific microbiota in the termite, Reticuli-
termes flavipes. Front Microbiol 7: 171.Berry, D., and Widder, S. (2014) Deciphering microbial inter-
actions and detecting keystone species with co-occurrence
networks. Front Microbiol 5: 1–14.Bj€ork, J.R., D�ıez-Vives, C., Coma, R., Ribes, M., and Montoya,
J.M. (2013) Specificity and temporal dynamics of complex bac-
teria – sponge symbiotic interactions. Ecology 94: 2781–2791.Bl€uthgen, N., Menzel, F., and Bl€uthgen, N. (2006) Measuring
specialization in species interaction networks. BMC Ecol 6:
1–12.
Bl€uthgen, N., Menzel, F., Hovestadt, T., Fiala, B., and
Bl€uthgen, N. (2007) Specialization, constraints, and conflict-
ing interests in mutualistic networks. Curr Biol 17: 341–346.Bourne, D.G., Morrow, K.M. and Webster, N.S. (2016) Insights
into the coral microbiome: Underpinning the health and
resilience of reef ecosystems. Annual Reviews of Microbiol-
ogy 70: 317–340.Bray, J.R., and Curtis, J.T. (1957) An ordination of the upland
forest community of southern Wisconsin. Ecol Monogr 27:
325–349.De C�aceres, M., and Legendre, P. (2009) Associations
between species and groups of sites: Indices and statistical
inference. Ecology 90: 3566–3574.Caporaso, J.G., Kuczynski, J., Stombaugh, J., Bittinger, K.,
Bushman, F.D., Costello, E.K., et al. (2010) QIIME allows
analysis of high-throughput community sequencing data.
Nat Methods 7: 335–336.
C�ardenas, C.A., Bell, J.J., Davy, S.K., Hoggard, M., and
Taylor, M.W. (2014) Influence of environmental variation on
symbiotic bacterial communities of two temperate sponges.
FEMS Microbiol Ecol 88: 516–527.Chao, A. (1984) Nonparametric estimation of the number of
classes in a population. Scand J Stat 11: 265–270.Cheng, J., Ringel-Kulka, T., Heikamp-de Jong, I., Ringel, Y.,
Carroll, I., de Vos, W.M., et al. (2016) Discordant temporal
development of bacterial phyla and the emergence of core in
the fecal microbiota of young children. ISME J 10: 1002–1014.
Clarke, K.R., and Gorley, R.N. (2006) PRIMER v6: User Man-
ual/Tutorial.Coyte, K.Z., Schluter, J., and Foster, K.R. (2015) The ecology
of the microbiome: networks, competition, and stability. Sci-
ence 350: 663–666.
DeSantis, T.Z., Hugenholtz, P., Larsen, N., Rojas, M., Brodie,
E.L., Keller, K., et al. (2006) Greengenes, a chimera-
checked 16S rRNA gene database and workbench compat-
ible with ARB. Appl Environ Microbiol 72: 5069–5072.Dillon, R., and Dillon, V. (2004) The gut bacteria of insects:
Nonpathogenic interactions. Annu Rev Entomol 49: 71–92.Dormann, C.F., Gruber, B., and Fr€und, J. (2008) Introducing
the bipartite package: analysing ecological networks. R
News 8: 8–11.Dormann, C.F., and Strauss, R. (2014) A method for detecting
modules in quantitative bipartite networks. Methods Ecol
Evol 5: 90–98.Edgar, R.C. (2010) Search and clustering orders of magnitude
faster than BLAST. Bioinformatics 26: 2460–2461.
Edgar, R.C. (2013) UPARSE: Highly accurate OTU sequences
from microbial amplicon reads. Nat Methods 10: 996–998.Erwin, P.M., L�opez-Legentil, S., Gonz�alez-Pech, R., and
Turon, X. (2012) A specific mix of generalists: bacterial
symbionts in Mediterranean Ircinia spp. FEMS Microbiol
Ecol 79: 619–637.Fierer, N., Breitbart, M., Nulton, J., Salamon, P., Lozupone,
C., Jones, R., et al. (2007) Metagenomic and small-subunit
rRNA analyses reveal the genetic diversity of bacteria,
archaea, fungi, and viruses in soil. Appl Environ Microbiol
73: 7059–7066.Flores, C.O., Meyer, J.R., Valverde, S., Farr, L., and Weitz,
J.S. (2011) Statistical structure of host–phage interactions.
Proc Natl Acad Sci USA 108: E288–E297.Freeman, C.J., Thacker, R.W., Baker, D.M., and Fogel, M.L.
(2013) Quality or quantity: is nutrient transfer driven more
by symbiont identity and productivity than by symbiont
abundance? ISME J 7: 1116–1125.Givens, C.E., Ransom, B., Bano, N., and Hollibaugh, J.T.
(2015) Comparison of the gut microbiomes of 12 bony fish
and 3 shark species. Mar Ecol Prog Ser 518: 209–223.Glasl, B., Herndl, G.J., and Frade, P.R. (2016) The microbiome
of coral surface mucus has a key role in mediating holobiont
health and survival upon disturbance. ISME J 10: 1–13.
Hamady, M., and Knight, R. (2009) Microbial community profil-
ing for human microbiome projects: tools, techniques, and
challenges. Genome Res 19: 1141–1152.Hentschel, U., Hopke, J., Horn, M., Friedrich, A.B., Wagner,
M., Hacker, J., and Moore, B.S. (2002) Molecular evidence
for a uniform microbial community in sponges from different
oceans. Appl Environ Microbiol 68: 4431–4440.Hentschel, U., Piel, J., Degnan, S.M., and Taylor, M.W. (2012)
Genomic insights into the marine sponge microbiome. Nat
Rev Microbiol 10: 641–654.Huse, S.M., Ye, Y., Zhou, Y., and Fodor, A.A. (2012) A core
human microbiome as viewed through 16S rRNA sequence
clusters. PLoS One 7: e34242.Ings, T.C., Montoya, J.M., Bascompte, J., Bl€uthgen, N.,
Brown, L., Dormann, C.F., et al. (2009) Ecological networks
- beyond food webs. J Anim Ecol 78: 253–269.
Laffy, P.W., Wood-Charlson, E.M., Turaev, D., Weynberg,
K.D., Bott�e, E.S., van Oppen, M.J.H., et al. (2016) HoloVir:
Core microbiota in complex communities 1459
VC 2017 Society for Applied Microbiology and John Wiley & Sons Ltd, Environmental Microbiology, 19, 1450–1462
A workflow for investigating the diversity and function of
viruses in invertebrate holobionts. Front Microbiol 7: 822.Ley, R.E., Lozupone, C.A., Hamady, M., Knight, R., and
Gordon, J.I. (2008) Worlds within worlds: evolution of the
vertebrate gut microbiota. Nat Rev Microbiol 6: 776–788.Lozupone, C., and Knight, R. (2005) UniFrac: a new phyloge-
netic method for comparing microbial communities. Appl
Environ Microbiol 71: 8228–8235.Lundberg, D.S., Lebeis, S.L., Paredes, S.H., Yourstone, S.,
Gehring, J., Malfatti, S., et al. (2012) Defining the core Ara-
bidopsis thaliana root microbiome. Nature 488: 86–90.Magurran, A.E., and Henderson, P.A. (2003) Explaining the
excess of rare species in natural species abundance distri-
butions. Nature 422: 714–716.
Martin, M.O., Gilman, F.R., and Weiss, S.L. (2010) Sex-
specific asymmetry within the cloacal microbiota of the
striped plateau lizard, Sceloporus virgatus. Symbiosis 51:
97–105.
McDonald, D., Clemente, J.C., Kuczynski, J., Rideout, J.,
Stombaugh, J., Wendel, D., et al. (2012) The Biological
Observation Matrix (BIOM) format or: how I learned to stop
worrying and love the ome-ome. Gigascience 1: 7.McMellor, S., and Smith, D.J. (2010) Coral reefs of the Waka-
tobi: Abundance and diversity. In Marine Research and
Conservation in the Coral Triangle. The Wakatobi National
Park. Clifton, J., Unsworth, R., and Smith, D. (eds). New
York: Nova Science Publishers, pp. 11–26.Montalvo, N.F., and Hill, R.T. (2011) Sponge-associated bac-
teria are strictly maintained in two closely related but geo-
graphically distant sponge hosts. Appl Environ Microbiol 77:
7207–7216.Montoya, D., Yallop, M.L., and Memmott, J. (2015) Functional
group diversity increases with modularity in complex food
webs. Nat Commun 6: 7379.Montoya, J.M., Pimm, S.L., and Sol�e, R.V. (2006) Ecological
networks and their fragility. Nature 442: 259–264.Nyholm, S.V., and McFall-Ngai, M.J. (2004) The winnowing:
establishing the squid-Vibrio symbiosis. Nat Rev Microbiol
2: 632–642.Otani, S., Mikaelyan, A., Nobre, T., Hansen, L.H., Kon�e, N.A.,
Sørensen, S.J., et al. (2014) Identifying the core microbial
community in the gut of fungus-growing termites. Mol Ecol
23: 4631–4644.Powell, A., Smith, D.J., Hepburn, L.J., Jones, T., Berman, J.,
Jompa, J., and Bell, J.J. (2014) Reduced diversity and high
sponge abundance on a sedimented indo-pacific reef sys-
tem: implications for future changes in environmental quali-
ty. PLoS One 9: e85253.R Core Team (2014) R: A Language and Environment for Sta-
tistical Computing.
Ramirez, K.S., Leff, J.W., Barber�an, A., Bates, S.T., Betley, J.,
Thomas, W., et al. (2014) Biogeographic patterns in below-
ground diversity in New York City ’ s Central Park are similar
to those observed globally. Proc R Soc B 281: 20141988.
doi:10.1098/rspb.2014.1988.
Reveillaud, J., Maignien, L., Eren, M. A., Huber, J. A., Apprill,
A., Sogin, M.L., and Vanreusel, A. (2014) Host-specificity
among abundant and rare taxa in the sponge microbiome.
ISME J 8: 1198–1209.Savage, D.C. (1977) Microbial ecology of the gastrointestinal
tract. Annu Rev Microbiol 31: 107–133.
Schloss, P.D., Westcott, S.L., Ryabin, T., Hall, J.R., Hartmann,
M., Hollister, E.B., et al. (2009) Introducing mothur: open-
source, platform-independent, community-supported soft-
ware for describing and comparing microbial communities.
Appl Environ Microbiol 75: 7537–7541.Schmitt, S., Tsai, P., Bell, J., Fomont, J., Ilan, M., Lindquist,
N., et al. (2012) Assessing the complex sponge microbiota:
core, variable and species-specific bacterial communities in
marine sponges. ISME J 6: 564–576.Sch€ottner, S., Hoffmann, F., C�ardenas, P., Rapp, H.T.,
Boetius, A., and Ramette, A. (2013) Relationships between
host phylogeny, host type and bacterial community diversity
in cold-water coral reef sponges. PLoS One 8: e55505.Segata, N., Baldini, F., Pompon, J., Garrett, W.S., Truong,
D.T., Dabir�e, R.K., et al. (2016) The reproductive tracts of
two malaria vectors are populated by a core microbiome
and by gender- and swarm-enriched microbial biomarkers.
Sci Rep 6: 24207.Setiawan, E., de Voogd, N.J., Hooper, J.N.A., Worheide, G.,
and Erpenbeck, D. (2016) Bottomless barrel-sponge spe-
cies in the Indo-Pacific?. Zootaxa 2: 393–396.Shade, A., and Handelsman, J. (2012) Beyond the Venn dia-
gram: The hunt for a core microbiome. Environ Microbiol
14: 4–12.Shafquat, A., Joice, R., Simmons, S.L., and Huttenhower, C.
(2014) Functional and phylogenetic assembly of microbial
communities in the human microbiome. Trends Microbiol
22: 261–266.Simister, R., Taylor, M.W., Tsai, P., Fan, L., Bruxner, T.J., Crowe,
M.L., and Webster, N. (2012a) Thermal stress responses in
the bacterial biosphere of the Great Barrier Reef sponge,
Rhopaloeides odorabile. Environ Microbiol 14: 3232–3246.Simister, R.L., Deines, P., Bott�e, E.S., Webster, N.S., and
Taylor, M.W. (2012b) Sponge-specific clusters revisited: a
comprehensive phylogeny of sponge-associated microor-
ganisms. Environ Microbiol 14: 517–524.Sullam, K.E., Essinger, S.D., Lozupone, C.A., O’connor, M.P.,
Rosen, G.L., Knight, R., et al. (2012) Environmental and
ecological factors that shape the gut bacterial communities
of fish: a meta-analysis. Mol Ecol 21: 3363–3378.Taylor, M.W., Radax, R., Steger, D., and Wagner, M. (2007)
Sponge-associated microorganisms: evolution, ecology,
and biotechnological potential. Microbiol Mol Biol Rev 71:
295–347.Taylor, M.W., Tsai, P., Simister, R.L., Deines, P., Botte, E.,
Ericson, G., et al. (2013) “Sponge-specific” bacteria are
widespread (but rare) in diverse marine environments.
ISME J 7: 438–443.
Th�ebault, E., and Fontaine, C. (2010) Stability of ecological
communities and the architecture of mutualistic and trophic
networks. Science 329: 853–856.
Thomas, T., Moitinho-Silva, L., Lurgi, M., Bj€ork, J.R., Easson,
C., Astudillo-Garc�ıa, C., et al. (2016) Diversity, structure
and convergent evolution of the global sponge microbiome.
Nat Commun 7: 11870.Turnbaugh, P.J., Ley, R.E., Hamady, M., Fraser-Liggett, C.M.,
Knight, R., and Gordon, J.I. (2007) The Human Microbiome
Project. Nature 449: 804–810.Waite, D.W., and Taylor, M.W. (2014) Characterizing the avian
gut microbiota: membership, driving influences, and poten-
tial function. Front Microbiol 5: 223.
1460 C. Astudillo-Garc�ıa et al.
VC 2017 Society for Applied Microbiology and John Wiley & Sons Ltd, Environmental Microbiology, 19, 1450–1462
Wang, W., Cao, J., Yang, F., Wang, X., Zheng, S., Sharshov,K., and Li, L. (2016) High-throughput sequencing reveals
the core gut microbiome of bar-headed goose (Anser indi-
cus) in different wintering areas in Tibet. Microbiologyopen5: 287–295.
Webster, N.S. (2007) Sponge disease: A global threat? Envi-
ron Microbiol 9: 1363–1375.Webster, N.S., Negri, A.P., Webb, R.I., and Hill, R.T. (2002) A
spongin-boring a-proteobacterium is the etiological agent ofdisease in the Great Barrier Reef sponge Rhopaloeides
odorabile. Mar Ecol Prog Ser 232: 305–309.Webster, N.S., Taylor, M.W., Behnam, F., L€ucker, S., Rattei,
T., Whalan, S., et al. (2010) Deep sequencing revealsexceptional diversity and modes of transmission for bacteri-
al sponge symbionts. Environ Microbiol 12: 2070–2082.Webster, N.S., and Thomas, T. (2016) The Sponge Hologe-
nome. MBio 7: e00135–e00116.Yeoh, Y.K., Paungfoo-Lonhienne, C., Dennis, P.G., Robinson,
N., Ragan, M. A., Schmidt, S., and Hugenholtz, P. (2016)The core root microbiome of sugarcanes cultivated under
varying nitrogen fertilizer application. Environ Microbiol 18:1338–1351.
Zeglin, L.H. (2015) Stream microbial diversity in response toenvironmental changes: Review and synthesis of existing
research. Front Microbiol 6: 1–15.Zhang, J., Guo, Z., Lim, A.A.Q., Zheng, Y., Koh, E.Y., Ho, D.,
et al. (2014) Mongolians core gut microbiota and its correla-
tion with seasonal dietary changes. Sci Rep 4: 5001.
Supporting information
Additional Supporting Information may be found in theonline version of this article at the publisher’s website:
Table S1. PERMANOVA analyses based on a weighted
UniFrac distance matrix generated with (1-3) whole commu-
nity A, B and C respectively, (4-8) specific core with 12, 25,50, 90 and 100 occurrence percentage respectively (no
minimum abundance threshold), (9-13) specific core with12, 25, 50, 90 and 100 occurrence percentage respectively
AND 0.01% relative abundance, (14-18) specific core with
12, 25, 50, 90 and 100 occurrence percentage respectivelyAND 0.1% relative abundance, (19-23) overall core with 5,
25, 50, 90 and 100 occurrence percentage respectively (nominimum abundance threshold), (24-28) overall core with 5,
25, 50, 90 and 100 occurrence percentage respectivelyAND 0.01% relative abundance, and (29-33) overall core
with 5, 35, 50, 90 and 100 occurrence percentage respec-
tively AND 0.1% relative abundance. A, B, and C refer tominimum relative abundance threshold applied to each
community, (0, 0.01 and 0.1% respectively).Table S2. PERMANOVA analyses based on a Bray Curtis
distance matrix generated with (1-3) whole community A, Band C respectively, (4-8) specific core with 12, 25, 50, 90
and 100 occurrence percentage respectively (no minimumabundance threshold), (9-13) specific core with 12, 25, 50,
90 and 100 occurrence percentage respectively AND0.01% relative abundance, (14-18) specific core with 12,
25, 50, 90 and 100 occurrence percentage respectively
AND 0.1% relative abundance, (19-23) overall core with 5,25, 50, 90 and 100 occurrence percentage respectively (no
minimum abundance threshold), (24-28) overall core with 5,
25, 50, 90 and 100 occurrence percentage respectively
AND 0.01% relative abundance, and (29-33) overall core
with 5, 35, 50, 90 and 100 occurrence percentage respec-
tively AND 0.1% relative abundance. A, B, and C refer to
minimum relative abundance threshold applied to each
community, (0, 0.01 and 0.1% respectively).Table S3. PERMANOVA pairwise comparisons based on a
weighted UniFrac distance matrix, considering (1) specific
core 90% occurrence (no minimum abundance), (2) specific
core 100% occurrence (no mimimum abundance), (3) spe-
cific core 90% occurrence AND 0.01% relative abundance
and (4) specific core 100% occurrence AND 0.01% relative
abundance between different sponge species, and (5) spe-
cific core 90% occurrence AND 0.01% relative abundance
between different quality sites.Table S4. PERMANOVA pairwise comparisons based on a
Bray-Curtis distance matrix, between different sponge spe-
cies considering (1-3) whole community A, B and C respec-
tively, (4-8) specific core with 12, 25, 50, 90 and 100
occurrence percentage respectively (no minimum abun-
dance threshold), (9-13) specific core with 12, 25, 50, 90
and 100 occurrence percentage respectively AND 0.01%
relative abundance, (14-18) specific core with 12, 25, 50,
90 and 100 occurrence percentage respectively AND 0.1%
relative abundance, (19-23) overall core with 5, 25, 50, 90
and 100 occurrence percentage respectively (no minimum
abundance threshold), (24-28) overall core with 5, 25, 50,
90 and 100 occurrence percentage respectively AND
0.01% relative abundance, and (29-33) overall core with 5,
35, 50, 90 and 100 occurrence percentage respectively
AND 0.1% relative abundance. A, B, and C refer to mini-
mum relative abundance threshold applied to each commu-
nity, (0, 0.01 and 0.1% respectively).Table S5. PERMANOVA pairwise comparisons based on a
Bray-Curtis distance matrix, between different quality sites,
considering (1) specific core 90% occurrence (no minimum
abundance), (2) specific core 100% occurrence (no mimi-
num abundance), (3) specific core 90% occurrence AND
0.01% min. relative abundance, (4) specific core 100%
occurrence AND 0.01% min. relative abundance, (5) spe-
cific core 90% occurrence AND 0.1% min. relative abun-
dance, and (6) specific core 100% occurrence AND 0.1%
min. relative abundance.
Table S6. Mean values of alpha-diversity metrics for eachsponge species and each quality site, with calculationsbased on with (1-3) whole community A, B and C respec-tively, (4-8) specific core with 12, 25, 50, 90 and 100 occur-rence percentage respectively (no minimum abundancethreshold), (9-13) specific core with 12, 25, 50, 90 and 100occurrence percentage respectively AND 0.01% relativeabundance, (14-18) specific core with 12, 25, 50, 90 and100 occurrence percentage respectively AND 0.1% relativeabundance, (19-23) overall core with 5, 25, 50, 90 and 100occurrence percentage respectively (no minimum abun-dance threshold), (24-28) overall core with 5, 25, 50, 90and 100 occurrence percentage respectively AND 0.01%relative abundance, and (29-33) overall core with 5, 35, 50,90 and 100 occurrence percentage respectively AND 0.1%relative abundance. A, B, and C refer to minimum relativeabundance threshold applied to each community, (0, 0.01and 0.1% respectively). This table includes additional met-rics and datasets to those in Table 2.
Core microbiota in complex communities 1461
VC 2017 Society for Applied Microbiology and John Wiley & Sons Ltd, Environmental Microbiology, 19, 1450–1462
Table S7. Modularity (Q) and specialisation degree (H2’)
values at sponge species and environmental quality levels,
as well as their interaction, in each dataset considered:
whole community A, B and C; specific core 12%-100% with
no minimum abundance, 0.01% and 0.1% min. relative
abundance; and overall core 5%-100% with no minimumabundance, 0.01% and 0.1% min. relative abundance. The
definition of each core community is outlined in Experimen-
tal Procedures. A, B, and C refer to minimum relative abun-
dance threshold applied to each community, (0, 0.01 and
0.1% respectively). Percentages indicated in each commu-
nity refer to percentage occurrence.Table S8. Relative proportion of OTUs that are assigned to
sponge-specific clusters (SC) or sponge-coral-specific clus-
ters (SCC) in each of the dataset considered in the study:
whole community A, B and C; specific core 12%-100% withno minimum abundance, 0.01% and 0.1% min. relative
abundance; and overall core 5%-100% with no minimum
abundance, 0.01% and 0.1% min. relative abundance. The
definition of each core community is outlined in Experimen-
tal Procedures. A, B, and C refer to minimum relative abun-
dance threshold applied to each community, (0, 0.01 and0.1% respectively). Percentages indicated in each commu-
nity refer to percentage occurrence.
Table S9. Specialist OTUs indentified with IndVal accordingto (a) sponge species and (b) environmental quality. For
each OTU, the group they are specialist in (group), the
IndVal value (IndVal), the significance of the association (p-
value), the number of sequences and the phylogenetic affili-
ation are shown in the table.Table S10. Summary table of environmental conditions of
the sampling sites based on Bell et al. (2014) and Powell
et al. (2014).Fig. S1. Non-metric multidimensional scaling (nMDS) plot
based on both weighted UniFrac (figs. 1-15) and Bray
Curtis (figs. 16-30) distance matrices for whole communityA, B and C respectively (figs. 1-3 and 16-18), specific corewith 12 and 100 occurrence percentage respectively (nominimum abundance threshold) (4-5 and 18-19), specificcore with 12 and 100 occurrence percentage respectivelyAND 0.01% relative abundance(6-7 and 21-22), specificcore with 12 and 100 occurrence percentage respectivelyAND 0.1% relative abundance(8-9 and 23-24), overall corewith 5 and 100 occurrence percentage respectively (no min-imum abundance threshold) (10-11 and 25-26), overall corewith 5 and 100 occurrence percentage respectively AND0.01% relative abundance(12-13 and 27-28), and overallcore with 5 and 100 occurrence percentage respectivelyAND 0.1% relative abundance (14-15 and 29-30). A, B, andC refer to minimum relative abundance threshold applied toeach community, (0, 0.01 and 0.1% respectively). In thelegend, A, B, C refers to host species A, B and C, respec-tively; H, M, L refers to High, Moderate and Low qualityhabitats respectively.Fig. S2. Sponge microbiota-host bipartite network. BacterialOTUs (blue boxes) are linked to (a) sponge host, (b) envi-ronmental conditions and (c) sponge species within eachenvironmental condition on the whole community. Linethickness is proportional to interaction strength and boxarea corresponds to bacterial relative abundance. (a) A, B,C: host species A, B and C respectively; (b) H, M, L: High,Moderate and Low quality sites respectively. As same net-work patterns were displayed for each core community ateach factor level, only the networks created for the wholecommunity are shown here.Fig. S3. Significant bacterial indicators and relative abun-dance according to (a) sponge species and (b) environmen-tal quality site, as shown by Indicator Value analysis(IndVal).
1462 C. Astudillo-Garc�ıa et al.
VC 2017 Society for Applied Microbiology and John Wiley & Sons Ltd, Environmental Microbiology, 19, 1450–1462