Embed Size (px)
Citation preview
Toxicology 218 (2006) 100–111
Evaluating the risk decision process
Sven Ove Hansson, Christina Ruden∗Department of Philosophy and the History of Technology, Royal Institute of Technology (KTH),
Teknikringen 78 B 2tr, SE-100 44 Stockholm, Sweden
Received 23 August 2005; received in revised form 3 October 2005; accepted 8 October 2005Available online 1 December 2005
Abstract
In order to ensure that risk assessment and risk management serve their purposes efficiently, it is essential to systematicallyevaluate actual practices. In this overview, it is proposed that such evaluation studies constitute an important field of study thatshould be recognized as a subdiscipline of regulatory toxicology with its own research issues and its own methodologies. Previoussuch evaluation studies are summarized. Methods are described that can be used for comparing different risk assessments of one ofthe same substance, for checking the consistency of harmonized classifications with the available data, for assessing the actual marginof safety (i.e. size of uncertainty factors) in exposure limits, and for comparing different lists of exposure limits. In conclusion,some important problem areas for future evaluation studies are pointed out.© 2005 Elsevier Ireland Ltd. All rights reserved.
Keywords: Risk assessment; Risk management; Meta analysis; Chemicals control
. Insci-
suchility,
ni-
liesinedriskdata
reta-ess-thernot
ndalrisk
stem-
1. Introduction
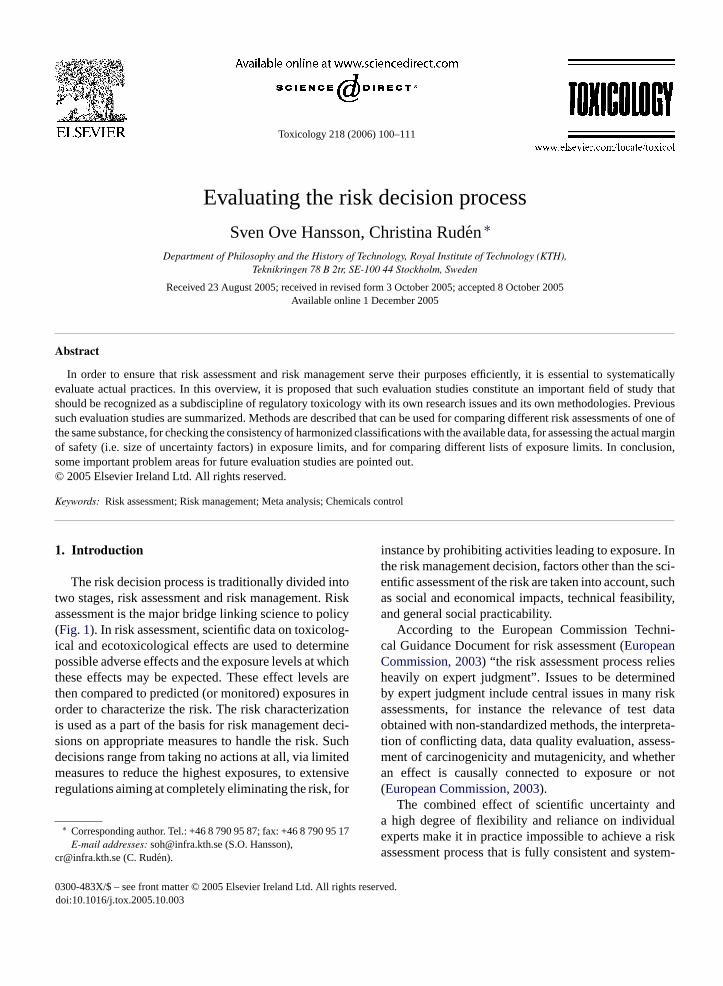
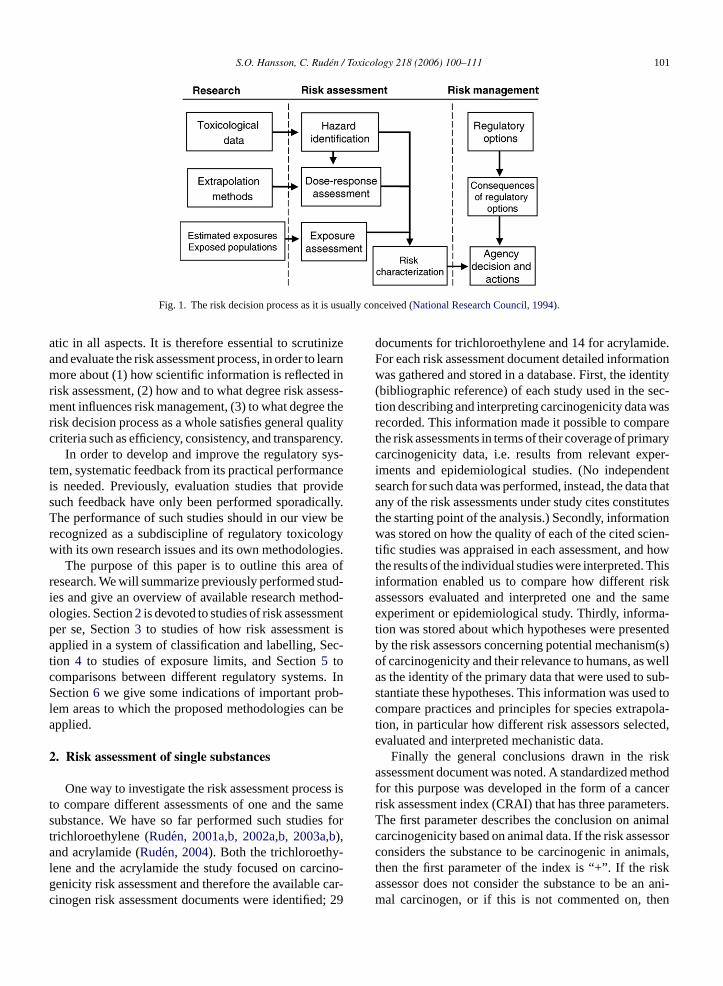
The risk decision process is traditionally divided intotwo stages, risk assessment and risk management. Riskassessment is the major bridge linking science to policy(Fig. 1). In risk assessment, scientific data on toxicolog-ical and ecotoxicological effects are used to determinepossible adverse effects and the exposure levels at whichthese effects may be expected. These effect levels arethen compared to predicted (or monitored) exposures inorder to characterize the risk. The risk characterizationis used as a part of the basis for risk management deci-sions on appropriate measures to handle the risk. Suchdecisions range from taking no actions at all, via limitedmeasures to reduce the highest exposures, to extensiveregulations aiming at completely eliminating the risk, for
∗ Corresponding author. Tel.: +46 8 790 95 87; fax: +46 8 790 95 17E-mail addresses: [email protected] (S.O. Hansson),
[email protected] (C. Ruden).
instance by prohibiting activities leading to exposurethe risk management decision, factors other than theentific assessment of the risk are taken into account,as social and economical impacts, technical feasiband general social practicability.
According to the European Commission Techcal Guidance Document for risk assessment (EuropeanCommission, 2003) “the risk assessment process reheavily on expert judgment”. Issues to be determby expert judgment include central issues in manyassessments, for instance the relevance of testobtained with non-standardized methods, the interption of conflicting data, data quality evaluation, assment of carcinogenicity and mutagenicity, and whean effect is causally connected to exposure or(European Commission, 2003).
The combined effect of scientific uncertainty aa high degree of flexibility and reliance on individuexperts make it in practice impossible to achieve aassessment process that is fully consistent and sy
0300-483X/$ – see front matter © 2005 Elsevier Ireland Ltd. All rights reserved.doi:10.1016/j.tox.2005.10.003
S.O. Hansson, C. Ruden / Toxicology 218 (2006) 100–111 101
Fig. 1. The risk decision process as it is usually conceived (National Research Council, 1994).
atic in all aspects. It is therefore essential to scrutinizeand evaluate the risk assessment process, in order to learnmore about (1) how scientific information is reflected inrisk assessment, (2) how and to what degree risk assess-ment influences risk management, (3) to what degree therisk decision process as a whole satisfies general qualitycriteria such as efficiency, consistency, and transparency.
In order to develop and improve the regulatory sys-tem, systematic feedback from its practical performanceis needed. Previously, evaluation studies that providesuch feedback have only been performed sporadically.The performance of such studies should in our view berecognized as a subdiscipline of regulatory toxicologywith its own research issues and its own methodologies.
The purpose of this paper is to outline this area ofresearch. We will summarize previously performed stud-ies and give an overview of available research method-ologies. Section2is devoted to studies of risk assessmentper se, Section3 to studies of how risk assessment isapplied in a system of classification and labelling, Sec-tion 4 to studies of exposure limits, and Section5 tocomparisons between different regulatory systems. InSection6 we give some indications of important prob-lem areas to which the proposed methodologies can beapplied.
2. Risk assessment of single substances
One way to investigate the risk assessment process isto compare different assessments of one and the sames s fort ,ba -l cino-g car-c d; 29
documents for trichloroethylene and 14 for acrylamide.For each risk assessment document detailed informationwas gathered and stored in a database. First, the identity(bibliographic reference) of each study used in the sec-tion describing and interpreting carcinogenicity data wasrecorded. This information made it possible to comparethe risk assessments in terms of their coverage of primarycarcinogenicity data, i.e. results from relevant exper-iments and epidemiological studies. (No independentsearch for such data was performed, instead, the data thatany of the risk assessments under study cites constitutesthe starting point of the analysis.) Secondly, informationwas stored on how the quality of each of the cited scien-tific studies was appraised in each assessment, and howthe results of the individual studies were interpreted. Thisinformation enabled us to compare how different riskassessors evaluated and interpreted one and the sameexperiment or epidemiological study. Thirdly, informa-tion was stored about which hypotheses were presentedby the risk assessors concerning potential mechanism(s)of carcinogenicity and their relevance to humans, as wellas the identity of the primary data that were used to sub-stantiate these hypotheses. This information was used tocompare practices and principles for species extrapola-tion, in particular how different risk assessors selected,evaluated and interpreted mechanistic data.
Finally the general conclusions drawn in the riskassessment document was noted. A standardized methodfor this purpose was developed in the form of a cancerrisk assessment index (CRAI) that has three parameters.
imalssor
mals,iskn ani-hen
ubstance. We have so far performed such studierichloroethylene (Ruden, 2001a,b, 2002a,b, 2003a),nd acrylamide (Ruden, 2004). Both the trichloroethy
ene and the acrylamide the study focused on carenicity risk assessment and therefore the availableinogen risk assessment documents were identifie
The first parameter describes the conclusion on ancarcinogenicity based on animal data. If the risk asseconsiders the substance to be carcinogenic in anithen the first parameter of the index is “+”. If the rassessor does not consider the substance to be amal carcinogen, or if this is not commented on, t
102 S.O. Hansson, C. Ruden / Toxicology 218 (2006) 100–111
it receives the index value “−”. The second parameterrefers to the conclusions drawn from epidemiology. Ifthe epidemiology is considered by the risk assessor tobe positive, then the index “+” is assigned. If the riskassessor considers the epidemiology to be negative, or ifthis is not commented on, then a “−” is assigned. Thethird parameter describes the overall conclusion regard-ing cancer risk to humans. Its value is “+” if the conclu-sion drawn by the risk assessors indicates of a (probable)human cancer risk. If a cancer risk to humans is describedby the risk assessors as implausible, or if the human can-cer risk is not commented on at all, then this parameteris assigned a “−”. In order to keep down the numberof categories, the index was made as simple as possi-ble while still distinguishing between animal evidence,evidence from humans, and overall conclusions. There-fore, the index makes no difference between assessmentsconcluding “no danger” and assessments concluding “nodata are available”. The conclusions drawn in the dif-ferent risk assessments documents were identified andcategorized according to this scheme. In some cases,when the conclusions were not clearly articulated, aninterpretation of the available statements had to be made(for further details seeRuden, 2001a).
The CRAI index has a theoretical maximum of eightgroups, but all risk assessments that we studied to date(Ruden, 2001a; Ruden, 2004) belong to one of the fol-lowing four groups:
1) − − −: Not carcinogenic in animals, negative epi-
iol-
iol-
iol-
g tooc-
yriskmelyleared ineredcityess-
ence
From the recorded citations it is possible to calculatethe reference coverage for each of the risk assessmentdocuments. The reference coverage is defined as thepercentage of the total number of available scientific ref-erences that the risk assessment document cites (citedreferences/available references). The database includesall the primary data that were cited in at least one riskassessment document (no separate search for data wasthus performed), and we consider a bibliographic refer-ence available to a risk assessor if it was published theyear before the risk assessment was published (or ear-lier). Hence, primary data published in 1990 or earlierare considered available to risk assessments published in1991.
The reference coverage for the 29 trichloroethylenerisk assessment documents varied from 5 to 81%, withan average of 18% (median 16%) (Ruden, 2001a), andfor acrylamide it varied from 0 to 100%, with an averageof 53% (median 62%), which was lower than expectedindicating that a selection of available studies were madeat some point (Ruden, 2004). (A further analysis of thisindicated that some risk assessments had excluded theolder studies as newer, hopefully better studies, becameavailable. Some risk assessments lack references to themost recent studies, probably due to a time lag betweendata retrieval and the publication of the risk assessment,while some risk assessments refer to data that have beenselected in a manner that is not time-dependent.)
It should be noted that this reference coverage anal-ysis includes all the references that were ever cited by
par-nd,ualityari-259
onlydoc-age,ichem-
diesies.l datald be(2)
mi-the
efer-ed byd andlatedhese
demiology, no/implausible human cancer risk.2) +− −: Carcinogenic in animals, negative epidem
ogy, no/implausible human cancer risk.3) +− +: Carcinogenic in animals, negative epidem
ogy, a plausible human cancer risk.4) + + +: Carcinogenic in animals, positive epidem
ogy, a plausible human cancer risk.
The 29 TCE risk assessment documents belonfour different CRAI groups: six risk assessment duments were categorized in the− − − group, ten inthe +− − group, nine in the +− + group, and finallfour documents in the + + + group. The acrylamideassessments all belonged to either of two groups, na− − −and +− +. In the acrylamide case there was a ctime trend indicating that the assessment has changthe face of new data, i.e. acrylamide was not considcarcinogenic until the long-term animal carcinogenistudies were published in the mid 1980s. All risk assments but one published after 1985 belong to the +− +group. In the trichlorethylene case, the time-dependof conclusions is less clear.
any of these risk assessors. For trichloroethylene inticular, being an extremely well investigated compouone can assume that among these references the qand relevance of the individual studies are highly vable. This is also indicated by the fact that of thereferences in our database, as many as 151 havebeen cited only once (i.e. in one risk assessmentument). Thus, despite a low total reference coverthere may still be a core of important data for whreference coverage is high. Obvious candidates for mbership in that core are long-term/carcinogenicity stuon animals, and (high-quality) epidemiological studSubsets of these studies were selected. The animawere selected based on the criteria that they shou(1) long-term/chronic/carcinogenicity studies, andpublicly published in their final versions. The epideological studies were selected on the basis of howrisk assessors had evaluated their quality. Those rences were selected that had been explicitly assessat least one risk assessor to be adequately designeperformed. Reference coverage was therefore calcufor these categories of studies. The coverage of t
S.O. Hansson, C. Ruden / Toxicology 218 (2006) 100–111 103
studies was higher than for all studies, as expected, butsome risk assessors were shown to have surprisingly lowreference coverage even for the most relevant studies.
The database can also be used to calculate thecita-tion coverage of the individual studies referred to inthe assessments. The citation coverage of a particularstudy is defined as the percentage of the risk assess-ment documents to which the study was available thatcite it. In our material, the citation coverage of indi-vidual studies was surprisingly low. None of the bioas-says or the epidemiological studies in the acrylamideor trichloroethylene cases reached 100% citation cov-erage. A less than 100% citation coverage means thatone or more study has been excluded. Criteria for dataselection are in most cases implicit, and if citation (andreference) coverage is significantly less than 100%, it isimportant to determine if the data selection was biased.We developed the following method to test for this typeof bias: primary studies cited in more than a third ofthe assessments (i.e. in at least 10 risk assessment doc-uments in the trichloroethylene case) were determinedand from this subsample, the studies that were judged inmost risk assessments as either “positive” or “negative”.A study was classified as “positive” if≥50% of the citingrisk assessments explicitly described the data as show-ing a carcinogenic response and≤10% of the citing riskassessments explicitly described the data as showing nocarcinogenic response. It was classified as “negative” if≥50% of the citing risk assessments explicitly describedthe data as showing no carcinogenic response and≤10%o thatd e cov-e data,a ge ofp as ane ess-m
pri-m ess-m wasr gani-z trialH os-i riska n biast
id-u entr itedr casew d outt ere
common. For 6 of the 19 most cited experiments (27%)there were both risk assessors interpreting the result aspositive and as negative with regard to carcinogenicity.One reason for such differences was the use of differ-ent strategies for assessing results on the borderline ofstatistical significance. In the acrylamide case there wasconsensus among the risk assessors in the interpretationof both the two available long-term studies, i.e. they areboth clearly positive, and the epidemiological data, i.e.being negative.
The evaluation of study quality is another importantpart of the risk assessment process. We classified eachrisk assessors’ quality assessment of each study that theyreferred to in the following categories: (1) adequate, (2)reasonable, (3) inadequate, (4) no comment or (5) notapplicable.1 The 29 trichloroethylene risk assessmentscontained a total of 790 citations of references. In 65%of these citations the risk assessors made no commenton how they evaluate the quality of the study, in 4% theydescribe it as “adequate”, in 12% as “reasonable”, andin 12% as “inadequate”. Since in most cases nothing issaid about the quality of study design and conduct, theprocess of quality evaluation is far from transparent inthese risk assessments. None of the trichloroethylene oracrylamide risk assessors (explicitly) report comparisonsof study design and conduct to specified criteria, e.g. theOECD test guidelines (OECD Guidelines for the Testingof Chemical, 2004), for the evaluation of study designand conduct.
We are not aware of any other in-depth study of ae andn per-ringfinedntsrad-theub-46the
andthe
assi-tion
ts anps,rk-an
hen
f the citing risk assessments explicitly describedata as showing a carcinogenic response. Referencrage was calculated for both positive and negativend the difference between the reference coveraositive data and that of negative data was usedstimate of the selection bias in individual risk assents.The results suggest a bias in the selection of
ary data in some of the trichloroethylene risk assents. The strongest selection of negative studies
ecorded for two risk assessments by the private oration American Conference of Governmental Indusygienists (ACGIH), and the strongest selection of p
tive studies for one Swedish and one Canadianssessment. In the acrylamide case no data selectio
owards positive or negative studies was identified.In order to determine the extent to which indiv
al study results are interpreted differently by differisk assessors, it is useful to study how the most ceferences are interpreted. In the trichloroethylenee selected such a subsample for analysis. It turne
hat divergent interpretations of individual studies w
large number of risk assessment documents for onthe same substance. However, studies have beeformed that take the opposite approach of comparisk assessments of different substances within a desystem.Huff (2002)scrutinized IARC risk assessmebefore and after 1996, by analyzing all cases of upging or downgrading of chemicals with regard toIARC classification system in the 80 monographs plished from 1972 to 2002. During this time periodchemicals received an upgraded classification byIARC, 38 chemicals were upgraded before 1996,eight chemicals were upgraded after 1996. Duringsame time period 12 chemicals have had their clfication downgraded. These reductions in classificawere all made after 1996. Huff argues that this reflecincreased influence by industry in the working grouand a tendency that the chair of the different IARC woing groups, called Chief of the Monographs are, to
1 The classification as “not applicable” was typically used wanother risk assessment was cited.
104 S.O. Hansson, C. Ruden / Toxicology 218 (2006) 100–111
increasing extent, selected from among industry repre-sentatives. This is substantiated by an analysis of thealignment of participants attending IARC MonographsMeetings, and chairing, showing an increase in the num-ber of industry representatives after 1996.
A critical assessment of American Conference ofGovernmental Industrial Hygienists (ACGIH) has beenperformed. (Despite its name the ACGIH is a privateand not a governmental body.) The starting point ofthis work is a paper in which H.E. Stokinger, for manyyears the president of the ACGIH’s TLV Committee,purports to show that eight specified chemical carcino-gens have thresholds (Hansson, 1998b). The method ofthis study was simply to track down all the cited ref-erences and check if they substantiated the claims insupport of which they were mentioned. Glaring cases ofmisreporting were discovered, and it was concluded thatStokinger’s paper satisfies classical criteria of pseudo-science, such as the misrepresentation of data, relianceon anecdotal evidence, and the uncritical acceptance ofinformation coming from sources known to be fraudulent(Cf. Ruden, 2003a, 2005; Wells, 2005). See also Section4 for references to studies of ACGIH’s work with settingoccupational exposure limits.
3. The classification and labelling system
As described above risk assessments serve as thescientific basis for decision-making in the risk man-agement process. In addition to the scientific input via
bene-rdertantnage-tionrge
r sta-llingsure
arlyegu-tancema-.andcesp-ve,ec-cord-gi-
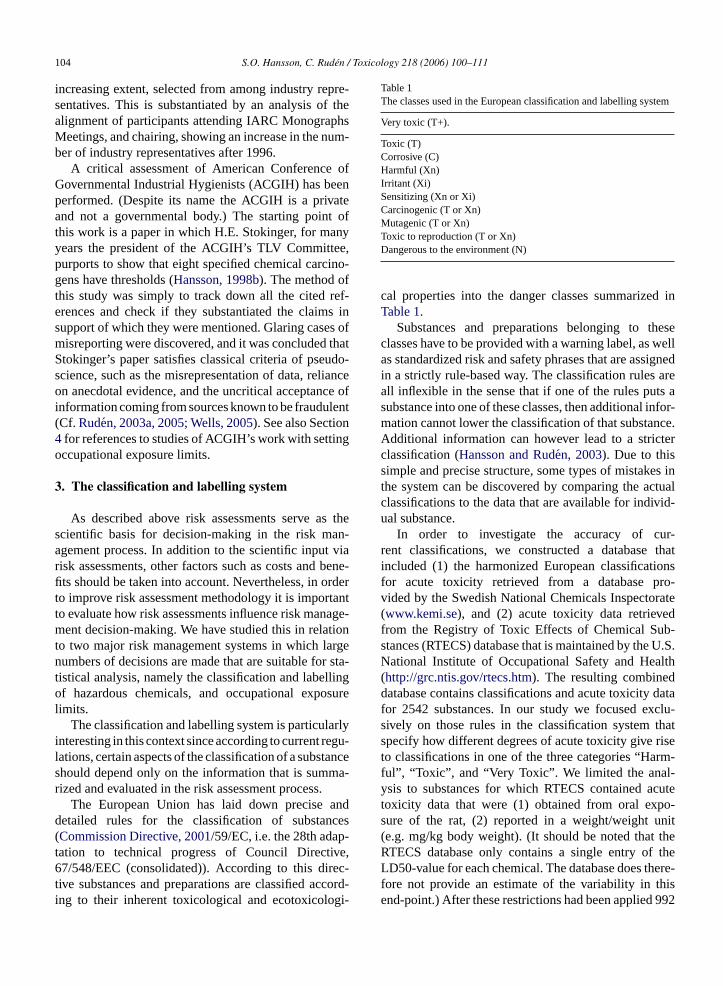
Table 1The classes used in the European classification and labelling system
Very toxic (T+).
Toxic (T)Corrosive (C)Harmful (Xn)Irritant (Xi)Sensitizing (Xn or Xi)Carcinogenic (T or Xn)Mutagenic (T or Xn)Toxic to reproduction (T or Xn)Dangerous to the environment (N)
cal properties into the danger classes summarized inTable 1.
Substances and preparations belonging to theseclasses have to be provided with a warning label, as wellas standardized risk and safety phrases that are assignedin a strictly rule-based way. The classification rules areall inflexible in the sense that if one of the rules puts asubstance into one of these classes, then additional infor-mation cannot lower the classification of that substance.Additional information can however lead to a stricterclassification (Hansson and Ruden, 2003). Due to thissimple and precise structure, some types of mistakes inthe system can be discovered by comparing the actualclassifications to the data that are available for individ-ual substance.
In order to investigate the accuracy of cur-rent classifications, we constructed a database thatincluded (1) the harmonized European classificationsfor acute toxicity retrieved from a database pro-vided by the Swedish National Chemicals Inspectorate(www.kemi.se), and (2) acute toxicity data retrievedfrom the Registry of Toxic Effects of Chemical Sub-stances (RTECS) database that is maintained by the U.S.National Institute of Occupational Safety and Health(http://grc.ntis.gov/rtecs.htm). The resulting combineddatabase contains classifications and acute toxicity datafor 2542 substances. In our study we focused exclu-sively on those rules in the classification system thatspecify how different degrees of acute toxicity give riseto classifications in one of the three categories “Harm-
-cutepo-nitthethe
here-his992
risk assessments, other factors such as costs andfits should be taken into account. Nevertheless, in oto improve risk assessment methodology it is importo evaluate how risk assessments influence risk mament decision-making. We have studied this in relato two major risk management systems in which lanumbers of decisions are made that are suitable fotistical analysis, namely the classification and labeof hazardous chemicals, and occupational expolimits.
The classification and labelling system is particulinteresting in this context since according to current rlations, certain aspects of the classification of a subsshould depend only on the information that is sumrized and evaluated in the risk assessment process
The European Union has laid down precisedetailed rules for the classification of substan(Commission Directive, 2001/59/EC, i.e. the 28th adatation to technical progress of Council Directi67/548/EEC (consolidated)). According to this dirtive substances and preparations are classified acing to their inherent toxicological and ecotoxicolo
ful”, “Toxic”, and “Very Toxic”. We limited the analysis to substances for which RTECS contained atoxicity data that were (1) obtained from oral exsure of the rat, (2) reported in a weight/weight u(e.g. mg/kg body weight). (It should be noted thatRTECS database only contains a single entry ofLD50-value for each chemical. The database does tfore not provide an estimate of the variability in tend-point.) After these restrictions had been applied
S.O. Hansson, C. Ruden / Toxicology 218 (2006) 100–111 105
substances in the combined database remained for theanalysis.
By comparing the classifications with the toxicitydata we could identify the substances that areappar-ently underclassified with respect to acute oral toxic-ity, according to the data available in RTECS. Simi-larly, we identified substances that areapparently over-classified. 15% of the substances in the database werefound to be apparently underclassified, and 8% wereapparently overclassified. To estimate if the RTECSdata are representative, acute toxicity data from twomore databases were collected for the substances thatwere found to be misclassified according to the RTECSdata. These supplementary data were taken from theNational Toxicology Program’s Chemical Health andSafety Data (NTP) (http://ntp-server.niehs.-nih.gov/)and the Hazardous Substances Data Bank (HSDB)(http://toxnet.nlm.nih.gov/)). The NTP database con-tains data on more than 2000 chemicals studied by theNational Toxicology Program. The HSDB contains datafor over 4500 chemicals that are taken from a core set ofmonographs supplemented with government documents,special reports, and primary journal literature. The datain the HSDB undergoes scientific review before pub-lication in the database. The data in these additionaldatabases did not change the general picture obtainedwith the RTECS data (Ruden and Hansson, 2003).
The Commission does not publish the documentationof its classification decisions. Due to this lack of trans-parency it was not possible to determine why almosta ub-s eemt
4
setb itsf ork-p nt ani sub-s ricalv ectedo LC50v videe s ofr onseq thodt iticala
sh-o er-
ence of Governmental Industrial Hygienists (ACGIH).The ACGIHs TLVs and theDocumentation publishedas decision motivations have repeatedly been criticizedfor insufficient scientific quality. It has been claimed thatthese documents in many cases were based on less thanadequate scientific data, and that economical and techni-cal feasibility has become too influential in the setting ofTLVs resulting in them offering only incomplete pro-tection against adverse health effects.Castleman andZiem (1988)reviewed the documentation for all chem-icals included in the 1986Documentation of the TLVs,scrutinizing the role of references to unpublished materi-als, such as personal communications, internal corporatereports including data from exposures of human volun-teers, and “industry experience”. The relative importanceof such references was assessed by scrutinizing the textsand determining whether such information had beenimportant in setting the TLV or in classifying the chem-ical’s carcinogenic status. The assessment was made onthe basis of a judgment of the full text for each chem-ical substance listed. (Due to the divergence of typeand quantity of information, the assessment was madewithout predefined, rigid criteria.) The analysis showsthat for a total of 104 substances the 1986 TLV Docu-mentation placed important or total reliance on unpub-lished corporate communications, that is more than onesixth of the number of (about 600) chemical substanceslisted in the 1986 Documentation (Castleman and Ziem,1988).
Roach and Rappaport (1990)made a detailed exam-c-
mancesthe158that
ncewasures
LVso be
0)12)HA.ettingThede ahilethat
ity of
fourth of the Commission’s own classification of stances according to their acute oral toxicity do not so accord with available scientific data.
. Exposure limits
Occupational exposure limit values (OELs) arey national authorities or other organizations as lim
or concentrations of hazardous compounds in wlace air. OELs for hazardous substances represe
mportant tool for risk management of hazardoustances in workplaces. Since OELs are exact numealues that can be compared to values that are collr derived in the risk assessment process (such asalues, effect levels and no-effect levels) they proxcellent material for statistical analysis of the effectisk assessments on risk management decisions. Cuently, OELs are probably the risk management me
hat has most often been subject to evaluation and crnalysis.
The most influential OELs are the so-called threld limit values (TLVs) set by the American Conf
-
ination of the references in the 1976 ACGIH TLV Doumentation, focusing on data from exposures of huvolunteers, and from “industrial experience”. Referenincluding both the incidence of adverse effects, andcorresponding exposure were collected resulting inpaired sets of data. The analysis of these data showwhile the TLVs had a poor correlation with the incideof adverse effects, a surprisingly strong correlationfound between the TLVs and the measured exposreported. It was concluded in this study that the Treflect the exposure levels perceived at the time tachievable by industry rather than effect levels.
In Rappaport (1993)the scientific basis of the (>45ACGIH TLVs is compared to the scientific basis of (permissible exposure limits (PELs) adopted by OSUsing benzene as an example, the processes of sPELs and TLVs, respectively, are further scrutinized.analysis indicates that the OSHA procedures incluthorough assessment of both risk and feasibility, wthe ACGIH has adopted a less rigorous proceduredepends heavily on the assessment of the feasibilthe TLVs.
106 S.O. Hansson, C. Ruden / Toxicology 218 (2006) 100–111
Other studies have criticized the ACGIH risk assess-ments of individual substances. (See e.g.Cunningham etal. (1998)for a critique of the 10-fold increase of the TLVfor amorphous silica fume,Egilman and Reinert (1995)scrutinizing the development of the ACGIH asbestosexposure guideline, andLanska (1999)criticizing thestandards forN-hexane.)
Bigelow and co-workers assessed the potential healthimpacts on healthcare workers of the proposed changeto replace regional occupational exposure limits (OELs)developed by the Worker’s Compensation Board ofBritish Columbia, with the ACGIH list of TLVs. Theoverall objective with this transition was to increase reg-ulatory efficiency by cutting cost and avoid duplicationof work (Bigelow et al., 2004). Publicly available mate-rial (including both policy documents and peer-reviewedjournal articles) was used to describe and evaluate theprocesses and policies of the Worker’s CompensationBoard and the ACGIH, respectively. A list of chem-icals used in the health care industry, developed bythe Occupational Health and Safety Agency for HealthCare in British Columbia, was used to identify relevantsubstances for a comparison of the regional OELs tothe ACGIH TLVs and potential discordances betweenthe different standards. For the chemicals that wereidentified as having significant discordances, the deci-sion motivations from both the Worker’s CompensationBoard and the ACGIH were scrutinized, and Medline andToxline databases were searched for additional data. Theassessment of potential health implications was made
mi-nal
ies,g ofd by
w ofthevingwillfive
ionon oftion.rityemi-cies)tionaredtialn theopt-
ing the TLVs in place of the OELs, “while not likelyto result in major health effects to [British Columbian]health care workers, may cause some increased morbid-ity in the short-term and does increase the risk of serioushealth effects” (Bigelow et al., 2004).
Greenberg (2004)reviews the published materialdescribing how British asbestos exposure standards werederived from 1898 to 2000, andMarkowitz and Rosner(1995) review the TLVs for silica from 1935 to 1990.Both papers describe the process of gradually lower-ing occupational exposure limits facing new data on theadverse effects of the respective substance, and the com-promises made between economic aspects of the industryand the protection of worker’s health.
A particularly interesting approach to exposure lim-its is to compare them to data indicating the comparativetoxicity of the regulated substances.Suda et al. (1999)investigated the correlations between acute toxicity data,namely the 50% lethal dose (LD50) obtained by oral andintraperitoneal injection, and the 50% lethal concentra-tion (LC50) obtained by inhalation in mice and rats,and the time-weighted average threshold limit values(TLVs–TWA) and the threshold limit values expressed asshort-term exposure limits (STEL) recommended by theACGIH.2 The toxicity data were obtained from the Reg-istry of Toxic Effects of Chemical Substances (RTECS).TLVs–TWA were correlated to LD50 or LC50 valueson a log–log scale. The correlation coefficient for LD50(oral) and TLV–TWA werer = 0.616 for the 211 chem-icals in the data set, and the corresponding correlation
and).(by
ion-n
a-othients603m-
e the50
ll asumanTEL
by a group of three scientists with expertise in epideology, toxicology, industrial hygiene, and occupatiomedicine.
It was concluded that the differences in philosophpolicies, and processes that influenced the settinOELs and TLVs were substantial. The process usethe Worker’s Compensation Board included a revieOELs from five different organizations (includingACGIH). This process has the advantage of improthe likelihood that the most recently developed OELform the basis of the standard. Having access toOELs, in combination with a strong union participatin the process, may also have promoted the adoptithe lowest value to ensure the highest level of protecThis is probably reflected in the finding that a majoof the discrepancies identified for the health care chcals (47 chemicals were found to have 57 discrepanwere such that the OELs of the Worker’s CompensaBoard were lower, and thus more protective, compto the TLVs of the ACGIH. An assessment of potenhealth impact was made for six chemicals selected obasis of exposure potential. It is concluded that ad
coefficients for intraperitoneal LD50s werer = 0.626 (for96 chemicals).
The correlation between LC50 (ppm, inhalation)TLV–TWA was calculated atr = 0.859 (113 chemicalsWhen exposure duration was taken into accountmultiplication of LC50 in ppm and exposure duratin hours obtained from RTECS; ppm× h) the correlation was improved slightly;r = 0.864. The correlatiobetween 37 TLVs–STEL and LC50 values werer = 0.867(ppm), andr = 0.912 (ppm× h). Taking exposure durtion into account thus improved the correlation in bthese cases. The corresponding correlation coefficfor toxicity data obtained in the mouse ranged from 0.to 0.819, and were in all comparisons slightly lower copared to rat data. Six chemicals were outliers (outsid95% confidence limits) in the TLV–TWA versus LD
2 The TLV–TWA is usually based on acute toxicity data as weany relevant sub-acute to chronic data (obtained from animal or hexposures) available for assessment. In the setting of the TLV–Son the other hand, short-term data may be more influential.
S.O. Hansson, C. Ruden / Toxicology 218 (2006) 100–111 107
(rat) oral plot. These were all identified as potent chronictoxicants (e.g. carcinogens and immunotoxicants). In theplotting of TLV–TWA and LD50 (rat) intraperitoneal,one outlier was identified (tri-o-cresyl phosphate). It isconcluded that the acute toxicity data correlate well toboth TLV–TWA and –STEL, and the implications of thiswith regard to the testing and standard setting proceduresare discussed (Suda et al., 1999).
Smith and Mendeloff (1999)provided a quantita-tive examination of the roles of potency and weight-of-evidence in setting permissible exposure limits (PELs)at the U.S. OSHA, and threshold limit values (TLVs)at ACGIH. The US EPA’s Integrated Risk InformationSystem (IRIS) was reviewed to identify all chemicals forwhich there were quantitative measures of carcinogenicpotency (i.e. cancerslope factors or unit risk factors) forinhalation exposures. Carcinogenic effects were eval-uated using the EPA’s unit risk values for inhalation(since the occupational exposure limits are for air). Theunit risk values are expressed in terms of theoreticalincreased cancer risk per unit concentration in air, i.e.risk per (�g/m3). These data were cross-referenced withthe ACGIH list of TLVs and OSHA PELs. This exerciseidentified 44 chemicals having both EPA unit risk andan ACGIH TLV, and 38 chemicals having both unit riskand a OSHA PEL (34 chemicals were in both sets). Sec-ondly weights of evidence assessments were obtainedfrom three different sources: EPA, ACGIH, and the Inter-national Agency for Research on Cancer (IARC). Thethree institutions’ respective classification classes wereu siona andt t forb witha ncya inP theA olet
d toc e toa mentf way,c ailyi m-i n bed ELt s oft eb o thee ess-m ffect
in humans. The critical effect is the adverse effect thatoccurs at the lowest dose (Nordberg et al., 1988). Thisconcept of critical effect is also used by the U.S. EPA.We divided the dose-related information for the criticaleffect that was given in the OEL documentations intothree categories: (1) no-effect levels (NELs); (2) “thresh-old levels” (TLs) below which the critical effect was saidnot appear, but with no information about whether or notthe effect is present at the threshold value itself, and (3)effect levels (ELs), defined as the lowest concentrationmentioned in the report at which the critical effectdoesappear. For a substance that had a no-effect level (NEL),the OEL/NEL ratio was calculated. In the other cases,OEL/TL, respectively,OEL/EL ratios were calculated.These ratios thus represent the actual assessment fac-tors. (It should be noted that some of them were above1, thus indicating no safety margin to the doses givingrise to the critical effect.)
For the purposes of evaluation, we divided substancesinto groups according to the nature of the critical effect(respiratory, neurological, etc.) The analysis showedlarge and unsystematic differences between ratios forthe same type of effect. It also showed a surprisinglack of discrimination between effect levels and no-effect-levels. One would expect OEL/EL ratios to beon average much smaller than OEL/NEL or OEL/TLratios, perhaps in the vicinity of one order of magnitudesmaller. (In the determination of allowable daily intakes,an extra factor of 10 is conventionally applied if the low-est experimental dose had significant adverse effects, so
used
iffer-ioses-n toels.eennter-son
all. Forn the
lim-ents,
l of
sed for characterizing weight of evidence. Regresnalyses were conducted with the log of unit risk
he weight of evidence variables. It was shown thaoth PELs and TLVs higher potency is associatedlower exposure limit. The authors found that pote
lone (log of unit risk) explains 49% of the variationELs and 62% of the variation in TLVs, and that forCGIH, weight-of-evidence plays a much smaller r
han potency.Occupational exposure limits (OELs) are intende
reate a safety margin in relation to levels that give risdverse effects. In spite of this, safety factors (assess
actors) are not used in a transparent and systematicontrary for instance to the setting of acceptable dntake limits (ADIs) in risk assessment of food contanants. However, the size of the safety margin caetermined post hoc by comparing the level of the O
o the scientific evidence. This was done in our studiehe Swedish OELs (Hansson, 1997, 1998a). Substancy substance, we compared the determined OELs txposure levels identified in the underlying risk assent documents as associated with the critical e
that a lowest observed adverse effect level has to beinstead of a no observed adverse effect level (Catalanoand Ryan, 1994; Pohl and Abadin, 1995).) It turnedout, however, that there was no such systematic dence between OEL/EL and OEL/NEL or OEL/TL rat(Tables 2 and 3). Based on this result, it can be qutioned whether regulators had paid sufficient attentiothe distinction between effect levels and no-effect lev
In addition to the above type of comparison betwOELs and underlying risk assessments, it is also of iest to compare different lists of OELs. A comparibetween two lists of exposure limits should refer tosubstances that have exposure limits on both listseach substance, the quotient between its values otwo lists is the best indicator of the difference.3 Thekey to accurate comparisons of lists of exposureits is to compute the geometric mean of these quotia method that was introduced in (Hansson, 1998a). (In
3 This use of quotients relies in principle on a linear modedose–response relationships.
108 S.O. Hansson, C. Ruden / Toxicology 218 (2006) 100–111
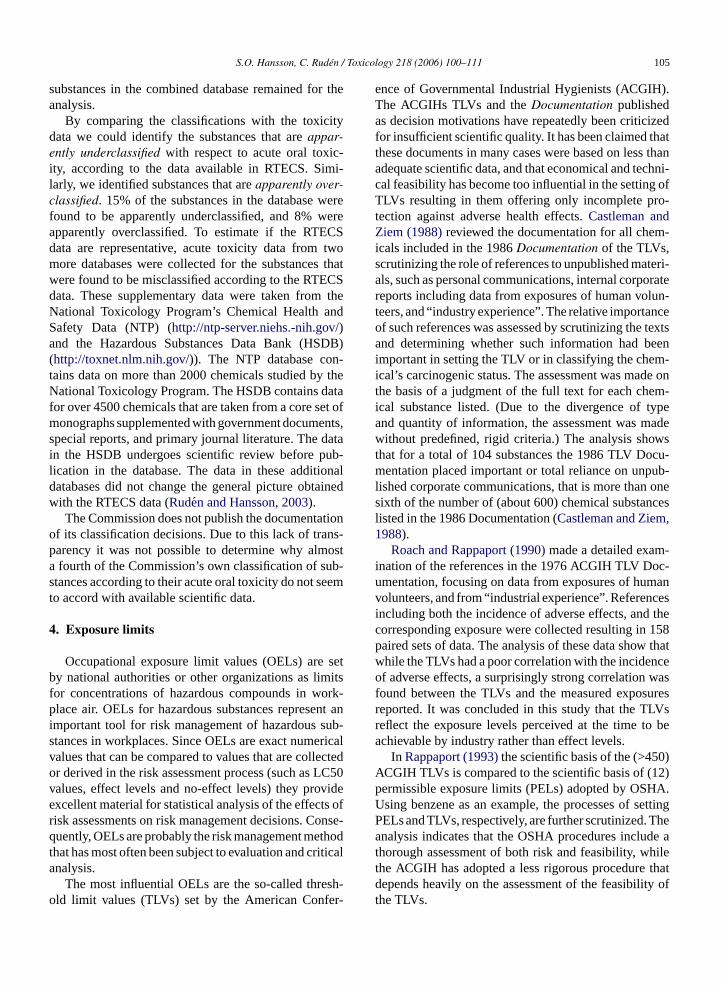
Table 2Swedish exposure limits in 1995 for substances with a respiratory critical effect, and a no-effect level for that effect, according to the publisheddocumentation
Substance No-effect level,NEL (mg/m3)
Effect that the NEL protects against Swedish OEL(mg/m3)
OEL/NEL
Aluminium 0.1–2.7 Pulmonary fibrosis. (It occurred at 1–10 but not at 0.1–2.7 mg/m3
respirable dust.)4 ≥1.5
Cobalt 0.03 Asthma. (Asthma induction at 0.05–0.10 mg/m3. Below 0.03 mg/m3
only reversible effects.)0.05 1.7
Piperazine 0.3 Asthma 0.3 1.0
The geometric mean of the OEL/NEL ratios is≥1.4 (Hansson, 1998a,b).
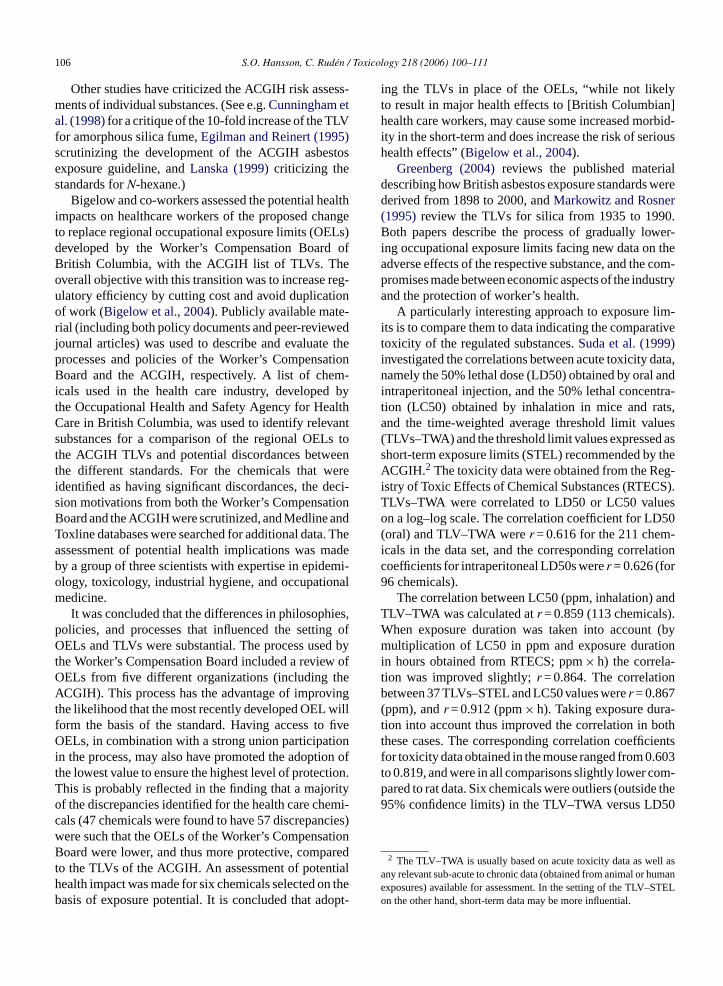
Table 3Swedish exposure limits in 1995 for substances with a respiratory critical effect, and an effect level for that effect, according to the publisheddocumentation
Substance, report year Effect level, EL Effect at EL Swedish OEL OEL/EL
Vanadium 0.06 mg/m3 Bronchial irritation and coughing (reversible). 0.2 mg/m3 3.3Sulfur dioxide 1 ppm Increased pulmonary resistance in volunteers (reversible). 2 ppm 2.0Coal dust 2 mg/m3 An estimated 1% risk of developing coal workers’
pneumoconiosis (CWP) and 0.3% risk of developingprogressive massive fibrosis (PMF) (irreversible).
3 mg/m3 1.5
Nitrogen dioxide 0.5 mg/m3 Increased pulmonary resistance (reversible). 4 mg/m3 8.0Cotton dust 0.3–0.5 mg/m3 Reduced lung function (reversible). 0.5 mg/m3 1.0–1.7Terpenes 125 mg/m3 Bronchial irritation, reduced lung function (irreversible). 150 mg/m3 1.2Ozone 0.24 mg/m3 Lower scores in some lung function tests after heavy
exercise (reversible).0.2 mg/m3 0.83
Di-isocyanates andpolyisocyanates
1 ppb Reduced lung function (irreversible). 5 ppb 5.0
Titanium dioxide 0.2–2.8 mg/m3 Reduced ventilation capacity and thickened pleura(irreversible).
5 mg/m3 >1.8
Paper dust <5 mg/m3 Irritation of upper and lower passages (reversible). 2 mg/m3 ≥0.4
The geometric mean of the OEL/EL ratios is 1.8–1.9 (Hansson, 1998a,b).
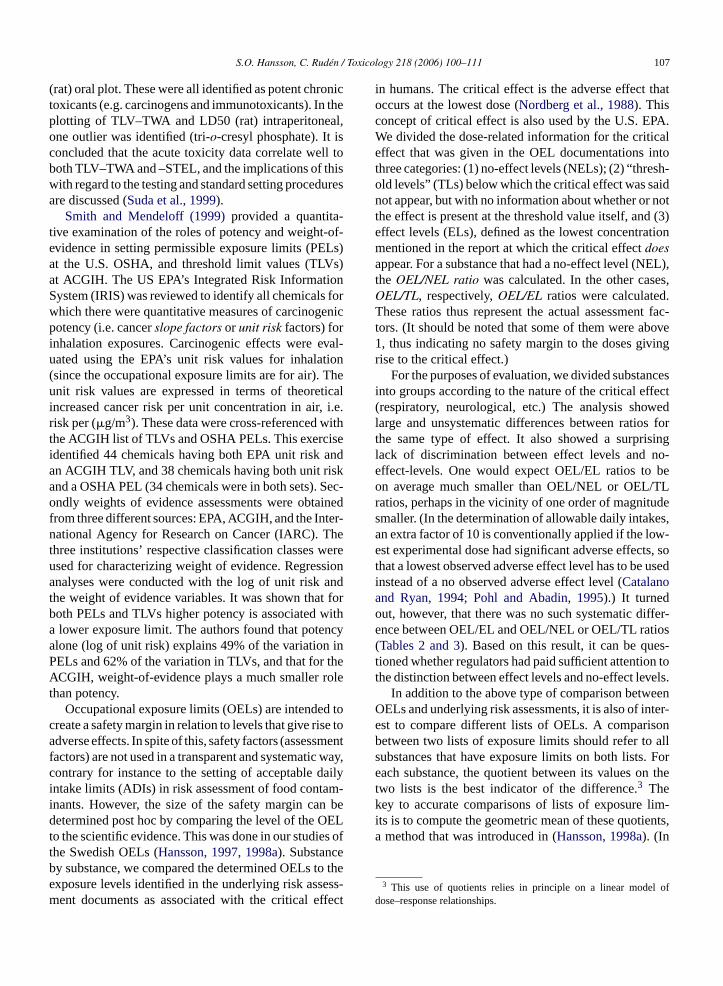
previous studies of OELs median values or arithmeticmeans were used (Hansson, 1982; Rappaport, 1993).)The reason why geometrical means should be used isexplained inTable 4.
Using geometric means, we have studied the over-all development of the ACGIH’s lists since the first list
Table 4Two hypothetical lists of OELs covering the same two substances Aand B
Substance ListA (mg/m3) List B (mg/m3) QuotientB/A
1 20 200 102 15 15 13 10 1 0.1
The geometric mean of the threeB/A quotients is 1.0, whereas thearithmetic mean is 3.7, which is unsatisfactory in view of the symmetryof the proportions. The arithmetic mean of theB/A quotients gives theincorrect impression that listB has higher values than listA, whereasthe arithmetic mean of theA/B quotients, which is also 3.7, gives theopposite impression. To the contrary, for any two listsA andB, thegeometric mean ofA/B quotients is above 1 if and only if that of theB/A quotients is below 1 (the product of the two values is always 1).
was issued in 1946, and similarly the development ofSwedish OELs since the first official list was issued in1969. In both cases a substantial but gradual decrease inthe exposure limits was observed (Hansson, 1998a).
When several lists of OELs, such as the official listsof different countries, are compared, it is useful to havea common standard against which all lists can be mea-sured. In other words, a standard listS should be chosen,such that the various listsA, B, C, etc. are compared interms of the geometric means of theA/S, B/S, C/S, etc.quotients. It can easily be shown that due to our choiceof geometric means for aggregation, the relationshipsbetween different lists (i.e. the ratios between the over-all values) will be the same irrespectively of the valueson the standard list.4 Therefore, the values assigned to
4 LetA andB be two lists, and letS1 andS2 be two candidate standardlists that have values for the same substances. Letm(A, S1) be the geo-metric mean of theA/S1 quotients, etc. Thenm(A, S1)/m(B, S1) = m(A,S2)/m(B, S2).
S.O. Hansson, C. Ruden / Toxicology 218 (2006) 100–111 109
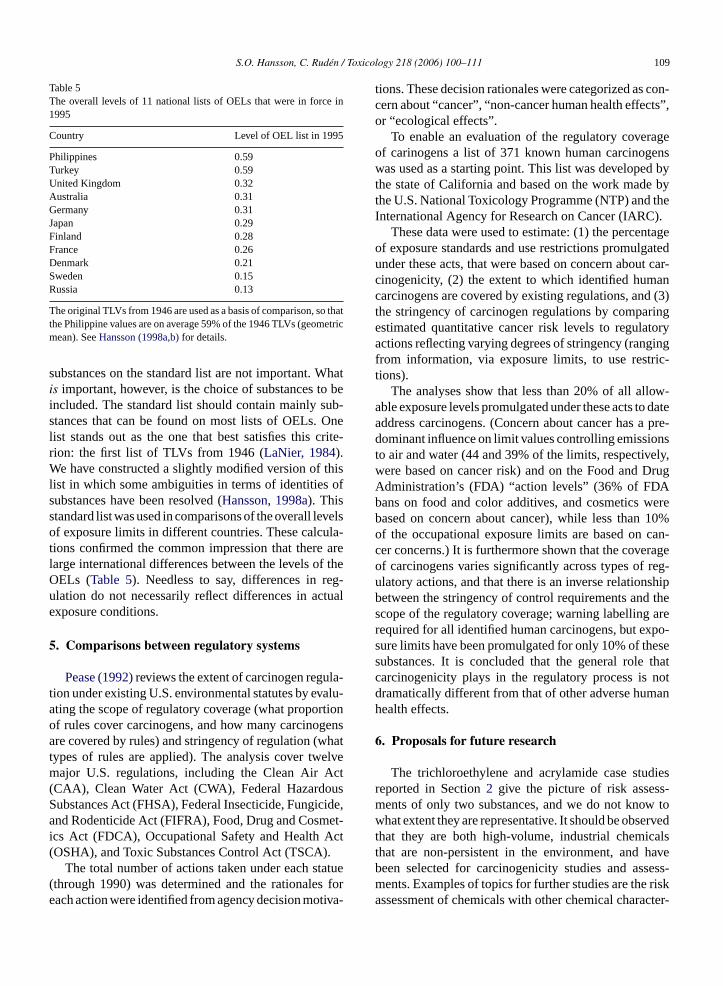
Table 5The overall levels of 11 national lists of OELs that were in force in1995
Country Level of OEL list in 1995
Philippines 0.59Turkey 0.59United Kingdom 0.32Australia 0.31Germany 0.31Japan 0.29Finland 0.28France 0.26Denmark 0.21Sweden 0.15Russia 0.13
The original TLVs from 1946 are used as a basis of comparison, so thatthe Philippine values are on average 59% of the 1946 TLVs (geometricmean). SeeHansson (1998a,b)for details.
substances on the standard list are not important. Whatis important, however, is the choice of substances to beincluded. The standard list should contain mainly sub-stances that can be found on most lists of OELs. Onelist stands out as the one that best satisfies this crite-rion: the first list of TLVs from 1946 (LaNier, 1984).We have constructed a slightly modified version of thislist in which some ambiguities in terms of identities ofsubstances have been resolved (Hansson, 1998a). Thisstandard list was used in comparisons of the overall levelsof exposure limits in different countries. These calcula-tions confirmed the common impression that there arelarge international differences between the levels of theOELs (Table 5). Needless to say, differences in reg-ulation do not necessarily reflect differences in actualexposure conditions.
5. Comparisons between regulatory systems
Pease (1992)reviews the extent of carcinogen regula-tion under existing U.S. environmental statutes by evalu-ating the scope of regulatory coverage (what proportionof rules cover carcinogens, and how many carcinogensare covered by rules) and stringency of regulation (whattypes of rules are applied). The analysis cover twelvemajor U.S. regulations, including the Clean Air Act(CAA), Clean Water Act (CWA), Federal HazardousSubstances Act (FHSA), Federal Insecticide, Fungicide,and Rodenticide Act (FIFRA), Food, Drug and Cosmet-i ct( .
tatue( s fore tiva-
tions. These decision rationales were categorized as con-cern about “cancer”, “non-cancer human health effects”,or “ecological effects”.
To enable an evaluation of the regulatory coverageof carinogens a list of 371 known human carcinogenswas used as a starting point. This list was developed bythe state of California and based on the work made bythe U.S. National Toxicology Programme (NTP) and theInternational Agency for Research on Cancer (IARC).
These data were used to estimate: (1) the percentageof exposure standards and use restrictions promulgatedunder these acts, that were based on concern about car-cinogenicity, (2) the extent to which identified humancarcinogens are covered by existing regulations, and (3)the stringency of carcinogen regulations by comparingestimated quantitative cancer risk levels to regulatoryactions reflecting varying degrees of stringency (rangingfrom information, via exposure limits, to use restric-tions).
The analyses show that less than 20% of all allow-able exposure levels promulgated under these acts to dateaddress carcinogens. (Concern about cancer has a pre-dominant influence on limit values controlling emissionsto air and water (44 and 39% of the limits, respectively,were based on cancer risk) and on the Food and DrugAdministration’s (FDA) “action levels” (36% of FDAbans on food and color additives, and cosmetics werebased on concern about cancer), while less than 10%of the occupational exposure limits are based on can-cer concerns.) It is furthermore shown that the coverage
reg-shipthearepo-esethatnotan
diess-
w toervedcalshavesess-riskcter-
cs Act (FDCA), Occupational Safety and Health AOSHA), and Toxic Substances Control Act (TSCA)
The total number of actions taken under each sthrough 1990) was determined and the rationaleach action were identified from agency decision mo
of carcinogens varies significantly across types ofulatory actions, and that there is an inverse relationbetween the stringency of control requirements andscope of the regulatory coverage; warning labellingrequired for all identified human carcinogens, but exsure limits have been promulgated for only 10% of thsubstances. It is concluded that the general rolecarcinogenicity plays in the regulatory process isdramatically different from that of other adverse humhealth effects.
6. Proposals for future research
The trichloroethylene and acrylamide case stureported in Section2 give the picture of risk assesments of only two substances, and we do not knowhat extent they are representative. It should be obsthat they are both high-volume, industrial chemithat are non-persistent in the environment, andbeen selected for carcinogenicity studies and asments. Examples of topics for further studies are theassessment of chemicals with other chemical chara
110 S.O. Hansson, C. Ruden / Toxicology 218 (2006) 100–111
istics (e.g. persistent and bioaccumulating chemicals),assessments that have been made within other legislativeframeworks (e.g. biocides, pharmaceuticals, and pesti-cides), and risk assessments of other end-points thancancer.
In our study of the classification and labelling systemwe found the accuracy of the harmonized classifica-tions for acute systemic toxicity to be surprisingly low.Additional studies of this central part of the regulatorysystem are needed before more general conclusions canbe drawn. This should include classifications of otherend-points, such as classifications for carcinogenicityand reproductive toxicity.
Our studies of occupational exposure limits indicatelarge and unsystematic differences between decisionsmade for different chemicals with similar adverse healtheffects. It should be of interest to study other types ofexposure limits, such as those for ambient air, food anddrinking water.
Future investigation should include a wide range ofrisk management tools, spanning from product informa-tion, e.g. safety data sheets, to decisions to phase outthe use of substances. Additional knowledge about theapplications of general risk assessment and risk man-agement principles in different regulatory settings, inparticular the substitution principle (i.e. the principle thata chemical substance should be substituted when a saferalternative is available), and the precautionary principle(i.e. that actions to reduce unwanted effects from chem-icals should be taken even if the scientific indications of
ien-restoryestsiples, andni-forate
stem
pli-ating: anealth
shold
entals.),
Chemical Risk Assessment and Occupational Health. AuburnHouse, London, pp. 123–136.
Commission Directive, 2001/59/EC. Adapting to technical progress forthe 28th time Council Directive 67/548/EEC on the approximationof the laws, regulations and administrative provisions relating tothe classification, packaging and labelling of dangerous substances.O.J. L 225/1 (2001).
Cunningham, E.A., Todd, J.J., Jablonski, W., 1998. Was there sufficientjustification for the 10-fold increase in the TLV for silica fume? Acritical review. Am. J. Ind. Med. 33 (3), 212–223.
Egilman, D.S., Reinert, A.A., 1995. The origin and development ofthe asbestos threshold limit value — scientific indifference andcorporate influence. Int. J. Health Serv. 25 (4), 667–696.
European Commission, 2003. Technical guidance document in supportof the commission directive 93/67/EEC in risk assessment for newnotified substances and the Commission regulation (EC) 1488/94on risk assessment for existing substances. (Available on-line at:www.ecb.it).
Greenberg, M., 2004. The British approach to asbestos standard setting:1898–2000. Am. J. Ind. Med. 46 (5), 534–541.
Hansson, S.O., 1982. Acceptabel risk? Om gransvarden i arbetsmiljon(Acceptable Risk? On Exposure Limits in the Working Environ-ment). Stockholm, Tiden.
Hansson, S.O., 1997. Critical effects and exposure limits. Risk Anal.17, 227–236.
Hansson, S.O., 1998a. Setting the Limit. Occupational Health Stan-dards and the Limits of Science. Oxford University Press.
Hansson, S.O., 1998b. A case study of pseudo-science in occupationalmedicine. New Solutions 8, 175–189.
Hansson, S.O., Ruden, C., 2003. Improving the incentives for toxicitytesting. J. Risk Res. 6, 3–21.
Huff, J., 2002. IARC monographs, industry influence, and upgrading,downgrading, and under-grading chemicals: a personal point ofview, International Agency for Research on Cancer. Int. J. Occup.Health 8 (3), 249–270.
irty-icancin-
stan-th
lica(2),
988.ntific.Risk
ir pol-emy
07-5th
trial-
ini-188.sure
ited
the existence of that effect do not amount to full sctific proof), is furthermore needed. It is also of inteto follow changes over time, including the regulatimpact of new test results, the introduction of new tand other new science, new risk assessment princ(e.g. concerning methods for species extrapolation)new legislations. A particular challenge will be to motor the implementation of the new regulatory systemchemicals control in Europe (REACH), and to evaluthe actual working of this system compared to the syit is replacing, once it comes into force.
References
Bigelow, P., Moore, D., Yasi, A., 2004. Assessing the health imcations for healthcare workers of regulatory changes eliminlocally developed occupational exposure limits in favor of TLVsevidence-based bipartite approach. Int. J. Occup. Environ. H10 (4), 433–444.
Castleman, B.I., Ziem, G.E., 1988. Corporate influence on threlimit values. Am. J. Ind. Med. 13 (5), 531–559.
Catalano, P.J., Ryan, L.M., 1994. Statistical Issues in DevelopmToxicology. In: Smith, C.M., Christiani, D.C., Kelsey, K.T. (Ed
LaNier, M.E., 1984. Threshold limit values — discussion and thfive years index with recommendations. Annals of the AmerConference of Governmental Industrial Hygienists. vol. 9, Cinnati, ACGIH.
Lanska, D.J., 1999. Limitations of occupational air contaminantdards, as exemplified by the neurotoxinN-hexane. J. Public HealPolicy 20 (4), 441–458.
Markowitz, G., Rosner, D., 1935. The limits of thresholds — siand the politics of science to 1990. Am. J. Public Health 85253–262.
Nordberg, G.F., Frostling, H., Lundberg, P., Westerholm, P., 1Swedish occupational exposure limits: developments in scieevaluation and documentation. Am. J. Ind. Med. 14, 217–221
National Research Council, 1994. Science and Judgement inAssessment. Committee on risk assessment of hazardous alutants, Commission on life sciences, NRC, National AcadPress, Washington, DC.
OECD Guidelines for the Testing of Chemicals PDF Edition (16310X) includes all test guidelines up to and including the 1Addendum, 2004.
Pease, W.S., 1992. The role of cancer risk in the regulation of induspollution. Risk Anal. 12 (2), 253–265.
Pohl, H.R., Abadin, H.G., 1995. Utilizing uncertainty factors in mmal risk levels derivation. Regul. Toxicol. Pharmacol. 22, 180–
Rappaport, S.M., 1993. Threshold limit values, permissible expolimits, and feasibility: the bases for exposure limits in the UnStates. Am J. Ind. Med. 23, 683–694.
S.O. Hansson, C. Ruden / Toxicology 218 (2006) 100–111 111
Roach, S.A., Rappaport, S.M., 1990. But they are not thresholds: acritical analysis of the documentation of threshold limit values.Am. J. Ind. Med. 17, 727–753.
Ruden, C., 2001a. The use and evaluation of primary data in 29trichloroethylene carcinogen risk assessments. Regul. Toxicol.Pharmacol. 34 (1), 3–16.
Ruden, C., 2001b. Interpretations of primary carcinogenicity data in 29trichloroethylene risk assessments. Toxicology 169 (3), 209–225.
Ruden, C., 2002a. Scrutinizing three trichloroethylene carcinogenicityclassifications in the European Union — implications for the riskassessment process. Int. J. Toxicol. 21 (6), 441–450.
Ruden, C., 2002b. The use of mechanistic data and the handlingof scientific uncertainty in carcinogen risk assessment — thetrichloroethylene example. Regul. Toxicol. Pharmacol. 35 (1),80–94.
Ruden, C., 2003a. Scrutinizing ACGIH risk assessments — thetrichloroethylene case. Am. J. Ind. Med. 44, 207–213.
Ruden, C., 2003b. Science and trans-science in carcinogen riskassessment — the European regulatory process for trichloroethy-
lene. J. Toxicol. Environ. Health B: Crit. Rev. 6 (3), 257–277.
Ruden, C., 2004. Acrylamide and cancer risk — expert risk assess-ments and the public debate. Food Chem. Toxicol. 42, 335–349.
Ruden, C., Hansson, S.O., 2003. How accurate are the EuropeanUnion’s classifications of chemical substances. Toxicol. Lett. 144(2), 159–173.
Ruden, C., 2005. Re: Am J Ind Med 44:204–213, 2003. Response tothe Letter to the Editor From Vickie L. Wells (ACGIH). Am. J. Ind.Med. 47 (5), 464–466.
Smith, J.S., Mendeloff, J.M., 1999. A quantitative analysis of fac-tors affecting PELs and TLVs for carcinogens. Risk. Anal. 19 (6),1223–1234.
Suda, M., Tsuruta, H., Honma, T., 1999. The contribution of acutetoxicity in animals to occupational exposure limits of chemicalsubstances. Ind. Health 37 (1), 22–27.
Wells, V.L., 2003. Re: Am J Ind Med 44:204–213, 2003. ScrutinizingACGIH risk assessments: the trichloroethylene case. Am. J. Ind.Med. 47 (5), 463.