Embed Size (px)
Citation preview
Evaluating the Sustainability and Impacts of Water, Sanitation & Hygiene Interventions
Ranjiv Khush and Alicia LondonAquaya Institute
In collaboration with:Professor Jack Colford and Ben Arnold
School of Public Health, University of California, Berkeleyand
Professor Kalpana Balakrishnan and Dr. Padmavathi Ramaswamy Department of Environmental Engineering, Sri Ramachandra
Final ReportOctober 2009
SRI RAMACHANDRAUNIVERSITY

This page intentionally left blank.
EVALUATING THE SUSTAINABILITY AND IMPACTS OF WATER, SANTATION & HYGIENE INTERNVENTIONS
3
Revision: November 10, 2009 5:26 PM
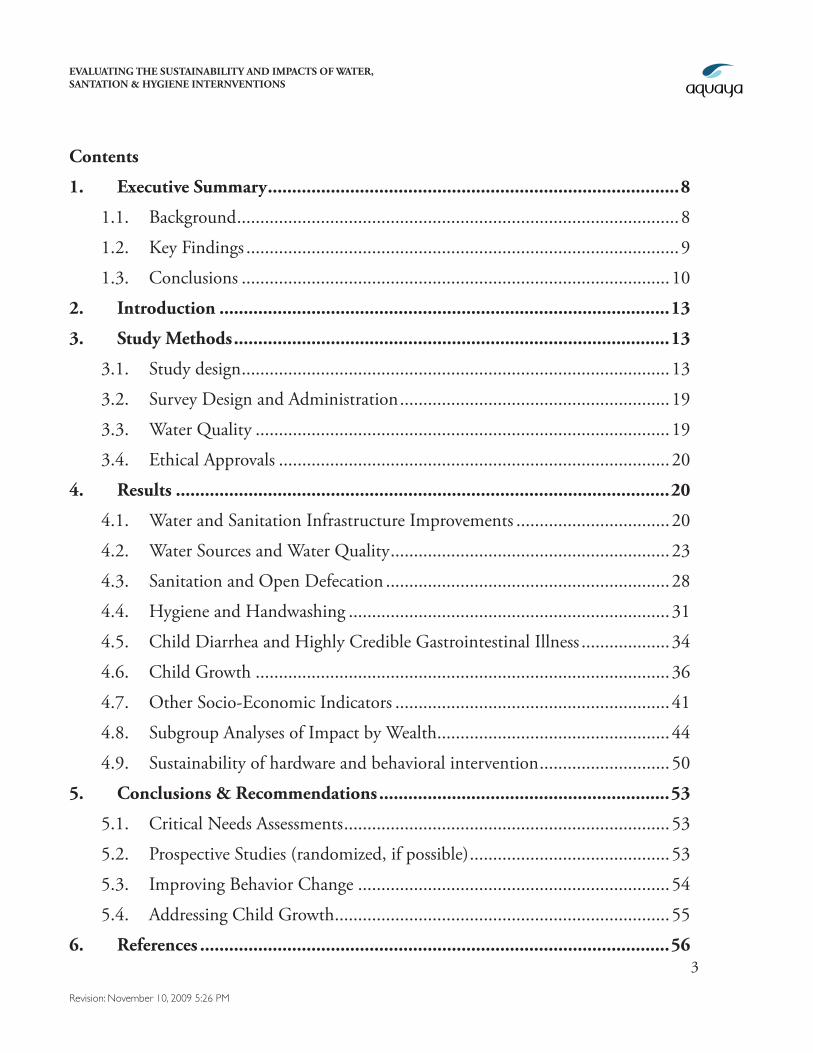
Contents
1. Executive Summary .....................................................................................8
1.1. Background ...............................................................................................8
1.2. Key Findings .............................................................................................9
1.3. Conclusions ............................................................................................10
2. Introduction .............................................................................................13
3. Study Methods ..........................................................................................13
3.1. Study design ............................................................................................13
3.2. Survey Design and Administration ..........................................................19
3.3. Water Quality .........................................................................................19
3.4. Ethical Approvals ....................................................................................20
4. Results ......................................................................................................20
4.1. Water and Sanitation Infrastructure Improvements .................................20
4.2. Water Sources and Water Quality ............................................................23
4.3. Sanitation and Open Defecation .............................................................28
4.4. Hygiene and Handwashing .....................................................................31
4.5. Child Diarrhea and Highly Credible Gastrointestinal Illness ...................34
4.6. Child Growth .........................................................................................36
4.7. Other Socio-Economic Indicators ...........................................................41
4.8. Subgroup Analyses of Impact by Wealth ..................................................44
4.9. Sustainability of hardware and behavioral intervention ............................50
5. Conclusions & Recommendations ............................................................53
5.1. Critical Needs Assessments ......................................................................53
5.2. Prospective Studies (randomized, if possible) ...........................................53
5.3. Improving Behavior Change ...................................................................54
5.4. Addressing Child Growth ........................................................................55
6. References .................................................................................................56
EVALUATING THE SUSTAINABILITY AND IMPACTS OF WATER, SANTATION & HYGIENE INTERNVENTIONS
4
Revision: November 10, 2009 5:26 PM
Table of Figures
Figure 1. New private toilet and water sources in the five years that cover the intervention period (2003-2008). .......................................................................... 21
Figure 2. Private toilet and tap ownership before (2003) and after (2008) the intervention. ........................................................................................................... 22
Figure 3. Primary water sources by intervention group. ......................................... 23
Figure 4. Time spent gathering water each day in households with private and public taps. ....................................................................................................................... 24
Figure 5. Time spent gathering water each day in intervention and control households. ............................................................................................................. 25
Figure 6. Proportion of water samples testing positive for E. coli in village source samples (left plot) and household drinking water samples (right plot). .................... 26
Figure 7. Proportion of water samples testing positive for H2S producing bacteria in village source samples (left plot) and household drinking water samples (right plot). 27
Figure 8. Open Defecation practices among men women and children under 5 years old in intervention and control households. ............................................................ 29
Figure 9. Adult open defecation frequency in households that have a private toilet in intervention and control villages. ............................................................................ 30
Figure 10. Counts of self-reported handwashing with water alone (top plot) and water plus soap (bottom plot) during 12 critical times. .................................................... 31
Figure 11. Longitudinal prevalence of diarrhea and Highly Credible Gastrointestinal Illness (HCGI) among children < 5 over 65 weeks of follow up (aggregated to 2 week periods). ................................................................................................................ 34
Figure 12. Longitudinal prevalence of diarrhea among children < 5 years by village over 65 weeks of follow-up (aggregated into 2-week periods). ................................ 35
Figure 13. Longitudinal prevalence of diarrhea among children < 5 years by intervention group over 65 weeks of follow-up (aggregated into 2-week periods). .. 36
Figure 14. Anthropometric Z-scores by age. ......................................................... 37
Figure 15. Box plots of anthropometric Z-scores for children in control and intervention villages. ............................................................................................. 38
EVALUATING THE SUSTAINABILITY AND IMPACTS OF WATER, SANTATION & HYGIENE INTERNVENTIONS
5
Revision: November 10, 2009 5:26 PM
Figure 16. Smoothed kernel density plots of anthropometric Z-score distributions for children in control and intervention villages. ......................................................... 40
Figure 17. Smoothed kernel density distributions of the PCA-based wealth index score by intervention group. ............................................................................................. 44
Figure 18. Private toilet and private tap ownership by wealth index quintile and intervention status in 2008. ..................................................................................... 47
Figure 19. Private toilet and private tap ownership by scheduled caste and intervention status in 2008. ......................................................................................................... 48
Figure 20. Village mean proportion of households that report open defecation by time since completion of the intervention. .................................................................... 50
Figure 21. Village-level adult open defecation prevalence versus village-level private toilet ownership. .................................................................................................... 51
Figure 22. Village mean proportion of households with four hygiene indicators by time since intervention completion. ....................................................................... 52
EVALUATING THE SUSTAINABILITY AND IMPACTS OF WATER, SANTATION & HYGIENE INTERNVENTIONS
6
Revision: November 10, 2009 5:26 PM
Table of Tables
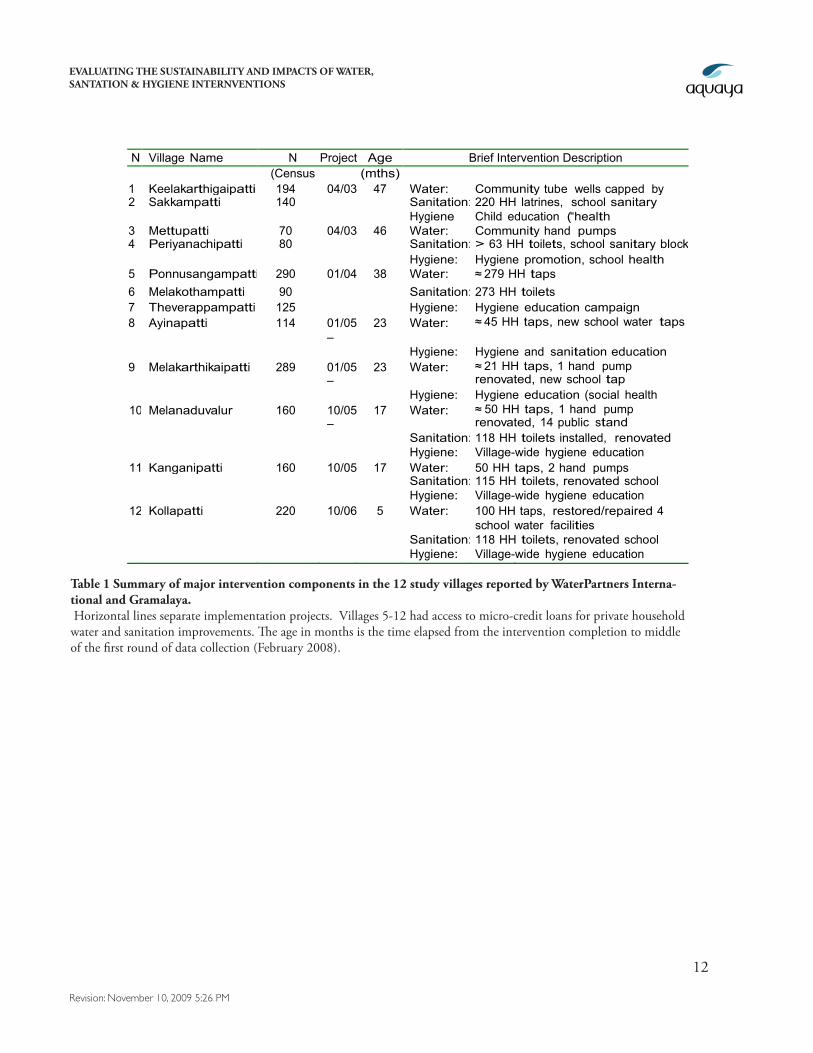
Table 1 Summary of major intervention components in the 12 study villages reported by WaterPartners International and Gramalaya. ...................................................... 12
Table 2. Summary of pre-intervention characteristics before and after village selection. 17
Table 3. Summary of post-intervention characteristics at the beginning of data collection in 2008. ................................................................................................ 18
Table 4. Proportion (%) of households that use various water sources. .................. 24
Table 5. Summary of mean water quality measures for village source samples and household water samples measured over the study period. ................................ 25
Table 6. Summary of open defecation, private toilets, and perceived privacy/safety for women and girls in control and intervention households. ....................................... 28
Table 7. Summary of hygiene spot checks. .............................................................. 32
Table 9. Caregiver self-reported handwashing with soap after four critical times with potential for contact with human or animal feces. ................................................. 33
Table 8. Proportion (%) of caregivers reporting washing their hands with water or with water and soap during 12 critical times. ......................................................... 33
Table 10. Weeks of illness (N) and weekly longitudinal prevalence (%) of diarrhea, highly credible gastrointestinal illness (HCGI) and related symptoms in children under age 5. ......................................................................................................... 34
Table 11. Summary of unadjusted and adjusted estimates of the longitudinal prevalence difference of illness (intervention minus control) for diarrhea and highly credible gastrointestinal illness (HCGI). ............................................................... 35
Table 12. Summary of unadjusted and adjusted estimates of anthropometric Z-score differences (intervention minus control) in children under age 5. ......................... 39
Table 13. Summary of school attendance among children 5-18 years old and school days missed due to illness in control and intervention villages. .............................. 41
Table 15. Caretaker days missed from work and school due to gastrointestinal illness in children under 5. ............................................................................................... 42
Table 14. Medical visits and medical expenditures due to diarrhea and gastrointestinal illness in children less than 5 years of age. ..................................... 42
EVALUATING THE SUSTAINABILITY AND IMPACTS OF WATER, SANTATION & HYGIENE INTERNVENTIONS
7
Revision: November 10, 2009 5:26 PM
Table 16. Summary of perceived benefits associated with a new primary water source in the last 5 years. .................................................................................................... 43
Table 17. Summary of household characteristic means by wealth index quintile (1 = poorest). ................................................................................................................ 45
Table 18. Analysis of the proportion of households that installed new private toilets by wealth index quintile and Scheduled caste status. .................................................. 46
Table 19. Analysis of the proportion of households that installed new private tap by wealth index quintile and scheduled caste status. ................................................... 46
Table 20. Subgroup analysis of the longitudinal prevalence (LP) of diarrhea by wealth index quintile and Scheduled caste status. .............................................................. 49
Table 21. Subgroup analysis of the height-for-age Z-scores by wealth index quintile and scheduled caste status........................................................................................ 49
Table 22. Summary of the proportion of private toilets in use by age of the
toilet. ..................................................................................................................... 50
EVALUATING THE SUSTAINABILITY AND IMPACTS OF WATER, SANTATION & HYGIENE INTERNVENTIONS
8
Revision: November 10, 2009 5:26 PM
1. Executive Summary1.1. Background
The Open Square Foundation commissioned an impact evaluation of community-level water, sanita-tion, and hygiene interventions that were implemented between 2003 and 2007 through collabora-tion between the international non-governmental organization (NGO), WaterPartners International (WPI), and their local NGO partner, Gramalaya, in the Tiruchirappalli District of the State of Tamil Nadu in Southern India. The evaluation was conducted through collaboration between the Aquaya Institute, Professor Jack Colford’s group in the School of Public Health at the University of Califor-nia, Berkeley (UCB), and Professor Kalpana Balakrishnan’s Environmental Engineering Department at Sri Ramachandra University and Medical College (SRMC), Chennai, India. The field component of the evaluation was initiated in September 2007 and completed in April 2009. This fieldwork consisted of 12 monthly surveys that employed observations, structured questionnaires of possible in-tervention outcomes, measurements of child growth, and analysis of water quality, in 900 households that included 1,285 children under age five.
The water, sanitation, and hygiene interventions evaluated in this study comprise 12 independent community-level programs that employed similar implementation strategies and were initiated at different time points over 3.5 years (Table 1). WPI/Gramalaya also introduced an innovative micro-credit scheme in 8 of the 12 intervention villages to compliment their hygiene education, water supply and Community Led Total Sanitation (CLTS) interventions. The micro-credit scheme enabled families to borrow money from village-level Self Help Groups (SHGs) to construct latrines, toilets, bathing facilities, household water connections, and communal water stand posts. Gramalaya provided funds directly to selected village SHGs who administered the household loans and assumed responsibility for repaying Gramalaya. By the end of 2007, Gramalaya had loaned $98,883 for 496 water loans and 1,177 sanitation related loans (average loan size: $59) among the 8 villages (Arney et al. 2008.).
These interventions were not randomly assigned to villages; therefore, we conducted a quasi-ex-perimental1 study to measure behavioral and child health impacts from the intervention program. Rigorous statistical techniques were employed to pair the 12 intervention villages with 13 matched control villages. The pairings were made prior to and independently of any analyses of the interven-tion outcomes.
1 Quasi-experimental designs are study designs that include both intervention (treated) and control groups (untreated), but treatment is not assigned randomly by the investigators. Without randomization, the intervention group could be self-selected or purposely selected by implementing organizations, and thus may differ, on average, from non-intervention villages in characteristics that influence outcomes of interest. In this design, we have used restriction and propensity score matching to identify a control group that is as similar as possible to the intervention group based on observable pre-intervention characteristics. The additional benefit of randomization is that it balances unobservable characteristics, which cannot be ensured in non-randomized designs.
EVALUATING THE SUSTAINABILITY AND IMPACTS OF WATER, SANTATION & HYGIENE INTERNVENTIONS
9
Revision: November 10, 2009 5:26 PM
1.2. Key Findings
1. Improvements in water and sanitation infrastructure are sustained:
• 26%of interventionvillagehouseholdsreportanewwatersource(privateandpublictaps)between2003-2008versus18%of controlhouseholds.
• 48%of interventionvillagehouseholdsreportanewprivatetoiletversus15%of con-trolhouseholds.
• IncreasesinprivatetapandtoiletownershiprelativetocontrolvillagesaregreatestinthelowerincomeandScheduledcasthouseholds.
• 96%of householdswithprivatetapsusethemastheirprimarywatersource.
• Morethan94%of theprivatetoiletswereinuseupto5yearsafterconstruction.
2. Behavior change has not kept pace with infrastructure improvements:
• Objectiveindicatorsof hygienepracticesshowsimilarlypoorhouseholdhygienecondi-tionsininterventionandcontrolvillages,andfewerthan25%of primarycaregiversof youngchildrenreportwashingtheirhandswithsoapaftercontactwithfeces.
• Nearly40%of householdswithaprivatetoiletreportthatadultspracticedailyopendef-ecation,whichsuggeststhatalargeproportionof householdswithprivatetoiletscon-tinuetofacebarriers–cultural,logisticalorotherwise–toeliminatingopendefecation.
3. The improvements in water and sanitation infrastructure provide non-health benefits:
• Privatelatrineownerswere1.5timesmorelikelytoreportthatwomenandgirlsfeltsafeduringdefecationinthenightordaytimethanhouseholdsthatdonotownprivatelatrines(81%versus53.4%).
• Installingaprivatetapsavesamedianof 25minutesperdayinwatergatheringcom-paredtousingapublictap(50minutesversus75minutes).
4. Intervention villages have improved source water quality but not household water quality
• InterventionvillagewatersourceshadlessE. coliper100ml(differenceinlog10=-0.29,95%CI:-0.56,-0.05)andalowerproportionof samplestestingpositiveforE. coli (8.5%versus16.6%,difference=-8.1%,95%CI:-1.4%,-15.4%).
• Byallmicrobialwaterqualitymeasures(E. coli,totalcoliforms,andH2Sproducingbac-teria),householdwatersamplesweremorecontaminatedthanvillagesourcesamplesininterventionandcontrolvillages.
• Differencesinhouseholdwaterqualitybetweeninterventionandcontrolvillagesarenotstatisticallysignificant.
5. The intervention programs have not provided discernable health benefits:
• Diarrheaprevalenceinchildrenunder5isuniformlylowinbothcontrolandinterven-tionvillages(below2%over12months).Giventhislowprevalencethereislittleroom
EVALUATING THE SUSTAINABILITY AND IMPACTS OF WATER, SANTATION & HYGIENE INTERNVENTIONS
10
Revision: November 10, 2009 5:26 PM
forimprovement.
• Primarycaretakersinboththecontrolandinterventiongroupsreporthighlevelsof childschoolattendanceandlowlevelsof absenceduetoillness.
• Primarycaretakersinbothgroupsreportlessthan1medicalvisitperchildperyearduetodiarrhea.
• Primarycaretakersinbothgroupsreportlessthan1workdaylostperyearduetocaringforachildwithdiarrhea.
• Childreninboththecontrolandinterventiongroupsshowsignificantandequivalentlevelsof growthfaltering(stunting,wasting,andmalnutrition)basedoncomparisonsof growthmeasurementswithinternationalstandards.
6. Perceived economic benefits of improved water infrastructure are low:
• 5%of familieswithnewwatersourcesassociateincreasedhouseholdincomewiththeirimprovedaccesstowater.
• 6%of familieswithnewwatersourcesassociateanewincome-earningjobwiththeirimprovedaccesstowater.
1.3. Conclusions
The findings of this evaluation provide evidence that the village-level water, sanitation, and hygiene improvement programs implemented in the Trichy district of Tamil Nadu state by WPI and Gra-malaya resulted in improved water and sanitation infrastructure as measured by new taps and toilets between 2003-2008, particularly among middle and lower-income families and members of the Scheduled caste. These gains provide significant time savings for families with private taps and an increased sense of safety for women and girls among families with private toilets.
Although many more intervention households (57%) have private toilets than control households (26%), the difference between intervention and control households in levels of private taps is more modest (30% versus 27%). The relative parity in private taps suggests that water infrastructure improvements are proceeding at a significant rate in rural areas of the Trichy district in the absence of NGO assistance. In addition, the prevalence of diarrhea among children < 5 in control villages is <2%, which suggests that in this region there is little room for additional reductions in diarrheal disease from environmental interventions. The advancements in rural water infrastructure and low levels of child diarrhea may be linked to general improvements in socio-economic development and healthcare: reported indices indicate that Tamil Nadu is one of the most highly developed states of India and ranks first among all states in primary health care (Aiyer, 2008). Consequently, for inter-ventions that are motivated by the reduction of diarrhea in young children, careful consideration of prevailing development trends and rigorous pre-intervention measurements of diarrhea prevalence should be conducted prior to implementation.
In many populations, however, non-health benefits alone may be sufficient to justify water supply and sanitation intervention programs. CLTS interventions in populations similar to this study, which have low disease burden and are undergoing rapid economic development, may be more
EVALUATING THE SUSTAINABILITY AND IMPACTS OF WATER, SANTATION & HYGIENE INTERNVENTIONS
11
Revision: November 10, 2009 5:26 PM
successful because many beneficiaries have both disposable income and motivation to build a toilet based on non-health benefits. Under these conditions, our study suggests that there is potential to expand the intervention’s impact even among the poorest households.
Although gastrointestinal illness is rare among children in this population, child growth measure-ments (height, weight, and mid-upper arm circumference) indicate that a majority of children in intervention and control villages are stunted (low height), and wasted (low weight) by international standards. In addition, up to 44% of children exhibit signs of malnutrition (height to weight ratios or mid-upper arm circumference). Poor child growth has been attributed to insufficient nutrition, acute diarrhea and a-symptomatic gastrointestinal infections (tropical enteropathy); given the low levels of diarrhea, we infer (though have not measured) that the child growth faltering in this popu-lation likely results from poor nutrition or tropical enteropathy (Lunn 2000, Humphrey 2009). If tropical enteropathy is a health risk for children in the study population, it may be linked to contin-ued poor hygiene and sanitation behaviors.
Despite the intensive hygiene education programs and CLTS campaigns, sustainable improve-ments in household water quality, handwashing frequency, and sanitation practices were not realized through the interventions. It is particularly interesting to note that nearly 40% of households with a private toilet report that adults practice daily open defecation, and 52% of the same households report that children under 5 years old practice daily open defecation. These figures underscore the difficulty of defecation behavior change, the technical difficulties of properly disposing child feces despite in-home hardware improvements, and the nuanced and complicated relationship between toilet construction and actual defecation practice. Addressing the complexity of hygiene behaviors may be necessary to fully realize the health benefits afforded by improved infrastructure.
Our quasi-experimental design provides an efficient strategy for evaluating interventions in retrospect and obtaining information on longer-term impacts and sustainability. However, an ideal assessment of the causal links between programs and impacts would begin with an intervention that is purpose-fully randomized within a selected set of villages and a standard set of pre-intervention data on key indicators from both groups of villages: those that received the intervention and those that did not -- the controls. For implementing organizations that seek rigorous evaluations to guide and promote further implementation and scale-up plans, optimizing the potential for impact evaluations at the onset of an intervention may provide significant benefit.
EVALUATING THE SUSTAINABILITY AND IMPACTS OF WATER, SANTATION & HYGIENE INTERNVENTIONS
12
Revision: November 10, 2009 5:26 PM
N Village Name N Househol
ds
Project Dates
Age Brief Intervention Description (Census
2001) (mths)
1 Keelakarthigaipatti 194 04/03 – 03/04
47 Water: Community tube wells capped by hand pumps 2 Sakkampatti 140 Sanitation: 220 HH latrines, school sanitary block Hygiene Child education (“health ambassadors”) , hygiene promotion 3 Mettupatti 70 04/03
– 04/04
46 Water: Community hand pumps 4 Periyanachipatti 80 Sanitation: > 63 HH toilets, school sanitary block Hygiene: Hygiene promotion, school health
clubs 5 Ponnusangampatti 290 01/04 – 12/04
38 Water: ≈ 279 HH taps 6 Melakothampatti 90 Sanitation: 273 HH toilets 7 Theverappampatti 125 Hygiene: Hygiene education campaign 8 Ayinapatti 114 01/05
– 03/06
23 Water:
Sanitation:
≈ 45 HH taps, new school water taps
97 HH toilets, renovated school toilets
Hygiene: Hygiene and sanitation education training 9 Melakarthikaipatti 289 01/05
– 03/06
23 Water:
Sanitation:
≈ 21 HH taps, 1 hand pump renovated, new school tap
370 HH toilets, renovated school toilets
Hygiene: Hygiene education (social health clubs) 10 Melanaduvalur 160 10/05
– 10/06
17 Water: ≈ 50 HH taps, 1 hand pump renovated, 14 public stand
posts renovated Sanitation: 118 HH toilets installed, renovated
school toilets Hygiene: Village-wide hygiene education campaign 11 Kanganipatti 160 10/05
– 10/06
17 Water: 50 HH taps, 2 hand pumps renovated, new school tap Sanitation: 115 HH toilets, renovated school toilet facilities Hygiene: Village-wide hygiene education campaign 12 Kollapatti 220 10/06
– 09/07
5 Water: 100 HH taps, restored/repaired 4 existing hand pumps & school water facilities
Sanitation: 118 HH toilets, renovated school toilet facilities Hygiene: Village-wide hygiene education campaign
Table 1 Summary of major intervention components in the 12 study villages reported by WaterPartners Interna-tional and Gramalaya. Horizontal lines separate implementation projects. Villages 5-12 had access to micro-credit loans for private household water and sanitation improvements. The age in months is the time elapsed from the intervention completion to middle of the first round of data collection (February 2008).
EVALUATING THE SUSTAINABILITY AND IMPACTS OF WATER, SANTATION & HYGIENE INTERNVENTIONS
13
Revision: November 10, 2009 5:26 PM
2. IntroductionIn this final report from our impact evaluation of the WPI/Gramalaya water, sanitation, and hygiene interventions in Tamil Nadu, India, we provide an overview of the evaluation methods and an in-depth analysis of the evaluation results. We describe our study design, survey design, data collection methods, and water quality analysis, and we compare the following key evaluation indicators between intervention and control villages: water infrastructure and sanitation facilities, sanitation practices, hygiene knowledge, socio-economic indicators, water quality, and child health. In addition to evalu-ating this specific intervention program, we hope our efforts will provide constructive programmatic feedback to the Open Square Foundation, WPI and Gramalaya that might be relevant to their future work. Finally, many of the methods and findings in this evaluation are widely applicable to water, sanitation, and hygiene intervention projects in general and should prove useful to other organiza-tions that are engaged in similar work.
3. Study Methods3.1. Study design
We evaluated the intervention program using a quasi-experimental design for evaluating pre-existing interventions (Arnold et al. 2009). Since villages included in the intervention program were pur-posely selected by WPI and Gramalaya, they were likely different, on average, from other villages in the region. Consequently, a central component of the design was to identify a suitable control group. These control villages are essential because they provide us with information about what would have happened in the absence of the intervention. The design we used matches a set of independent con-trol villages to intervention villages using a large set of characteristics at baseline (before the interven-tion). After selecting the study villages (12 intervention, and 13 matched controls), we surveyed 900 households among the 25 villages in 12 monthly visits to measure outcomes, and we collected water quality measurements at village and household sources.
3.1.1. Village Selection
We matched intervention villages to control villages using a statistical technique called propensity score matching, which is a common tool used by health and social science investigators to iden-tify suitable controls for an intervention population from a large pool of candidate control villages (Rosenbaum and Rubin, 1983; Rubin 2007; Pattanayak et al. 2009, Arnold et al. 2009). The goal of the process is to assemble a set of control villages that are as similar as possible to intervention villages immediately before the intervention began. We used a three-stage sampling strategy (outlined below) to select control villages from the Manachanallur and Uppiliyapuram Blocks (a Block is an adminis-trative unit of approximately 100,000 people) adjacent to the Thottiyam, Thuraiyur, and Thathaiyan-garpet Blocks that include intervention villages. We did not attempt to select control villages from Blocks that contained intervention villages because of the generally heightened water and sanitation activity among NGOs in these areas (primarily Gramalaya with funding from WPI and another international NGO, WaterAid).
EVALUATING THE SUSTAINABILITY AND IMPACTS OF WATER, SANTATION & HYGIENE INTERNVENTIONS
14
Revision: November 10, 2009 5:26 PM
Because the interventions were initiated in 2003, we were able to utilize data from the 2001 National Census and the 2003 Tamil Nadu Water Supply and Drainage (TWAD) Board survey. Between the two data sources, we obtained a rich set of village and Panchayat-level information that reflected conditions at approximately the time when Gramalaya selected intervention villages. In the first stage of the selection strategy, we reduced the number of potential control villages from 240 to 195 by excluding villages with the following characteristics that were not represented in the intervention villages: more than 80% Scheduled cast population; fewer than 50 total households; fewer than 70% of families use biofuel for cooking.
In the second stage, we reduced the list of potential controls from 195 to 24 using a propensity score matching method. Ideally, we would have matched each intervention village to a control village using a large set of variables, such as village size, measures of wealth, water and sanitation infrastruc-ture, and occupation. It is often impossible, however, to find exact matches on a large set of variables with a finite population of potential controls. Propensity score matching solves this problem by col-lapsing the large set of characteristics into a single number for each village that captures the relevant similarities (or differences) between villages and can then be used to find a match.
The process includes the following steps. First, we used data from the 2001 National Census and the 2003 TWAD Board survey to construct a regression model that estimated the probability that a village (the 12 intervention villages and the 195 potential control villages) received the intervention. We settled on a final model parameterization in an iterative process with the goal of achieving good balance across a large number of baseline village characteristics. The variables that we included in the model are:
• Totalnumberof householdsinthevillage(villagelevel)
• Per-capitacattleownershipinthevillage(villagelevel)
• Proportionof thepopulationthatbelongstoaScheduledcaste(villagelevel)
• Theproportionof householdsthathaveaccesstotapwater(Panchayatlevel)
• Theproportionof literateadultfemales(Panchayatlevel)
• Theproportionof familiesthatusebankingservices(Panchayatlevel)
• Per-capitaPanchayatincome(Panchayatlevel)
We estimated the predicted probability of receiving the intervention (for both control villages and intervention villages). Then, we matched two control villages to each intervention village based on this predicted probability (the propensity score). We matched control villages to intervention vil-lages using a nearest-neighbor match (i.e., for each intervention village, we selected the two controls with the closest predicted probability of receiving the intervention).
In the third stage of village selection, field teams conducted a rapid assessment of the 36 villages (12 intervention villages and 24 potential controls) from September through December 2007 to measure basic information about the number of active self-help groups (SHGs), school and administrative
EVALUATING THE SUSTAINABILITY AND IMPACTS OF WATER, SANTATION & HYGIENE INTERNVENTIONS
15
Revision: November 10, 2009 5:26 PM
facilities, primary livelihoods, car and tractor ownership, and basic water infrastructure. The goal of the rapid assessment was to reduce the set of matched control villages to one per intervention vil-lage. During the rapid assessment, we determined that two of the potential control villages were actually one contiguous village, which we subsequently treated as a single village for selection. We selected 13 of the potential 23 potential control villages using the following criteria: we excluded villages that were substantially smaller or larger than the intervention villages, both for comparability and for logistical efficiency; and we excluded villages with fewer than two SHGs on the grounds that they may be less socially organized than the intervention villages, which all had two or more SHGs. One intervention village has two matched control villages because we had no systematic grounds for excluding the extra control village.
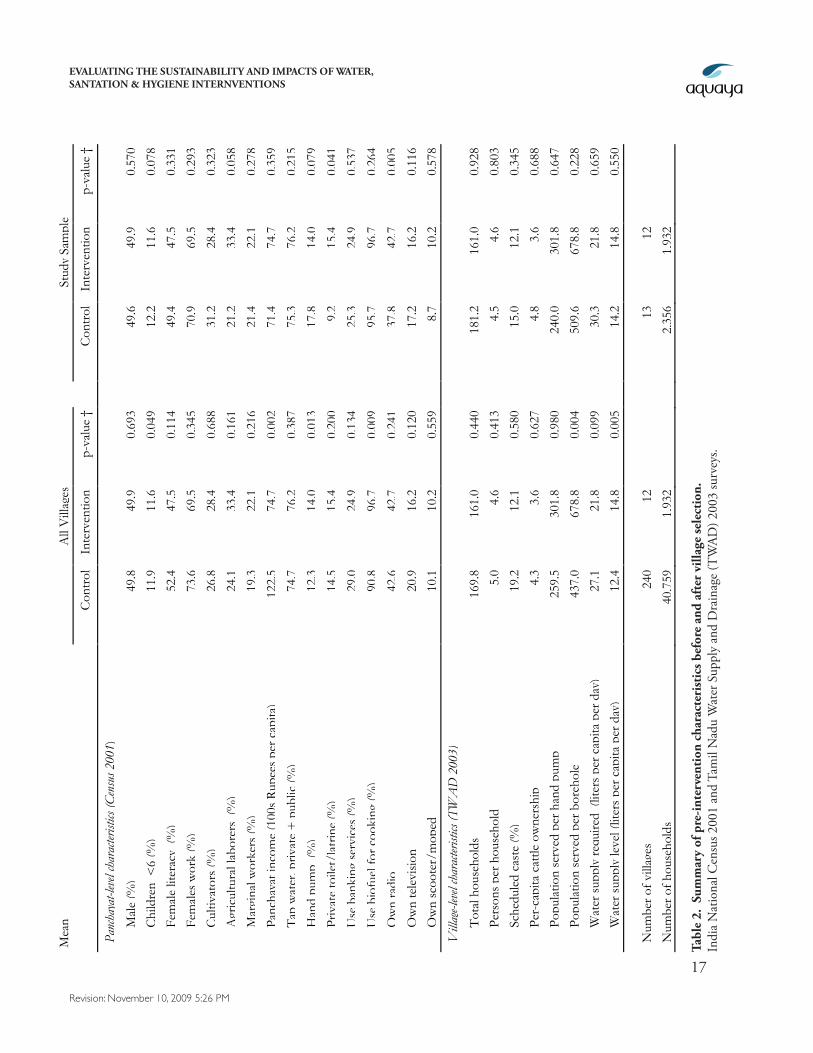
Our selection of control villages led to intervention and control groups that were similar at baseline (pre-intervention) across a broad range of characteristics (Table 2). The restriction and matching led to better balance in many parameters, such as female literacy, Panchayat income, use of banking ser-vices, use of biofuel for cooking and the proportion of the population who belonged to a Scheduled caste. The restriction and matching also led to greater imbalances in some covariates, including the proportion of households owning a private latrine and the proportion of households that use a hand-pump. After selection, intervention villages had a larger fraction of agricultural workers than control villages in 2001 (33% versus 21%), and were more likely to own a private toilet (15% versus 9%). Although the 2001 census data indicate some imbalance in private toilet ownership, we estimate that in our actual sample the groups were well balanced in private toilet ownership by 2003 (Section 3.1).
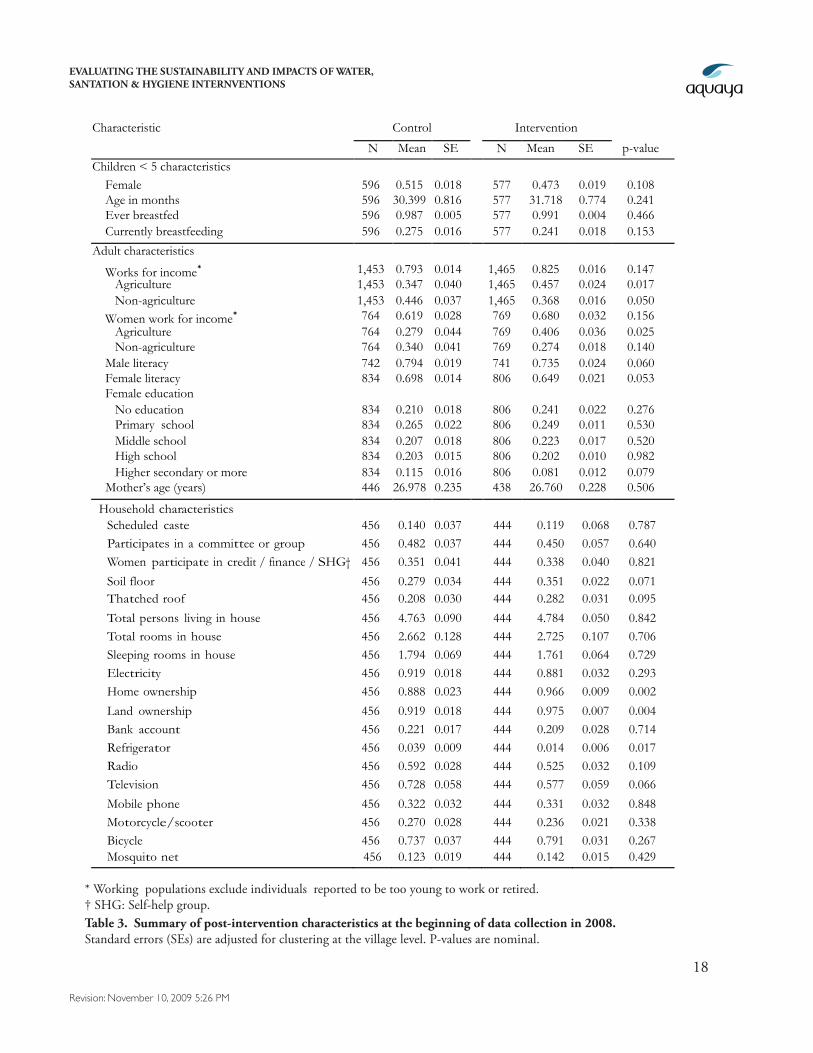
In our first household survey in 2008 we collected a large set of information about study house-holds to compare intervention and control villages across characteristics that could confound the relationship between the intervention program and our outcomes of interest. These data show that intervention and control households remain balanced on a large number of potentially confounding characteristics, although, we note some differences (Table 3). For example, intervention villages are more likely to have homes with soil floors (35% versus 28%) and thatched roofs (28% versus 21%.) instead of homes with brick floors and permanent roofs; families in the intervention communities are also more likely to own their home (97% versus 88%) or land (98% versus 92%.). These differ-ences are likely due the greater percentage of intervention village inhabitants engaged in agricultural activity (33% to 21%). Despite these differences, the two groups are highly similar in community participation, Scheduled caste status, use of banking services, and female education.
3.1.2 Household Selection
The burden of diarrheal disease (morbidity and mortality) is greatest among children under age 5 who have not developed mature immune responses. Consequently, we focused the health compo-nent of our evaluation on this age group, and during the rapid assessment in late 2007, the field team identified all households in each village with children under age 5: these households were then asked if they would consent to participate in our evaluation. From the group of consenting households (only one household refused to participate), we selected a random sample of 50 households per vil-lage. If a village had fewer than 50 households, then all households from that village were included
EVALUATING THE SUSTAINABILITY AND IMPACTS OF WATER, SANTATION & HYGIENE INTERNVENTIONS
16
Revision: November 10, 2009 5:26 PM
in the final study sample.
Ultimately, we enrolled 456 control and 444 intervention households in the study. We followed 433 control and 424 intervention households (857 households in total) through all 12 household visits, all of which had at least one child under the age of 5. We began with 1,173 children under 5 years old at the beginning of data collection, and 112 children were born into study households during the study and added into the cohort. With these additions, the total child population was 648 control and 637 intervention children. We followed 612 (94%) control and 609 (96%) intervention chil-dren through the 12 visits.
EVALUATING THE SUSTAINABILITY AND IMPACTS OF WATER, SANTATION & HYGIENE INTERNVENTIONS
17
Revision: November 10, 2009 5:26 PM
Tabl
e 2.
Sum
mar
y of
pre
-int
erve
ntio
n ch
arac
teri
stic
s bef
ore
and
afte
r vi
llage
sele
ctio
n.
Indi
a N
atio
nal C
ensu
s 200
1 an
d Ta
mil
Nad
u W
ater
Sup
ply
and
Dra
inag
e (T
WAD
) 200
3 su
rvey
s.
Mea
n A
ll V
illag
es
St
udy
Sam
ple
C
ontr
ol
Inte
rven
tion
p-va
lue
†
Con
trol
In
terv
entio
n p-
valu
e †
Panc
haya
t-lev
el ch
arac
terist
ics (C
ensu
s 200
1)
Mal
e (%
) 49
.8
49.9
0.
693
49
.6
49.9
0.
570
Chi
ldre
n <
6 (%
) 11
.9
11.6
0.
049
12
.2
11.6
0.
078
Fem
ale
liter
acy
(%)
52.4
47
.5
0.11
4
49.4
47
.5
0.33
1
Fem
ales
wor
k (%
) 73
.6
69.5
0.
345
70
.9
69.5
0.
293
Cul
tivat
ors
(%)
26.8
28
.4
0.68
8
31.2
28
.4
0.32
3
Agr
icul
tura
l lab
orer
s (%
) 24
.1
33.4
0.
161
21
.2
33.4
0.
058
Mar
gina
l wor
kers
(%)
19.3
22
.1
0.21
6
21.4
22
.1
0.27
8
Panc
haya
t inc
ome
(100
s R
upee
s pe
r cap
ita)
122.
5 74
.7
0.00
2
71.4
74
.7
0.35
9
Tap
wat
er, p
rivat
e +
pub
lic (%
) 74
.7
76.2
0.
387
75
.3
76.2
0.
215
Han
d pu
mp
(%)
12.3
14
.0
0.01
3
17.8
14
.0
0.07
9
Priv
ate
toile
t/la
trin
e (%
) 14
.5
15.4
0.
200
9.
2 15
.4
0.04
1
Use
ban
king
ser
vice
s (%
) 29
.0
24.9
0.
134
25
.3
24.9
0.
537
Use
bio
fuel
for c
ooki
ng (%
) 90
.8
96.7
0.
009
95
.7
96.7
0.
264
Ow
n ra
dio
42.6
42
.7
0.24
1
37.8
42
.7
0.00
5
Ow
n te
levi
sion
20
.9
16.2
0.
120
17
.2
16.2
0.
116
Ow
n sc
oote
r/m
oped
10
.1
10.2
0.
559
8.
7 10
.2
0.57
8
Vill
age-l
evel
char
acter
istics
(TW
AD
200
3)
Tot
al h
ouse
hold
s 16
9.8
161.
0 0.
440
18
1.2
161.
0 0.
928
Pers
ons
per h
ouse
hold
5.
0 4.
6 0.
413
4.
5 4.
6 0.
803
Sche
dule
d ca
ste
(%)
19.2
12
.1
0.58
0
15.0
12
.1
0.34
5
Per-
capi
ta c
attle
ow
ners
hip
4.3
3.6
0.62
7
4.8
3.6
0.68
8
Popu
latio
n se
rved
per
han
d pu
mp
259.
5 30
1.8
0.98
0
240.
0 30
1.8
0.64
7
Popu
latio
n se
rved
per
bor
ehol
e 43
7.0
678.
8 0.
004
50
9.6
678.
8 0.
228
Wat
er s
uppl
y re
quire
d (l
iters
per
cap
ita p
er d
ay)
27.1
21
.8
0.09
9
30.3
21
.8
0.65
9
Wat
er s
uppl
y le
vel (
liter
s pe
r cap
ita p
er d
ay)
12.4
14
.8
0.00
5
14.2
14
.8
0.55
0
Num
ber o
f vill
ages
24
0 12
13
12
Num
ber o
f hou
seho
lds
40,7
59
1,93
2
2,
356
1,93
2
EVALUATING THE SUSTAINABILITY AND IMPACTS OF WATER, SANTATION & HYGIENE INTERNVENTIONS
18
Revision: November 10, 2009 5:26 PM
Characteristic Control Intervention
N Mean SE N Mean SE p-value Children < 5 characteristics Female 596 0.515 0.018 577 0.473 0.019 0.108 Age in months 596 30.399 0.816 577 31.718 0.774 0.241 Ever breastfed 596 0.987 0.005 577 0.991 0.004 0.466 Currently breastfeeding 596 0.275 0.016 577 0.241 0.018 0.153
Adult characteristics
Works for income* 1,453 0.793 0.014 1,465 0.825 0.016 0.147 Agriculture 1,453 0.347 0.040 1,465 0.457 0.024 0.017 Non-agriculture 1,453 0.446 0.037 1,465 0.368 0.016 0.050 Women work for income* 764 0.619 0.028 769 0.680 0.032 0.156 Agriculture 764 0.279 0.044 769 0.406 0.036 0.025 Non-agriculture 764 0.340 0.041 769 0.274 0.018 0.140 Male literacy 742 0.794 0.019 741 0.735 0.024 0.060 Female literacy 834 0.698 0.014 806 0.649 0.021 0.053 Female education No education 834 0.210 0.018 806 0.241 0.022 0.276 Primary school 834 0.265 0.022 806 0.249 0.011 0.530 Middle school 834 0.207 0.018 806 0.223 0.017 0.520 High school 834 0.203 0.015 806 0.202 0.010 0.982 Higher secondary or more 834 0.115 0.016 806 0.081 0.012 0.079 Mother’s age (years) 446 26.978 0.235 438 26.760 0.228 0.506
Household characteristics Scheduled caste 456 0.140 0.037 444 0.119 0.068 0.787 Participates in a committee or group 456 0.482 0.037 444 0.450 0.057 0.640 Women participate in credit / finance / SHG† 456 0.351 0.041 444 0.338 0.040 0.821
Soil floor 456 0.279 0.034 444 0.351 0.022 0.071 Thatched roof 456 0.208 0.030 444 0.282 0.031 0.095
Total persons living in house 456 4.763 0.090 444 4.784 0.050 0.842 Total rooms in house 456 2.662 0.128 444 2.725 0.107 0.706 Sleeping rooms in house 456 1.794 0.069 444 1.761 0.064 0.729 Electricity 456 0.919 0.018 444 0.881 0.032 0.293 Home ownership 456 0.888 0.023 444 0.966 0.009 0.002
Land ownership 456 0.919 0.018 444 0.975 0.007 0.004 Bank account 456 0.221 0.017 444 0.209 0.028 0.714 Refrigerator 456 0.039 0.009 444 0.014 0.006 0.017 Radio 456 0.592 0.028 444 0.525 0.032 0.109 Television 456 0.728 0.058 444 0.577 0.059 0.066
Mobile phone 456 0.322 0.032 444 0.331 0.032 0.848 Motorcycle/scooter 456 0.270 0.028 444 0.236 0.021 0.338 Bicycle 456 0.737 0.037 444 0.791 0.031 0.267 Mosquito net 456 0.123 0.019 444 0.142 0.015 0.429
* Working populations exclude individuals reported to be too young to work or retired.† SHG: Self-help group.Table 3. Summary of post-intervention characteristics at the beginning of data collection in 2008. Standard errors (SEs) are adjusted for clustering at the village level. P-values are nominal.
EVALUATING THE SUSTAINABILITY AND IMPACTS OF WATER, SANTATION & HYGIENE INTERNVENTIONS
19
Revision: November 10, 2009 5:26 PM
3.2. Survey Design and Administration
The survey contents were developed using field-tested questions from our previous work in India, Bolivia, and Guatemala and reflect current scientific survey methodology and measurement tech-niques. We used two survey instruments: a baseline questionnaire and a shorter follow-up question-naire.
The baseline survey included a comprehensive one-hour family interview, direct observation, and child anthropomorphic growth measurements (height, weight, and mid-upper arm circumference). We designed the survey to gather information on the health of children under the age of 5, family socio-economic conditions, hygiene behaviors, water sources, water treatment and storage behaviors, sanitation facilities and behaviors, social connections, spending patterns, and access to financial as-sistance. The 11 monthly household follow-up surveys were shortened version of the baseline survey and took twenty minutes or less to administer. The purpose of the follow up surveys was to track household changes through the year, with a focus on health outcomes, sanitation improvements, and water access. The monthly household surveys were administered to the primary caretakers of chil-dren under the age of 5.
In early December 2007 SRMC, Aquaya, and UC Berkeley staff conducted a detailed pre-test of the baseline questionnaire with local survey teams in order to optimize the format, match survey ques-tions to local colloquial dialogue, and correct translation mistakes. Through the remainder of the study, SRMC staff supervised a field team of nine enumerators and one study coordinator based in the study area. The monthly household interviews were conducted in the study villages between January 2008 and April 2009.
3.3. Water Quality
In addition to administering surveys and collecting child growth data, we screened microbial water quality by testing samples from community drinking water sources (hand pumps, public tap stands, and wells) and stored household drinking water in intervention and control villages.
3.3.1. Background on Microbial Water Quality Testing
Microbial agents of waterborne disease (i.e. rotavirus, cholera causing bacteria, cryptosporidium parasites, etc.) are generally introduced into drinking water through contamination by fecal mate-rial from infected individuals. Ideally, water samples would be tested directly for these pathogens to determine the associated disease risk. In practice, however, it is not practical to monitor drinking water supplies for every potential microbial pathogen due to various technical limitations: 1) there is a large range of pathogenic organisms and they are generally found in very low numbers; 2) their concentrations in drinking water can be at high risk of causing human infectivity but would require impractically large volumes of water to detect them, which makes detection via traditional, non-mo-lecular methods difficult, if not impossible; and 3) molecular detection methods are generally expen-sive, non-field portable, do not measure infectious microbes (dead microbes or their nucleic acids can be detected as “false positives”), and, in some cases, they lack sensitivity and specificity. In addition,
EVALUATING THE SUSTAINABILITY AND IMPACTS OF WATER, SANTATION & HYGIENE INTERNVENTIONS
20
Revision: November 10, 2009 5:26 PM
the relationship of these methods to pathogenicity is unproven and they have not been approved by regulatory agencies (Leclerc 2001).
Given these technical barriers to routine detection of waterborne pathogens, assessments of micro-bial water safety are primarily based on the levels of indicator species. The bacterial coliform family, which comprises a number of related species that are common mammalian gut flora, is a traditional indictor group for fecal contamination. However, the recognition that some coliform species exist naturally in the environment, particularly in tropical climates, has promoted the use of thermotol-erant coliforms (species that grow at the elevated temperature of 44.5º C) and Escherichia coli (E. coli): a specific thermotolerant coliform species whose natural habitat is largely restricted to the lower intestine of warm-blooded animals), as more stringent indicators of fecal contamination. In the 1980s, Indian researchers also developed an alternative assay for fecal contamination in water that is based on the detection of Hydrogen Sulphide (H2S) in test samples (Manja et al 1982). H2S is produced by bacterial species that are thought to be associated with fecal contamination, although, this proposed association requires further analysis (Sobsey 2002).
3.3.2 Water Testing Methods
Membrane filtration is a commonly used method for analyzing water and other environmental sam-ples for E. coli and other coliform bacteria (Mates & Shaffer). The basic technique comprises the following steps: a water sample is passed through a membrane filter to trap individual bacterial cells; the filter is then placed on a pad soaked with a growth medium that supports the growth of coliform species. When incubated at a suitable temperature (i.e. 37º C for total coliforms), the cells will grow into colony forming units (CFU) on the surface of the filter. The growth media often incorporate ‘indicator’ compounds: usually color or florescence producing compounds that are substrates for specific bacterial enzymes. After incubation, colonies are differentiated between E. coli and other coliforms based on their color. The H2S test is available in an inexpensive presence/absence format that requires adding 30 mls of sample water to a pre-packaged vile that contains an H2S test strip. After a 24-hour incubation period at ambient temperature, a black color indicates a positive result.
3.4. Ethical Approvals
The ethical review board at SRMC approved our evaluation protocol in June 2007 and we received approval from the Committee for the Protection of Human Subjects (CPHS) at UCB in September 2007.
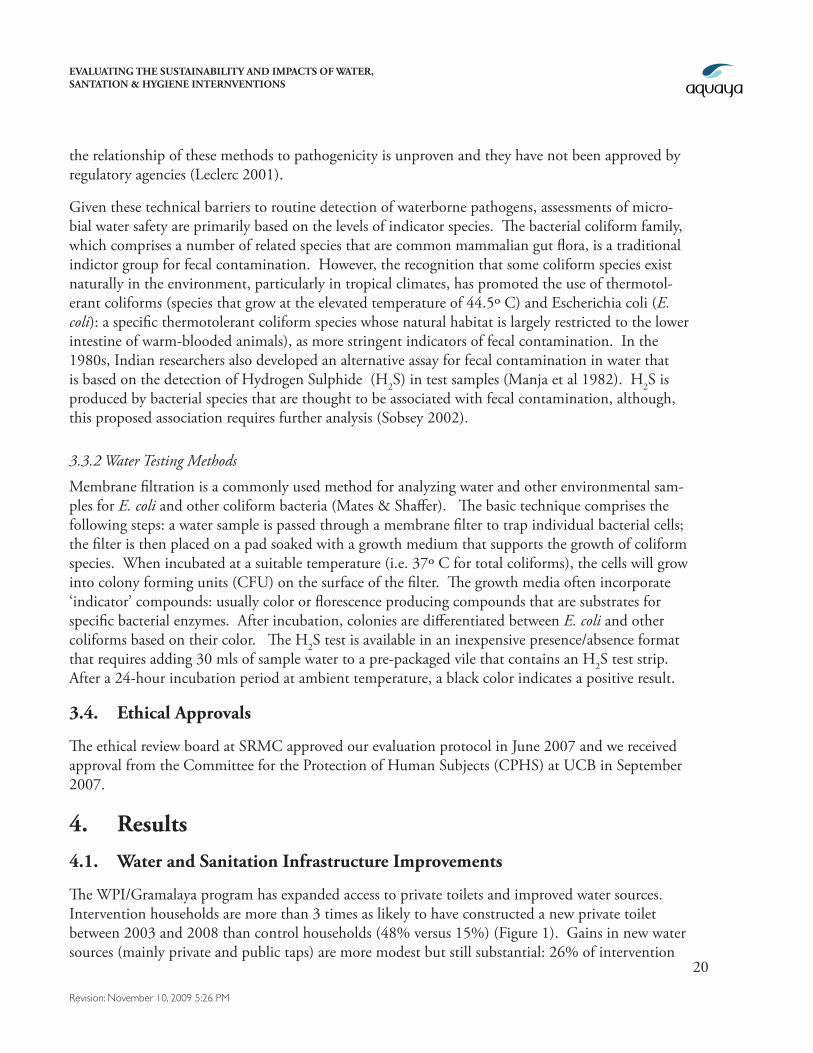
4. Results4.1. Water and Sanitation Infrastructure Improvements
The WPI/Gramalaya program has expanded access to private toilets and improved water sources. Intervention households are more than 3 times as likely to have constructed a new private toilet between 2003 and 2008 than control households (48% versus 15%) (Figure 1). Gains in new water sources (mainly private and public taps) are more modest but still substantial: 26% of intervention
EVALUATING THE SUSTAINABILITY AND IMPACTS OF WATER, SANTATION & HYGIENE INTERNVENTIONS
21
Revision: November 10, 2009 5:26 PM
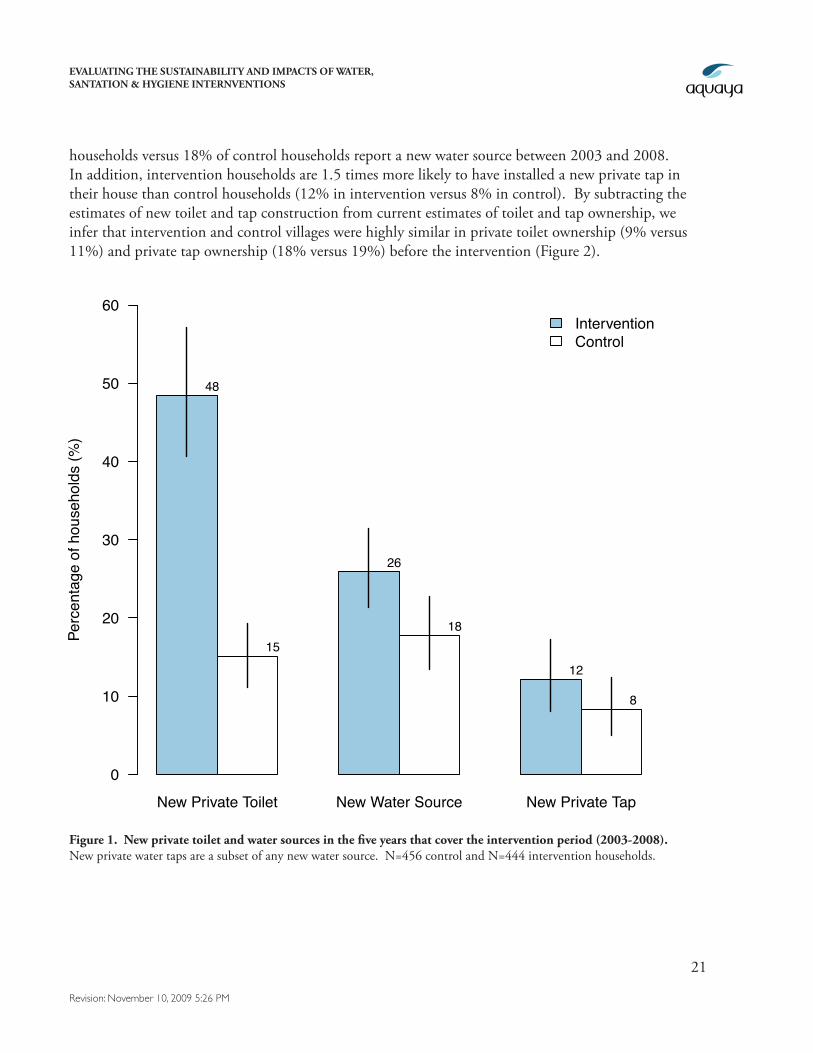
households versus 18% of control households report a new water source between 2003 and 2008. In addition, intervention households are 1.5 times more likely to have installed a new private tap in their house than control households (12% in intervention versus 8% in control). By subtracting the estimates of new toilet and tap construction from current estimates of toilet and tap ownership, we infer that intervention and control villages were highly similar in private toilet ownership (9% versus 11%) and private tap ownership (18% versus 19%) before the intervention (Figure 2).
Figure 1. New private toilet and water sources in the five years that cover the intervention period (2003-2008). New private water taps are a subset of any new water source. N=456 control and N=444 intervention households.
New Private Toilet New Water Source New Private Tap
Perc
enta
ge o
f hou
seho
lds
(%)
0
10
20
30
40
50
60InterventionControl
48
15
26
18
12
8
EVALUATING THE SUSTAINABILITY AND IMPACTS OF WATER, SANTATION & HYGIENE INTERNVENTIONS
22
Revision: November 10, 2009 5:26 PM
2003 2008 2003 2008
Perc
enta
ge o
f hou
seho
lds
(%)
0
10
20
30
40
50
60
70InterventionControl
911
57
26
18 19
3027
__________________________
Private toilet
__________________________
Private tap
Figure 2. Private toilet and tap ownership before (2003) and after (2008) the intervention. We obtained 2003 estimates retrospectively by subtracting newly constructed facilities from those existing in 2008. N=456 control and N=444 intervention households.
EVALUATING THE SUSTAINABILITY AND IMPACTS OF WATER, SANTATION & HYGIENE INTERNVENTIONS
23
Revision: November 10, 2009 5:26 PM
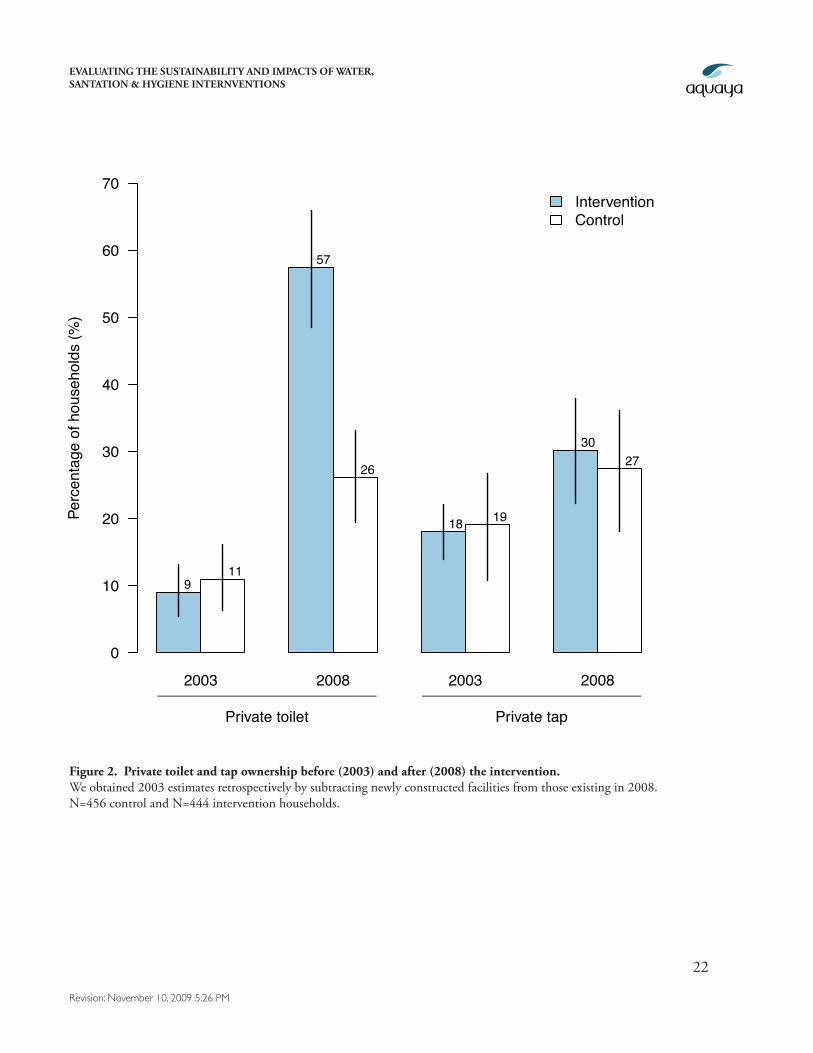
4.2. Water Sources and Water Quality
The study population primarily uses public and private taps as their water sources, with no reports of rainwater harvesting or water purchases from a tanker or vender (Table 4). Although 10% of the study population reports that they have access to surface water, less than 1% of households report using surface water, and, if used, it is mainly for washing clothes (Table 4). The vast majority of households report using a single source: of 900 households, only 89 (10%) report using more than one source. Of these multi-source users, the majority (46%) uses a mix of public taps and public wells. Private taps are used if available: among households with access to a private tap, 96% use it as their primary water source (Table 4). In conclusion, intervention and control households have similar distributions of primary water sources (Figure 3).
Public Tap Private Tap Private Well Public Well
Perc
enta
ge o
f hou
seho
lds
(%)
0
10
20
30
40
50
60
70InterventionControl
63 64
3027
52 2
6
Figure 3. Primary water sources by intervention group. N=456 control and N=444 intervention households.
EVALUATING THE SUSTAINABILITY AND IMPACTS OF WATER, SANTATION & HYGIENE INTERNVENTIONS
24
Revision: November 10, 2009 5:26 PM
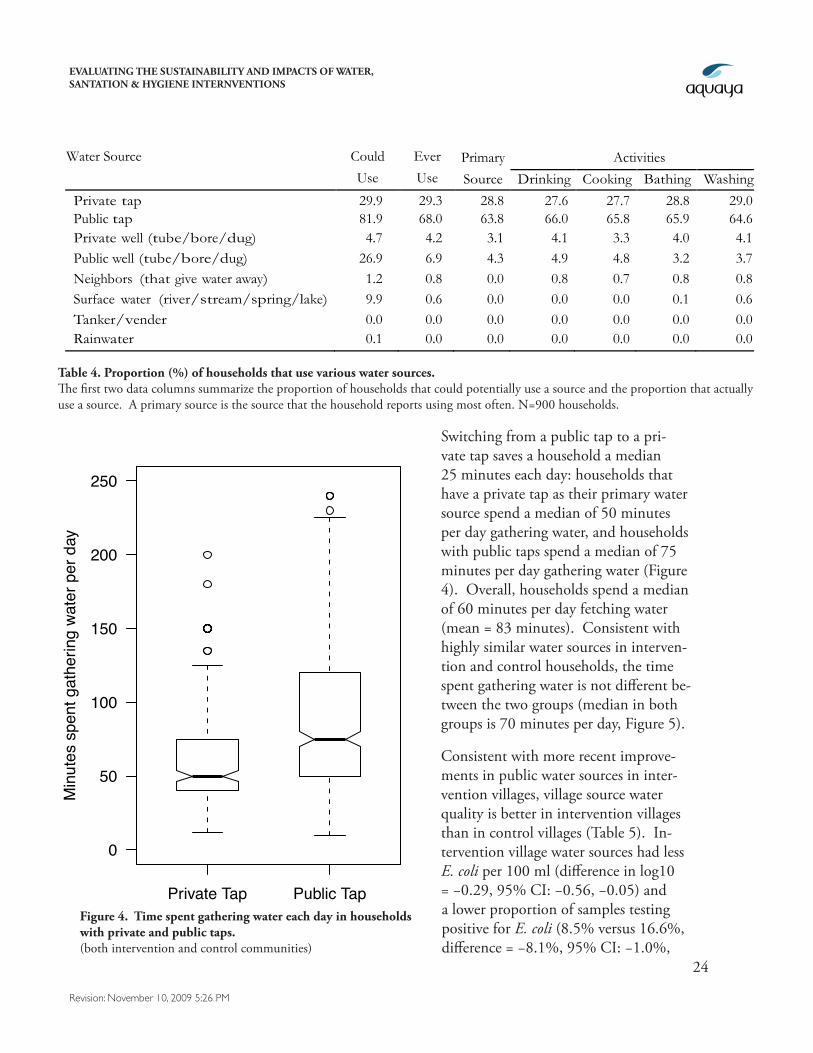
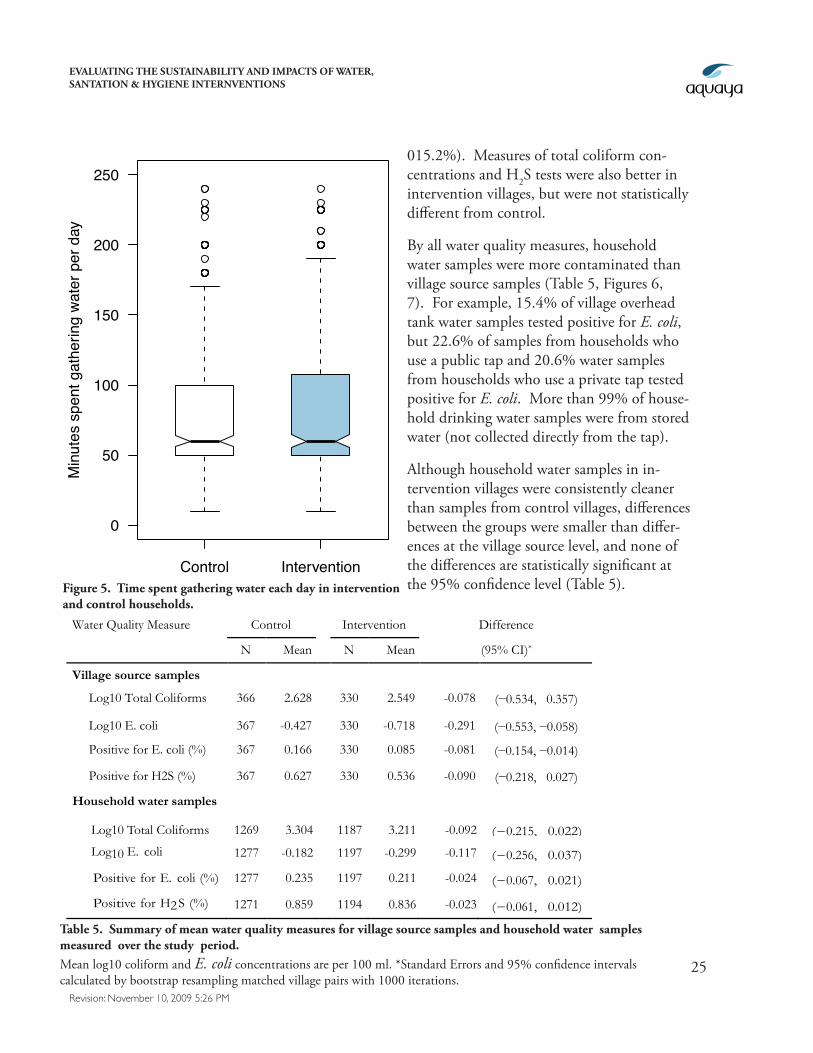
Switching from a public tap to a pri-vate tap saves a household a median 25 minutes each day: households that have a private tap as their primary water source spend a median of 50 minutes per day gathering water, and households with public taps spend a median of 75 minutes per day gathering water (Figure 4). Overall, households spend a median of 60 minutes per day fetching water (mean = 83 minutes). Consistent with highly similar water sources in interven-tion and control households, the time spent gathering water is not different be-tween the two groups (median in both groups is 70 minutes per day, Figure 5).
Consistent with more recent improve-ments in public water sources in inter-vention villages, village source water quality is better in intervention villages than in control villages (Table 5). In-tervention village water sources had less E. coli per 100 ml (difference in log10 = −0.29, 95% CI: −0.56, −0.05) and a lower proportion of samples testing positive for E. coli (8.5% versus 16.6%, difference = −8.1%, 95% CI: −1.0%,
Private Tap Public Tap
0
50
100
150
200
250
Min
utes
spe
nt g
athe
ring
wate
r per
day
Figure 4. Time spent gathering water each day in households with private and public taps. (both intervention and control communities)
Water Source Could Ever Primary Activities Use Use Source Drinking Cooking Bathing Washing
Private tap 29.9 29.3 28.8 27.6 27.7 28.8 29.0 Public tap 81.9 68.0 63.8 66.0 65.8 65.9 64.6 Private well (tube/bore/dug) 4.7 4.2 3.1 4.1 3.3 4.0 4.1 Public well (tube/bore/dug) 26.9 6.9 4.3 4.9 4.8 3.2 3.7 Neighbors (that give water away) 1.2 0.8 0.0 0.8 0.7 0.8 0.8 Surface water (river/stream/spring/lake) 9.9 0.6 0.0 0.0 0.0 0.1 0.6 Tanker/vender 0.0 0.0 0.0 0.0 0.0 0.0 0.0 Rainwater 0.1 0.0 0.0 0.0 0.0 0.0 0.0
Table 4. Proportion (%) of households that use various water sources. The first two data columns summarize the proportion of households that could potentially use a source and the proportion that actually use a source. A primary source is the source that the household reports using most often. N=900 households.
EVALUATING THE SUSTAINABILITY AND IMPACTS OF WATER, SANTATION & HYGIENE INTERNVENTIONS
25
Revision: November 10, 2009 5:26 PM
015.2%). Measures of total coliform con-centrations and H2S tests were also better in intervention villages, but were not statistically different from control.
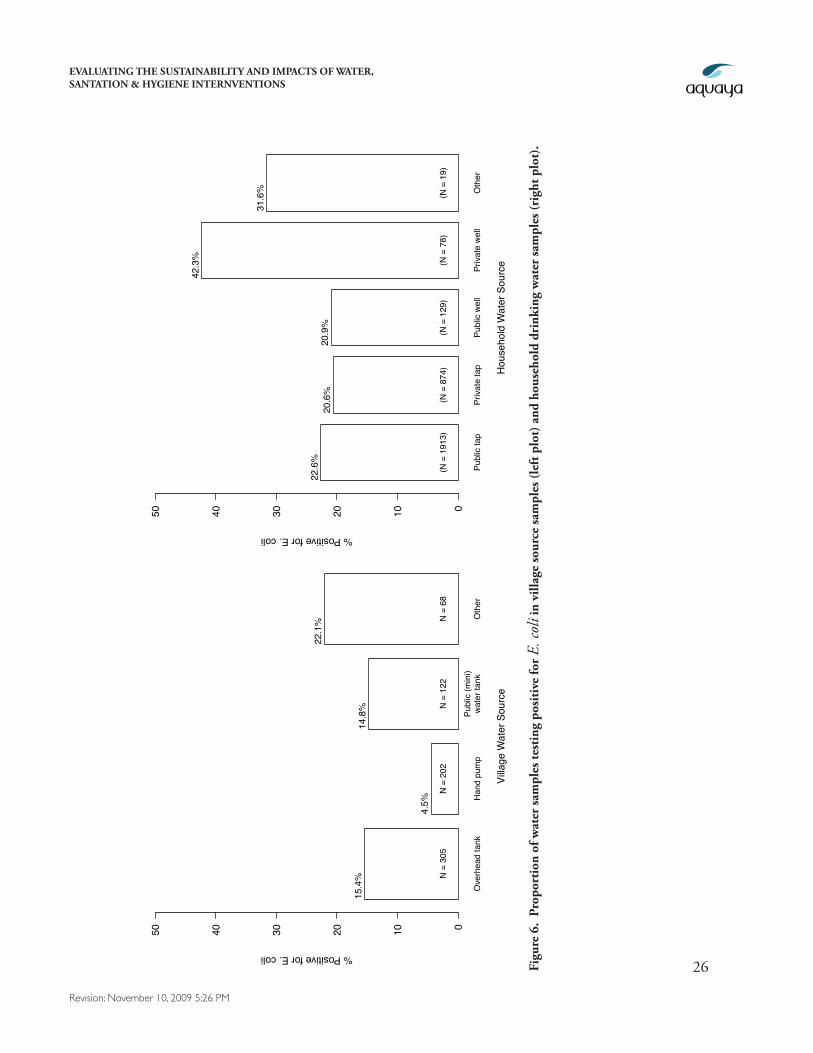
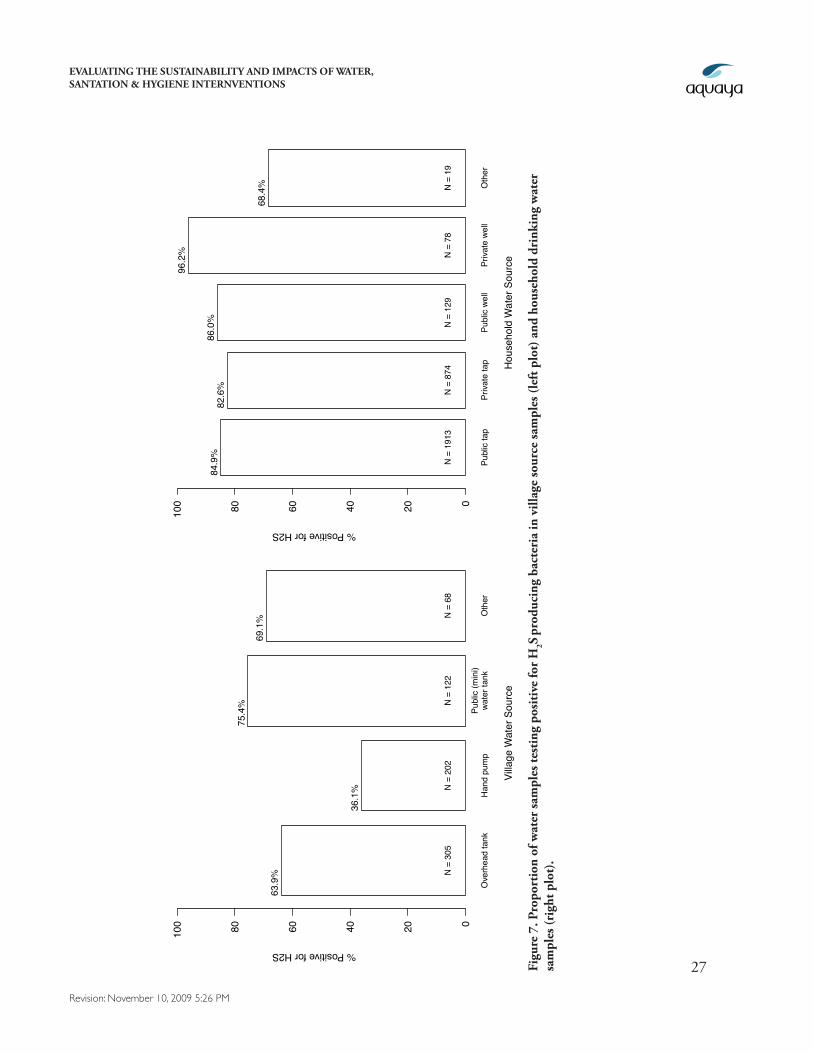
By all water quality measures, household water samples were more contaminated than village source samples (Table 5, Figures 6, 7). For example, 15.4% of village overhead tank water samples tested positive for E. coli, but 22.6% of samples from households who use a public tap and 20.6% water samples from households who use a private tap tested positive for E. coli. More than 99% of house-hold drinking water samples were from stored water (not collected directly from the tap).
Although household water samples in in-tervention villages were consistently cleaner than samples from control villages, differences between the groups were smaller than differ-ences at the village source level, and none of the differences are statistically significant at the 95% confidence level (Table 5).
Control Intervention
0
50
100
150
200
250
Min
utes
spe
nt g
athe
ring
wate
r per
day
Figure 5. Time spent gathering water each day in intervention and control households.
Water Quality Measure Control Intervention Difference
N Mean N Mean (95% CI)*
Village source samples
Log10 Total Coliforms 366 2.628 330 2.549 -0.078 (−0.534, 0.357)
Log10 E. coli 367 -0.427 330 -0.718 -0.291 (−0.553, −0.058)
Positive for E. coli (%) 367 0.166 330 0.085 -0.081 (−0.154, −0.014)
Positive for H2S (%) 367 0.627 330 0.536 -0.090 (−0.218, 0.027)
Household water samples
Log10 Total Coliforms 1269 3.304 1187 3.211 -0.092 (−0.215, 0.022)
Log10 E. coli 1277 -0.182 1197 -0.299 -0.117 (−0.256, 0.037)
Positive for E. coli (%) 1277 0.235 1197 0.211 -0.024 (−0.067, 0.021)
Positive for H2 S (%) 1271 0.859 1194 0.836 -0.023 (−0.061, 0.012) Table 5. Summary of mean water quality measures for village source samples and household water samples
measured over the study period. Mean log10 coliform and E. coli concentrations are per 100 ml. *Standard Errors and 95% confidence intervals calculated by bootstrap resampling matched village pairs with 1000 iterations.
EVALUATING THE SUSTAINABILITY AND IMPACTS OF WATER, SANTATION & HYGIENE INTERNVENTIONS
26
Revision: November 10, 2009 5:26 PM
Ove
rhea
d ta
nkH
and
pum
pPu
blic
(min
i)wa
ter t
ank
Oth
er
Villa
ge W
ater
Sou
rce
01020304050
% Positive for E. coli
15.4
%
4.5%
14.8
%
22.1
%
N =
305
N =
202
N =
122
N =
68
Publ
ic ta
pPr
ivate
tap
Publ
ic w
ell
Priva
te w
ell
Oth
er
Hou
seho
ld W
ater
Sou
rce
01020304050
% Positive for E. coli
22.6
%20
.6%
20.9
%
42.3
%
31.6
%
(N =
191
3)(N
= 8
74)
(N =
129
)(N
= 7
8)(N
= 1
9)
Figu
re 6
. Pr
opor
tion
of w
ater
sam
ples
test
ing
posi
tive
for
E. co
li in
vill
age
sour
ce sa
mpl
es (l
eft p
lot)
and
hou
seho
ld d
rink
ing
wat
er sa
mpl
es (r
ight
plo
t).
EVALUATING THE SUSTAINABILITY AND IMPACTS OF WATER, SANTATION & HYGIENE INTERNVENTIONS
27
Revision: November 10, 2009 5:26 PM
Ove
rhea
d ta
nkH
and
pum
pPu
blic
(min
i)wa
ter t
ank
Oth
er
Villa
ge W
ater
Sou
rce
020406080100
% Positive for H2S
63.9
%
36.1
%
75.4
%
69.1
%
N =
305
N =
202
N =
122
N =
68
Publ
ic ta
pPr
ivate
tap
Publ
ic w
ell
Priva
te w
ell
Oth
er
Hou
seho
ld W
ater
Sou
rce
020406080100
% Positive for H2S
84.9
%82
.6%
86.0
%
96.2
%
68.4
%
N =
191
3N
= 8
74N
= 1
29N
= 7
8N
= 1
9
Figu
re 7
. Pro
port
ion
of w
ater
sam
ples
test
ing
posi
tive
for
H2S
pro
duci
ng b
acte
ria
in v
illag
e so
urce
sam
ples
(lef
t plo
t) a
nd h
ouse
hold
dri
nkin
g w
ater
sa
mpl
es (r
ight
plo
t).
EVALUATING THE SUSTAINABILITY AND IMPACTS OF WATER, SANTATION & HYGIENE INTERNVENTIONS
28
Revision: November 10, 2009 5:26 PM
4.3. Sanitation and Open Defecation
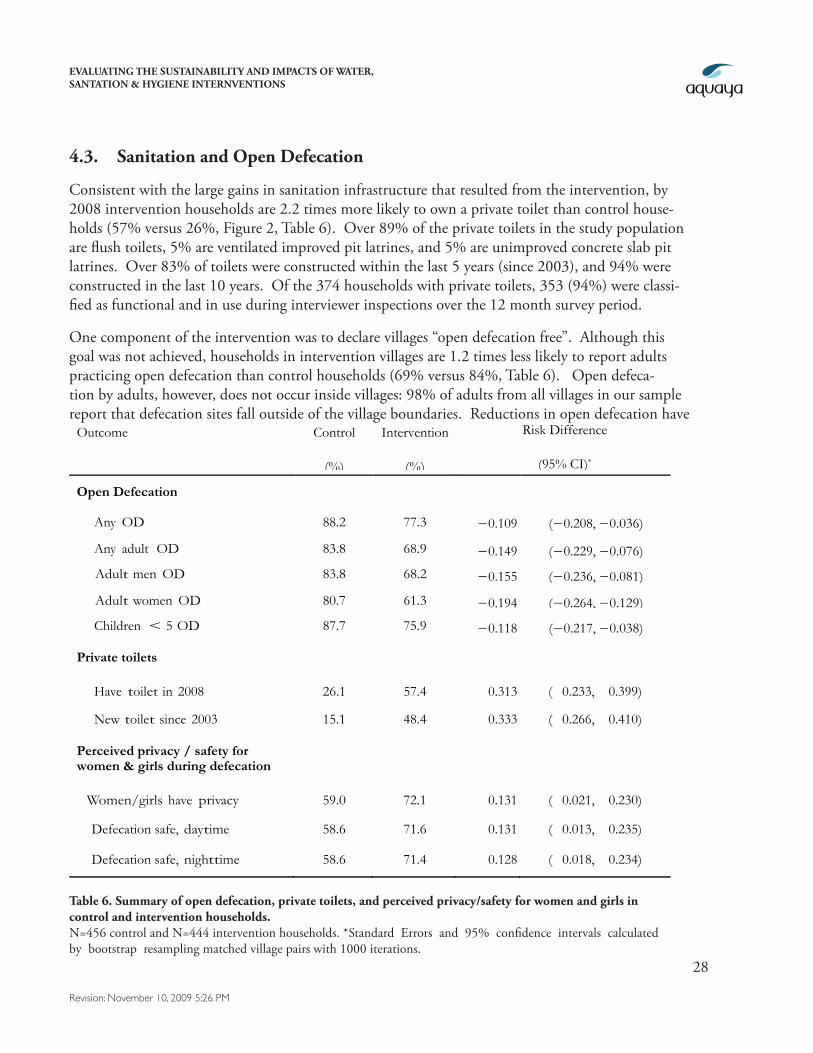
Consistent with the large gains in sanitation infrastructure that resulted from the intervention, by 2008 intervention households are 2.2 times more likely to own a private toilet than control house-holds (57% versus 26%, Figure 2, Table 6). Over 89% of the private toilets in the study population are flush toilets, 5% are ventilated improved pit latrines, and 5% are unimproved concrete slab pit latrines. Over 83% of toilets were constructed within the last 5 years (since 2003), and 94% were constructed in the last 10 years. Of the 374 households with private toilets, 353 (94%) were classi-fied as functional and in use during interviewer inspections over the 12 month survey period.
One component of the intervention was to declare villages “open defecation free”. Although this goal was not achieved, households in intervention villages are 1.2 times less likely to report adults practicing open defecation than control households (69% versus 84%, Table 6). Open defeca-tion by adults, however, does not occur inside villages: 98% of adults from all villages in our sample report that defecation sites fall outside of the village boundaries. Reductions in open defecation have
Outcome Control
(%)
Intervention
(%)
Risk Difference
(95% CI)*
Open Defecation
Any OD 88.2 77.3 −0.109 (−0.208, −0.036)
Any adult OD 83.8 68.9 −0.149 (−0.229, −0.076) Adult men OD 83.8 68.2 −0.155 (−0.236, −0.081)
Adult women OD 80.7 61.3 −0.194 (−0.264, −0.129) Children < 5 OD 87.7 75.9 −0.118 (−0.217, −0.038)
Private toilets
Have toilet in 2008 26.1 57.4 0.313 ( 0.233, 0.399)
New toilet since 2003 15.1 48.4 0.333 ( 0.266, 0.410)
Perceived privacy / safety for women & girls during defecation
Women/girls have privacy 59.0 72.1 0.131 ( 0.021, 0.230)
Defecation safe, daytime 58.6 71.6 0.131 ( 0.013, 0.235)
Defecation safe, nighttime 58.6 71.4 0.128 ( 0.018, 0.234)
Table 6. Summary of open defecation, private toilets, and perceived privacy/safety for women and girls in control and intervention households. N=456 control and N=444 intervention households. *Standard Errors and 95% confidence intervals calculated by bootstrap resampling matched village pairs with 1000 iterations.
EVALUATING THE SUSTAINABILITY AND IMPACTS OF WATER, SANTATION & HYGIENE INTERNVENTIONS
29
Revision: November 10, 2009 5:26 PM
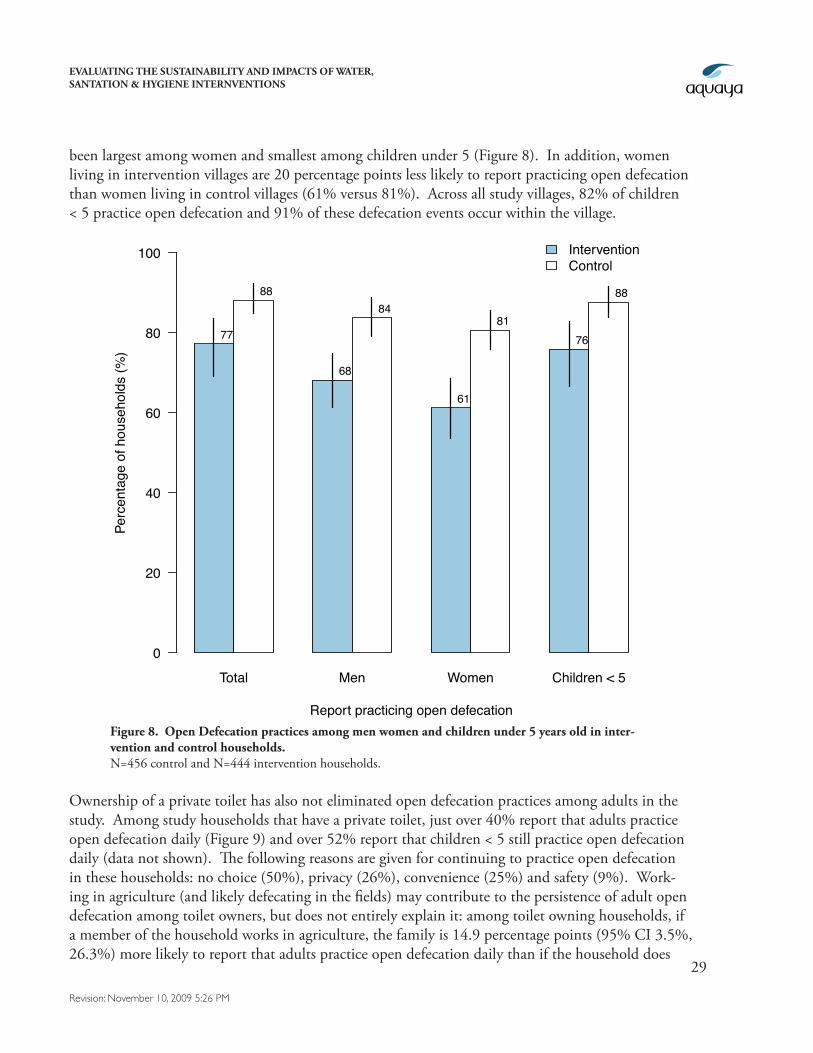
been largest among women and smallest among children under 5 (Figure 8). In addition, women living in intervention villages are 20 percentage points less likely to report practicing open defecation than women living in control villages (61% versus 81%). Across all study villages, 82% of children < 5 practice open defecation and 91% of these defecation events occur within the village.
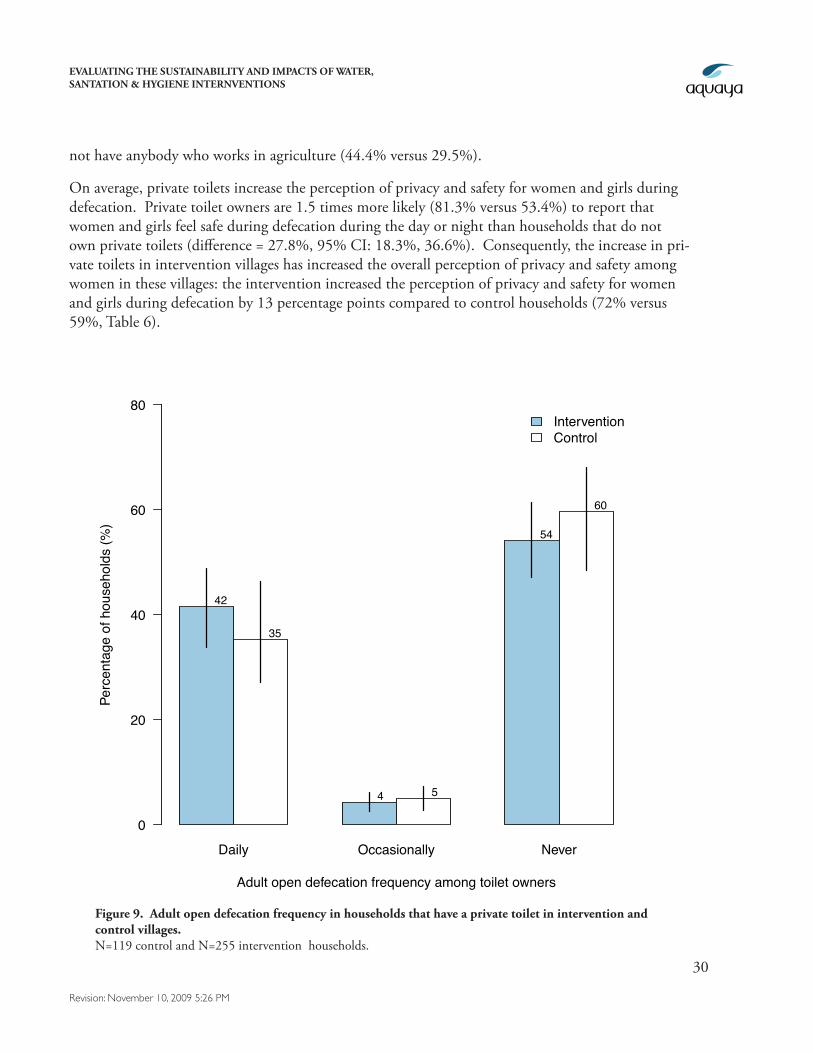
Ownership of a private toilet has also not eliminated open defecation practices among adults in the study. Among study households that have a private toilet, just over 40% report that adults practice open defecation daily (Figure 9) and over 52% report that children < 5 still practice open defecation daily (data not shown). The following reasons are given for continuing to practice open defecation in these households: no choice (50%), privacy (26%), convenience (25%) and safety (9%). Work-ing in agriculture (and likely defecating in the fields) may contribute to the persistence of adult open defecation among toilet owners, but does not entirely explain it: among toilet owning households, if a member of the household works in agriculture, the family is 14.9 percentage points (95% CI 3.5%, 26.3%) more likely to report that adults practice open defecation daily than if the household does
Total Men Women Children < 5
Perc
enta
ge o
f hou
seho
lds
(%)
0
20
40
60
80
100 InterventionControl
77
88
68
84
61
8176
88
Report practicing open defecationFigure 8. Open Defecation practices among men women and children under 5 years old in inter-vention and control households.N=456 control and N=444 intervention households.
EVALUATING THE SUSTAINABILITY AND IMPACTS OF WATER, SANTATION & HYGIENE INTERNVENTIONS
30
Revision: November 10, 2009 5:26 PM
not have anybody who works in agriculture (44.4% versus 29.5%).
On average, private toilets increase the perception of privacy and safety for women and girls during defecation. Private toilet owners are 1.5 times more likely (81.3% versus 53.4%) to report that women and girls feel safe during defecation during the day or night than households that do not own private toilets (difference = 27.8%, 95% CI: 18.3%, 36.6%). Consequently, the increase in pri-vate toilets in intervention villages has increased the overall perception of privacy and safety among women in these villages: the intervention increased the perception of privacy and safety for women and girls during defecation by 13 percentage points compared to control households (72% versus 59%, Table 6).
Daily Occasionally Never
Perc
enta
ge o
f hou
seho
lds
(%)
0
20
40
60
80
42
35
4 5
54
60
Adult open defecation frequency among toilet owners
InterventionControl
Figure 9. Adult open defecation frequency in households that have a private toilet in intervention and control villages. N=119 control and N=255 intervention households.
EVALUATING THE SUSTAINABILITY AND IMPACTS OF WATER, SANTATION & HYGIENE INTERNVENTIONS
31
Revision: November 10, 2009 5:26 PM
4.4. Hygiene and Handwashing
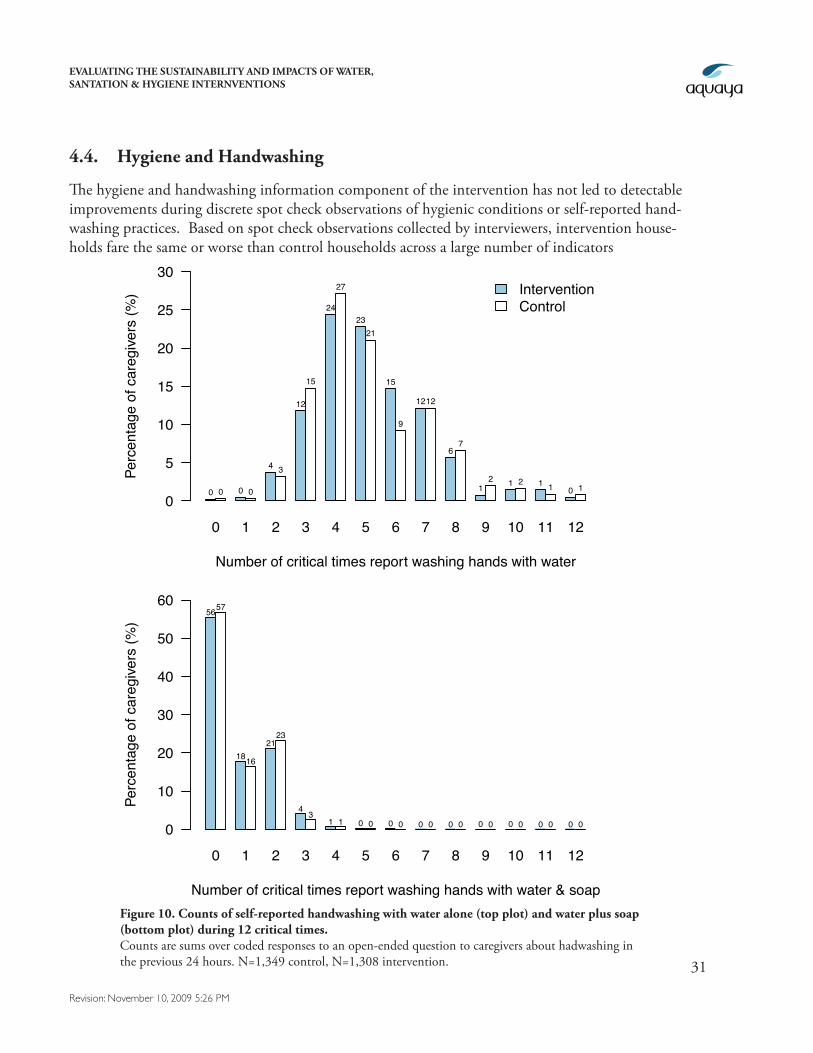
The hygiene and handwashing information component of the intervention has not led to detectable improvements during discrete spot check observations of hygienic conditions or self-reported hand-washing practices. Based on spot check observations collected by interviewers, intervention house-holds fare the same or worse than control households across a large number of indicators
Figure 10. Counts of self-reported handwashing with water alone (top plot) and water plus soap (bottom plot) during 12 critical times. Counts are sums over coded responses to an open-ended question to caregivers about hadwashing in the previous 24 hours. N=1,349 control, N=1,308 intervention.
0 1 2 3 4 5 6 7 8 9 10 11 12
Number of critical times report washing hands with water
Perc
enta
ge o
f car
egive
rs (%
)
0
5
10
15
20
25
30
0 0 0 0
4 3
12
15
24
27
2321
15
9
1212
67
12 1 2 1 1 0 1
InterventionControl
0 1 2 3 4 5 6 7 8 9 10 11 12
Number of critical times report washing hands with water & soap
Perc
enta
ge o
f car
egive
rs (%
)
0
10
20
30
40
50
605657
1816
2123
4 31 1 0 0 0 0 0 0 0 0 0 0 0 0 0 0 0 0
0 1 2 3 4 5 6 7 8 9 10 11 12
Number of critical times report washing hands with water
Perc
enta
ge o
f car
egive
rs (%
)
0
5
10
15
20
25
30
0 0 0 0
4 3
12
15
24
27
2321
15
9
1212
67
12 1 2 1 1 0 1
InterventionControl
0 1 2 3 4 5 6 7 8 9 10 11 12
Number of critical times report washing hands with water & soap
Perc
enta
ge o
f car
egive
rs (%
)
0
10
20
30
40
50
605657
1816
2123
4 31 1 0 0 0 0 0 0 0 0 0 0 0 0 0 0 0 0
EVALUATING THE SUSTAINABILITY AND IMPACTS OF WATER, SANTATION & HYGIENE INTERNVENTIONS
32
Revision: November 10, 2009 5:26 PM
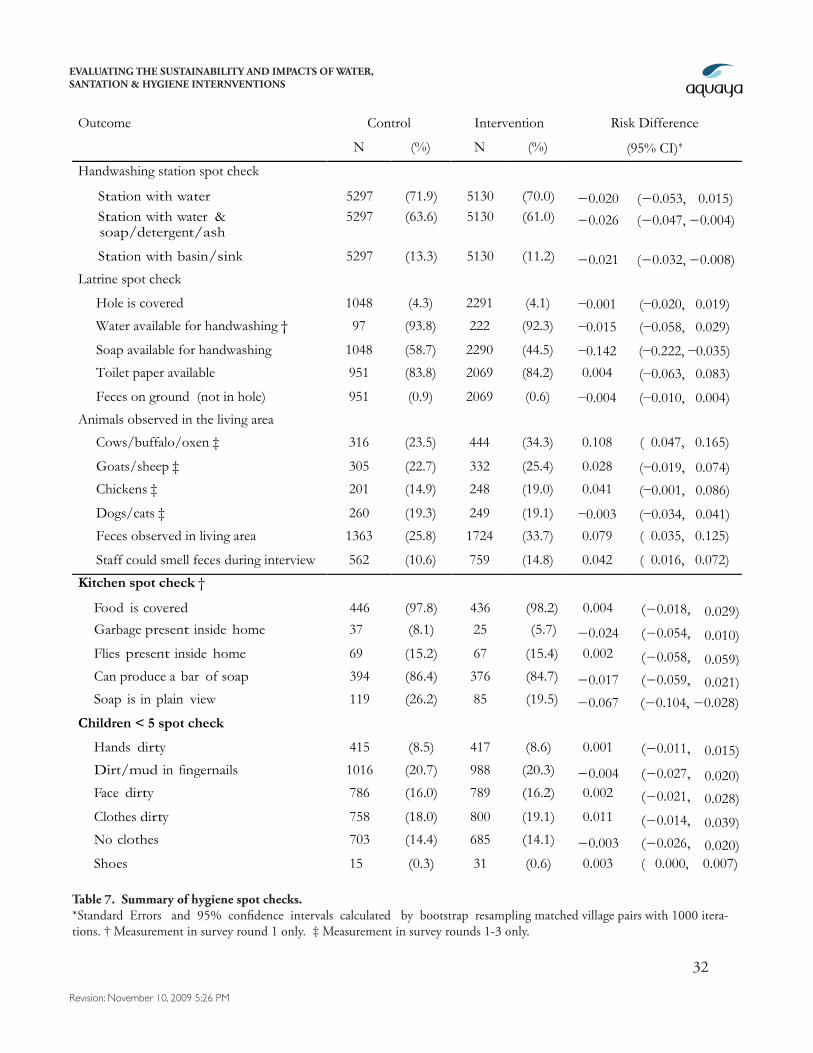
Table 7. Summary of hygiene spot checks.*Standard Errors and 95% confidence intervals calculated by bootstrap resampling matched village pairs with 1000 itera-tions. † Measurement in survey round 1 only. ‡ Measurement in survey rounds 1-3 only.
Outcome Control Intervention Risk Difference
N (%) N (%) (95% CI)∗
Handwashing station spot check
Station with water 5297 (71.9) 5130 (70.0) −0.020 (−0.053, 0.015) Station with water &
soap/detergent/ash 5297 (63.6) 5130 (61.0) −0.026 (−0.047, −0.004)
Station with basin/sink 5297 (13.3) 5130 (11.2) −0.021 (−0.032, −0.008) Latrine spot check
Hole is covered 1048 (4.3) 2291 (4.1) −0.001 (−0.020, 0.019)
Water available for handwashing † 97 (93.8) 222 (92.3) −0.015 (−0.058, 0.029)
Soap available for handwashing 1048 (58.7) 2290 (44.5) −0.142 (−0.222, −0.035)
Toilet paper available 951 (83.8) 2069 (84.2) 0.004 (−0.063, 0.083)
Feces on ground (not in hole) 951 (0.9) 2069 (0.6) −0.004 (−0.010, 0.004)
Animals observed in the living area
Cows/buffalo/oxen ‡ 316 (23.5) 444 (34.3) 0.108 ( 0.047, 0.165)
0.165) Goats/sheep ‡ 305 (22.7) 332 (25.4) 0.028 (−0.019, 0.074)
0.074) Chickens ‡ 201 (14.9) 248 (19.0) 0.041 (−0.001, 0.086)
Dogs/cats ‡ 260 (19.3) 249 (19.1) −0.003 (−0.034, 0.041)
Feces observed in living area 1363 (25.8) 1724 (33.7) 0.079 ( 0.035, 0.125)
Staff could smell feces during interview 562 (10.6) 759 (14.8) 0.042 ( 0.016, 0.072)
Kitchen spot check †
Food is covered 446 (97.8) 436 (98.2) 0.004 (−0.018, 0.029) Garbage present inside home 37 (8.1) 25 (5.7) −0.024 (−0.054, 0.010) Flies present inside home 69 (15.2) 67 (15.4) 0.002 (−0.058, 0.059) Can produce a bar of soap 394 (86.4) 376 (84.7) −0.017 (−0.059, 0.021) Soap is in plain view 119 (26.2) 85 (19.5) −0.067 (−0.104, −0.028)
Children < 5 spot check
Hands dirty 415 (8.5) 417 (8.6) 0.001 (−0.011, 0.015) Dirt/mud in fingernails 1016 (20.7) 988 (20.3) −0.004 (−0.027, 0.020) Face dirty 786 (16.0) 789 (16.2) 0.002 (−0.021, 0.028) Clothes dirty 758 (18.0) 800 (19.1) 0.011 (−0.014, 0.039) No clothes 703 (14.4) 685 (14.1) −0.003 (−0.026, 0.020) Shoes 15 (0.3) 31 (0.6) 0.003 ( 0.000, 0.007)
EVALUATING THE SUSTAINABILITY AND IMPACTS OF WATER, SANTATION & HYGIENE INTERNVENTIONS
33
Revision: November 10, 2009 5:26 PM
(Table 7). For example, over 12 monthly measurements, interven-tion and control households are equally likely to have a dedicated handwashing station with water, but intervention households are slightly less likely to have a handwashing station with water and either soap, detergent or ash (61% versus 64%; risk difference [RD] = −0.03, 95% CI: −0.05, −0.01). Intervention households are also less likely than controls to have soap available for handwashing at their toilet (45% versus 59%; RD = −0.142, 95% CI: −0.224, −0.035), and are more likely to have feces observed in the living area (34% versus 26%; RD = 0.079, 95% CI: 0.035, 0.125). There are no differences between intervention and control households in observations of cleanliness for children < 5.
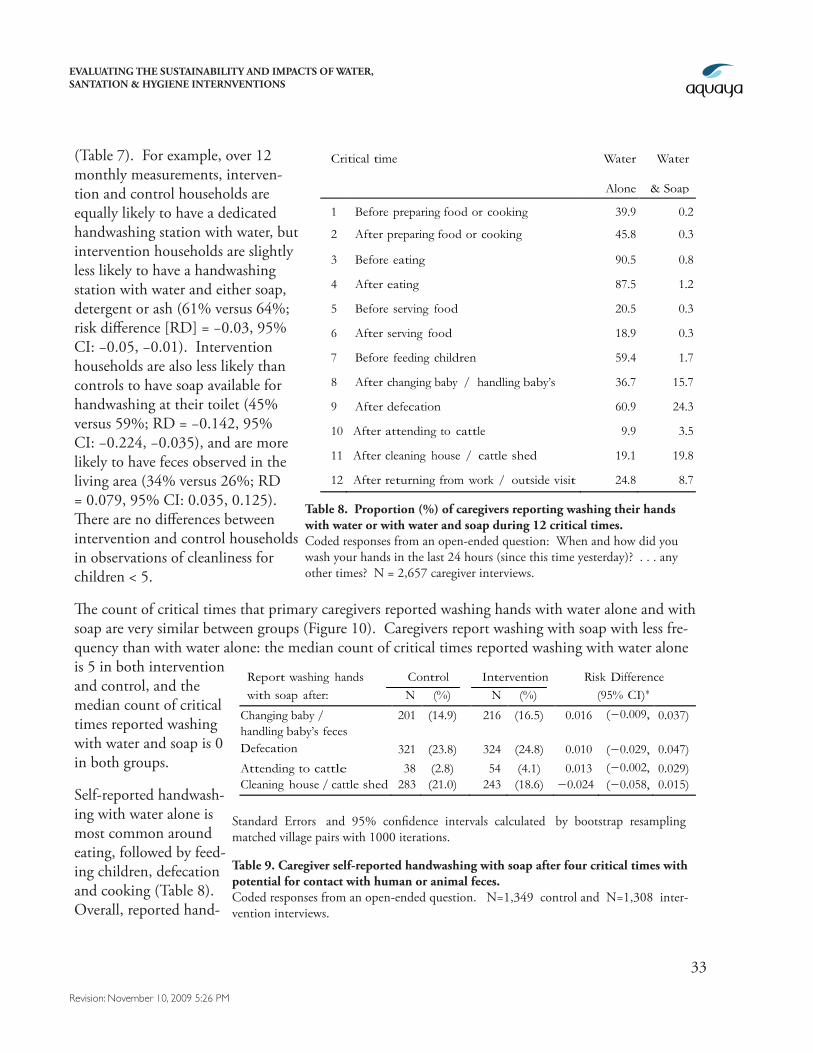
The count of critical times that primary caregivers reported washing hands with water alone and with soap are very similar between groups (Figure 10). Caregivers report washing with soap with less fre-quency than with water alone: the median count of critical times reported washing with water alone is 5 in both intervention and control, and the median count of critical times reported washing with water and soap is 0 in both groups.
Self-reported handwash-ing with water alone is most common around eating, followed by feed-ing children, defecation and cooking (Table 8). Overall, reported hand-
Critical time Water
Alone
Water
& Soap
1 Before preparing food or cooking 39.9 0.2
2 After preparing food or cooking 45.8 0.3
3 Before eating 90.5 0.8
4 After eating 87.5 1.2
5 Before serving food 20.5 0.3
6 After serving food 18.9 0.3
7 Before feeding children 59.4 1.7
8 After changing baby / handling baby’s feces
36.7 15.7
9 After defecation 60.9 24.3
10 After attending to cattle 9.9 3.5
11 After cleaning house / cattle shed 19.1 19.8
12 After returning from work / outside visit 24.8 8.7
Table 8. Proportion (%) of caregivers reporting washing their hands with water or with water and soap during 12 critical times. Coded responses from an open-ended question: When and how did you wash your hands in the last 24 hours (since this time yesterday)? . . . any other times? N = 2,657 caregiver interviews.
Report washing hands Control Intervention Risk Difference with soap after: N (%) N (%) (95% CI)∗
Changing baby / handling baby’s feces
201 (14.9) 216 (16.5) 0.016 (−0.009, 0.037)
Defecation 321 (23.8) 324 (24.8) 0.010 (−0.029, 0.047)
Attending to cattle le
38 (2.8) 54 (4.1) 0.013 (−0.002, 0.029) Cleaning house / cattle shed 283 (21.0) 243 (18.6) −0.024 (−0.058, 0.015)
Table 9. Caregiver self-reported handwashing with soap after four critical times with potential for contact with human or animal feces. Coded responses from an open-ended question. N=1,349 control and N=1,308 inter-vention interviews.
Standard Errors and 95% confidence intervals calculated by bootstrap resampling matched village pairs with 1000 iterations.
EVALUATING THE SUSTAINABILITY AND IMPACTS OF WATER, SANTATION & HYGIENE INTERNVENTIONS
34
Revision: November 10, 2009 5:26 PM
washing with soap is rare: in 24.3% of caregiver interviews the woman reported washing her hands after defecation (the most common time, Table 8). Caregivers report handwashing with soap pri-marily around contact with feces (defecation, changing the baby) and cleaning the house or cattle shed. Although caregivers in intervention households are slightly more likely to report washing their hands after defecation or handling their baby’s feces, the differences are small (≤ 2%) and are not statistically significant (Table 9).
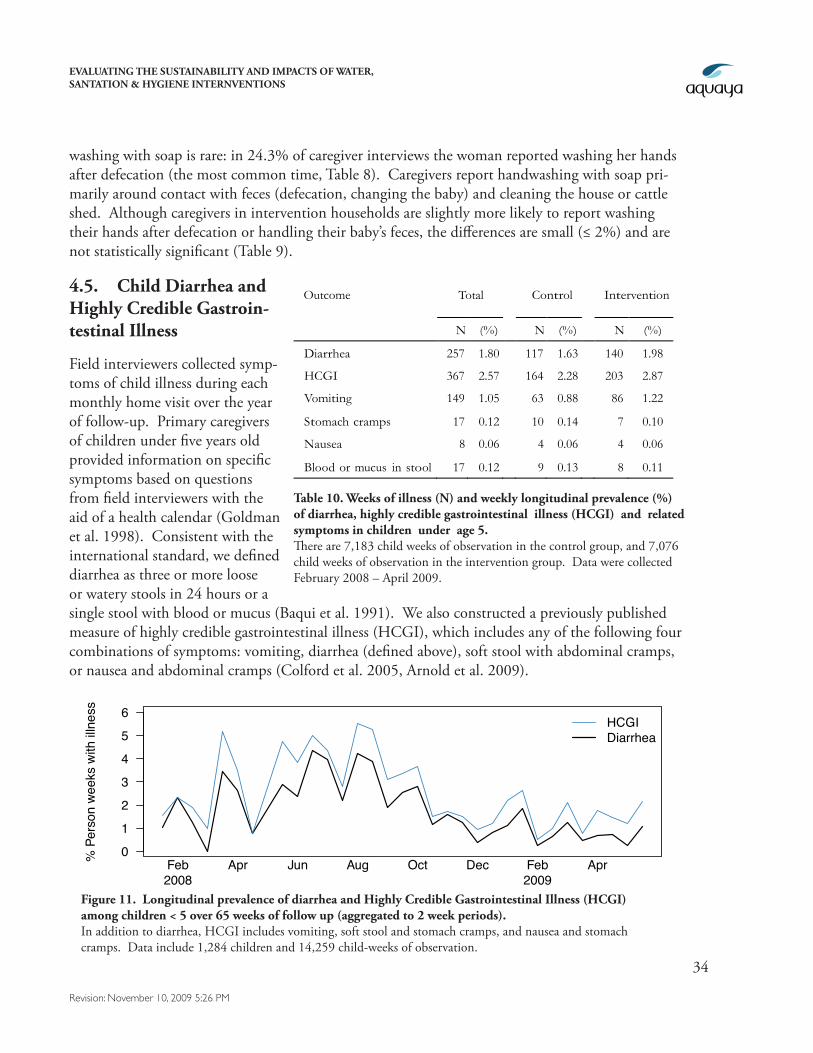
4.5. Child Diarrhea and Highly Credible Gastroin-testinal Illness
Field interviewers collected symp-toms of child illness during each monthly home visit over the year of follow-up. Primary caregivers of children under five years old provided information on specific symptoms based on questions from field interviewers with the aid of a health calendar (Goldman et al. 1998). Consistent with the international standard, we defined diarrhea as three or more loose or watery stools in 24 hours or a single stool with blood or mucus (Baqui et al. 1991). We also constructed a previously published measure of highly credible gastrointestinal illness (HCGI), which includes any of the following four combinations of symptoms: vomiting, diarrhea (defined above), soft stool with abdominal cramps, or nausea and abdominal cramps (Colford et al. 2005, Arnold et al. 2009).
Outcome Total Control Intervention
N (%) N (%) N (%)
Diarrhea 257 1.80 117 1.63 140 1.98
HCGI 367 2.57 164 2.28 203 2.87
Vomiting 149 1.05 63 0.88 86 1.22
Stomach cramps 17 0.12 10 0.14 7 0.10
Nausea 8 0.06 4 0.06 4 0.06
Blood or mucus in stool 17 0.12 9 0.13 8 0.11
Table 10. Weeks of illness (N) and weekly longitudinal prevalence (%) of diarrhea, highly credible gastrointestinal illness (HCGI) and related symptoms in children under age 5. There are 7,183 child weeks of observation in the control group, and 7,076 child weeks of observation in the intervention group. Data were collected February 2008 – April 2009.
Figure 11. Longitudinal prevalence of diarrhea and Highly Credible Gastrointestinal Illness (HCGI) among children < 5 over 65 weeks of follow up (aggregated to 2 week periods). In addition to diarrhea, HCGI includes vomiting, soft stool and stomach cramps, and nausea and stomach cramps. Data include 1,284 children and 14,259 child-weeks of observation.
0
1
2
3
4
5
6
% P
erso
n we
eks
with
illn
ess
Feb Apr Jun Aug Oct Dec Feb Apr2008 2009
HCGIDiarrhea
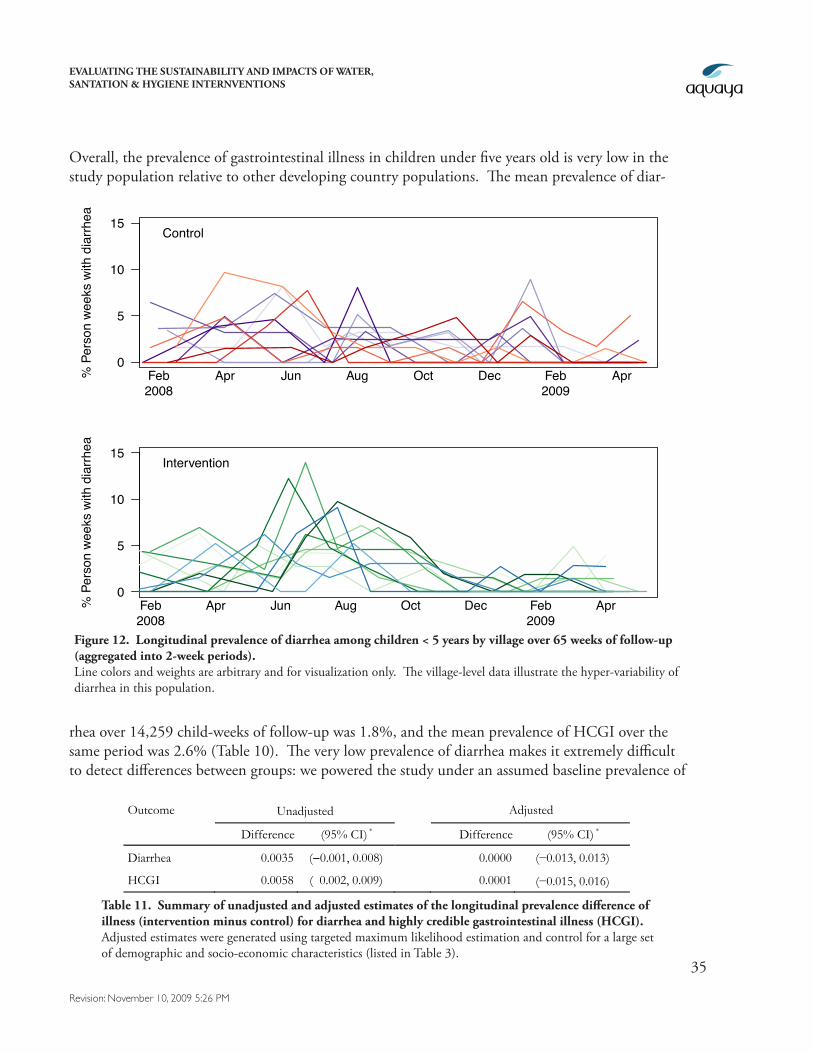
EVALUATING THE SUSTAINABILITY AND IMPACTS OF WATER, SANTATION & HYGIENE INTERNVENTIONS
35
Revision: November 10, 2009 5:26 PM
Overall, the prevalence of gastrointestinal illness in children under five years old is very low in the study population relative to other developing country populations. The mean prevalence of diar-
rhea over 14,259 child-weeks of follow-up was 1.8%, and the mean prevalence of HCGI over the same period was 2.6% (Table 10). The very low prevalence of diarrhea makes it extremely difficult to detect differences between groups: we powered the study under an assumed baseline prevalence of
Figure 12. Longitudinal prevalence of diarrhea among children < 5 years by village over 65 weeks of follow-up (aggregated into 2-week periods). Line colors and weights are arbitrary and for visualization only. The village-level data illustrate the hyper-variability of diarrhea in this population.
0
5
10
15
% P
erso
n we
eks
with
dia
rrhea
Feb Apr Jun Aug Oct Dec Feb Apr2008 2009
Control
0
5
10
15
% P
erso
n we
eks
with
dia
rrhea
Feb Apr Jun Aug Oct Dec Feb Apr2008 2009
Intervention
Outcome Unadjusted Adjusted
Difference (95% CI) * Difference (95% CI) *
Diarrhea 0.0035 (−0.001, 0.008) 0.0000 (−0.013, 0.013)
HCGI 0.0058 ( 0.002, 0.009) 0.0001 (−0.015, 0.016) Table 11. Summary of unadjusted and adjusted estimates of the longitudinal prevalence difference of
illness (intervention minus control) for diarrhea and highly credible gastrointestinal illness (HCGI). Adjusted estimates were generated using targeted maximum likelihood estimation and control for a large set of demographic and socio-economic characteristics (listed in Table 3).
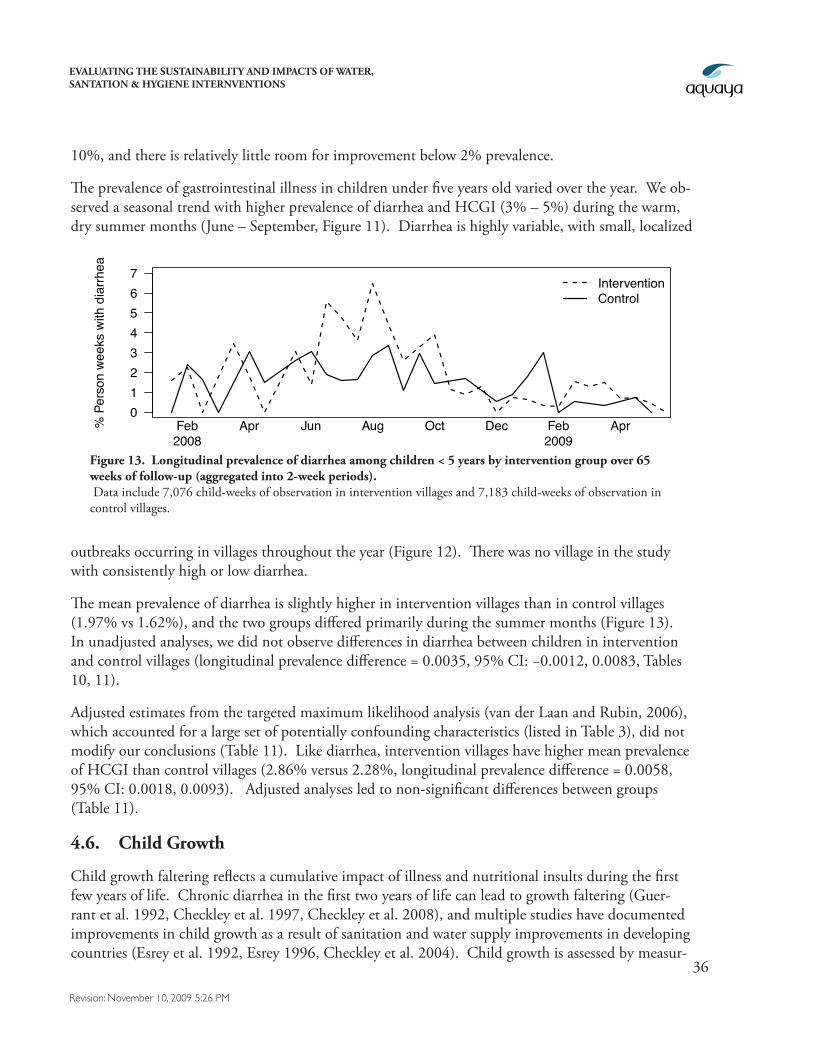
EVALUATING THE SUSTAINABILITY AND IMPACTS OF WATER, SANTATION & HYGIENE INTERNVENTIONS
36
Revision: November 10, 2009 5:26 PM
10%, and there is relatively little room for improvement below 2% prevalence.
The prevalence of gastrointestinal illness in children under five years old varied over the year. We ob-served a seasonal trend with higher prevalence of diarrhea and HCGI (3% – 5%) during the warm, dry summer months (June – September, Figure 11). Diarrhea is highly variable, with small, localized
outbreaks occurring in villages throughout the year (Figure 12). There was no village in the study with consistently high or low diarrhea.
The mean prevalence of diarrhea is slightly higher in intervention villages than in control villages (1.97% vs 1.62%), and the two groups differed primarily during the summer months (Figure 13). In unadjusted analyses, we did not observe differences in diarrhea between children in intervention and control villages (longitudinal prevalence difference = 0.0035, 95% CI: −0.0012, 0.0083, Tables 10, 11).
Adjusted estimates from the targeted maximum likelihood analysis (van der Laan and Rubin, 2006), which accounted for a large set of potentially confounding characteristics (listed in Table 3), did not modify our conclusions (Table 11). Like diarrhea, intervention villages have higher mean prevalence of HCGI than control villages (2.86% versus 2.28%, longitudinal prevalence difference = 0.0058, 95% CI: 0.0018, 0.0093). Adjusted analyses led to non-significant differences between groups (Table 11).
4.6. Child Growth
Child growth faltering reflects a cumulative impact of illness and nutritional insults during the first few years of life. Chronic diarrhea in the first two years of life can lead to growth faltering (Guer-rant et al. 1992, Checkley et al. 1997, Checkley et al. 2008), and multiple studies have documented improvements in child growth as a result of sanitation and water supply improvements in developing countries (Esrey et al. 1992, Esrey 1996, Checkley et al. 2004). Child growth is assessed by measur-
01234567
% P
erso
n we
eks
with
dia
rrhea
Feb Apr Jun Aug Oct Dec Feb Apr2008 2009
InterventionControl
Figure 13. Longitudinal prevalence of diarrhea among children < 5 years by intervention group over 65 weeks of follow-up (aggregated into 2-week periods). Data include 7,076 child-weeks of observation in intervention villages and 7,183 child-weeks of observation in control villages.
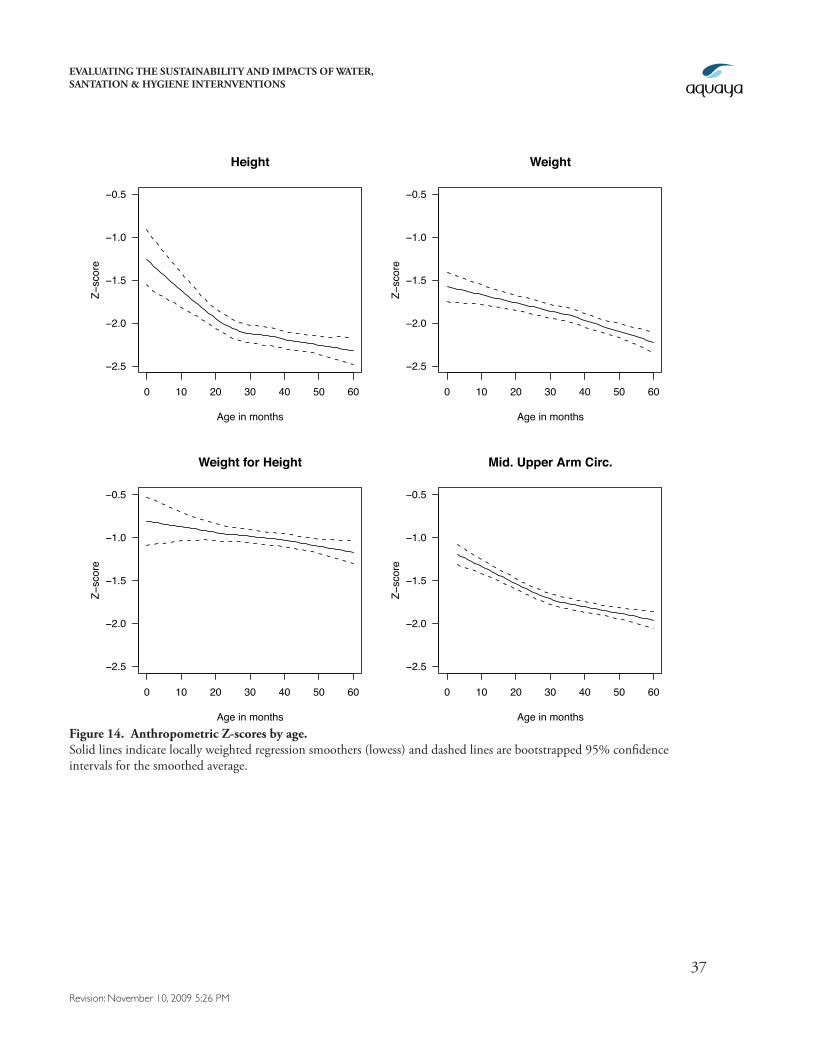
EVALUATING THE SUSTAINABILITY AND IMPACTS OF WATER, SANTATION & HYGIENE INTERNVENTIONS
37
Revision: November 10, 2009 5:26 PM
Figure 14. Anthropometric Z-scores by age. Solid lines indicate locally weighted regression smoothers (lowess) and dashed lines are bootstrapped 95% confidence intervals for the smoothed average.
0 10 20 30 40 50 60
−2.5
−2.0
−1.5
−1.0
−0.5
Height
Age in months
Z−sc
ore
0 10 20 30 40 50 60
−2.5
−2.0
−1.5
−1.0
−0.5
Weight
Age in months
Z−sc
ore
0 10 20 30 40 50 60
−2.5
−2.0
−1.5
−1.0
−0.5
Weight for Height
Age in months
Z−sc
ore
0 10 20 30 40 50 60
−2.5
−2.0
−1.5
−1.0
−0.5
Mid. Upper Arm Circ.
Age in months
Z−sc
ore
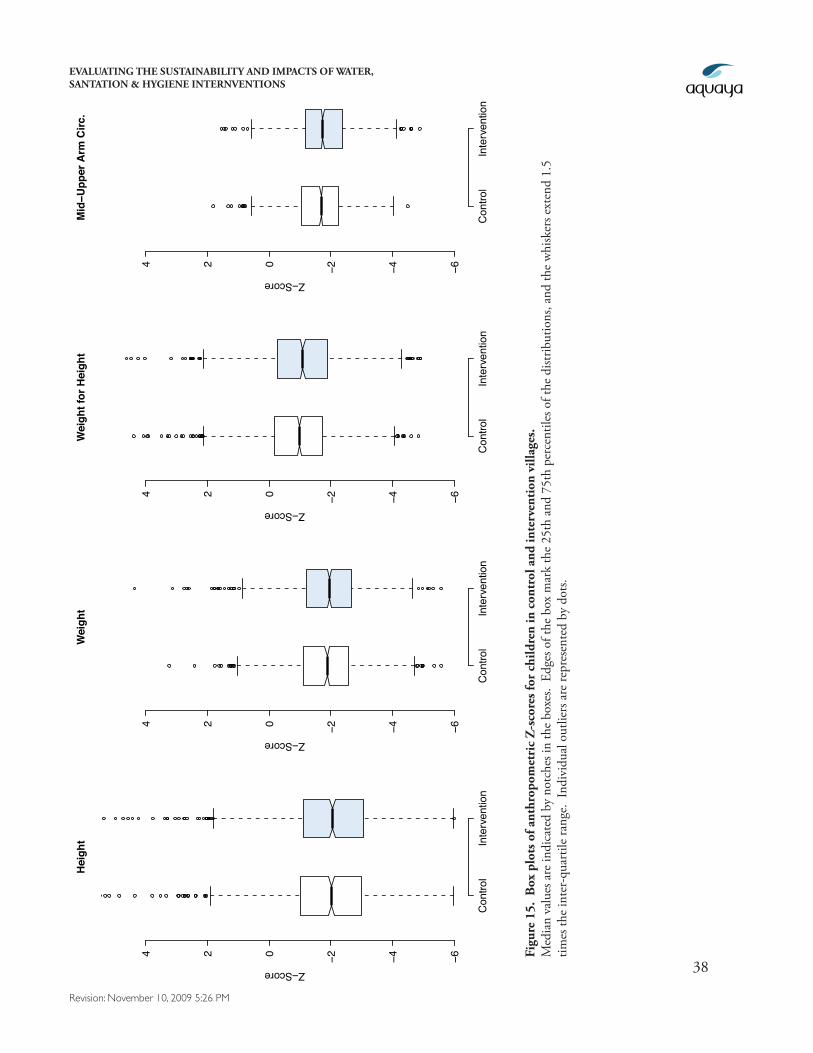
EVALUATING THE SUSTAINABILITY AND IMPACTS OF WATER, SANTATION & HYGIENE INTERNVENTIONS
38
Revision: November 10, 2009 5:26 PM
Con
trol
Inte
rven
tion
−6−4−2024
Hei
ght
Z−Score
Con
trol
Inte
rven
tion
−6−4−2024
Wei
ght
Z−Score
Con
trol
Inte
rven
tion
−6−4−2024
Wei
ght f
or H
eigh
t
Z−Score
Con
trol
Inte
rven
tion
−6−4−2024
Mid
−Upp
er A
rm C
irc.
Z−Score
Figu
re 1
5. B
ox p
lots
of a
nthr
opom
etri
c Z
-sco
res f
or c
hild
ren
in c
ontr
ol a
nd in
terv
enti
on v
illag
es.
Med
ian
valu
es a
re in
dica
ted
by n
otch
es in
the
boxe
s. E
dges
of t
he b
ox m
ark
the
25th
and
75t
h pe
rcen
tiles
of t
he d
istrib
utio
ns, a
nd th
e w
hisk
ers e
xten
d 1.
5 tim
es th
e in
ter-
quar
tile
rang
e. I
ndiv
idua
l out
liers
are
repr
esen
ted
by d
ots.
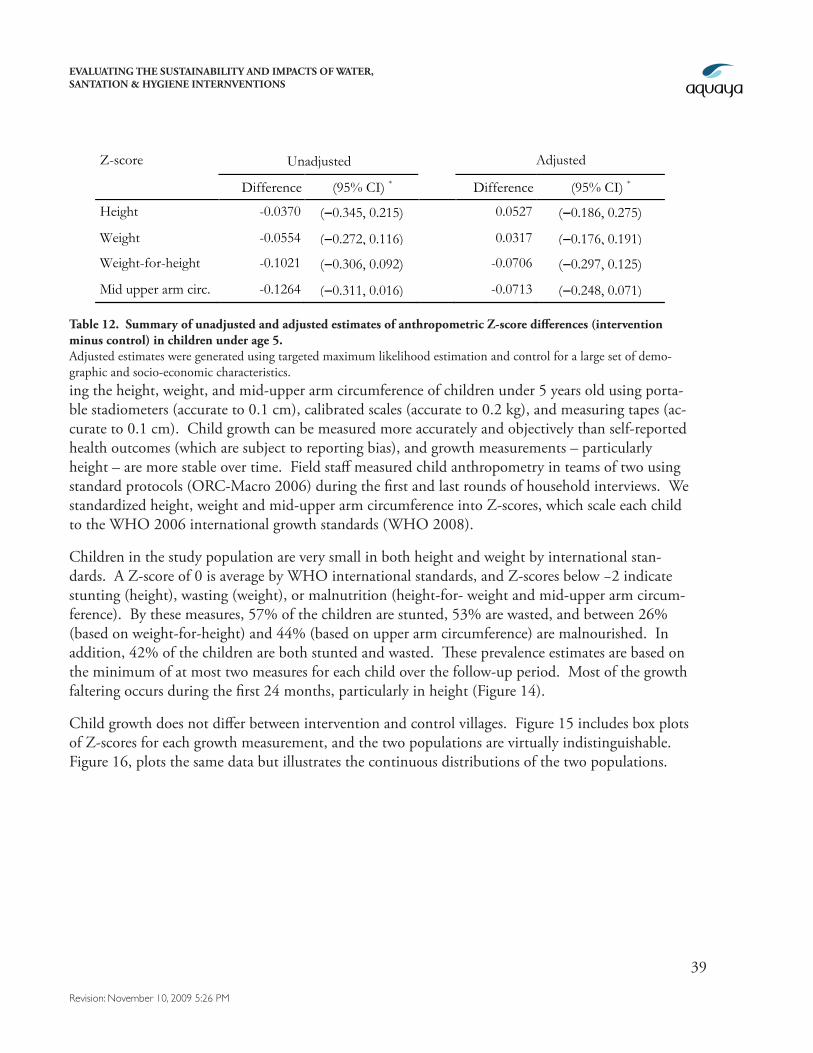
EVALUATING THE SUSTAINABILITY AND IMPACTS OF WATER, SANTATION & HYGIENE INTERNVENTIONS
39
Revision: November 10, 2009 5:26 PM
ing the height, weight, and mid-upper arm circumference of children under 5 years old using porta-ble stadiometers (accurate to 0.1 cm), calibrated scales (accurate to 0.2 kg), and measuring tapes (ac-curate to 0.1 cm). Child growth can be measured more accurately and objectively than self-reported health outcomes (which are subject to reporting bias), and growth measurements – particularly height – are more stable over time. Field staff measured child anthropometry in teams of two using standard protocols (ORC-Macro 2006) during the first and last rounds of household interviews. We standardized height, weight and mid-upper arm circumference into Z-scores, which scale each child to the WHO 2006 international growth standards (WHO 2008).
Children in the study population are very small in both height and weight by international stan-dards. A Z-score of 0 is average by WHO international standards, and Z-scores below −2 indicate stunting (height), wasting (weight), or malnutrition (height-for- weight and mid-upper arm circum-ference). By these measures, 57% of the children are stunted, 53% are wasted, and between 26% (based on weight-for-height) and 44% (based on upper arm circumference) are malnourished. In addition, 42% of the children are both stunted and wasted. These prevalence estimates are based on the minimum of at most two measures for each child over the follow-up period. Most of the growth faltering occurs during the first 24 months, particularly in height (Figure 14).
Child growth does not differ between intervention and control villages. Figure 15 includes box plots of Z-scores for each growth measurement, and the two populations are virtually indistinguishable. Figure 16, plots the same data but illustrates the continuous distributions of the two populations.
Table 12. Summary of unadjusted and adjusted estimates of anthropometric Z-score differences (intervention minus control) in children under age 5. Adjusted estimates were generated using targeted maximum likelihood estimation and control for a large set of demo-graphic and socio-economic characteristics.
Z-score Unadjusted Adjusted
Difference (95% CI) * Difference (95% CI) *
Height -0.0370 (−0.345, 0.215) 0.0527 (−0.186, 0.275)
Weight -0.0554 (−0.272, 0.116) 0.0317 (−0.176, 0.191)
Weight-for-height -0.1021 (−0.306, 0.092) -0.0706 (−0.297, 0.125)
Mid upper arm circ. -0.1264 (−0.311, 0.016) -0.0713 (−0.248, 0.071)
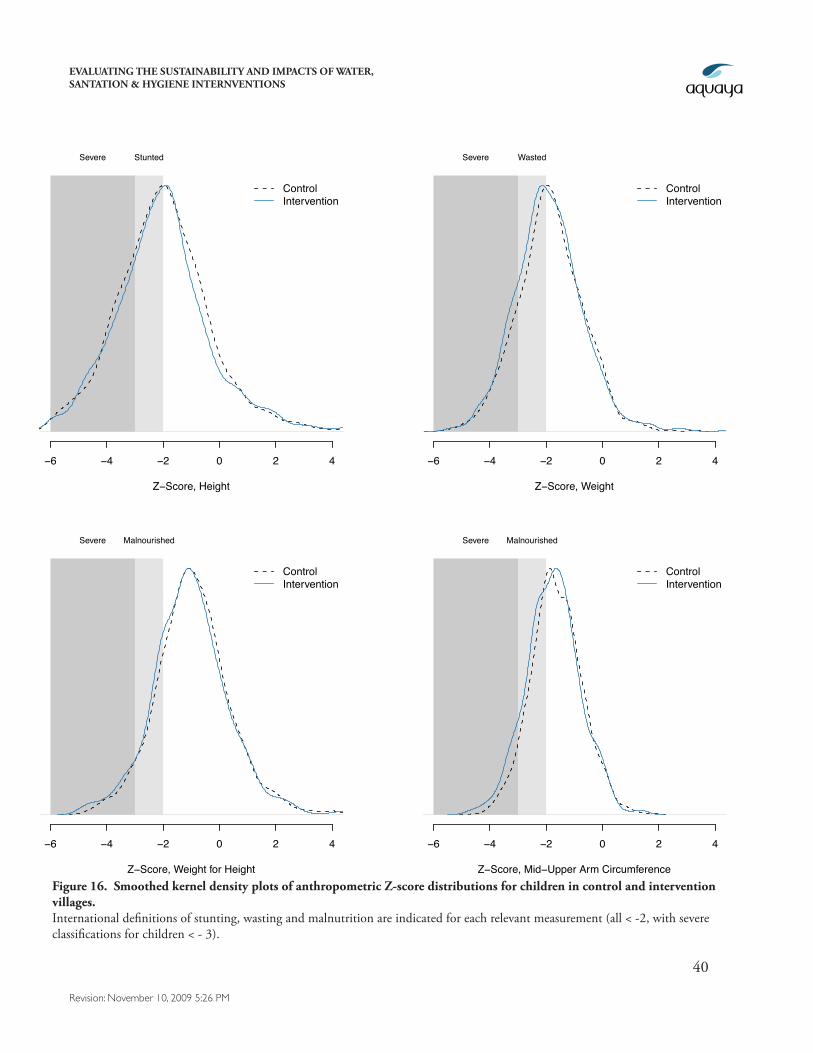
EVALUATING THE SUSTAINABILITY AND IMPACTS OF WATER, SANTATION & HYGIENE INTERNVENTIONS
40
Revision: November 10, 2009 5:26 PM
−6 −4 −2 0 2 4
Z−Score, Height
Severe Stunted
ControlIntervention
−6 −4 −2 0 2 4
Z−Score, Weight
Severe Wasted
ControlIntervention
−6 −4 −2 0 2 4
Z−Score, Weight for Height
Severe Malnourished
ControlIntervention
−6 −4 −2 0 2 4
Z−Score, Mid−Upper Arm Circumference
Severe Malnourished
ControlIntervention
Figure 16. Smoothed kernel density plots of anthropometric Z-score distributions for children in control and intervention villages. International definitions of stunting, wasting and malnutrition are indicated for each relevant measurement (all < -2, with severe classifications for children < - 3).
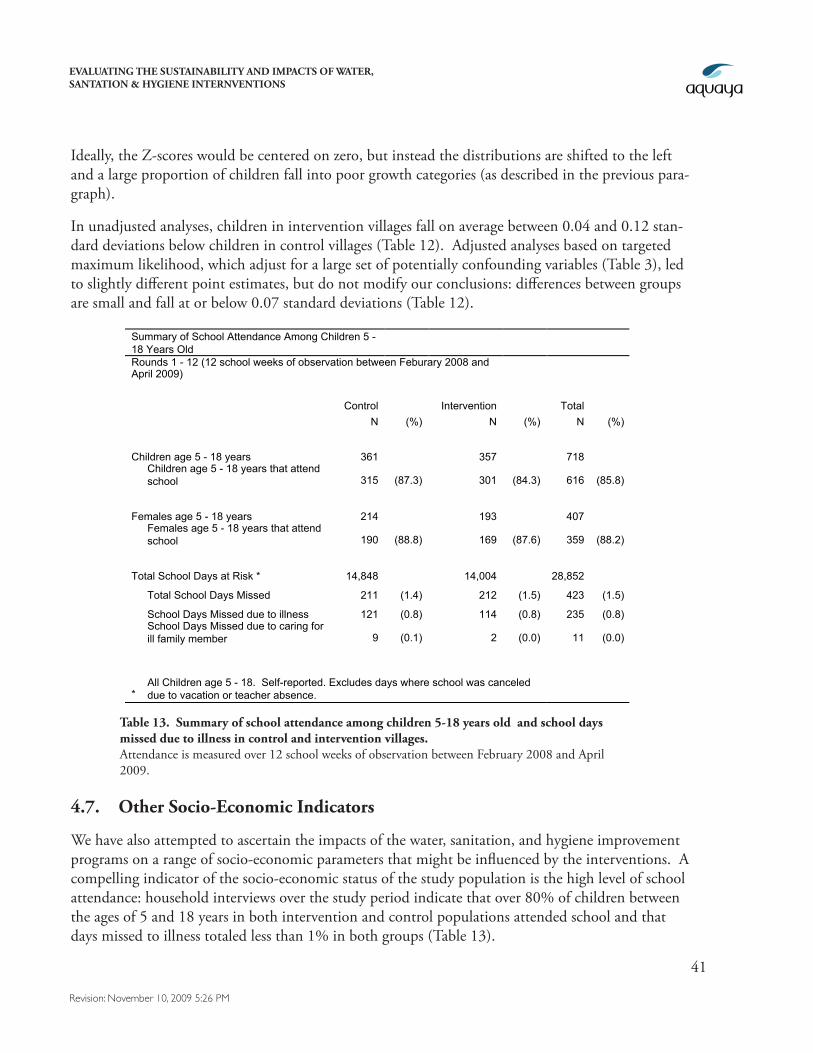
EVALUATING THE SUSTAINABILITY AND IMPACTS OF WATER, SANTATION & HYGIENE INTERNVENTIONS
41
Revision: November 10, 2009 5:26 PM
Ideally, the Z-scores would be centered on zero, but instead the distributions are shifted to the left and a large proportion of children fall into poor growth categories (as described in the previous para-graph).
In unadjusted analyses, children in intervention villages fall on average between 0.04 and 0.12 stan-dard deviations below children in control villages (Table 12). Adjusted analyses based on targeted maximum likelihood, which adjust for a large set of potentially confounding variables (Table 3), led to slightly different point estimates, but do not modify our conclusions: differences between groups are small and fall at or below 0.07 standard deviations (Table 12).
4.7. Other Socio-Economic Indicators
We have also attempted to ascertain the impacts of the water, sanitation, and hygiene improvement programs on a range of socio-economic parameters that might be influenced by the interventions. A compelling indicator of the socio-economic status of the study population is the high level of school attendance: household interviews over the study period indicate that over 80% of children between the ages of 5 and 18 years in both intervention and control populations attended school and that days missed to illness totaled less than 1% in both groups (Table 13).
Summary of School Attendance Among Children 5 - 18 Years Old Rounds 1 - 12 (12 school weeks of observation between Feburary 2008 and April 2009) Control Intervention Total N (%) N (%) N (%)
Children age 5 - 18 years 361 357 718
Children age 5 - 18 years that attend school 315 (87.3) 301 (84.3) 616 (85.8)
Females age 5 - 18 years 214 193 407
Females age 5 - 18 years that attend school 190 (88.8) 169 (87.6) 359 (88.2)
Total School Days at Risk * 14,848 14,004 28,852
Total School Days Missed 211 (1.4) 212 (1.5) 423 (1.5)
School Days Missed due to illness 121 (0.8) 114 (0.8) 235 (0.8)
School Days Missed due to caring for ill family member 9 (0.1) 2 (0.0) 11 (0.0)
* All Children age 5 - 18. Self-reported. Excludes days where school was canceled due to vacation or teacher absence.
Table 13. Summary of school attendance among children 5-18 years old and school days missed due to illness in control and intervention villages. Attendance is measured over 12 school weeks of observation between February 2008 and April 2009.
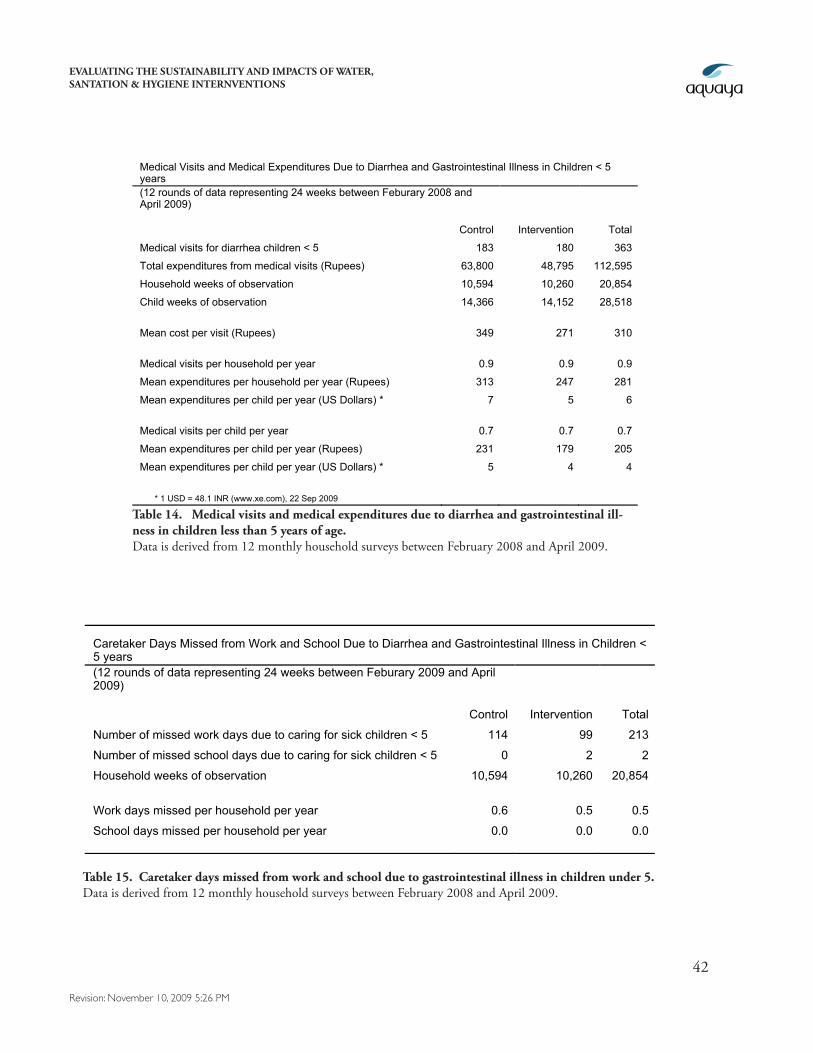
EVALUATING THE SUSTAINABILITY AND IMPACTS OF WATER, SANTATION & HYGIENE INTERNVENTIONS
42
Revision: November 10, 2009 5:26 PM
Caretaker Days Missed from Work and School Due to Diarrhea and Gastrointestinal Illness in Children < 5 years (12 rounds of data representing 24 weeks between Feburary 2009 and April 2009) Control Intervention Total
Number of missed work days due to caring for sick children < 5 114 99 213
Number of missed school days due to caring for sick children < 5 0 2 2
Household weeks of observation 10,594 10,260 20,854
Work days missed per household per year 0.6 0.5 0.5
School days missed per household per year 0.0 0.0 0.0
Table 15. Caretaker days missed from work and school due to gastrointestinal illness in children under 5. Data is derived from 12 monthly household surveys between February 2008 and April 2009.
Medical Visits and Medical Expenditures Due to Diarrhea and Gastrointestinal Illness in Children < 5 years (12 rounds of data representing 24 weeks between Feburary 2008 and April 2009) Control Intervention Total
Medical visits for diarrhea children < 5 183 180 363
Total expenditures from medical visits (Rupees) 63,800 48,795 112,595
Household weeks of observation 10,594 10,260 20,854
Child weeks of observation 14,366 14,152 28,518
Mean cost per visit (Rupees) 349 271 310
Medical visits per household per year 0.9 0.9 0.9
Mean expenditures per household per year (Rupees) 313 247 281
Mean expenditures per child per year (US Dollars) * 7 5 6
Medical visits per child per year 0.7 0.7 0.7
Mean expenditures per child per year (Rupees) 231 179 205
Mean expenditures per child per year (US Dollars) * 5 4 4
* 1 USD = 48.1 INR (www.xe.com), 22 Sep 2009
Table 14. Medical visits and medical expenditures due to diarrhea and gastrointestinal ill-ness in children less than 5 years of age. Data is derived from 12 monthly household surveys between February 2008 and April 2009.
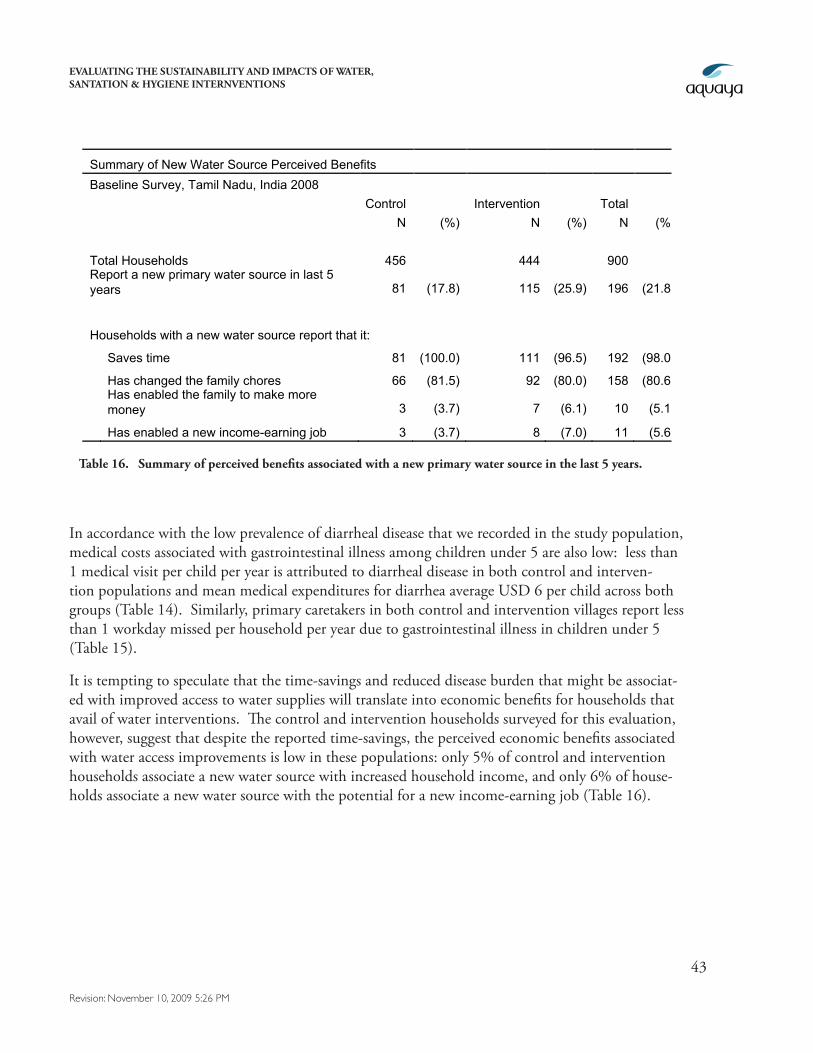
EVALUATING THE SUSTAINABILITY AND IMPACTS OF WATER, SANTATION & HYGIENE INTERNVENTIONS
43
Revision: November 10, 2009 5:26 PM
Summary of New Water Source Perceived Benefits Baseline Survey, Tamil Nadu, India 2008 Control Intervention Total N (%) N (%) N (%) Total Households 456 444 900 Report a new primary water source in last 5 years 81 (17.8) 115 (25.9) 196 (21.8)
Households with a new water source report that it:
Saves time 81 (100.0) 111 (96.5) 192 (98.0)
Has changed the family chores 66 (81.5) 92 (80.0) 158 (80.6)
Has enabled the family to make more money 3 (3.7) 7 (6.1) 10 (5.1)
Has enabled a new income-earning job 3 (3.7) 8 (7.0) 11 (5.6)
Table 16. Summary of perceived benefits associated with a new primary water source in the last 5 years.
In accordance with the low prevalence of diarrheal disease that we recorded in the study population, medical costs associated with gastrointestinal illness among children under 5 are also low: less than 1 medical visit per child per year is attributed to diarrheal disease in both control and interven-tion populations and mean medical expenditures for diarrhea average USD 6 per child across both groups (Table 14). Similarly, primary caretakers in both control and intervention villages report less than 1 workday missed per household per year due to gastrointestinal illness in children under 5 (Table 15).
It is tempting to speculate that the time-savings and reduced disease burden that might be associat-ed with improved access to water supplies will translate into economic benefits for households that avail of water interventions. The control and intervention households surveyed for this evaluation, however, suggest that despite the reported time-savings, the perceived economic benefits associated with water access improvements is low in these populations: only 5% of control and intervention households associate a new water source with increased household income, and only 6% of house-holds associate a new water source with the potential for a new income-earning job (Table 16).
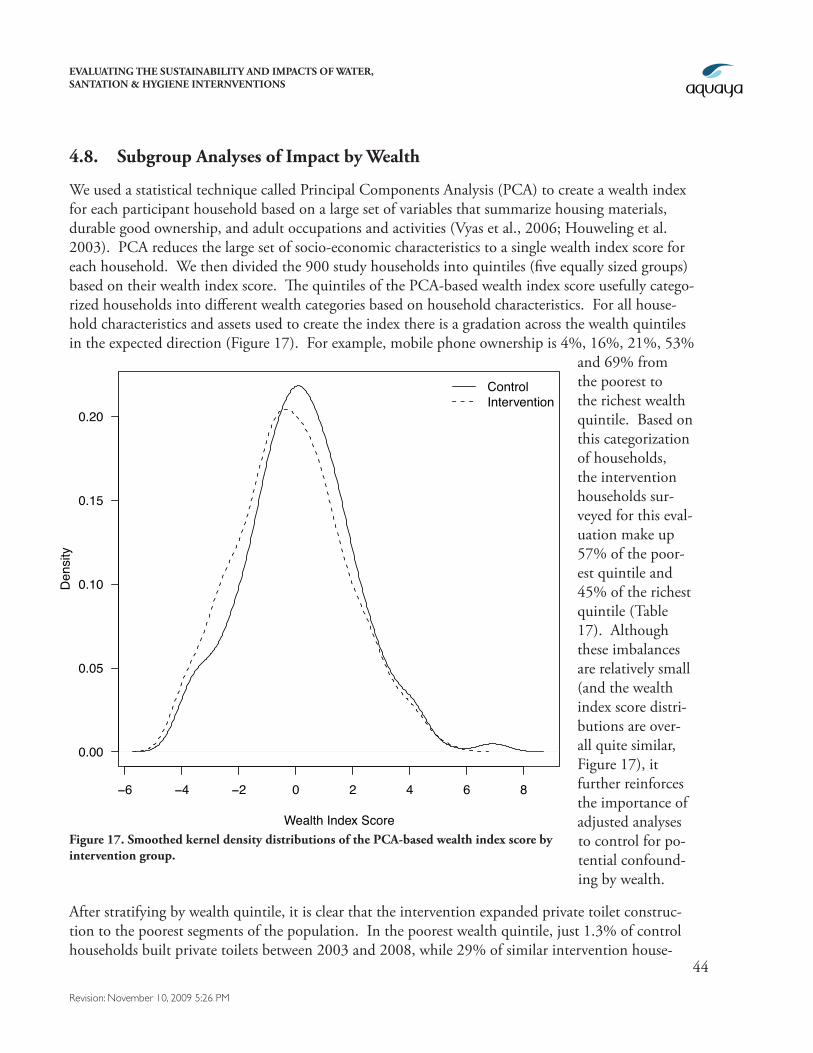
EVALUATING THE SUSTAINABILITY AND IMPACTS OF WATER, SANTATION & HYGIENE INTERNVENTIONS
44
Revision: November 10, 2009 5:26 PM
4.8. Subgroup Analyses of Impact by Wealth
We used a statistical technique called Principal Components Analysis (PCA) to create a wealth index for each participant household based on a large set of variables that summarize housing materials, durable good ownership, and adult occupations and activities (Vyas et al., 2006; Houweling et al. 2003). PCA reduces the large set of socio-economic characteristics to a single wealth index score for each household. We then divided the 900 study households into quintiles (five equally sized groups) based on their wealth index score. The quintiles of the PCA-based wealth index score usefully catego-rized households into different wealth categories based on household characteristics. For all house-hold characteristics and assets used to create the index there is a gradation across the wealth quintiles in the expected direction (Figure 17). For example, mobile phone ownership is 4%, 16%, 21%, 53%
and 69% from the poorest to the richest wealth quintile. Based on this categorization of households, the intervention households sur-veyed for this eval-uation make up 57% of the poor-est quintile and 45% of the richest quintile (Table 17). Although these imbalances are relatively small (and the wealth index score distri-butions are over-all quite similar, Figure 17), it further reinforces the importance of adjusted analyses to control for po-tential confound-ing by wealth.
After stratifying by wealth quintile, it is clear that the intervention expanded private toilet construc-tion to the poorest segments of the population. In the poorest wealth quintile, just 1.3% of control households built private toilets between 2003 and 2008, while 29% of similar intervention house-
Figure 17. Smoothed kernel density distributions of the PCA-based wealth index score by intervention group.
−6 −4 −2 0 2 4 6 8
0.00
0.05
0.10
0.15
0.20
Wealth Index Score
Den
sity
ControlIntervention
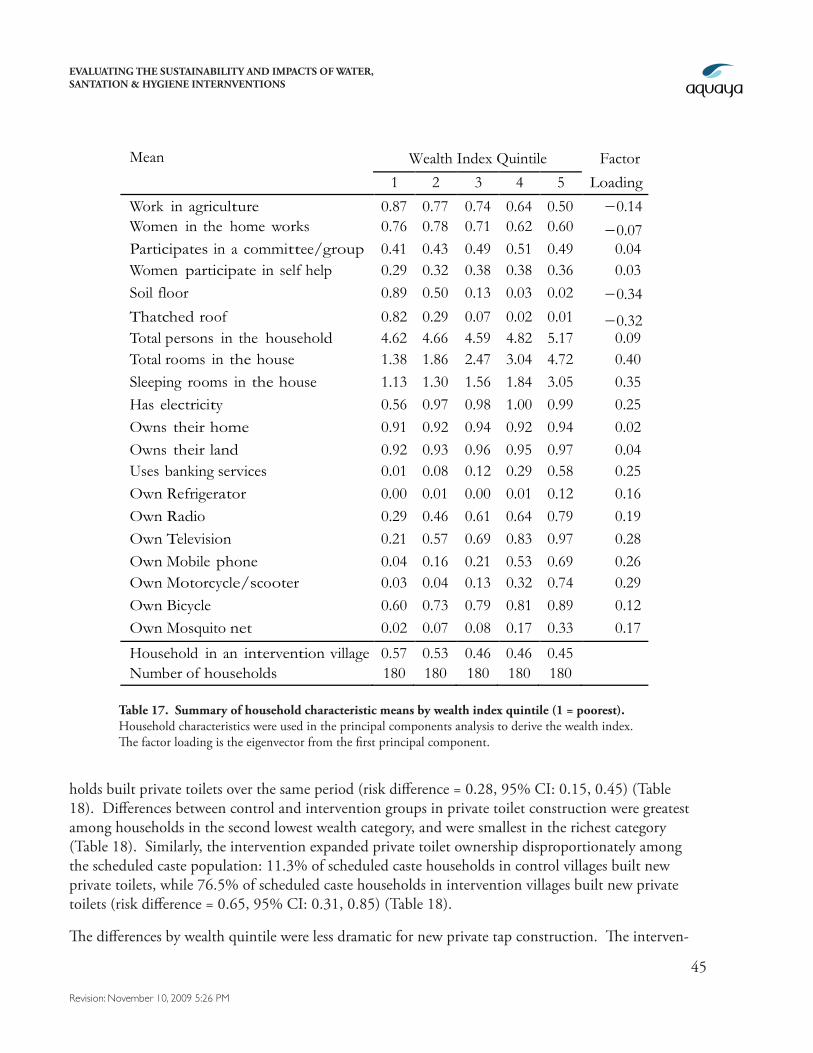
EVALUATING THE SUSTAINABILITY AND IMPACTS OF WATER, SANTATION & HYGIENE INTERNVENTIONS
45
Revision: November 10, 2009 5:26 PM
holds built private toilets over the same period (risk difference = 0.28, 95% CI: 0.15, 0.45) (Table 18). Differences between control and intervention groups in private toilet construction were greatest among households in the second lowest wealth category, and were smallest in the richest category (Table 18). Similarly, the intervention expanded private toilet ownership disproportionately among the scheduled caste population: 11.3% of scheduled caste households in control villages built new private toilets, while 76.5% of scheduled caste households in intervention villages built new private toilets (risk difference = 0.65, 95% CI: 0.31, 0.85) (Table 18).
The differences by wealth quintile were less dramatic for new private tap construction. The interven-
Mean Wealth Index Quintile Factor 1 2 3 4 5 Loading
Work in agriculture 0.87 0.77 0.74 0.64 0.50 −0.14 Women in the home works 0.76 0.78 0.71 0.62 0.60 −0.07 Participates in a committee/group 0.41 0.43 0.49 0.51 0.49 0.04 Women participate in self help group
0.29 0.32 0.38 0.38 0.36 0.03 Soil floor 0.89 0.50 0.13 0.03 0.02 −0.34 Thatched roof 0.82 0.29 0.07 0.02 0.01 −0.32 Total persons in the household 4.62 4.66 4.59 4.82 5.17 0.09 Total rooms in the house 1.38 1.86 2.47 3.04 4.72 0.40 Sleeping rooms in the house 1.13 1.30 1.56 1.84 3.05 0.35 Has electricity 0.56 0.97 0.98 1.00 0.99 0.25 Owns their home 0.91 0.92 0.94 0.92 0.94 0.02 Owns their land 0.92 0.93 0.96 0.95 0.97 0.04 Uses banking services 0.01 0.08 0.12 0.29 0.58 0.25 Own Refrigerator 0.00 0.01 0.00 0.01 0.12 0.16 Own Radio 0.29 0.46 0.61 0.64 0.79 0.19 Own Television 0.21 0.57 0.69 0.83 0.97 0.28 Own Mobile phone 0.04 0.16 0.21 0.53 0.69 0.26 Own Motorcycle/scooter 0.03 0.04 0.13 0.32 0.74 0.29 Own Bicycle 0.60 0.73 0.79 0.81 0.89 0.12 Own Mosquito net 0.02 0.07 0.08 0.17 0.33 0.17
Household in an intervention village 0.57 0.53 0.46 0.46 0.45 Number of households 180 180 180 180 180
Table 17. Summary of household characteristic means by wealth index quintile (1 = poorest). Household characteristics were used in the principal components analysis to derive the wealth index. The factor loading is the eigenvector from the first principal component.
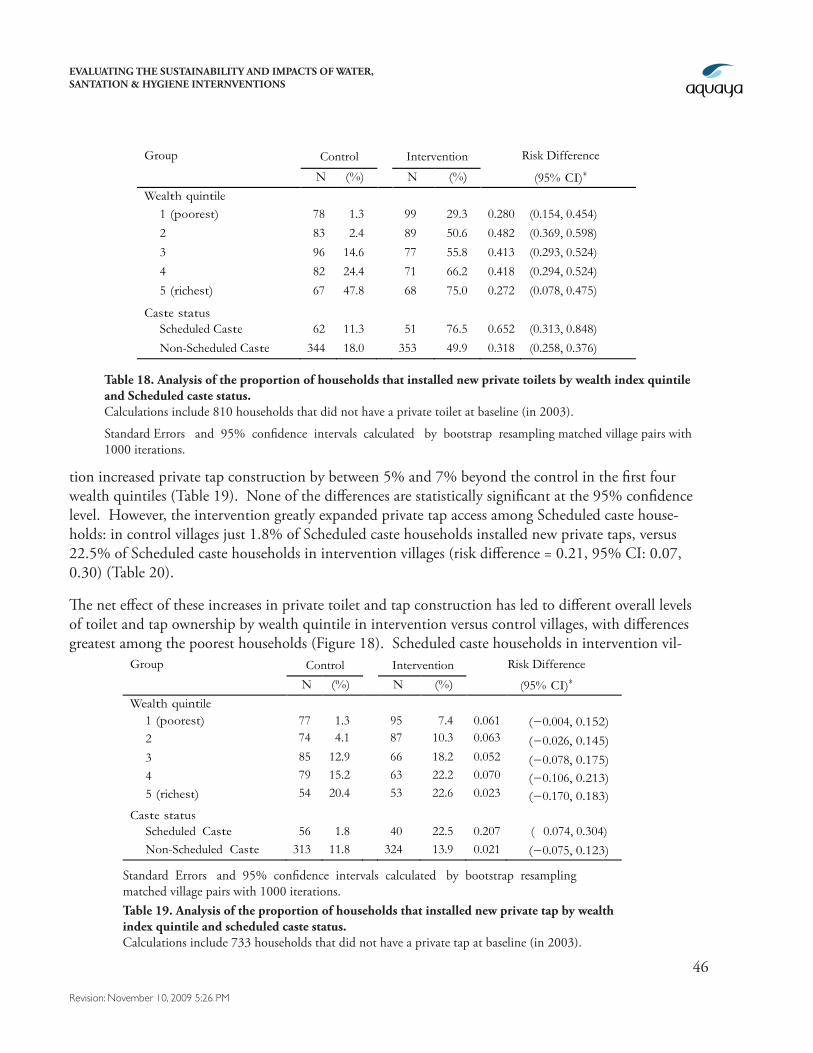
EVALUATING THE SUSTAINABILITY AND IMPACTS OF WATER, SANTATION & HYGIENE INTERNVENTIONS
46
Revision: November 10, 2009 5:26 PM
tion increased private tap construction by between 5% and 7% beyond the control in the first four wealth quintiles (Table 19). None of the differences are statistically significant at the 95% confidence level. However, the intervention greatly expanded private tap access among Scheduled caste house-holds: in control villages just 1.8% of Scheduled caste households installed new private taps, versus 22.5% of Scheduled caste households in intervention villages (risk difference = 0.21, 95% CI: 0.07, 0.30) (Table 20).
The net effect of these increases in private toilet and tap construction has led to different overall levels of toilet and tap ownership by wealth quintile in intervention versus control villages, with differences greatest among the poorest households (Figure 18). Scheduled caste households in intervention vil-
Group Control Intervention Risk Difference
N (%) N (%) (95% CI)∗
Wealth quintile
1 (poorest) 78 1.3 99 29.3 0.280 (0.154, 0.454)
2 83 2.4 89 50.6 0.482 (0.369, 0.598)
3 96 14.6 77 55.8 0.413 (0.293, 0.524)
4 82 24.4 71 66.2 0.418 (0.294, 0.524)
5 (richest) 67 47.8 68 75.0 0.272 (0.078, 0.475)
Caste status
Scheduled Caste 62 11.3 51 76.5 0.652 (0.313, 0.848)
Non-Scheduled Caste 344 18.0 353 49.9 0.318 (0.258, 0.376)
Table 18. Analysis of the proportion of households that installed new private toilets by wealth index quintile and Scheduled caste status. Calculations include 810 households that did not have a private toilet at baseline (in 2003).
Standard Errors and 95% confidence intervals calculated by bootstrap resampling matched village pairs with 1000 iterations.
Group Control Intervention Risk Difference
N (%) N (%) (95% CI)∗
Wealth quintile 1 (poorest) 77 1.3 95 7.4 0.061 (−0.004, 0.152) 2 74 4.1 87 10.3 0.063 (−0.026, 0.145) 3 85 12.9 66 18.2 0.052 (−0.078, 0.175) 4 79 15.2 63 22.2 0.070 (−0.106, 0.213) 5 (richest) 54 20.4 53 22.6 0.023 (−0.170, 0.183)
Caste status
Scheduled Caste 56 1.8 40 22.5 0.207 ( 0.074, 0.304) Non-Scheduled Caste 313 11.8 324 13.9 0.021 (−0.075, 0.123)
Table 19. Analysis of the proportion of households that installed new private tap by wealth index quintile and scheduled caste status. Calculations include 733 households that did not have a private tap at baseline (in 2003).
Standard Errors and 95% confidence intervals calculated by bootstrap resampling matched village pairs with 1000 iterations.
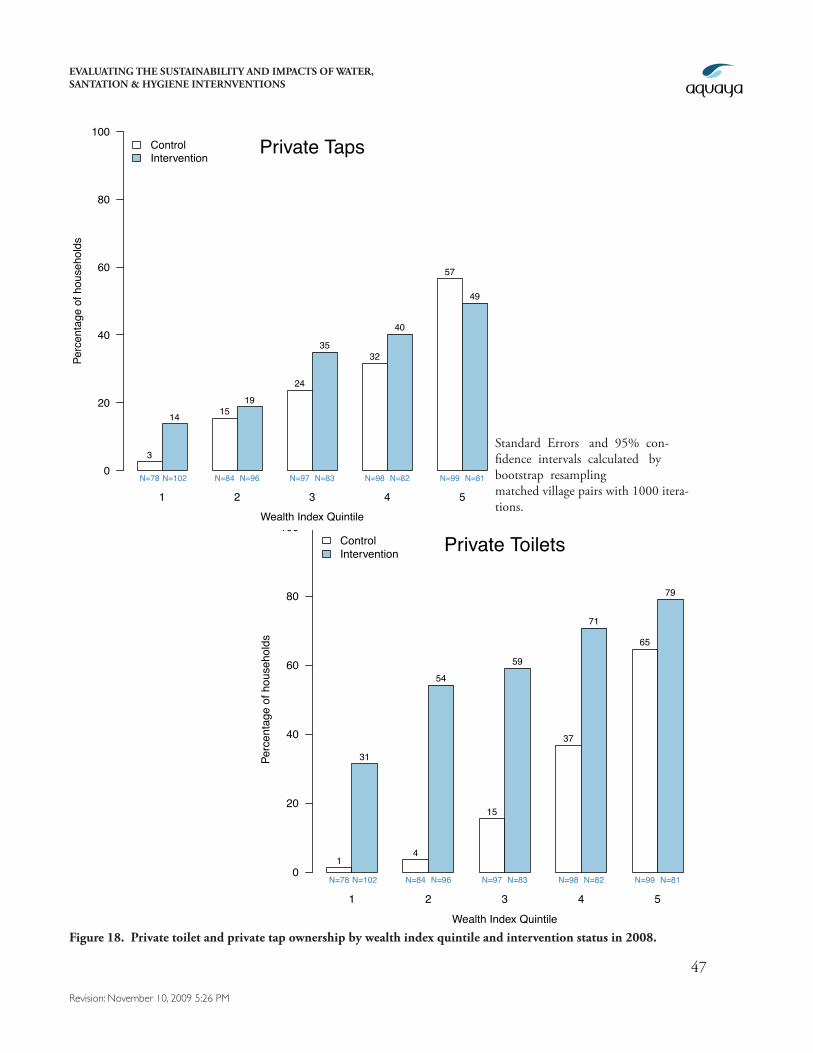
EVALUATING THE SUSTAINABILITY AND IMPACTS OF WATER, SANTATION & HYGIENE INTERNVENTIONS
47
Revision: November 10, 2009 5:26 PM
Wealth Index Quintile
Perc
enta
ge o
f hou
seho
lds
0
20
40
60
80
100
3
14 1519
24
3532
40
57
49
Private Taps
N=78 N=102 N=84 N=96 N=97 N=83 N=98 N=82 N=99 N=81
1 2 3 4 5
ControlIntervention
Figure 18. Private toilet and private tap ownership by wealth index quintile and intervention status in 2008.
Standard Errors and 95% con-fidence intervals calculated by bootstrap resampling matched village pairs with 1000 itera-tions.
Wealth Index Quintile
Perc
enta
ge o
f hou
seho
lds
0
20
40
60
80
100
1
31
4
54
15
59
37
71
65
79
Private Toilets
N=78 N=102 N=84 N=96 N=97 N=83 N=98 N=82 N=99 N=81
1 2 3 4 5
ControlIntervention
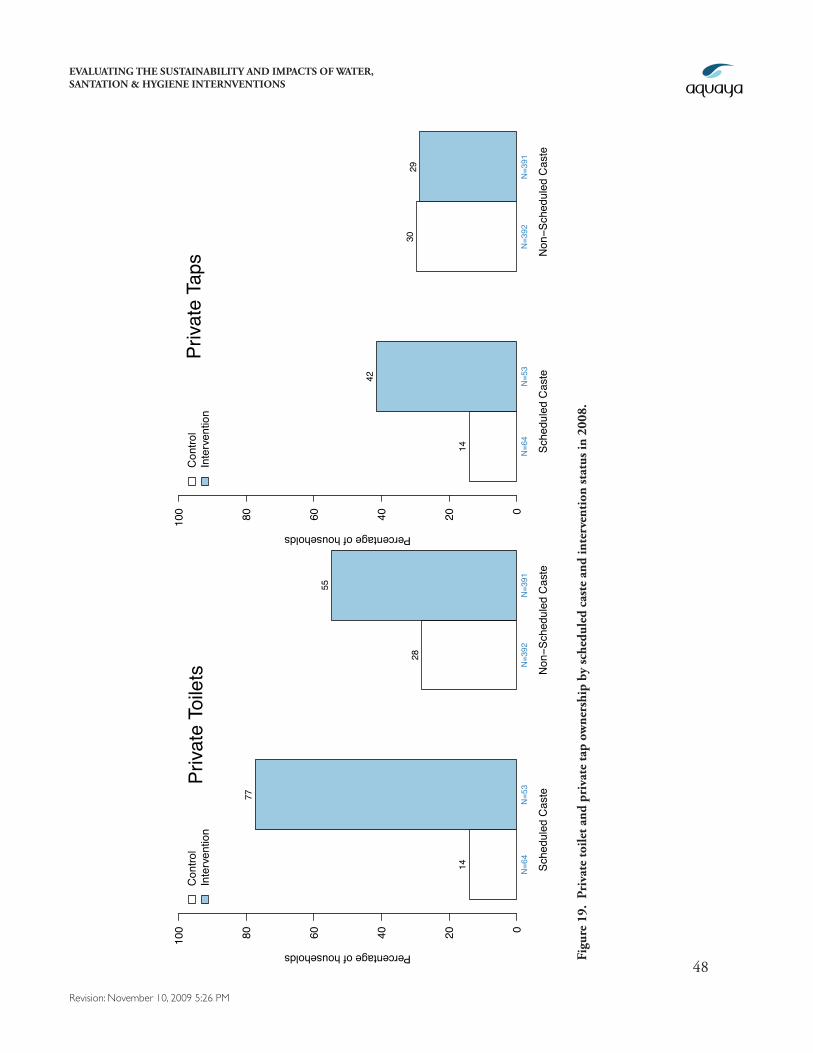
EVALUATING THE SUSTAINABILITY AND IMPACTS OF WATER, SANTATION & HYGIENE INTERNVENTIONS
48
Revision: November 10, 2009 5:26 PM
Percentage of households020406080100
14
42
3029
Priva
te T
aps
N=6
4N
=53
N=3
92N
=391
Sche
dule
d C
aste
Non
−Sch
edul
ed C
aste
Con
trol
Inte
rven
tion
Percentage of households
020406080100
14
77
28
55
Priva
te T
oile
ts
N=6
4N
=53
N=3
92N
=391
Sche
dule
d C
aste
Non
−Sch
edul
ed C
aste
Con
trol
Inte
rven
tion
Figu
re 1
9. P
riva
te to
ilet a
nd p
riva
te ta
p ow
ners
hip
by sc
hedu
led
cast
e an
d in
terv
enti
on st
atus
in 2
008.
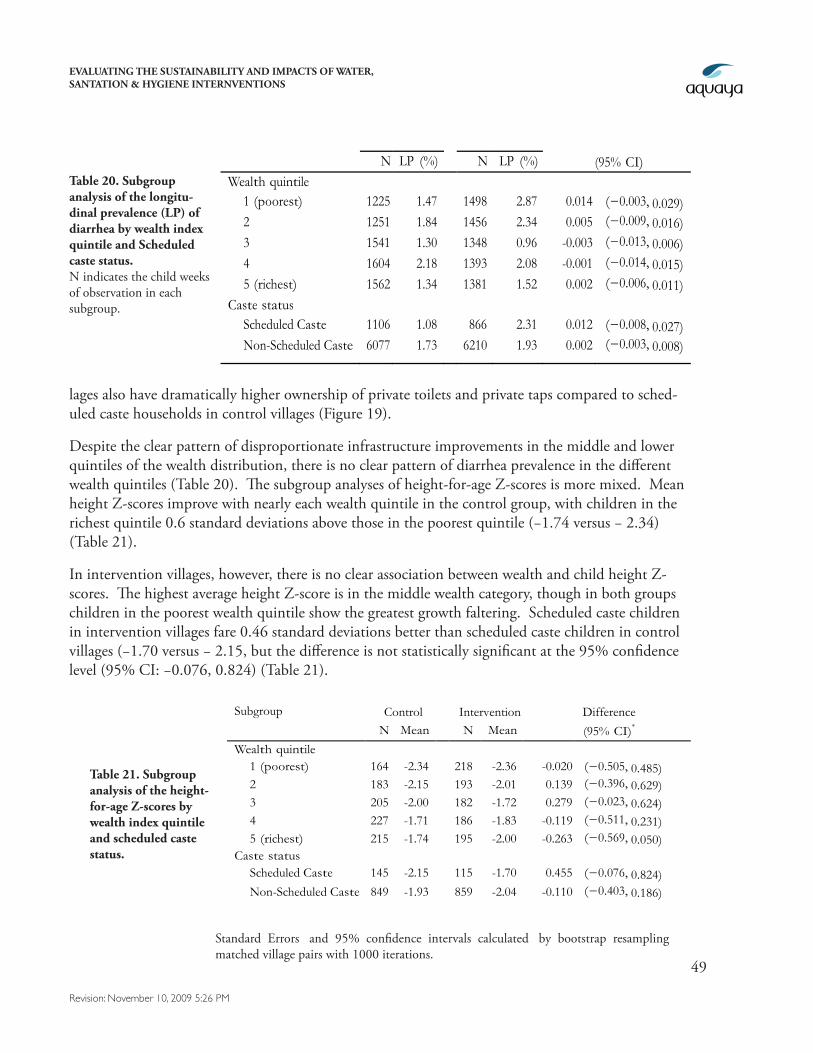
EVALUATING THE SUSTAINABILITY AND IMPACTS OF WATER, SANTATION & HYGIENE INTERNVENTIONS
49
Revision: November 10, 2009 5:26 PM
lages also have dramatically higher ownership of private toilets and private taps compared to sched-uled caste households in control villages (Figure 19).
Despite the clear pattern of disproportionate infrastructure improvements in the middle and lower quintiles of the wealth distribution, there is no clear pattern of diarrhea prevalence in the different wealth quintiles (Table 20). The subgroup analyses of height-for-age Z-scores is more mixed. Mean height Z-scores improve with nearly each wealth quintile in the control group, with children in the richest quintile 0.6 standard deviations above those in the poorest quintile (−1.74 versus − 2.34) (Table 21).
In intervention villages, however, there is no clear association between wealth and child height Z-scores. The highest average height Z-score is in the middle wealth category, though in both groups children in the poorest wealth quintile show the greatest growth faltering. Scheduled caste children in intervention villages fare 0.46 standard deviations better than scheduled caste children in control villages (−1.70 versus − 2.15, but the difference is not statistically significant at the 95% confidence level (95% CI: −0.076, 0.824) (Table 21).
Table 21. Subgroup analysis of the height-for-age Z-scores by wealth index quintile and scheduled caste status.
Subgroup Control Intervention Difference N Mean N Mean (95% CI)*
Wealth quintile 1 (poorest) 164 -2.34 218 -2.36 -0.020 (−0.505, 0.485) 2 183 -2.15 193 -2.01 0.139 (−0.396, 0.629) 3 205 -2.00 182 -1.72 0.279 (−0.023, 0.624) 4 227 -1.71 186 -1.83 -0.119 (−0.511, 0.231) 5 (richest) 215 -1.74 195 -2.00 -0.263 (−0.569, 0.050)
Caste status Scheduled Caste 145 -2.15 115 -1.70 0.455 (−0.076, 0.824) Non-Scheduled Caste 849 -1.93 859 -2.04 -0.110 (−0.403, 0.186)
Standard Errors and 95% confidence intervals calculated by bootstrap resampling matched village pairs with 1000 iterations.
Subgroup Control Intervention Difference N LP (%) N LP (%) (95% CI) Wealth quintile
1 (poorest) 1225 1.47 1498 2.87 0.014 (−0.003, 0.029) 2 1251 1.84 1456 2.34 0.005 (−0.009, 0.016) 3 1541 1.30 1348 0.96 -0.003 (−0.013, 0.006) 4 1604 2.18 1393 2.08 -0.001 (−0.014, 0.015) 5 (richest) 1562 1.34 1381 1.52 0.002 (−0.006, 0.011)
Caste status Scheduled Caste 1106 1.08 866 2.31 0.012 (−0.008, 0.027) Non-Scheduled Caste 6077 1.73 6210 1.93 0.002 (−0.003, 0.008)
Table 20. Subgroup analysis of the longitu-dinal prevalence (LP) of diarrhea by wealth index quintile and Scheduled caste status. N indicates the child weeks of observation in each subgroup.
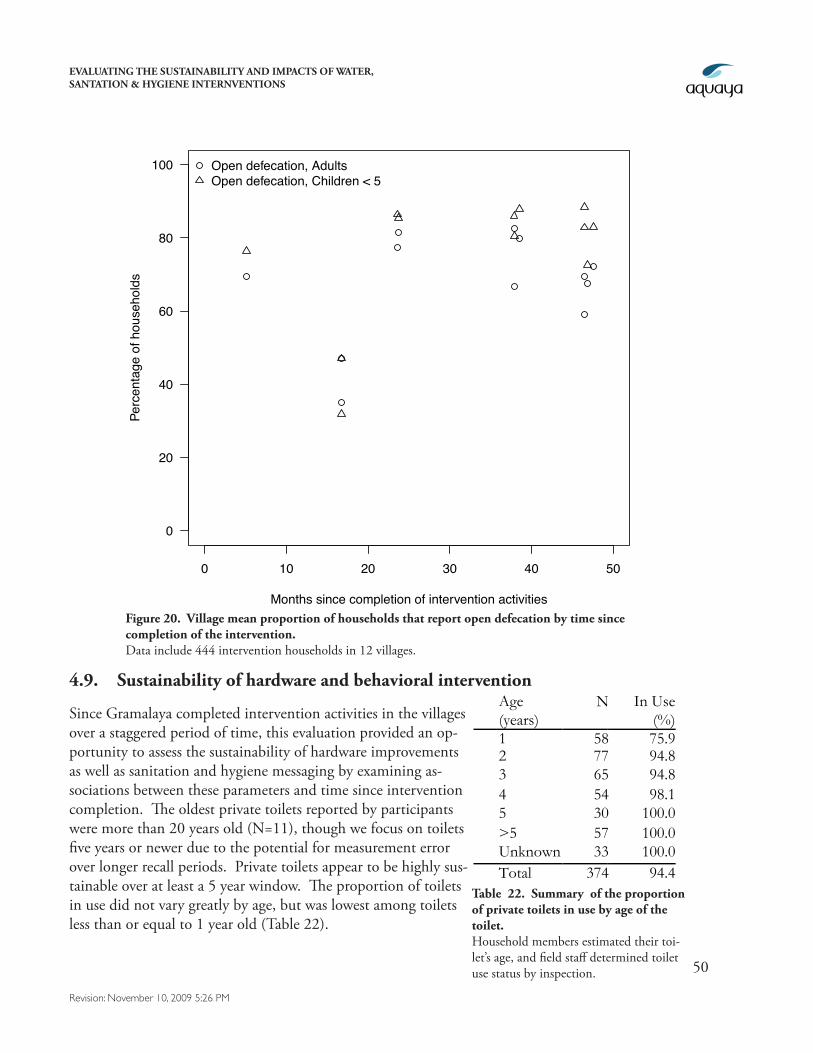
EVALUATING THE SUSTAINABILITY AND IMPACTS OF WATER, SANTATION & HYGIENE INTERNVENTIONS
50
Revision: November 10, 2009 5:26 PM
0 10 20 30 40 50
0
20
40
60
80
100
Months since completion of intervention activities
Perc
enta
ge o
f hou
seho
lds
Open defecation, AdultsOpen defecation, Children < 5
Figure 20. Village mean proportion of households that report open defecation by time since completion of the intervention. Data include 444 intervention households in 12 villages.
4.9. Sustainability of hardware and behavioral intervention
Since Gramalaya completed intervention activities in the villages over a staggered period of time, this evaluation provided an op-portunity to assess the sustainability of hardware improvements as well as sanitation and hygiene messaging by examining as-sociations between these parameters and time since intervention completion. The oldest private toilets reported by participants were more than 20 years old (N=11), though we focus on toilets five years or newer due to the potential for measurement error over longer recall periods. Private toilets appear to be highly sus-tainable over at least a 5 year window. The proportion of toilets in use did not vary greatly by age, but was lowest among toilets less than or equal to 1 year old (Table 22).
Age (years)
N In Use (%)
1 58 75.9 2 77 94.8 3 65 94.8 4 54 98.1 5 30 100.0 >5 57 100.0 Unknown 33 100.0 Total 374 94.4
Table 22. Summary of the proportion of private toilets in use by age of the toilet. Household members estimated their toi-let’s age, and field staff determined toilet use status by inspection.
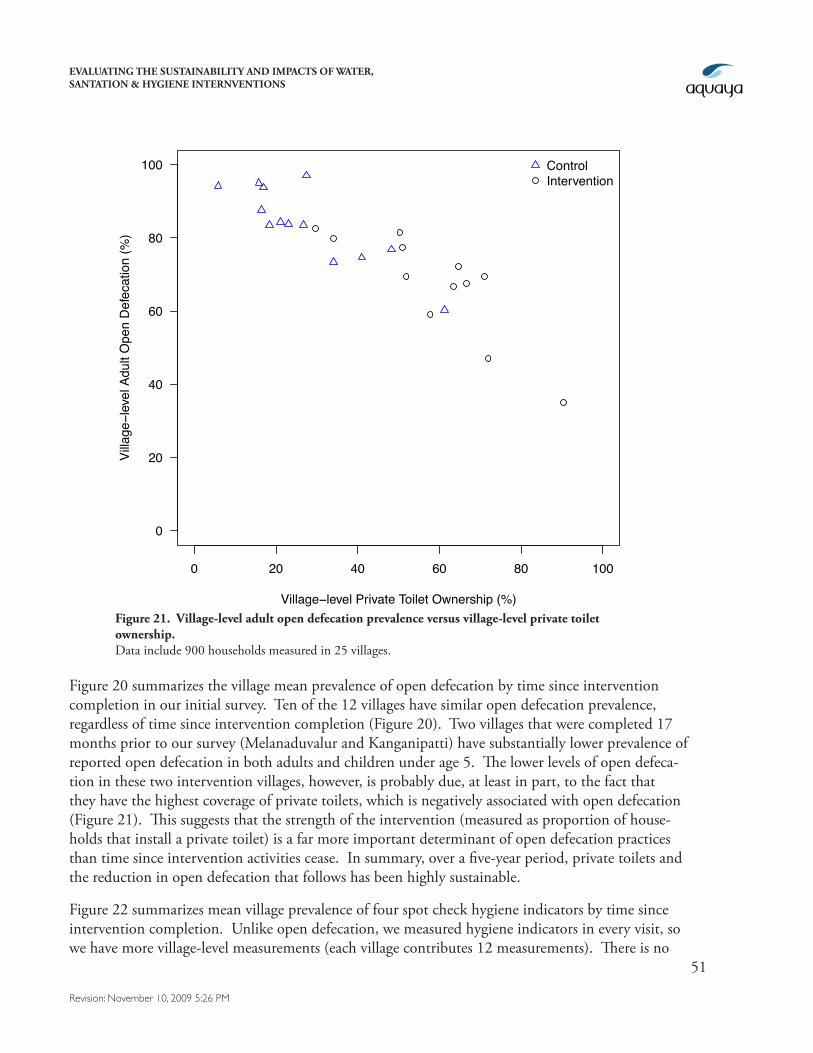
EVALUATING THE SUSTAINABILITY AND IMPACTS OF WATER, SANTATION & HYGIENE INTERNVENTIONS
51
Revision: November 10, 2009 5:26 PM
Figure 20 summarizes the village mean prevalence of open defecation by time since intervention completion in our initial survey. Ten of the 12 villages have similar open defecation prevalence, regardless of time since intervention completion (Figure 20). Two villages that were completed 17 months prior to our survey (Melanaduvalur and Kanganipatti) have substantially lower prevalence of reported open defecation in both adults and children under age 5. The lower levels of open defeca-tion in these two intervention villages, however, is probably due, at least in part, to the fact that they have the highest coverage of private toilets, which is negatively associated with open defecation (Figure 21). This suggests that the strength of the intervention (measured as proportion of house-holds that install a private toilet) is a far more important determinant of open defecation practices than time since intervention activities cease. In summary, over a five-year period, private toilets and the reduction in open defecation that follows has been highly sustainable.
Figure 22 summarizes mean village prevalence of four spot check hygiene indicators by time since intervention completion. Unlike open defecation, we measured hygiene indicators in every visit, so we have more village-level measurements (each village contributes 12 measurements). There is no
0 20 40 60 80 100
0
20
40
60
80
100
Village−level Private Toilet Ownership (%)
Villa
ge−l
evel
Adu
lt O
pen
Def
ecat
ion
(%)
ControlIntervention
Figure 21. Village-level adult open defecation prevalence versus village-level private toilet ownership. Data include 900 households measured in 25 villages.
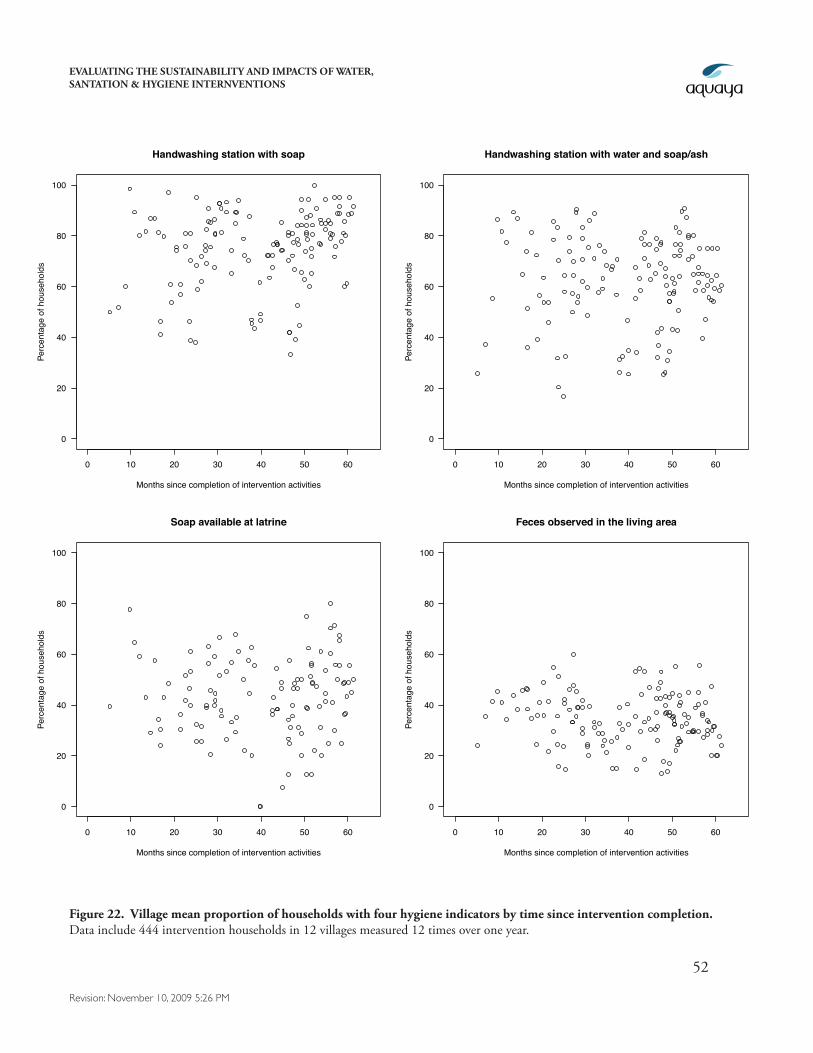
EVALUATING THE SUSTAINABILITY AND IMPACTS OF WATER, SANTATION & HYGIENE INTERNVENTIONS
52
Revision: November 10, 2009 5:26 PM
0 10 20 30 40 50 60
0
20
40
60
80
100
Handwashing station with soap
Months since completion of intervention activities
Perc
enta
ge o
f hou
seho
lds
0 10 20 30 40 50 60
0
20
40
60
80
100
Handwashing station with water and soap/ash
Months since completion of intervention activities
Perc
enta
ge o
f hou
seho
lds
0 10 20 30 40 50 60
0
20
40
60
80
100
Soap available at latrine
Months since completion of intervention activities
Perc
enta
ge o
f hou
seho
lds
0 10 20 30 40 50 60
0
20
40
60
80
100
Feces observed in the living area
Months since completion of intervention activities
Perc
enta
ge o
f hou
seho
lds
Figure 22. Village mean proportion of households with four hygiene indicators by time since intervention completion. Data include 444 intervention households in 12 villages measured 12 times over one year.
EVALUATING THE SUSTAINABILITY AND IMPACTS OF WATER, SANTATION & HYGIENE INTERNVENTIONS
53
Revision: November 10, 2009 5:26 PM
clear increase or decrease in any of these hygiene indicators with time since intervention completion, suggesting that the quality of hygiene behaviors that existed at the completion of the interventions have not regressed over time. This finding suggests that the current state of hygiene and handwash-ing behaviors that we reported earlier (Tables 7, 8, and 9) are likely representative of conditions in general immediately following the intervention.
5. Conclusions & Recommendations5.1. Critical Needs Assessments
Comprehensive water, sanitation, and hygiene interventions are generally motivated by multiple objectives, including better quality of life, improved opportunity for economic gain, and reductions in morbidity and mortality due to gastrointestinal illness. Our evaluations show that the WPI/Gramalaya programs in rural Tamil Nadu achieved some of these goals: private toilet construction was significantly enhanced in middle-income, lower-income and Scheduled caste populations, and private tap connections were also measurably increased. In addition, these infrastructure improve-ments are maintained over the current 5 year time horizon. The impacts of increased private toilets and household water connections are manifested in an increased sense of security among women and girls (private latrines) and in time saved in collecting water (private taps).
However, our evaluation cannot attribute improvements in gastrointestinal illness levels to the in-tervention programs because the disease burden among the populations targeted by WPI and Gra-malaya is very low. Furthermore, if this intervention were deployed in a population that had higher levels of gastrointestinal illness, we would expect the overall program benefits to be greater because non-health benefits would likely accrue in addition to illness reduction (assuming the intervention components have potential to improve health in high-burden populations). Consequently, careful assessments of baseline health and socio-economic indicators are required to target interventions to populations most in need.
Conversely, it is also important to ask if the sustained improvements in water and sanitation infra-structure that were reached by this intervention will be achieved among more impoverished popula-tions that might have greater disease burdens but are also preoccupied with basic subsistence. In the current intervention population, increases in private toilet construction were greatest among the 2nd wealth quintile, not the 1st (poorest) quintile. Whether there is a minimum economic standard that must be achieved before water, sanitation, and hygiene interventions can realize their full potential remains a compelling question.
5.2. Prospective Studies (randomized, if possible)
There are limitations to this evaluation: it was not randomized and relied on historic, secondary data to identify a comparable set of control communities. The main advantage of the quasi-experimental design used in this evaluation is that it allowed us to obtain information about longer-term impacts years faster than a prospective study. It also allowed the intervention to take place without the po-tential interference that can follow from scientific measurement (for example, asking questions about
EVALUATING THE SUSTAINABILITY AND IMPACTS OF WATER, SANTATION & HYGIENE INTERNVENTIONS
54
Revision: November 10, 2009 5:26 PM
open defecation may actually reinforce behavior change beyond the intervention itself ). However, we recommend that whenever possible, NGOs or a scientific partner measure their primary out-comes at baseline (before the intervention) in addition to follow-up, and include measurement in a set of control communities.
As we have illustrated in this study, the inclusion of a control group is essential to capture changes that would occur anyway in the absence of the intervention. Simple before-after comparisons (without a control group) will over-estimate the impact of an intervention when factors independent of the intervention also lead to improved outcomes over time. If it is infeasible to randomize the intervention to half of the potential intervention communities, then a useful alternative is a stepped wedge design (Hussey and Hughes 2007). In the stepped wedge design, the intervention is phased in to communities or groups of communities in a random order and outcomes are measured at each point that villages “cross-over” from control to intervention conditions.
5.3. Improving Behavior Change
In contrast to the sustained gains in water and sanitation infrastructure realized through the inter-vention programs, the methods employed to promote improved hygiene (i.e. handwashing with soap and indoor defecation) were not as effective: poor handwashing practices among primary caregivers for children under 5 are reported from both intervention and control villages, and water contamina-tion levels are higher in households than at the source, suggesting poor handling practices; in ad-dition, nearly 40% of adults and 52% of children under 5 in intervention households with private toilets practice daily open defecation.
Open defecation by children highlights the difficulty of safe feces disposal for young infants in this environment (often without the aid of diapers) even when toilets are available. Implementing orga-nizations may want to explore simple interventions to help caregivers with this daunting task, such as inexpensive, dedicated child potties (yet untested to our knowledge). However, further analy-sis is required to identify and implement more productive hygiene behavior change strategies for adults. Open defecation behaviors among adults may be particularly complex: agricultural workers will obviously find it more practical to defecate in fields during work periods; however, agricultural workers are not the only adults from households with private toilets who continue to practice open defecation in the study population, suggesting that there are additional social factors or traditions that promote this behavior.
Nevertheless, although private toilet ownership does not eliminate open defecation, it is strongly associated with reductions in open defecation and time since the intervention is not. The implica-tion is that the strength of the intervention (i.e. numbers of private toilets) and not the time since intervention) is a better predictor of open defecation practices in the intervention villages. This is an encouraging finding since it is easier to expand an existing intervention program that works relatively well than to completely reinvent an intervention program.
EVALUATING THE SUSTAINABILITY AND IMPACTS OF WATER, SANTATION & HYGIENE INTERNVENTIONS
55
Revision: November 10, 2009 5:26 PM
5.4. Addressing Child Growth
Somewhat surprising and troubling findings of this evaluation are that a majority of children under 5 in the study population are stunted (low height) and wasted (low weight) and that a significant fraction exhibits malnutrition. Child growth faltering is a serious health concern, causing about 20% of infant mortality and also associated with long-term cognitive deficiencies, diminished educational performance, and lower adult economic activity (Checkley et al. 2008). Previous studies have linked diarrhea with poor growth (Victora et al. 2008), however, low levels of gastrointestinal illness in the study population suggest that insufficient nourishment or subclinical infections by fecal bacteria (tropical enteropathy; Lunn 2000, Humphrey 2009) are the more likely causes of child growth falter-ing in the study population. The causal factors for poor child growth in this region and their impli-cations for both the implementation and evaluation of water, sanitation, and hygiene improvement programs bear further investigation.
EVALUATING THE SUSTAINABILITY AND IMPACTS OF WATER, SANTATION & HYGIENE INTERNVENTIONS
56
Revision: November 10, 2009 5:26 PM
6. ReferencesAiyer S. The State of the States: India’s Best and Worst States. India Today International. September 22, 2008, pp 12-42
Arney, H., Damodaran, S., Meckel, M., Barenberg, A. and White, G. Creating Access to Credit for Water and Sanitation: Women’s Self-Help Groups in India. Technical report, IRC Symposium: Sani-tation for the Urban Poor. Partnerships and Governance. 2008. URL: www.irc.nl/page/44897
Arnold, B., Arana, B., Mausezahl, D., Hubbard, A. and Colford, John M., J. Evaluation of a pre-existing, 3-year household water treatment and handwashing intervention in rural Guatemala, Int. J. Epidemiol. 2009, Advance Access DOI:10.1093/ije/dyp241.
Baqui, A. H., Black, R. E., Yunus, M., Hoque, A. R., Chowdhury, H. R. and Sack, R. B. Method-ological issues in diarrhoeal diseases epidemiology: definition of diarrhoeal episodes, Int J Epidemiol (20:4), 1991, pp. 1057--63.
Checkley W, Gilman RH, Epstein LD, Suarez M, Diaz JF, Cabrera L, et al. Asymptomatic and symptomatic cryptosporidiosis: Their acute effect on weight gain in Peruvian children. Am J Epide-miol. 1997;145(2):156–163.
Checkley W, Buckley G, Gilman RH, Assis AM, Guerrant RL, Morris SS, et al. Multi-country analy-sis of the effects of diarrhoea on childhood stunting. Int J Epidemiol. 2008; 37(4):816–30.
Checkley, W., Gilman, R. H., Black, R. E., Epstein, L. D., Cabrera, L., Sterling, C. R. and Moulton, L. H. Effect of water and sanitation on childhood health in a poor Peruvian peri-urban community, Lancet (363:9403), 2004, pp. 112--118.
Colford, J. M., J., Wade, T. J., Sandhu, S. K., Wright, C. C., Lee, S., Shaw, S., Fox, K., Burns, S., Benker, A., Brookhart, M. A., van der Laan, M. and Levy, D. A. A randomized, controlled trial of in-home drinking water intervention to reduce gastrointestinal illness, Am J Epidemiol (161:5), 2005, pp. 472--82.
Esrey, S. A., Habicht, J. P. and Casella, G. The complementary effect of latrines and increased water usage on the growth of infants in rural Lesotho, Am J Epidemiol (135:6), 1992, pp. 659--66.
Esrey, S. A. Water, waste, and well-being: a multicountry study, Am J Epidemiol (143:6), 1996, pp. 608--23.
Goldman, N., Vaughan, B. and Pebley, A. R. The use of calendars to measure child illness in health interview surveys, Int J Epidemiol (27:3), 1998, pp. 505--12.
Guerrant RL, Schorling JB, McAuliffe JF, de Souza MA. Diarrhea as a cause and an effect of malnu-trition: diarrhea prevents catch-up growth and malnutrition increases diarrhea frequency and dura-tion. Am J Trop Med Hyg. 1992; 47(1 Pt 2):28–-35.
EVALUATING THE SUSTAINABILITY AND IMPACTS OF WATER, SANTATION & HYGIENE INTERNVENTIONS
57
Revision: November 10, 2009 5:26 PM
Houweling TA, Kunst AE, Mackenbach JP. Measuring health inequality among children in devel-oping countries: does the choice of the indicator of economic status matter? Int J Equity Health. 2003;2(1):8.
Humphrey JA. Child undernutrition, tropical enteropathy, toilets, and handwashing. Lancet (374,9694), 2009; pp 1032—1035.
Hussey, M. A. & Hughes, J. P. Design and analysis of stepped wedge cluster randomized trials. Con-temp Clin Trials, 2007. (28):182-91
Leclerc, H, Mossel, D.A.A., Edberg, S.C., and Struijk, C.B. Advances in the Bacteriology of the Coliform Group: Their Suitability as Markers of Microbial Water Safety. Annual Review of Microbi-ology (55), 2001, pp. 201-34
Lunn, P. G. The impact of infection and nutrition on gut function and growth in childhood. Pro-ceedings of the Nutrition Society, 2000; 59(1): 147-154
Manja KS., Maurya MS., and Rao KM. A simple field test for the detection of faecal pollution in drinking water. Bulletin of the World Health Organization, (60,5), 182, pp 797--801
Mates, A. and Shaffer M. Membrane Filtration Differentiation of E. coli from coliforms in the Ex-amination of Water. Journal of Applied Microbiology (67), 1989, pp. 343--346
ORC-Macro. Demographic and Health Survey Interviewer’s Manual. MEASURE DHS Basic Docu-mentation No. 2, ORC Macro, 2006.
Pattanayak, S. K., Poulos, C., Yang, J. C., Patil, S. R. and Wendland, K. J. Of taps and toilets: quasi-experimental protocol for evaluating community-demand-driven projects, J Water Health (7:3), 2009, pp. 434-51.
Rosenbaum, P. R. and Rubin, D. B. The central role of the propensity score in observational studies for causal effects, Biometrika (70:1), 1983, pp. 41--55.
Rubin, D. B. The design versus the analysis of observational studies for causal effects: parallels with the design of randomized trials, Stat Med (26:1), 2007, pp. 20--36.
Sobsey, MD, and Pfaender, FK. Evaluation of the H2S method for detection of fecal contamination of drinking water. World Health Organization, Geneva, 2003.
van der Laan, M. and Rubin, D. Targeted maximum likelihood learning, Int J Biostatistics, (2) 2006, pp. 1-38
Victora CG, Adair L, Fall C, et al. Maternal and child undernutrition 2: Maternal and child under-nutrition: consequences for adult health and human capital. Lancet, (371), 2008, pp. 340--357
Vyas S, Kumaranayake L. Constructing socio-economic status indices: how to use principal compo-nents analysis. Health Policy Plan. 2006;21(6):459–68.
EVALUATING THE SUSTAINABILITY AND IMPACTS OF WATER, SANTATION & HYGIENE INTERNVENTIONS
58
Revision: November 10, 2009 5:26 PM