Embed Size (px)
DESCRIPTION
Halûk Özkaynak US EPA, Office of Research and Development National Exposure Research Laboratory, RTP, NC Presented at the CMAS Special Symposium on Air Quality October 13, 2010. Evaluating the Uncertainty of Land-Use Regression Models. Land-Use Regression (LUR) Models. - PowerPoint PPT Presentation
Citation preview
Halûk Özkaynak US EPA, Office of Research and Development
National Exposure Research Laboratory, RTP, NC
Presented at the CMAS Special Symposium on Air Quality
October 13, 2010
Evaluating the Uncertainty of Land-Use Regression Models
2
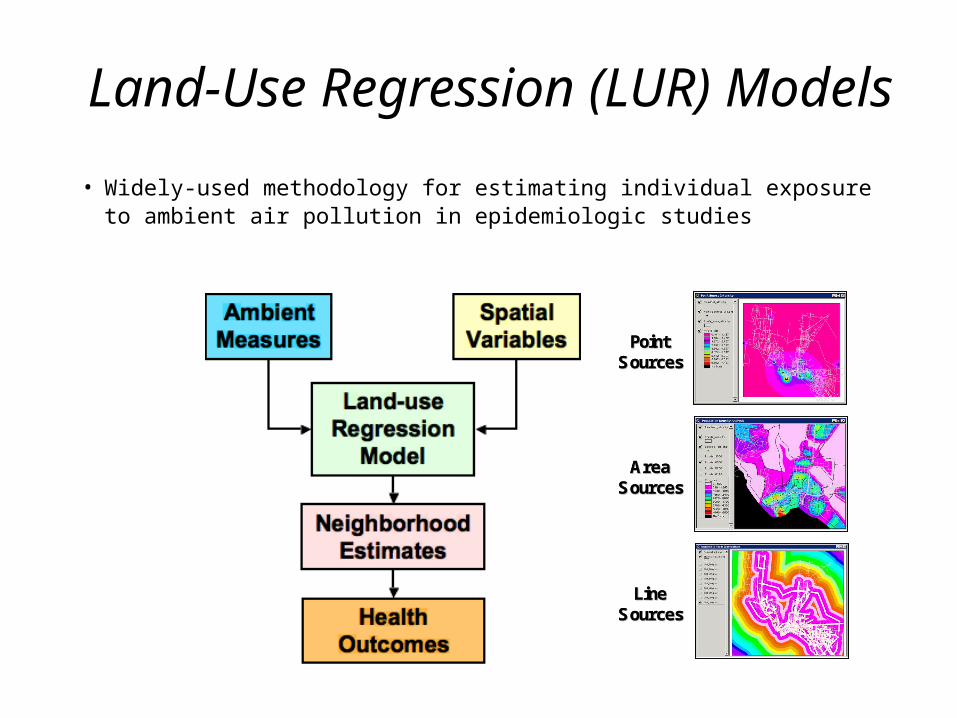
Land-Use Regression (LUR) Models
PointPointSourcesSources
LineLineSourcesSources
AreaAreaSourcesSources
PointPointSourcesSources
LineLineSourcesSources
AreaAreaSourcesSources
• Widely-used methodology for estimating individual exposure to ambient air pollution in epidemiologic studies
3
• Able to capture smaller-scale variability in community health studies
• Less resource intensive – – Easier to develop and apply compared with
other methods for measuring or estimating subject-specific values (e.g., household measurements, physical modelling)
• Land-use data widely available
LUR Strengths
4
• Inputs– Require accurate monitoring data at large number of sites - e.g., in
highly industrialized urban areas with many types of emission sources
• Application in health studies– Not transferable from one urban area to another– Do not address multi-pollutant aspects of air pollution – Lack the fine-scale temporal resolution needed for estimating short-
term exposure to air pollution– Often estimate ambient air pollution only versus indoor and
personal• Lack the ability to connect specific sources of emissions to
concentrations for developing pollution mitigation strategies
LUR Limitations
5
• Use air pollution predicted by coupled regional (CMAQ) and local (AERMOD) scale air-quality models
• Develop and evaluate land-use regression models for:– Benzene– Nitrogen oxides (NOx)– Particulate matter (PM2.5)
• Examine (in future) the implications of alternate LUR development strategies on model efficacy for multiple pollutants
Analysis Goals: New Haven Case Study*
Source: Johnson, M., Isakov, V., Touma, J.S., Mukerjee, S., and Özkaynak, H. (2010). Evaluation of Land Use Regression Models Used to Predict Air Quality Concentrations in an Urban Area. Atmospheric Environment, Vol. 44, pp: 3660-3668.
6
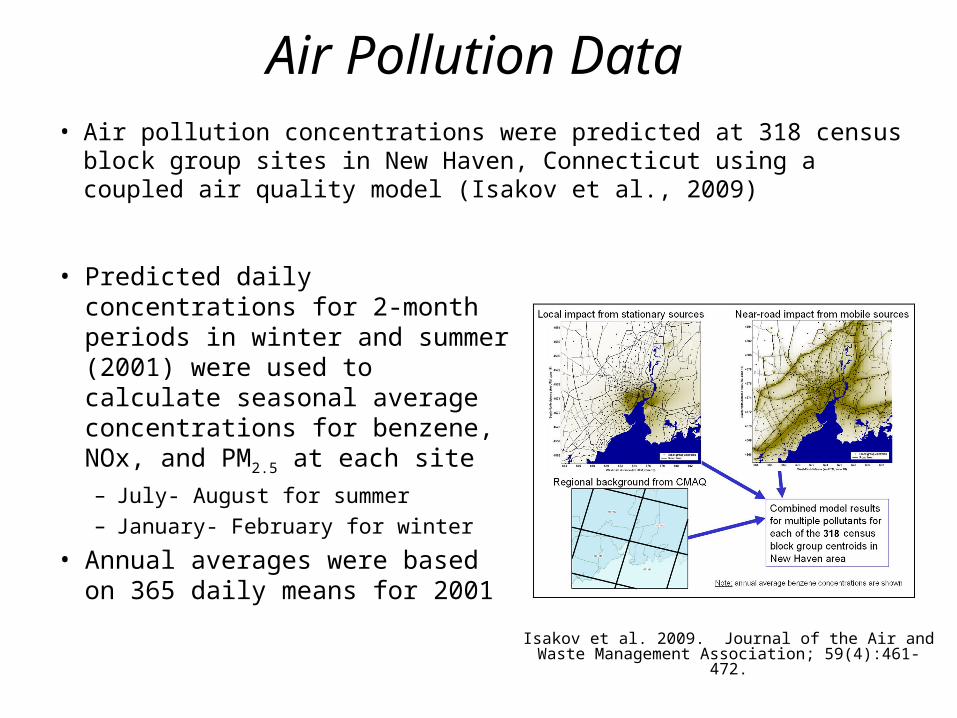
• Air pollution concentrations were predicted at 318 census block group sites in New Haven, Connecticut using a coupled air quality model (Isakov et al., 2009)
Isakov et al. 2009. Journal of the Air and Waste Management Association; 59(4):461-472.
• Predicted daily concentrations for 2-month periods in winter and summer (2001) were used to calculate seasonal average concentrations for benzene, NOx, and PM2.5 at each site– July- August for summer
– January- February for winter
• Annual averages were based on 365 daily means for 2001
Air Pollution Data
7
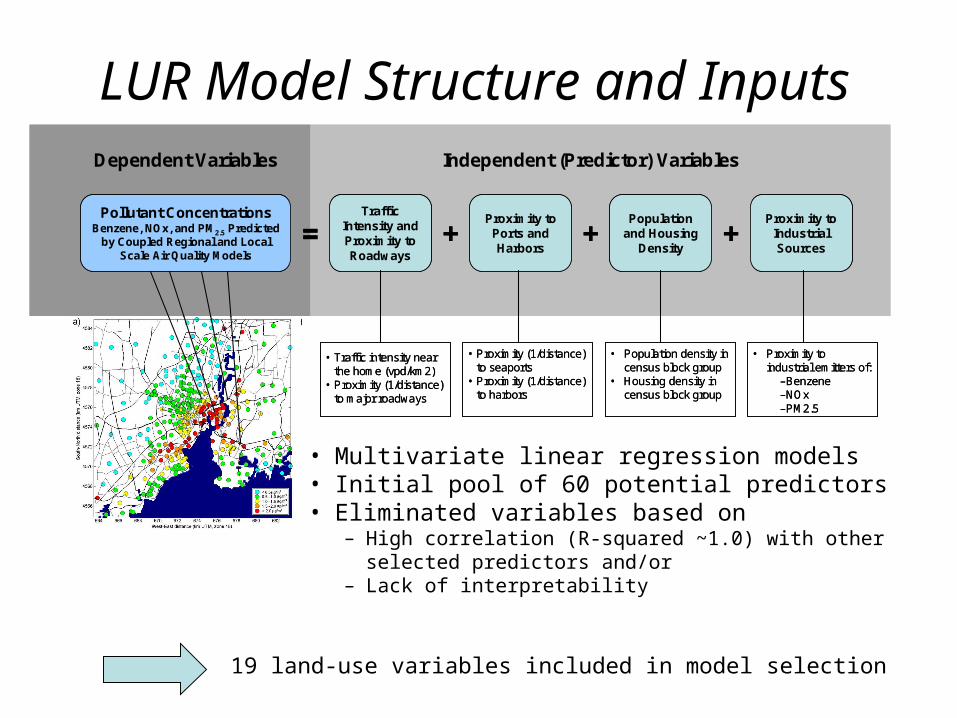
Dependent Variables Independent (Predictor) Variables
Pollutant ConcentrationsBenzene, NOx, and PM2.5 Predicted
by Coupled Regional and Local Scale Air Quality Models
=Traffic
Intensity andProximity to Roadways
Proximity to Industrial Sources
Proximity to Ports and Harbors
Population and Housing
Density+ + +
Pollutant ConcentrationsBenzene, NOx, and PM2.5 Predicted
by Coupled Regional and Local Scale Air Quality Models
=Traffic
Intensity andProximity to Roadways
Proximity to Industrial Sources
Proximity to Ports and Harbors
Population and Housing
Density+ + +
• Traffic intensity near the home (vpd/km2)
• Proximity (1/distance) to major roadways
• Proximity (1/distance) to seaports
• Proximity (1/distance) to harbors
• Population density in census block group
• Housing density in census block group
• Proximity to industrial emitters of:
–Benzene–NOx–PM2.5
• Multivariate linear regression models• Initial pool of 60 potential predictors • Eliminated variables based on
– High correlation (R-squared ~1.0) with other selected predictors and/or
– Lack of interpretability
LUR Model Structure and Inputs
19 land-use variables included in model selection
8
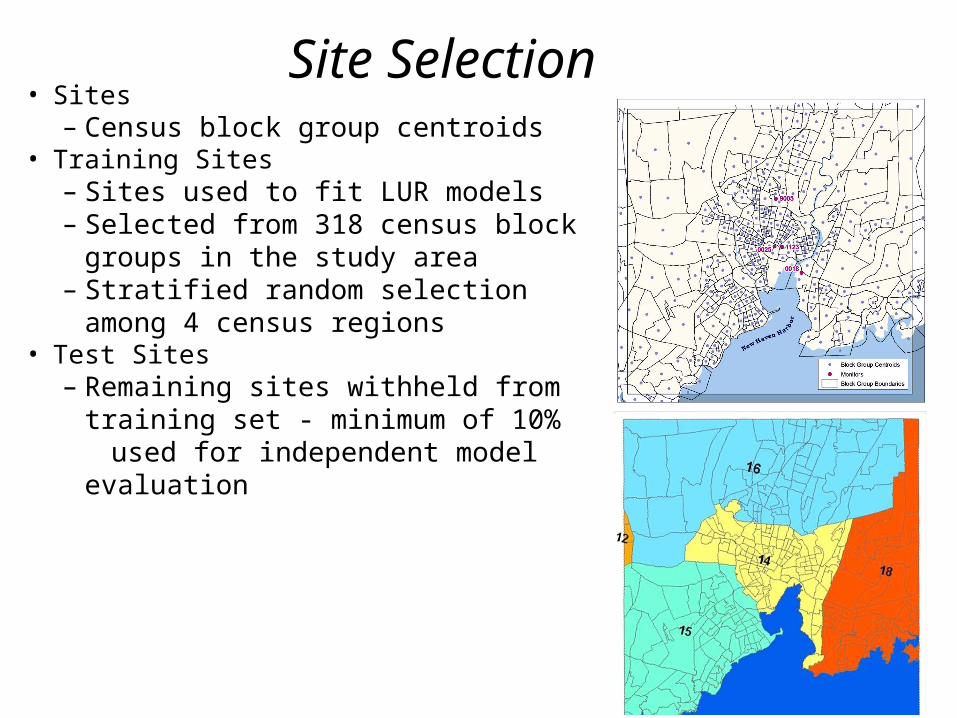
• Sites– Census block group centroids
• Training Sites– Sites used to fit LUR models– Selected from 318 census block
groups in the study area– Stratified random selection among 4
census regions• Test Sites
– Remaining sites withheld from training set - minimum of 10%
used for independent model evaluation
Site Selection
9
• Variable selection– Examined correlation structure for predictive variables
• Model development– All subsets with 3-7 independent predictors– Model selection based on AIC, Mallow’s C(p), adjusted r-squared, and variance
inflation factor• Model evaluation
– Cross-validation within training dataset– Hold-out evaluation within test dataset
• Models for multiple pollutants and training sites– Benzene, NOx, PM2.5– 25, 50, 75, 100, 125, 150, 200, and 285
• Automated, iterative process– Site selection -> model development– Repeated 100x for each pollutant and number of training sites
Model Development and Evaluation
10
0
0.1
0.2
0.3
0.4
0.5
0.6
0.7
0.8
0.9
1
1.1
0 25 50 75 100 125 150 175 200 225 250 275 300
Number of Sites in Training Dataset
Pro
po
rtio
n o
f V
aria
nce
Exp
lain
ed (
R2)
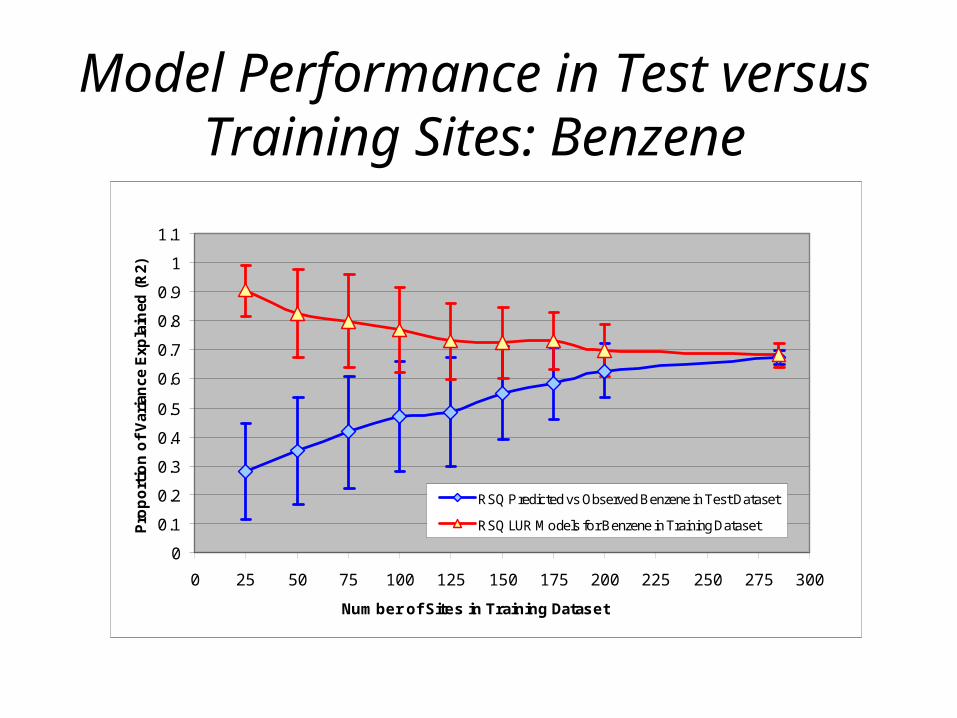
RSQ Predicted vs Observed Benzene in Test Dataset
RSQ LUR Models for Benzene in Training Dataset
Model Performance in Test versus Training Sites: Benzene
11
0.0
0.1
0.2
0.3
0.4
0.5
0.6
0.7
0.8
0.9
1.0
1.1
0 25 50 75 100 125 150 175 200 225 250 275 300
Number of Sites in Training Dataset
Pro
po
rtio
n o
f V
aria
nce
Exp
lain
ed (
R2)
RSQ Predicted vs Observed NOx in Test Dataset
RSQ LUR Models for NOx in Training Dataset
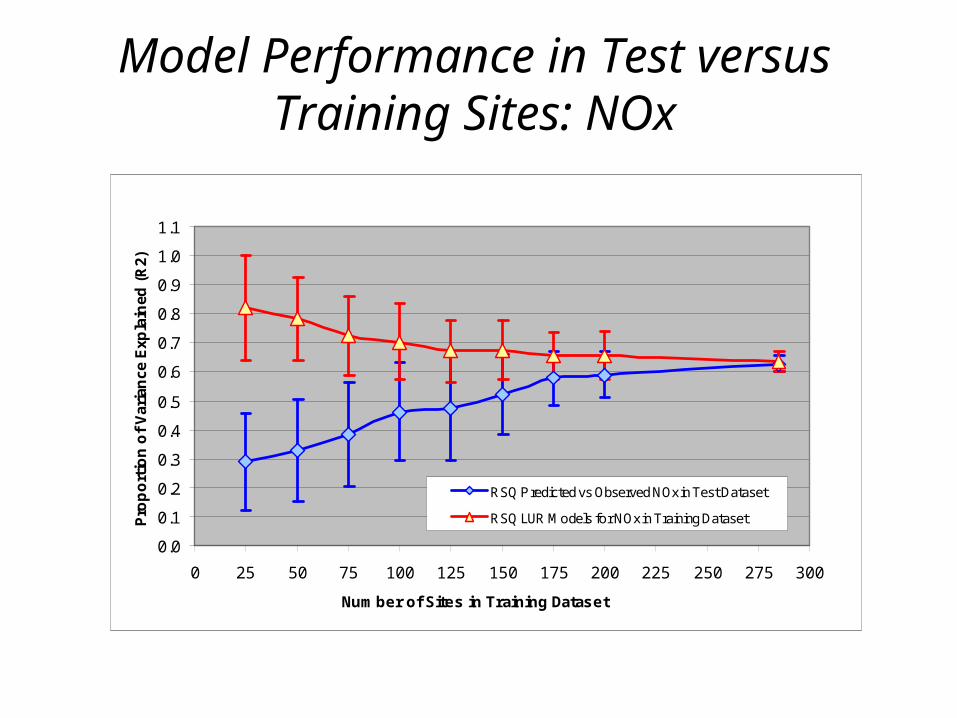
Model Performance in Test versus Training Sites: NOx
12
0
0.1
0.2
0.3
0.4
0.5
0.6
0.7
0.8
0.9
1
1.1
0 25 50 75 100 125 150 175 200 225 250 275 300
Number of Sites in Training Dataset
Pro
po
rtio
n o
f V
aria
nce
Exp
lain
ed (
R2)
RSQ Predicted vs Observed PM2.5 in Test Dataset
RSQ LUR Models for PM2.5 in Training Dataset
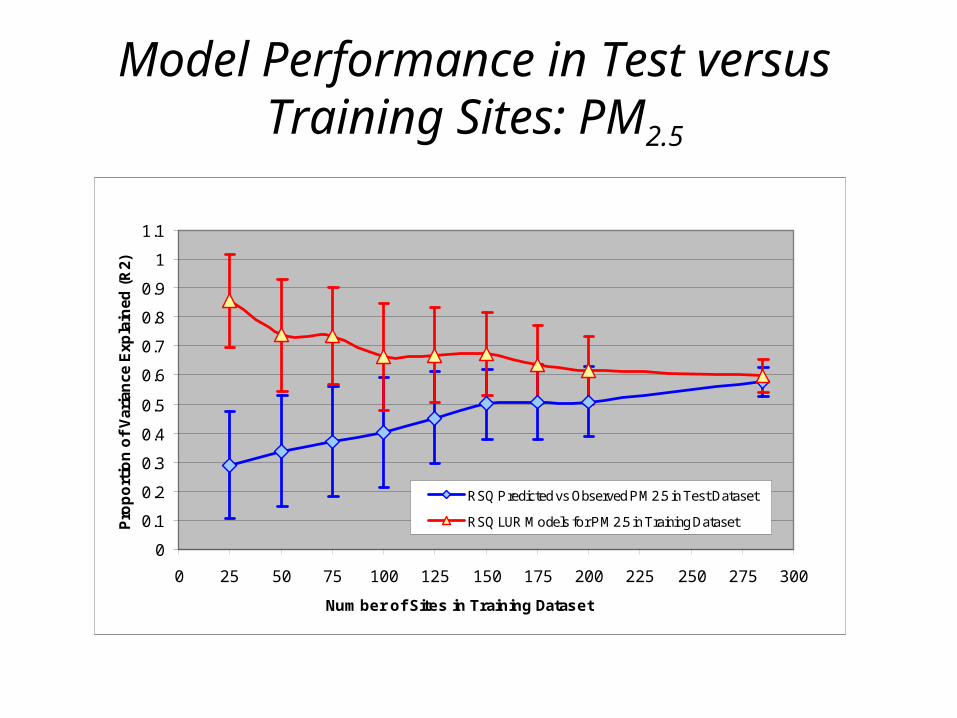
Model Performance in Test versus Training Sites: PM2.5
13
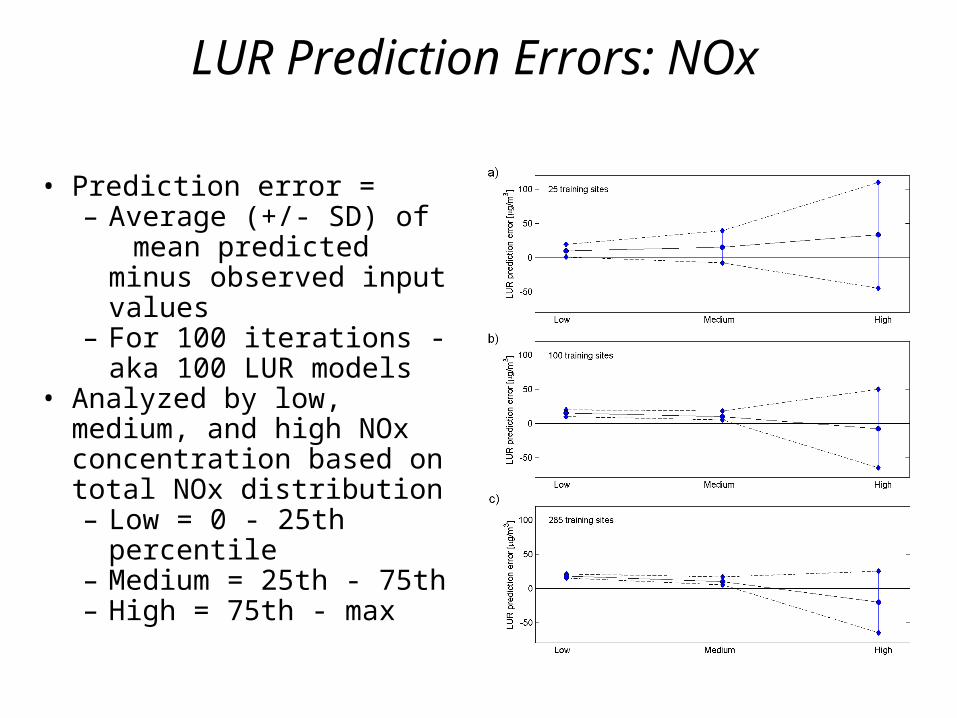
LUR Prediction Errors: NOx
• Prediction error =– Average (+/- SD) of mean predicted minus
observed input values – For 100 iterations - aka
100 LUR models• Analyzed by low, medium,
and high NOx concentration based on total NOx distribution– Low = 0 - 25th percentile– Medium = 25th - 75th – High = 75th - max
)F
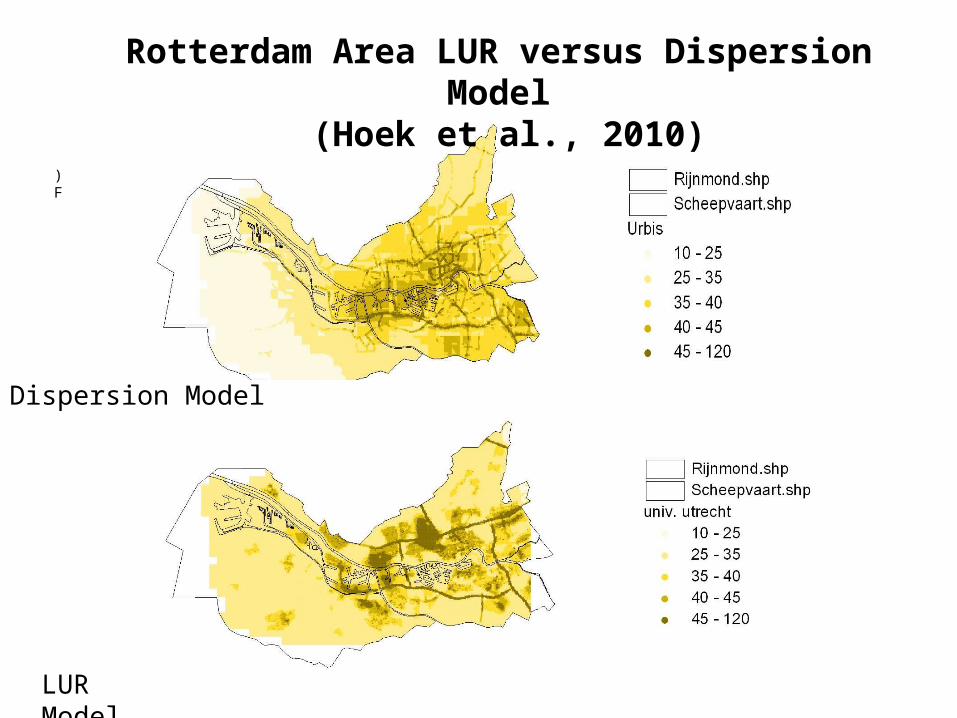
Rotterdam Area LUR versus Dispersion Model (Hoek et al., 2010)
Dispersion Model
LUR Model
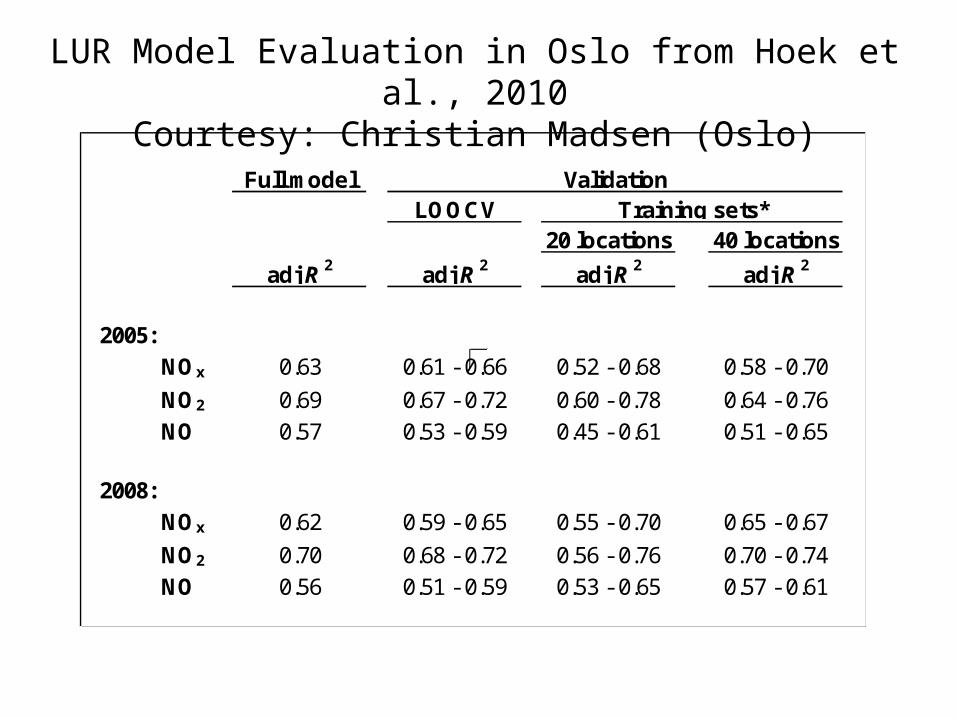
F ull modelL O O C V
20 loc ations 40 loc ations
adj R 2 adj R 2 adj R 2 adj R 2
2005:NO x 0.63 0.61 - 0.66 0.52 - 0.68 0.58 - 0.70NO 2 0.69 0.67 - 0.72 0.60 - 0.78 0.64 - 0.76NO 0.57 0.53 - 0.59 0.45 - 0.61 0.51 - 0.65
2008:NO x 0.62 0.59 - 0.65 0.55 - 0.70 0.65 - 0.67NO 2 0.70 0.68 - 0.72 0.56 - 0.76 0.70 - 0.74NO 0.56 0.51 - 0.59 0.53 - 0.65 0.57 - 0.61
ValidationT raining s ets *
LUR Model Evaluation in Oslo from Hoek et al., 2010Courtesy: Christian Madsen (Oslo)
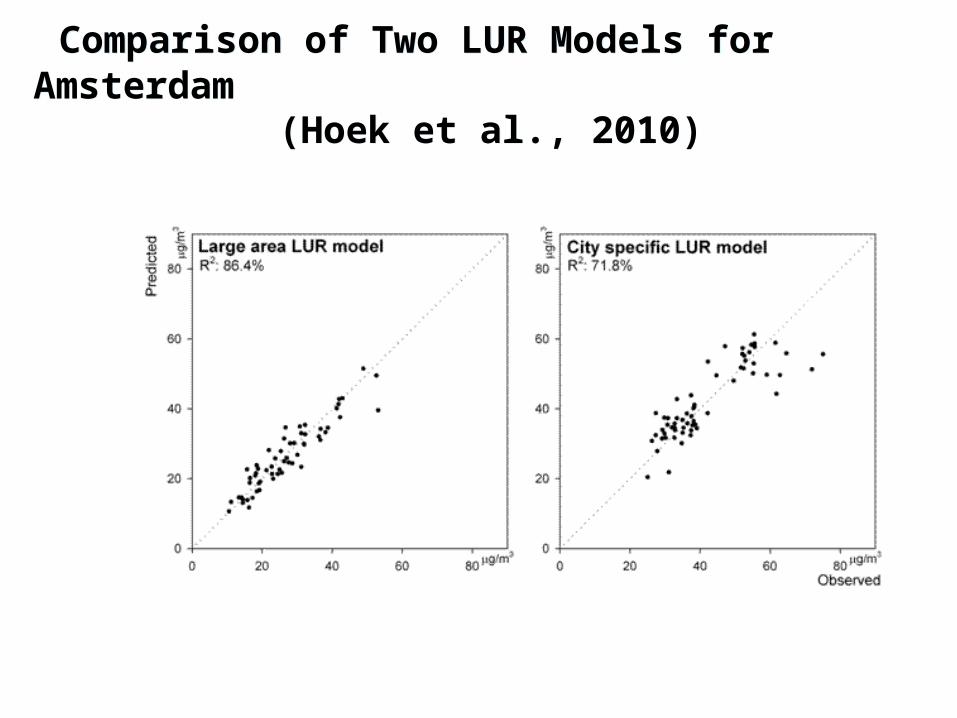
Comparison of Two LUR Models for Amsterdam(Hoek et al., 2010)
Comparison of Two LUR Models for Amsterdam(Hoek et al., 2010)
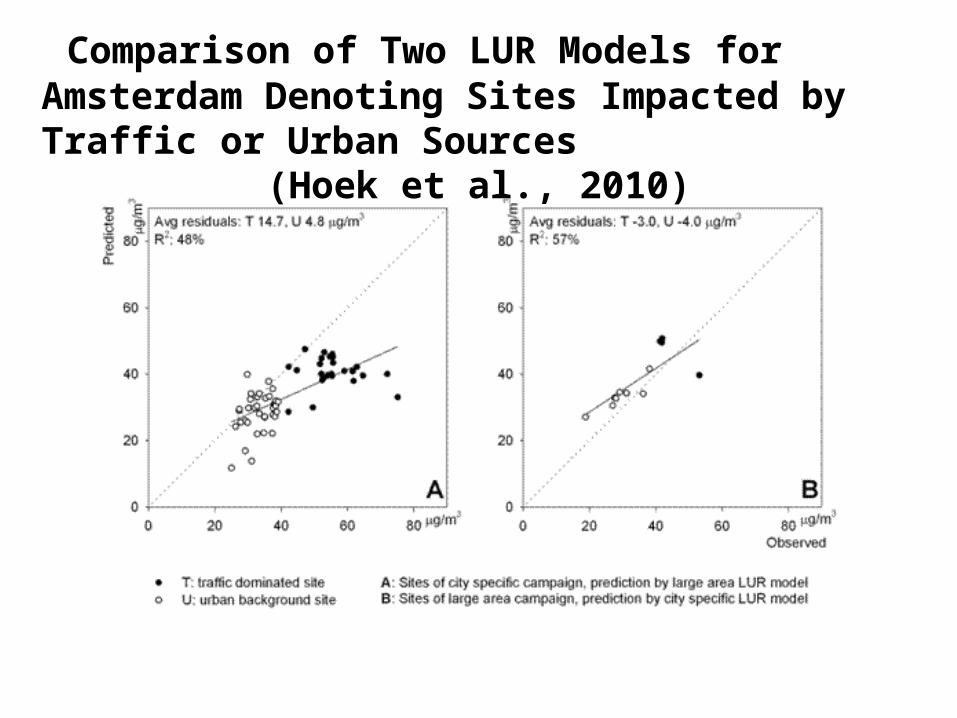
Comparison of Two LUR Models for Amsterdam Denoting Sites Impacted by Traffic or Urban Sources
(Hoek et al., 2010)
18
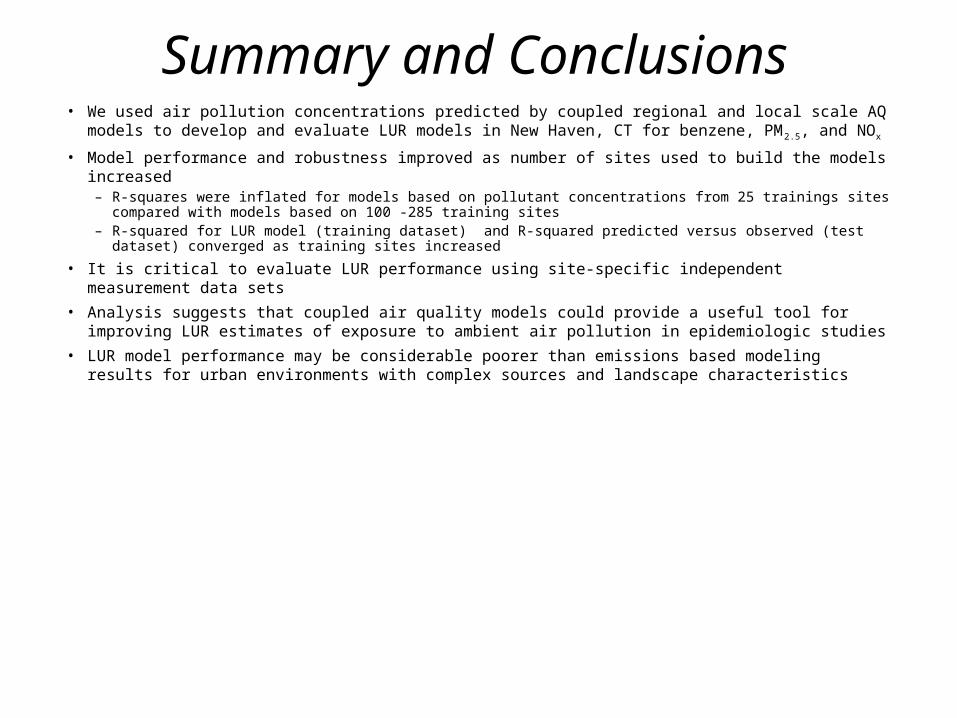
Summary and Conclusions• We used air pollution concentrations predicted by coupled regional and local scale AQ models to
develop and evaluate LUR models in New Haven, CT for benzene, PM2.5, and NOx
• Model performance and robustness improved as number of sites used to build the models increased– R-squares were inflated for models based on pollutant concentrations from 25 trainings sites compared
with models based on 100 -285 training sites– R-squared for LUR model (training dataset) and R-squared predicted versus observed (test dataset)
converged as training sites increased
• It is critical to evaluate LUR performance using site-specific independent measurement data sets
• Analysis suggests that coupled air quality models could provide a useful tool for improving LUR estimates of exposure to ambient air pollution in epidemiologic studies
• LUR model performance may be considerable poorer than emissions based modeling results for urban environments with complex sources and landscape characteristics
19
• Markey Johnson• Vlad Isakov• Joe Touma• Shaibal Mukerjee• Luther Smith (Alion Incorporated)• Ellen Kinnee (Computer Science Corporation)
Acknowledgements*
*Although this work was reviewed by EPA and approved for publication, it may not necessarily reflect official Agency policy

20
Additional Slides
21
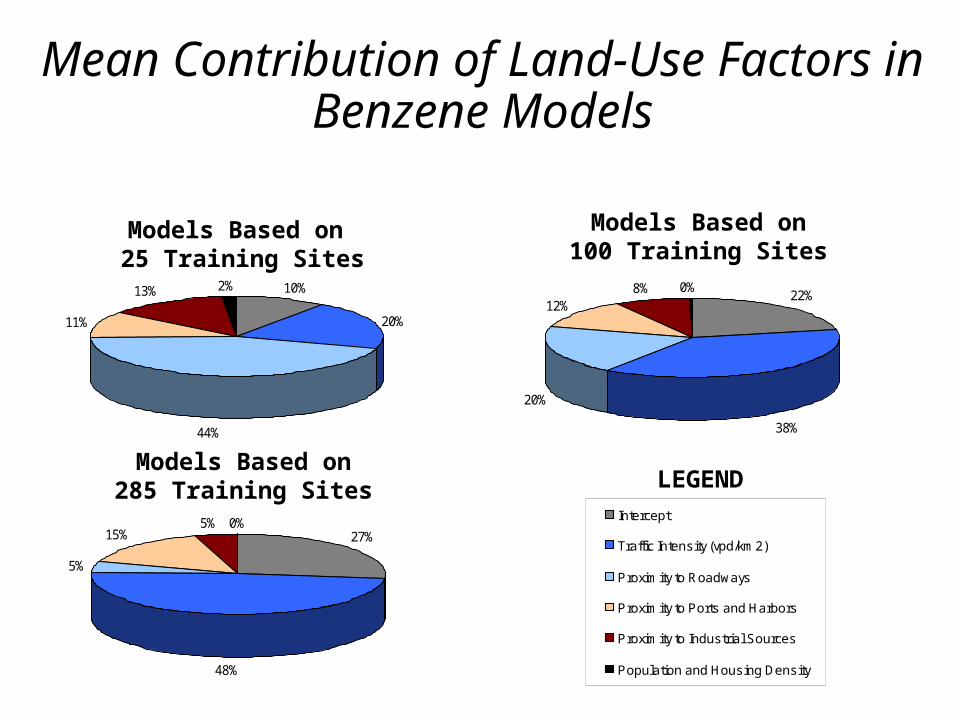
Mean Contribution of Land-Use Factors in Benzene Models
10%
20%
44%
11%
13% 2%
Models Based on 25 Training Sites
27%
48%
5%
15%5% 0%
Models Based on285 Training Sites
22%
38%
20%
12%8% 0%
Models Based on100 Training Sites
Intercept
Traffic Intensity (vpd/km2)
Proximity to Roadways
Proximity to Ports and Harbors
Proximity to Industrial Sources
Population and Housing Density
LEGEND
22
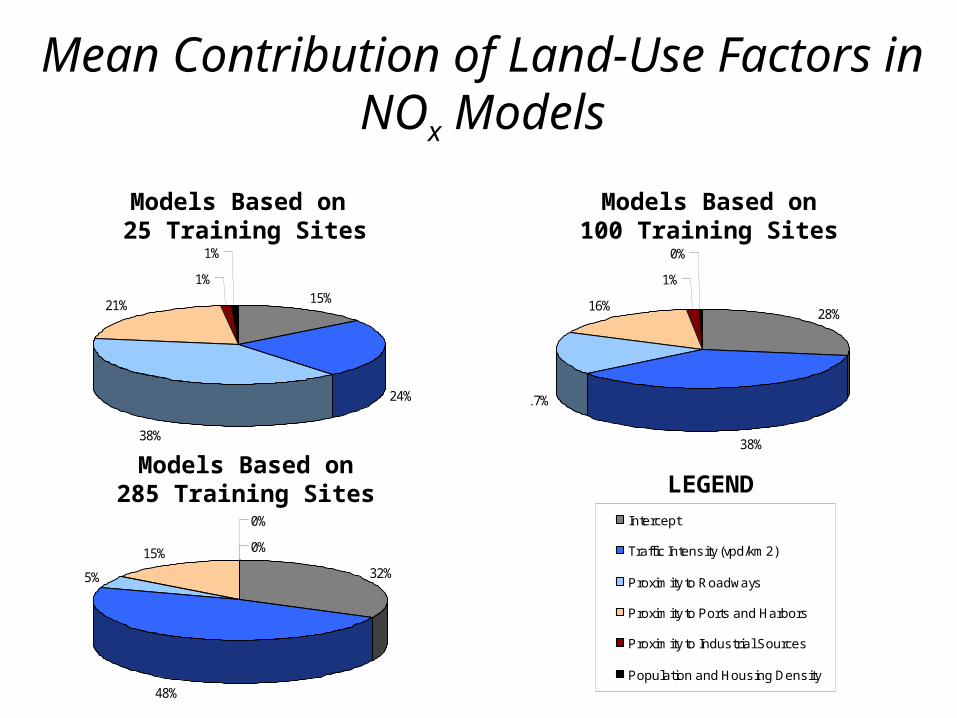
15%
24%
38%
21%
1%
1%
32%
48%
5%
15%
0%
0%
Models Based on 25 Training Sites
Models Based on285 Training Sites
28%
38%
17%
16%
1%
0%
Models Based on100 Training Sites
Intercept
Traffic Intensity (vpd/km2)
Proximity to Roadways
Proximity to Ports and Harbors
Proximity to Industrial Sources
Population and Housing Density
LEGEND
Mean Contribution of Land-Use Factors in NOx Models
23
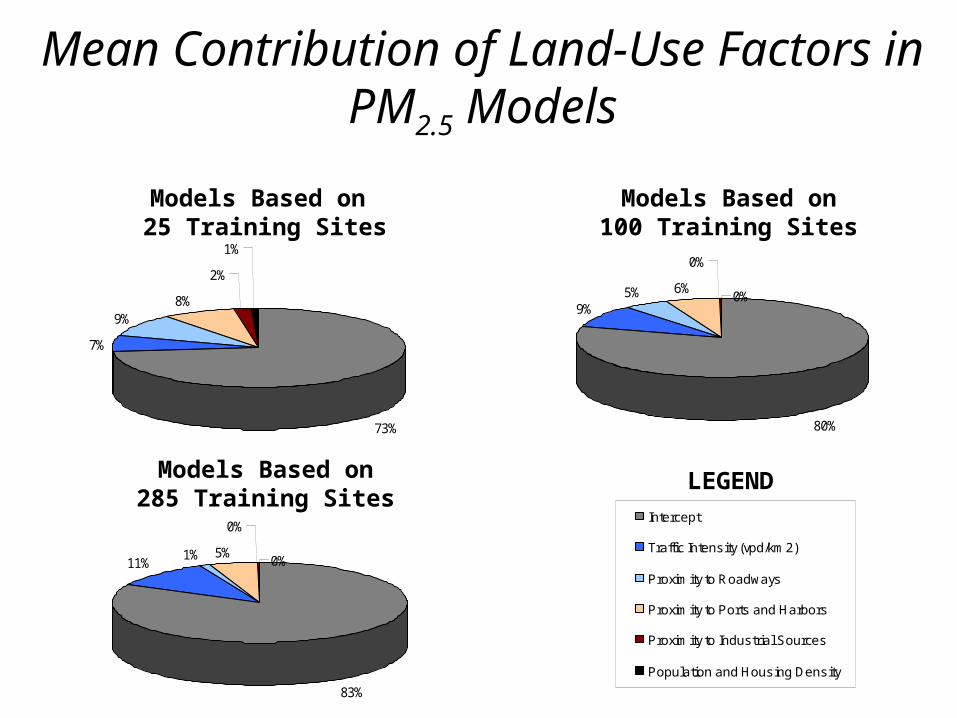
80%
9%5% 6%
0%
0%
73%
7%
9%8%
2%
1%
83%
11%1% 5%
0%
0%
Models Based on 25 Training Sites
Models Based on285 Training Sites
Models Based on100 Training Sites
Intercept
Traffic Intensity (vpd/km2)
Proximity to Roadways
Proximity to Ports and Harbors
Proximity to Industrial Sources
Population and Housing Density
LEGEND
Mean Contribution of Land-Use Factors in PM2.5 Models