Embed Size (px)
Citation preview

’ LA-UR- a
Title:
Author@):
Submitfed to:
EVALUATING UNCERTAINTY IN SIMULATION MODELS
Michael D. McKay, TSA-1 Richard J. Beckman, TSA-1 John D. Morrison, TSA-5 Stephen C. Upton, TSA-5
Predictability: Quantifying Uncertainty in Models
Center for Nonlinear Studies 18th Annual International Conference Los Alamos, NM 87545 May 11-14, 1998
of Complex Phenomena
m4s ~~~~~~~~~~ IS
. -~ ._. Los Alamos National Laboratory, an affirmative action/equal opportunity employer, is operated by the University of California for the U.S. Department of Energy under contract W-7405-ENG-36. By acceptance of this article, the publisher recognizes that the US. Government retains a nonexclusive, royalty-free license to publish or reproduce the published form of this contnbution, or to allow others to do so, for U.S. Government purposes. The Los Alarnos National Laboratory requests that the publisher identtfy this article as work performed under the auspices of the US. Department of Energy.
Form No. 836 A5 ST2629 1OF91

. '
DECLAIMER
This report was prepared as an account of work sponsored by an agency of the United States Government. Neither the United States Government nor any agency thereof, nor any of their employees, makes any warranty, express or implied, or assumes any legal liability or responsibility for the accuracy, completeness, or use- fulness of any information, apparatus, product, or process dmlosed, or represents that its usc would not infringe privately owned rights. Reference hmin to any spe- cific commercial product, process, or service by trade name, trademark, manufac- turer, or otherwise does not necessarily constitute or imply its endorsement, mom- mendrtion, or favoring by the United States Gomnment or any agency thereof. The views and opinions of authors expressed herein do not necessarily state or reflect those of the United States Government or any agency thereof.

DISCLAIMER
Portions of this document may be illegible in electronic image products. Images are produced from the best available original document.
LA-TJR-98- . . .
Predictability: Quantifying Uncertainty in Models of Complex Phenomena
Los Alamos, New Mexico, May 11-14, 1998 . Center for Nonlinear Studies, Los Alamos National Laboratory, 18th Annual Internatid Conference
Evaluating Uncertainty in Simulation Models* Michael D. McKay, Richard J. Beckman, John D. Morrison, Stephen C. Upton
Los Alamos National Laboratory Los Alamos, New Mexico 87545-0600 USA
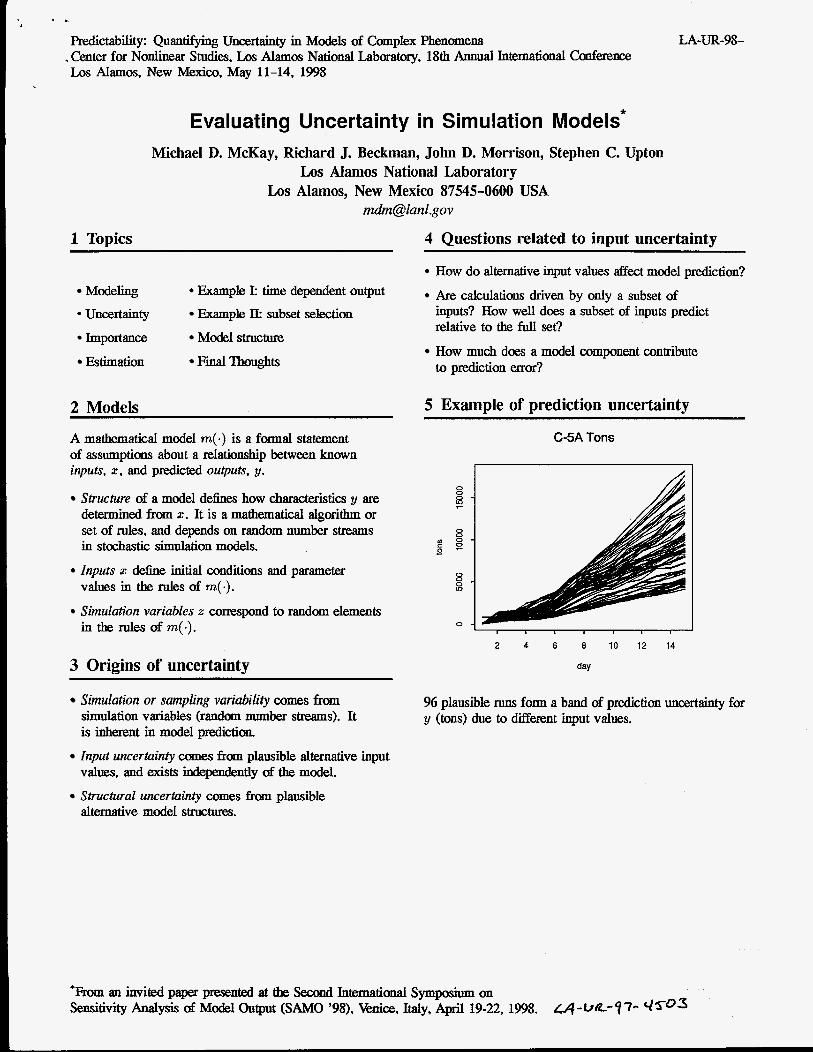
1 Topics 4 Questions related to input uncertainty
Modeling
hportance
Estimation
* Uncertainty
Example I time dependent output Example E subset selection
Model structure
Final Thoughts
2 Models
A mathematical model m(-) is a formal statement of assumptions about a relationship between known inputs, x, and predicted outputs, y.
Structure of a model defines how charackristics y are determined from x. It is a mathematical algorithm or set of rules, and depends on random number streams in stochastic simulation models.
inputs x define initial conditions and parameter
Simulatwn variables z c<nrespond to random elements
values in the rules of rn(.).
in the rules of m(.) .
3 Origins of uncertainty
Simulation or sampling variability comes from simulation variables (random number streams). It is inherent in model prediction.
values, and exists independently of the model.
alternative model structures.
Input uncertainty comes from plausible alternative input
Structural uncertainty comes from plausible
How do alternative input values affect model prediction?
Are calculations driven by only a subset of inputs? How well does a subset of inputs predict relative to the full set?
to prediction error? How much does a model component contribute
5 Example of prediction uncertainty
C-SA Tons
, I I I
2 4 6 8 10 12 14
96 plausible runs form a band of prediction uncertainty for y (tons) due to dif€mnt input values.
*From an invited paper presented at the Second International Symposium on Sensitivity Analysis of Model Output (SAM0 '98), Wee, Italy, April 19-22.1998. L4-0e-77n q5O3
. I
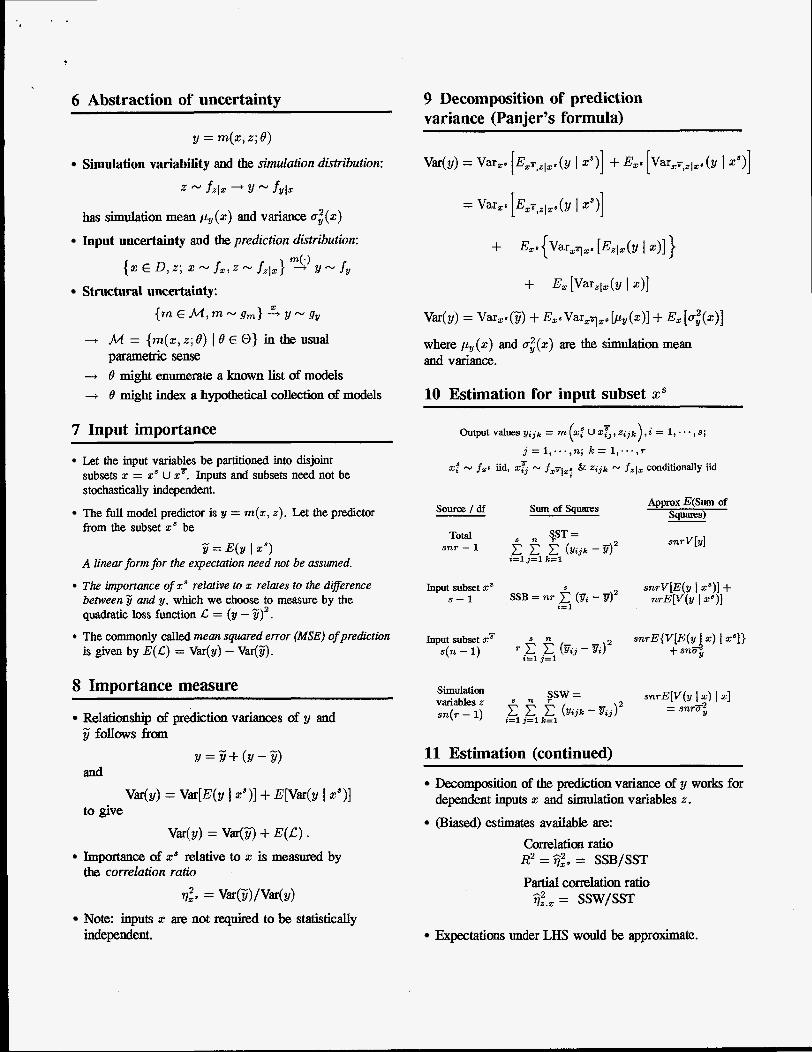
6 Abstraction of uncertainty
y = m(2, z ; e ) Simulation variability and the simulation distribution:
z f.1. + Y - fy lx
has simulation mean py (z) and variance a$ (z)
Input uncertainty and the prediction distribution:
{ 2 € D, z ; 2 f., z - f+} 5) Y f y
Structural uncertainty: ( m E M , m - sm} 4 Y - Qy
+ M = { m ( z , z ; 6 ) ~ 6 E O } ~ t h e ~ ~ ~ a l parametric sense
--+ 6 might enumerate a known list of models + 0 might index a hypothetical collection of models
7 Input importance
Let the input variables be partitioned into disjoint subsets x = xs u x?. Inputs and subsets need not be stochastically independent.
from the subset x S be
A linear form for the expectation need not be assumed.
The full mode1 predictor is y = a ( x , 2). Let the predictor
- SI = E ( Y I XS)
T k importance of xs rehive to x relates to the difference between 5 and y, which we choose to measure by the quadratic loss function c = (y - %I2.
is given by E(C) = Var(y) - Var(9. The commonly called mean squared error (MSE) of prediction
8 Importance measure
Relationship of prediction variances of y and y follows from
Y = 5 + ( Y - 5 )
Var(Y) = Var[E(Y 1 271 + E[WY I zS)l
Var(Y) = Var(3 + E ( L ) .
and
to give
Importance of xs relative to z is measured by the correlation ratio
2. = Var(WVar(Y) Note: inputs z are not requjred to be statistically independent.
9 Decomposition of prediction variance (Panier's formula)
souroe / df
Total s n r - 1
sum of squares
S,ST = 5 .? c ( Y i j k -TI2 i = l 3 = 1 k = l
Approx &Sum of Squares)
11 Estimation (continued)
D e c ~ i t i o n of the prediction variance of y work for dependent inputs 2: and simulation variables z . (Biased) estimates available are:
Correlation ratio R2 = $$ = SSB/SST Partial correlaton ratio
A2 7jz.x = ssw/ssT
Expectations under LHS would be approximate.
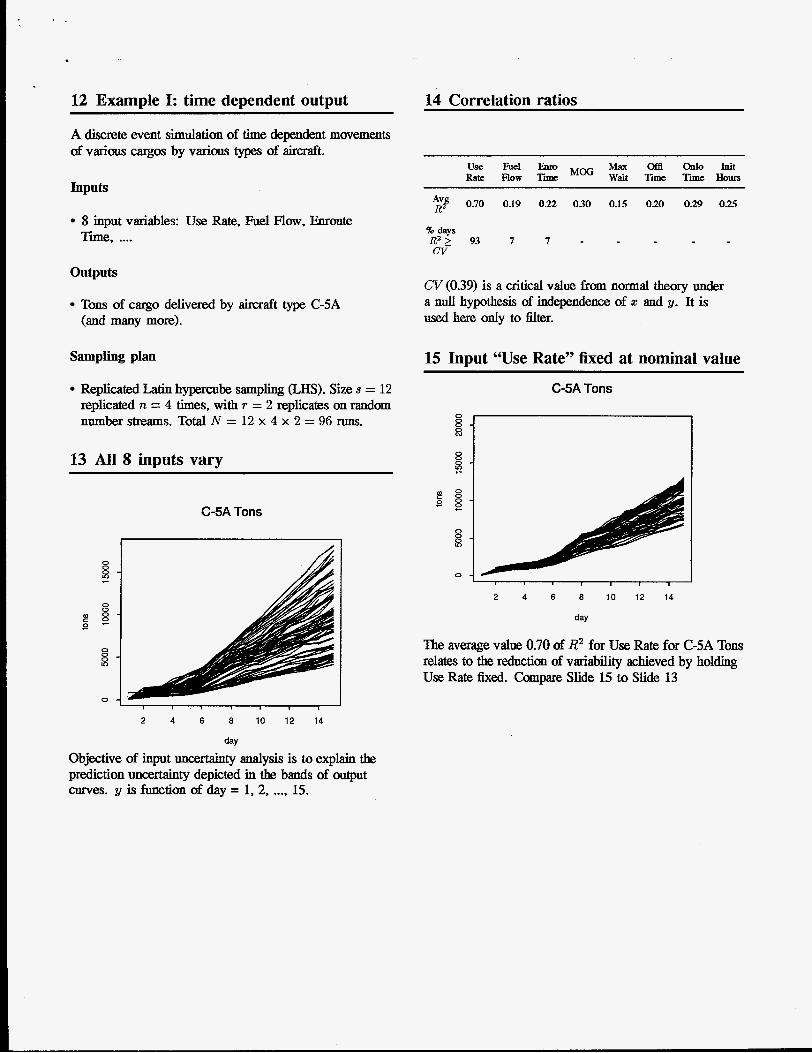
12 Example I: time dependent output
A discrete event simulation of time dependent movements of various cargos by various types of aircraft.
Inputs
8 input variables: Use Rate, Fuel Flow, Euroute Time, ....
outputs
Tons of cargo delivered by aircraft type C-SA (and many more).
Sampling plan
Replicated Latin hypercube sampling (LHS). Size s = 12 replicated n = 4 times, with T = 2 replicates on random number streams. Total N = 12 x 4 x 2 = 96 runs.
13 All 8 inputs vary
C-SA Tons
2 4 6 8 10 12 14
day
Objective of input uncatam * tyanalysisistoexplainthe predictionllnc&mQ depicted in the bands of output curves. y is function of day = 1,2, ..., 15.
14 Correlation ratios
USe offl On10 Init Rate Flow Time Eiuo MOG gz Time T i Hours
%# 0.70 0.19 022 030 0.15 0.20 0.29 0.25
CV (0.39) is a critical value from normal theory under a null hypothesis of independence of 2: and y. It is used here only to filter.
15 Input ‘Wse Rate” fixed at nominal value
2 4 6 8 10 12 14
day
The average value 0.70 of R2 for Use Rate for C-5A Tons relates to the reduction of variabiity achieved by holding Use Rate fixed. Campare Slide 15 to Slide 13
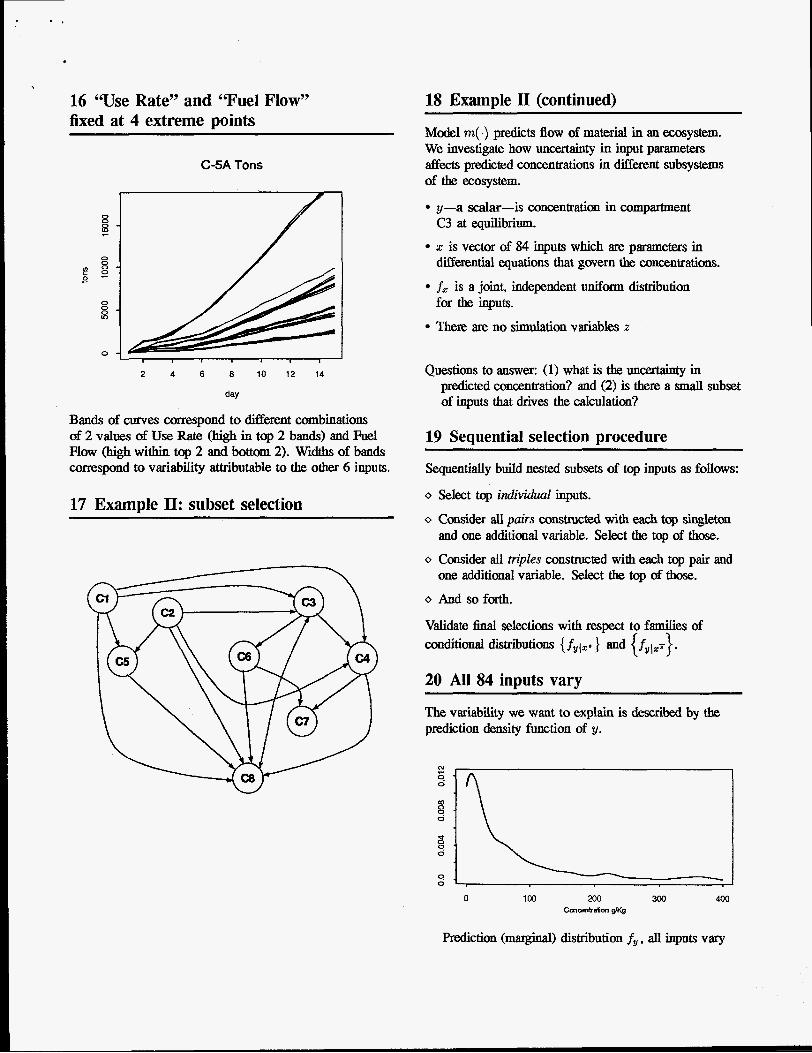
16 “Use Rate” and ?Fuel Flow” fixed at 4 extreme points
C-5A Tons
0
a 8 E 2 c
0 0
8
0
2 4 6 8 10 12 14
day
Bands of curves correspond to different combinations of 2 values of Use Rate (high in top 2 bands) and Fuel Flow (high within top 2 and bottom 2). Widths of bands c<nrespond to variability attributable to the other 6 inputs.
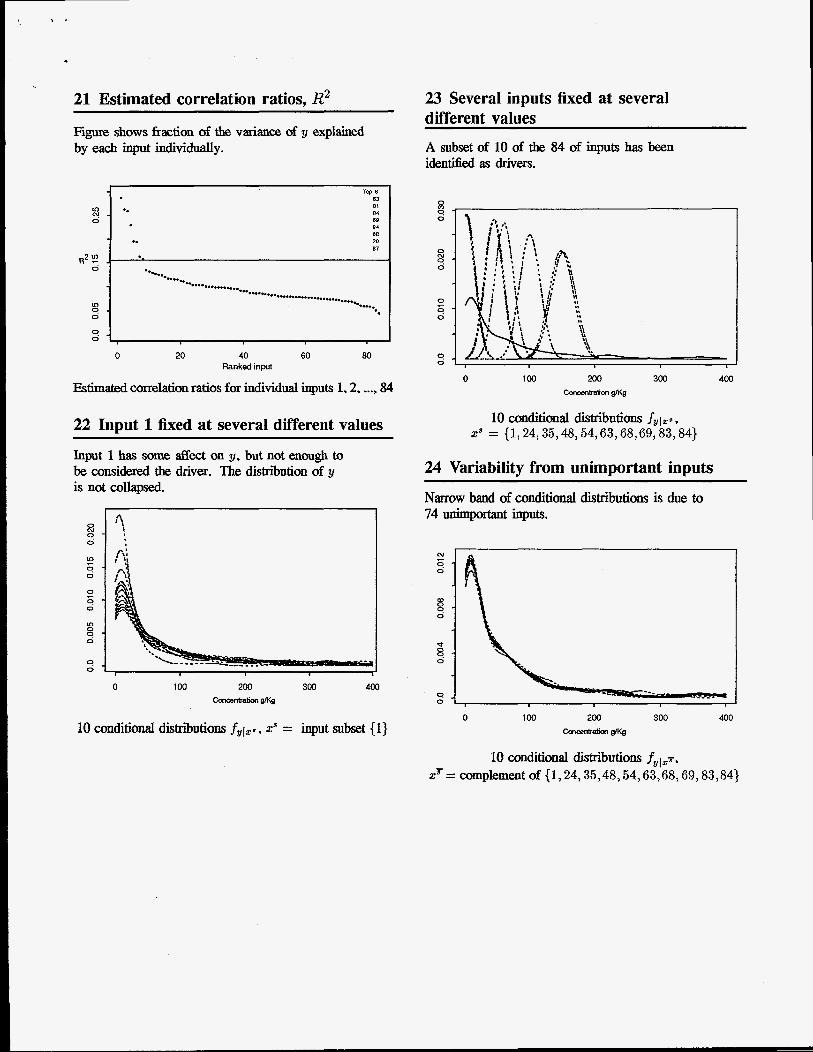
17 Example II: subset selection
18 Example I1 (continued)
Model m(.) predicts flow of material in an ecosystem. We investigate how uncertainty in input parameters affects predicted concentrations in different subsystems of the ecosystem.
y-a scalar-is concentration in compartment
2 is vector of 84 inputs which are parameters in
fz is a joint, independent uniform distribution
The= are no simulation variables z
C3 at equilibrium.
differential equatims that govern the concentrations.
for the inputs.
Questions to answer: (1) what is the unceftainty in predicted concentration? and (2) is there a small subset of inputs that drives the calculation?
19 Sequential selection procedure
Sequentially build nested subsets of top inputs as follows:
o Select top individual inputs.
o Consider all pairs cunstructed with each top singleton and one additional variable. Select the top of those.
o Consider all triples constructed with each top pair and one additional variable. Select the top of those.
o And so forth.
Validate 6nal selections with respect to families of conditional distributions { fyp } and { fyIz~}. 20 All 84 inputs vary
The variability we want to explain is described by the prediction density function of y.
0 100 200 300 400 CrnC€nkation !gKg
prediction (marginal) distribution fy , all inputs vary
21 Estimated correlation ratios, R2
Figure shows fraction of the variance of y explained by each input individually.
m 0 CY
R2 '2 0.
m 0 9
T W 8 83 03 e4 6S 24 68 .. 20 6T
-.
".." .. -... .. ........ ".".. e.....
..... ."*-*- .... "."."*..."._."
2 4 , , , , , 1 0 20 40 60 80
Ranked input
Estimated correlation ratios for individual inputs 1,2, ..., 84
22 Input 1 fixed at several different values
Input 1 has some affect on y. but not enough to be considered the driver. The distribution of y is not wllapsed.
23 Several inputs fixed at several different values A subset of 10 of the 84 of inputs has been ide&ed as drivers.
0 100 200 cQnCmMong/Kg
300
Narrow baud of conditional distributions is due to 74 unimportant inputs.
10 conditional distributions fylx6, xs = input subset (1)
10 conditional distributions f y 1 x 8 , xs = (1,24,35,48,54,63,68,69,83,84}
24 Variability from unimportant inputs
0 100 200 Gxwnbation gKg
300 400
0 100 200 300 concsnlr~on g K g
400
10 conditional distributions fylZr. xT = complement of (1,24,35,48,54,63,68,69,83,84}
25 Can structural uncertainty be examined like input uncertainty?
However -
CI Except in limited cases, the model domain M exists at most inferentially and, usually, only hypothetidy.
0 The meaning of gm is an open question. Two possibilities for it are (1) gm is a sampling distribution on M and (2) gm represents the likelihood (objective or subjective) that any particular model in M is correct with respect to reality.
26 Special case: structural uncertainty for a class of discrete event simulation models
~
Simulation moves actors through activities.
The simulation is charactenzed ’ by sequences of activities Ai from the set { QI, QZ, and “residence” or duration times r; for each actor.
.}, event times ti ,
A = a A = a A = a A = a 1 1 2 6 3 5 4 3 . - - A L - - - 1 I I - - r ‘ 1 ‘2 3 ’ ‘4
‘3 t4 t r I 2
Actor’s view: time line of 4 activities
We assume that this characterization of the model (sequences of activities, event times, and residence times) is sufficient to allow analysis of structural uncertainty.
27 Some questions related to structural uncertainty
Are activities in the correct sequence?
Are there missing or extra activities? wbat is the unexkinty in activity went times?
What is the un- in the activity residence times?
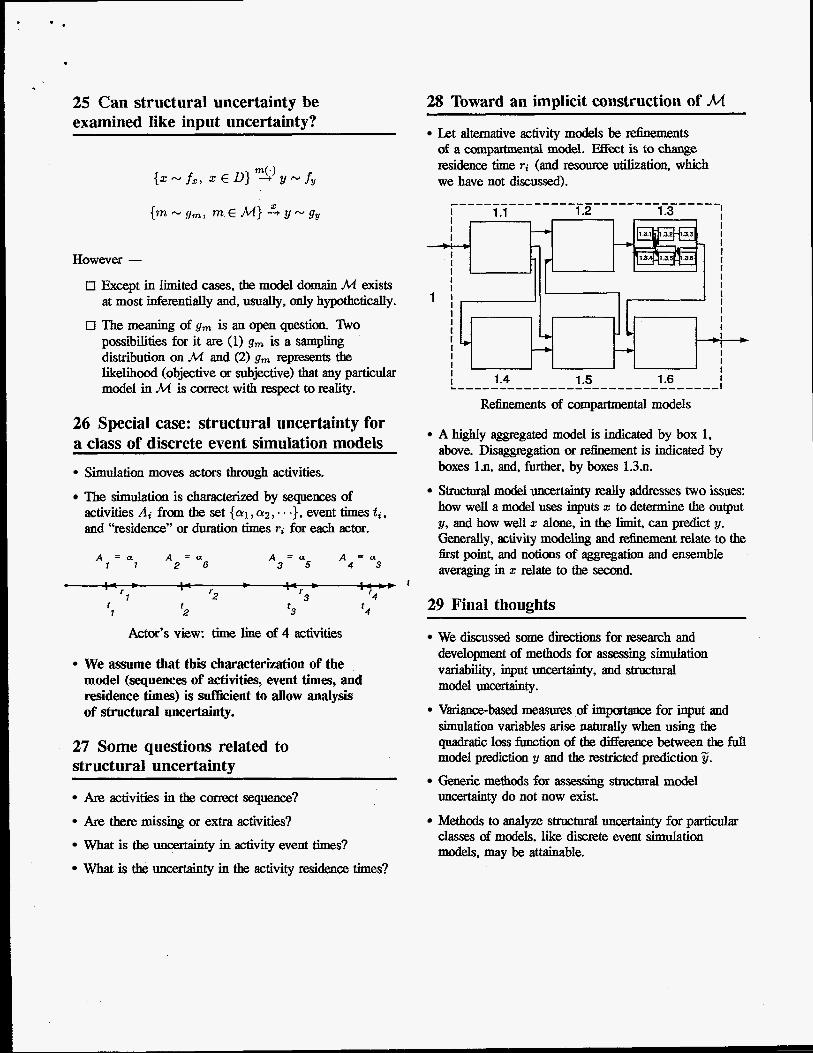
28 Toward an implicit construction of M Let alternative activity models be rekments of a compartmental model. Effect is to change residence time rj (and resource utilization, which we have not discussed). ____-_____------____------------ I 1.1 1.2 1.3 ! I I I
I I I I 1 I
’ i I I -
A highly aggregated model is indicated by box 1, above. Disaggregation or = h e m a t is indicated by boxes Is, and, further, by boxes 1.3.11.
Structural model uflceftainty really addresses two issues: how well a model uses inputs z to determine the output y. and how well 1: alone, in the limit, can predict y. Generally, activity modeling and refinement relate to the first point, and notions of aggregation and ensemble averaging in 2 relate to the second.
29 Final thoughts
We discussed some directions for research and development of methods for assessing simulation variability, input lllK&mQ * , and structural model uncertainty.
Variancebased measures of importame for input and simulation variables arise naturally when using the quadratic loss function of the diffmnce between the full model prediction y and the restricted prediction 5.
uncertainty do not now exist.
classes of models, like discrete event simulation models, may be attainable.
Generic methods for assessing structural model
Methods to analyze structural umxbmty * for particular

. . , I ,
30 Bibliography
C. L. Atwood. Individual model evaluation and probabilistic weighting of models. In Proceedings of Workshop I in Advanced Topics in Risk and Reliability Analysis, Model Uncertainty: its Characterization and Quantijkation, NUREG/CP-0138, pages 99-106, Annapolis, MD, 1993. U.S. Nuclear Regulatory Commission.
David C. Cox. An analytical method for uncertainty analysis of nonlinear output functions, with application to fault-tree analysis. IEEE Transactions on Reliability, R-31(5):465468, 1982.
R. I. Cukier, H. B. Levine, and K. E. Shuler. Nonlinear sensitivity analysis of multiparameter model systems. Journal of Computational Physics, 26:1-42, 1978.
David Draper. Assessment and propagation of model uncertainty. Journal of the Royal Statistical Society, B, 57(1):45-97, 1995.
Jon C. Helton. Treatment of uncerkm 'tyin performance assessments of complex systems. Risk Analysis, 14(4):483-511, 1994.
Ronald L. Iman and Stephen C. Hora. A robust measure of uncertainty importance for use in fault tree system analysis. Risk Analysis, 10(3):401-406, 1990.
B. Krzykacz. Samos: A computer program for the derivation of empirical Sensitivity measures of results from large computer models. Technical Report GRS-A-1700, Gesellschaft fur Reaktorsicherheit (GRS) mbH, Garchin& Republic of Germany, 1990.
Kathryn Blachond Laskey. Model unce-ty: theory and practical implications. IEEE Transactions on Systems, Man, and Cybernetics, 26(3):340-348, 1996.
M. D. McKay, W. J. Conover, andR. J. Beclanaa A comparison of three methods for selecting values of input variables in the analysis of output from a computer code. Technometrics,
Michael D. McKay. Sensitivity analysis. In Proceedings of the Workshop on Validation of Computer-based Mathematical Models in Energy Related Research and Development, pages 3 6 , Fort Worth, TX, 1978. Texas Christian University.
21(2):239-245, 1979.
Michael D. McKay. Aspects of modeling uncertainty and prediction. In Proceedings of Workshop i in Advanced Topics in Risk and Reliability Analysis, Model Uncertainty: Its Characterization and Quantijication, NUREG/CP-0138, pages
Regulatory Commission.
Michael D. McKay. Evaluating prediction uncertainty. Technical Report NUREG/CR-6311, U.S. Nuclear Regulatory Commission and Los Alamos National Laboratory, 1995.
Michael D. McKay. Nonparametric variance-based methods of assessing uncertainty importance. Reliability Engineering and System SajGety,
51-64, Armapolis, MD, 1993. U.S. Nuclear
57267-279, 1997.
Michael D. McKay and Richard J. Beclrmaa Using variance to identify important inputs. In Proceedings of the American Statistical Association Secn'on on Physical and Engineering Sciences, Toronto, 1994.
Michael D. McKay and John D. Morrison. Strucml model uncertainty in stochastic simulation. In Proceedings of the 29th Symposium on the Inerface: Computing Science and Statistics, Houston, TX, 1997.
Max D. Morris. Factorial sampling plans for prelimimry computational experiments. Technomerrics, 33(2):161-174, 1991.
H. H. Panjer. On the decomposition of moments by conditional moments. The American Statistician, 27:170-171, 1973.
Jerome Sacks, William J. Welch, Toby J. Mitchell, and Henry P. Wynn. Design and analysis of computer experiments. Statistical Science, 4(4):409435, 1989.
I. M. Sobol'. Sesitivity estimates for nonlinear mathematical models. Mathematical Modelling and computational Experiment, 1:407414, 1993.
Robert L. Winkler. Modeling Uncertainty: Probabilities for models? In Proceedings of Workshop I in Advanced Topics in Risk and Reliability Analysis, Model Uncertainty: Its Characterization and Quantijication, NUREG/CP-0138, pages 107-116, Annapolis, MD, 1993. U.S. Nuclear Regulatory Commission.