Embed Size (px)
Citation preview

Evaluation and Design Advanced Oxidation Processes (AOPs)
1. UV/H2O2 Processes for Methyl tert-Butyl Ether (MtBE) and Tertiary Butyl Alcohol (tBA) Removal from Drinking Water Source: effect of pretreatment options and light source
2. Mitigation of Bromate during Ozonation -kinetic study-
Daisuke Minakata, John C. Crittenden, Ke Li
1
Department of Civil and Environmental Engineering, Arizona State University
Water Quality Technology Conference Workshops Sun 5 Advanced Oxidation Technologies in WaterNov. 4th 2007, Charlotte, NC.
David. Hokanson, and R.Rhodes. Trussell
Trussell Technologies, Inc.

2
Outline
1. UV/H2O2 processes for methyl tert-butyl ether (MtBE) and tertiary butyl alcohol (tBA) removal from drinking water source: effect of pretreatment options and light source
• Background of study• Pretreatment options• Light source
• Model simulations
2. Mitigation of bromate during ozonation: kinetic study
• Background of study• Kinetics of bromate formation and control
• Model simulations

3
Background
• MtBE was used as gasoline additive to enhance octane number. • Despite the ban in 1992, MtBE is still found nationwide as ground water contaminants.• Difficult to remove using adsorption or air stripping• Exposure to large dose causes significant non-cancer-related-health risk (WHO). • Ruin taste of water at 5-15 µg/L • Established treatment target at MtBE ≤ 2.5 µg/L and tBA ≤ 6 µg/L, respectively, by California Department of Health Services (CDHS)
4
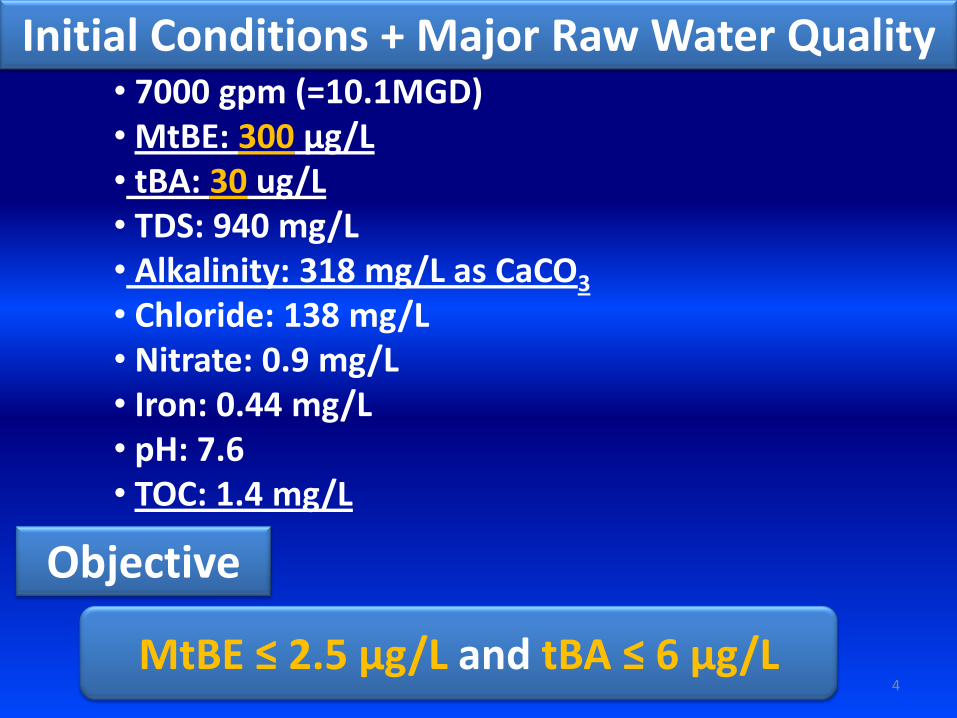
Initial Conditions + Major Raw Water Quality • 7000 gpm (=10.1MGD)• MtBE: 300 µg/L• tBA: 30 ug/L • TDS: 940 mg/L • Alkalinity: 318 mg/L as CaCO3
• Chloride: 138 mg/L • Nitrate: 0.9 mg/L • Iron: 0.44 mg/L • pH: 7.6 • TOC: 1.4 mg/L
Objective
MtBE ≤ 2.5 µg/L and tBA ≤ 6 µg/L

5
Pretreatment options -4 alternatives + dealkalization-
• NAIX: ion exchange softening with seawater
• Pellet Softening: softening with Pellet reactor
• WAIX: weak acid Ion exchange
• RO: lime softening + reverse osmosis
Dealkalization
AlternativeTOC
(mg/L)
Alkalinity
(mg/L as CaCO3)pH
Ferrous Iron
(mg/L)
Raw water 1.4 318 7.6 0.44
NalX 1.4 318 7.6 0
NalX + Dealkalization 1.4 0 4.65 0
Pellet Softening 1.4 203 9.1 0
Pellet Softening +
Dealkalization1.4 0 4.75 0
WAIX 1.4 118 6 0
WAIX + Dealkalization 1.4 0 4.4 0
RO 0.07 54.1 7 0
RO + Dealkalization 0.07 0 4.5 0
Table 3.
Water constituents in feed to the UV/H2O2 process
Estimated major water quality after pretreatment
6
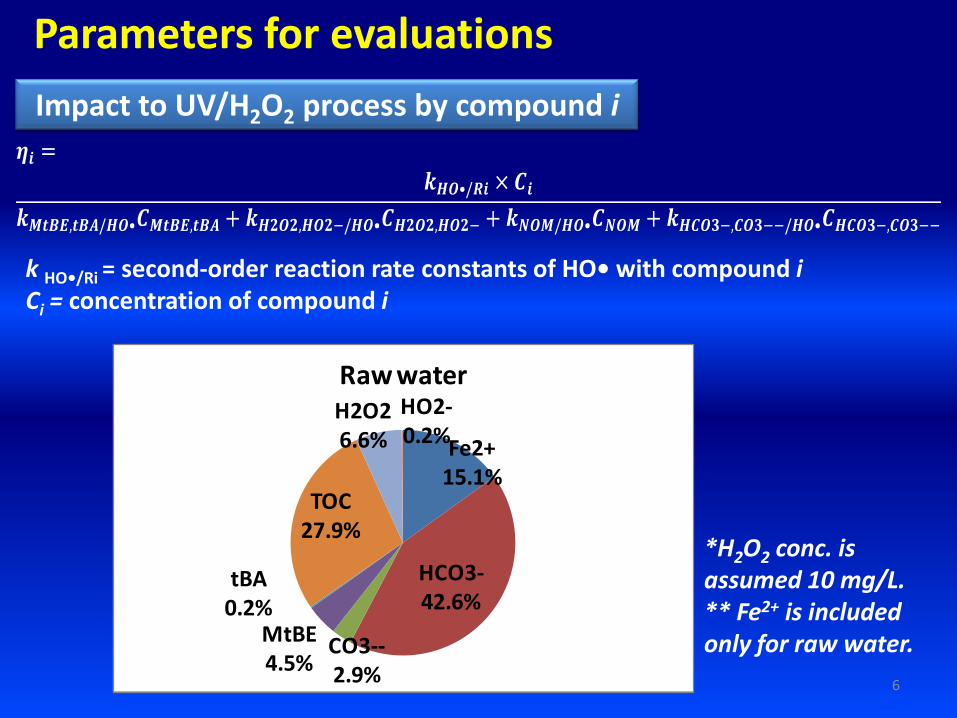
Impact to UV/H2O2 process by compound i
Parameters for evaluations
k HO•/Ri = second-order reaction rate constants of HO• with compound iCi = concentration of compound i
Fe2+15.1%
HCO3-42.6%
CO3--2.9%
MtBE4.5%
tBA0.2%
TOC27.9%
H2O26.6%
HO2-0.2%
Raw water
*H2O2 conc. is assumed 10 mg/L.** Fe2+ is included only for raw water.

7
Pretreatment 1. -IX Softening with seawater (NAIX) w/o dealkalization-
Cl2
Cl2
WasteGAC
Replacement GAC
AOP
GAC*
GAC
downhole Cl2Seawater
Brine
Na IXH2SO4
Decarbonator NaOHcontactor
O2 Strip
H2O2
mix
*Treatment scheme courtesy of R.Trussell

8
Pretreatment 2. – Softening with Pellet Reactor w/o dealkalization -
GAC*
GAC
Replacement GAC Waste
GAC
NaOH
O2 Strip
Pellet softener
AOP
Filtration
NaOH
HClWastePellets
washwater
H2O2mix
contactor
HCl
DecarbonatorCl2
Cl2
downhole Cl2
HCO3-20.7%
CO3--44.6%MtBE
3.5%
tBA0.2%
TOC21.5%
H2O25.1%
HO2-4.5%
Pellet Soft
MtBE11.5%
tBA0.5%
TOC71.1%
H2O216.8%
Pellet+Dealk
*Treatment scheme courtesy of R.Trussell

9
Pretreatment 3. - Weak Acid IX w/o dealkalization -
GAC*
GAC
downhole Cl2H2SO4Weak Acid IX
Replacement GAC
WasteGAC
BrineH2O2 mix
AOP
Decarbonator NaOH
Cl2
contactor
O2 Strip
HCO3-12.4%
CO3--0.0%
MtBE10.1% tBA
0.5%
TOC62.3%
H2O214.7%
WAIX
MtBE11.5%
tBA0.5%
TOC71.1%
H2O216.8%
WAIX + Dealk
*Treatment scheme courtesy of R.Trussell

10
Pretreatment 4. - Lime softening + RO w/o dealkalization -
WasteGAC
LP RO
AOP
GAC*
GAC
downhole Cl2
Replacement GAC
H2O2mix
DecarbonatorNaOH
Cl2
contactor
O2 Strip
Cl2
H2SO4
Seawater
softeningBrine
GAC
Brine
GAC*
HCO3-33.1%
CO3--0.6%
MtBE23.5%
tBA1.0%
TOC7.3%
H2O234.3%
RO
MtBE35.6%
tBA1.6%
TOC11.0%
H2O251.8%
RO + Dealk
*Treatment scheme courtesy of R.Trussell

11
Advanced oxidation process - UV/H2O2 -Elementary Reactions
H2O2 + hν → 2HO•
H2O2 = quantum yield of H2O2 (=0.5)
I0 = incident light intensity, einstein cm-2
sec-1
A=2.303b(εH2O2CH2O2+εRCR + εSCS + εHO2-CHO2-)
b=pathlength, cm
fH2O2= 2.303 b (εH2O2CH2O2 + εHO2-CHO2-)/A
H2O2/HO2- + HO H2O/OH
- + HO2 2.7×10
7, 7.5×10
9
H2O2 + HO2/O2- HO + H2O/OH
- + O2 3.0, 0.13
HO + HO H2O2 5.5×10⁹
HO + HO2/O2- H2O/OH
- + O2 6.6×10
9, 7.0×10
9
HO2 + HO2/O2- H2O2/HO2
- + O2 8.3×10
5, 9.7×10
7
R + hv Products
R + HO Products kMtBE=1.6×10⁹, ktBA=6.0×10
8
HO + CO32-
/HCO3- CO3
- + OH
-/H2O 3.9×10
8, 8.5×10
6
HO + NOM Products 2.4×10⁴ (mgC/L)
-1s
-1
NOM + hv Products

Molar absorption coefficient &Absorption spectra
0.00.10.20.30.40.50.60.70.80.91.0
200 220 240 260 280 300
Ab
sorb
ance
(cm
-1)
wavelength (nm)
Raw water
NO3-
H2O2 10mg/L
Fe(II)
(mgC/L)-1
cm-1
Wavelength (nm) NOM H2O2 Fe(II) Nitrate
200 0.764 179 642 9624
210 0.425 144 650 7943
220 0.180 100 551 3744
230 0.051 64 494 788
240 0.021 38 584 93
250 0.017 22 518 9
254 0.017 18 444 3
260 0.016 12 354 1
270 0.015 7 313 1
280 0.014 3 288 3
290 0.014 2 255 5
300 0.013 1 255 7
Molar absorption coefficient
M-1
cm-1
Table 4.
Absorbance of raw water of the Charnock wells, iron(II), nitrate, and calculated
NOM in the range from 200 to 300 nm of wavelength
12
Calculated f (H2O2) = 0.0044* 200-300 nm, 10 mg/L of H2O2
** H2O2 absorbs photons efficiently in the range of 200-300 nm
13
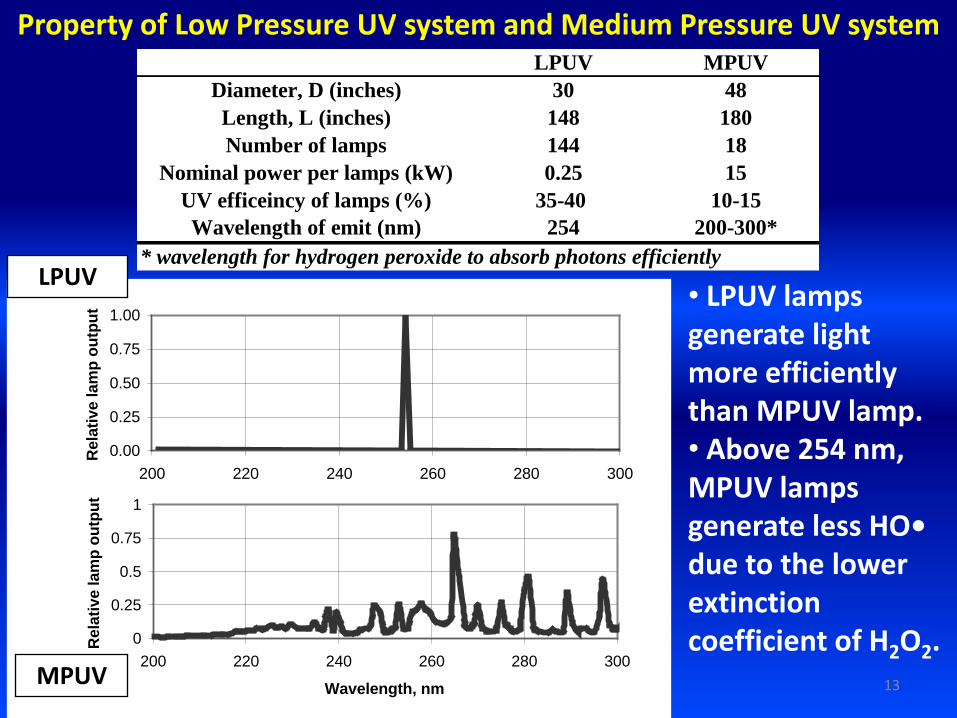
Property of Low Pressure UV system and Medium Pressure UV system
• LPUV lamps generate light more efficiently than MPUV lamp.• Above 254 nm, MPUV lamps generate less HO• due to the lower extinction coefficient of H2O2.
Medium Pressure UV
0
0.25
0.5
0.75
1
200 220 240 260 280 300
Wavelength, nm
Rela
tive lam
p o
utp
ut
0.00
0.25
0.50
0.75
1.00
200 220 240 260 280 300
Rela
tive lam
p o
utp
ut
LPUV
MPUV
LPUV MPUV
Diameter, D (inches) 30 48
Length, L (inches) 148 180
Number of lamps 144 18
Nominal power per lamps (kW) 0.25 15
UV efficeincy of lamps (%) 35-40 10-15
Wavelength of emit (nm) 254 200-300*
* wavelength for hydrogen peroxide to absorb photons efficiently
Table 6.
Comparison of the LPUV reactor and the MPUV reactor associated with
physical properties and lamp efficiency.

Low Pressure UV System (LPUV)
Lamp ConfigurationLPUV System 14
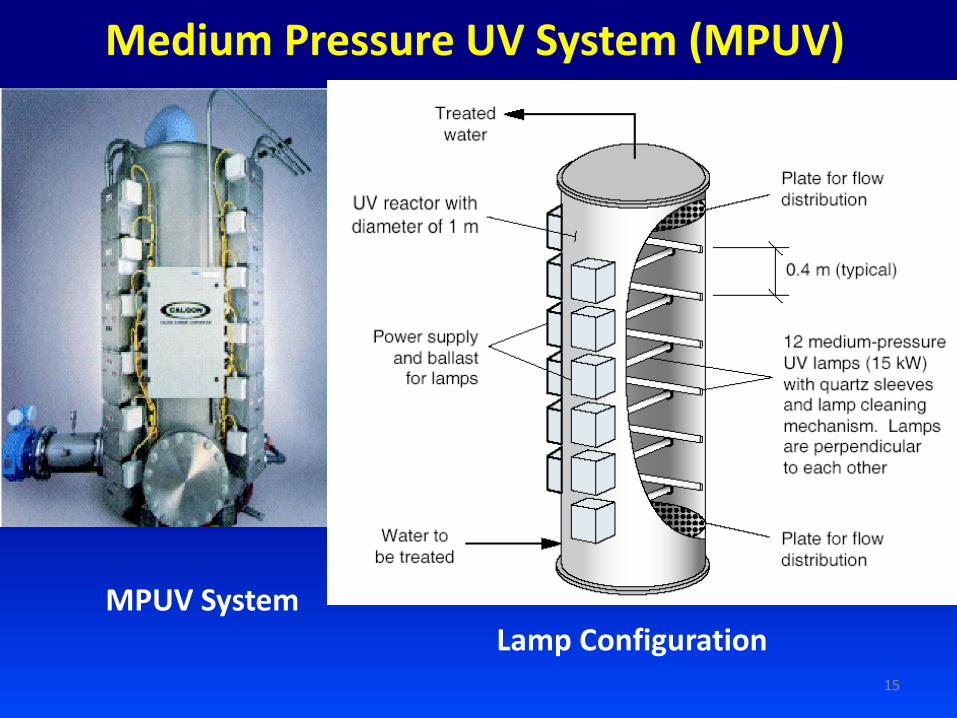
Medium Pressure UV System (MPUV)
Lamp ConfigurationMPUV System
15
16
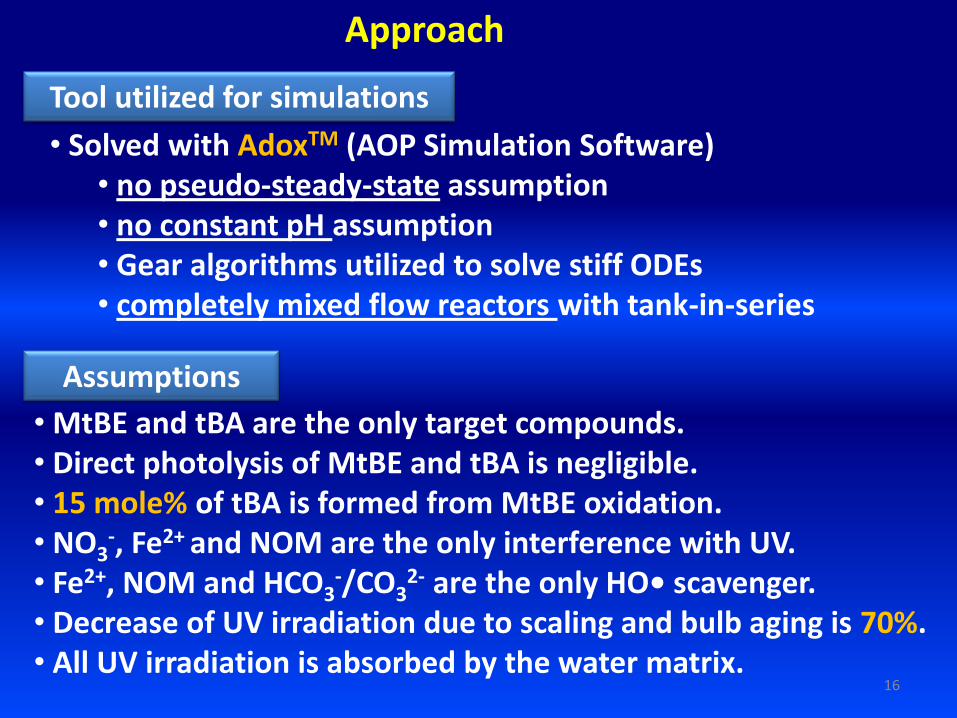
Tool utilized for simulations
• Solved with AdoxTM (AOP Simulation Software)• no pseudo-steady-state assumption• no constant pH assumption• Gear algorithms utilized to solve stiff ODEs • completely mixed flow reactors with tank-in-series
Assumptions
• MtBE and tBA are the only target compounds.• Direct photolysis of MtBE and tBA is negligible. • 15 mole% of tBA is formed from MtBE oxidation. • NO3
-, Fe2+ and NOM are the only interference with UV.• Fe2+, NOM and HCO3
-/CO32- are the only HO• scavenger.
• Decrease of UV irradiation due to scaling and bulb aging is 70%. • All UV irradiation is absorbed by the water matrix.
Approach

17
Approach (cont’d)
Configuration of reactors and Modeling approach (LPUV/H2O2)
• Consist of four parallel train (each Q= 1750 gpm). Each train includes the required number of LPUV reactors in series. • Dye study data suggests 8 tanks-in-series (TIS) described reactor mixing conditions. • If both MtBE and tBA do not meet treatment objectives, the model run up to 9 maximum reactors (72 TIS).• If proved impossible to meet the criteria above, H2O2 dose is increased.
Q = 7000 gpmEach Q = 1750 gpm
Target effluent conc.MtBE ≤ 2.5 µg/L
tBA ≤ 6 µg/L

18
Approach (cont’d)
Configuration of reactors and Modeling approach (MPUV/H2O2)
• No more than two reactors in series is allowed in design.• 4 TIS was chosen to described the mixing condition.• The number of trains would be increased until 9 parallel trains (18 reactors) to achieve the treatment target.• If proves impossible to meet the objectives, H2O2 dose would be increased.
Q = 7000 gpm
Target effluent conc.MtBE ≤ 2.5 µg/L
tBA ≤ 6 µg/L

19
EE/O (electrical efficiency per order of contaminant destruction)
P = lamp power output, kWQ = water flow rate, gal/hCi = influent conc. of MtBE or tBA, µg/LCf = effuluent conc. of MtBE or tBA, µg/L
, kWh-kgal/order
Parameters for evaluations

20
in out MtBE tBA MtBE tBA
None (raw) 25 13 1.1 4.4 0.5 5.7 9 4
NalX 25 13 1.0 4.0 0.6 6.0 8 4
NalX + Dealk 10 6.9 0.77 3.0 0.6 5.8 6 4
Pellet 70 35 1.4 5.3 0.4 5.4 11 4
Pellet + Dealk 10 6.9 0.77 3.0 0.6 5.8 6 4
WAIX 10 6.3 0.83 3.1 0.3 4.7 7 4
WAIX + Dealk 10 6.9 0.77 3.0 0.6 5.8 6 4
RO 7.0 4.9 0.15 0.49 1.3 5.7 1 4
RO + Dealk 4.0 2.9 0.11 0.29 0.2 1.8 1 4
Number
of trainsPretreatment process
H2O2
(mg/L)
EE/O
(kwh-kgal/order)
Effluent concentration
(μg/L)
Number of
reactors
per train
Table 7.
Summary of results for using the LPUV reactor with all pretreatment alternatives.
Simulation results (LPUV/H2O2) -overall-
• Pretreatment (i.e. Dealkalization) significantly improves the treatment efficiency and decrease the EE/O and the # of reactors. • NaIX + Dealk would be preferred because less residues of H2O2
and less complexity.

21
Simulation Results (LPUV/H2O2) – NAIX + Dealkalization -
0.00
0.50
1.00
1.50
2.00
2.50
3.00
3.50
4.00
0.0
2.0
4.0
6.0
8.0
10.0
12.0
14.0
16.0
5 10 15 20
EE
O (k
Wh
/kg
al-
ord
er)
H2O
2re
sid
ua
l co
nc.
(m
g/L
)
H2O2 Dosage (mg/L)
Residual of H2O2 MtBE tBA
• 10 mg/L of H2O2 dosage would be the better choice although the optimum dosage of H2O2 is over 20 mg/L. This is because the cost required for over 20 mg/L of H2O2 dose overweigh the energy cost.
22
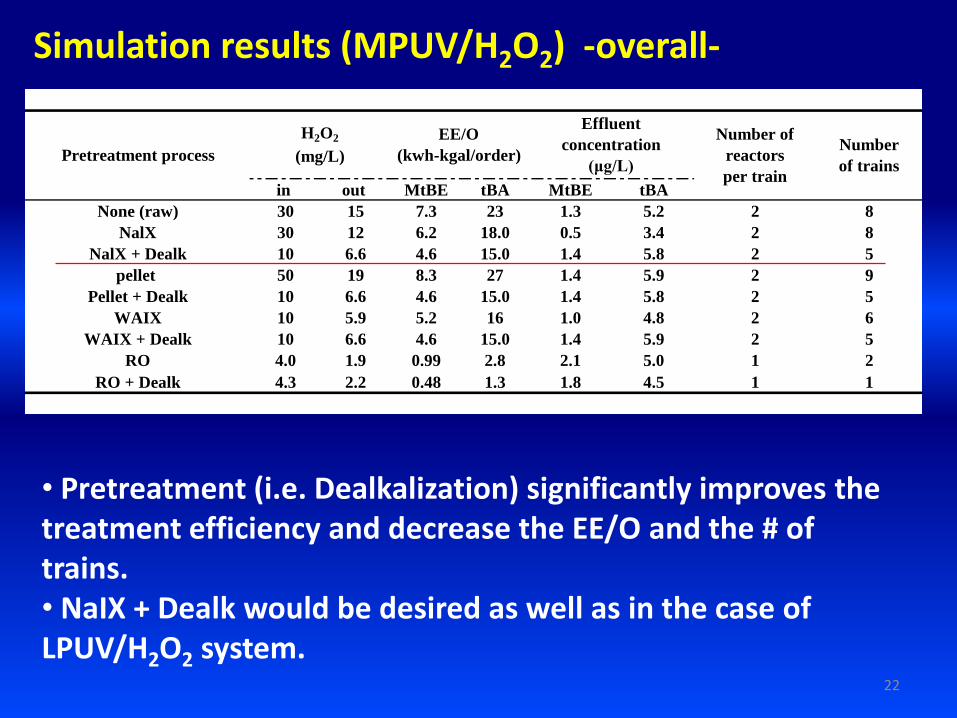
in out MtBE tBA MtBE tBA
None (raw) 30 15 7.3 23 1.3 5.2 2 8
NalX 30 12 6.2 18.0 0.5 3.4 2 8
NalX + Dealk 10 6.6 4.6 15.0 1.4 5.8 2 5
pellet 50 19 8.3 27 1.4 5.9 2 9
Pellet + Dealk 10 6.6 4.6 15.0 1.4 5.8 2 5
WAIX 10 5.9 5.2 16 1.0 4.8 2 6
WAIX + Dealk 10 6.6 4.6 15.0 1.4 5.9 2 5
RO 4.0 1.9 0.99 2.8 2.1 5.0 1 2
RO + Dealk 4.3 2.2 0.48 1.3 1.8 4.5 1 1
Number of
reactors
per train
Number
of trainsPretreatment process
H2O2
(mg/L)
EE/O
(kwh-kgal/order)
Effluent
concentration
(μg/L)
Simulation results (MPUV/H2O2) -overall-
• Pretreatment (i.e. Dealkalization) significantly improves the treatment efficiency and decrease the EE/O and the # of trains. • NaIX + Dealk would be desired as well as in the case of LPUV/H2O2 system.

23
Simulation Results (MPUV/H2O2) – NAIX + Dealkalization -
0.0
5.0
10.0
15.0
20.0
25.0
30.0
0.0
2.0
4.0
6.0
8.0
10.0
12.0
14.0
16.0
5 10 15 20
EE
O (k
Wh
/kg
al-
ord
er)
H2O
2re
sid
ua
l co
nc.
(m
g/L
)
H2O2 Dosage (mg/L)
Residual of H2O2 MtBE tBA
• 10 mg/L of H2O2 dosage would be the best choice although the optimum dosage of H2O2 is over 20 mg/L. This is because the cost required for over 20 mg/L of H2O2 dose overweigh the energy cost.

24
Cost comparison
# of
reactors
Total power
per day
(kWh)
Cost of
energy
($/day)
H2O2
dose
(mg/L)
Total amount
per day
(lb)
Cost of
chemical
($/day)
LPUV/H2O2 24 21,300 $2,130 10 600 $899
MPUV/H2O2 10 108,000 $10,800 10 600 $899
Table 11.
Cost comparison for the desing comparing of the LPUV reactor and the
MPUV reactor
NaIX + Dealkalization pretreatment
* Unit prices for H2O2 and electrical energy are $ 1.5/lb and $0.10 kWh, respectively.
• Cost of energy for MPUV system is 5 times higher than for LPUV system.• In the design process, a comparison of EE/O versus the H2O2 dosage provides valuable insight into the tradeoffs and support determination an appropriate H2O2 dosage.

Mitigation of Bromateduring Ozonation Process
Daisuke Minakata
John C. Crittenden, Ph.D., P.E., N.A.E.
Arizona State University
25

Application of ozone to water treatment
• Direct reactions with O3
26
O3 + NOM → HO• + byproducts
• HO• is quenched by the reaction with NOM
HO• + NOM → byproducts
Factors to reduce stability of aqueous ozone residuals• High pH• Low alkalinity• High TOC• High temperature
• Indirect reactions with HO• produced by O3 with NOM
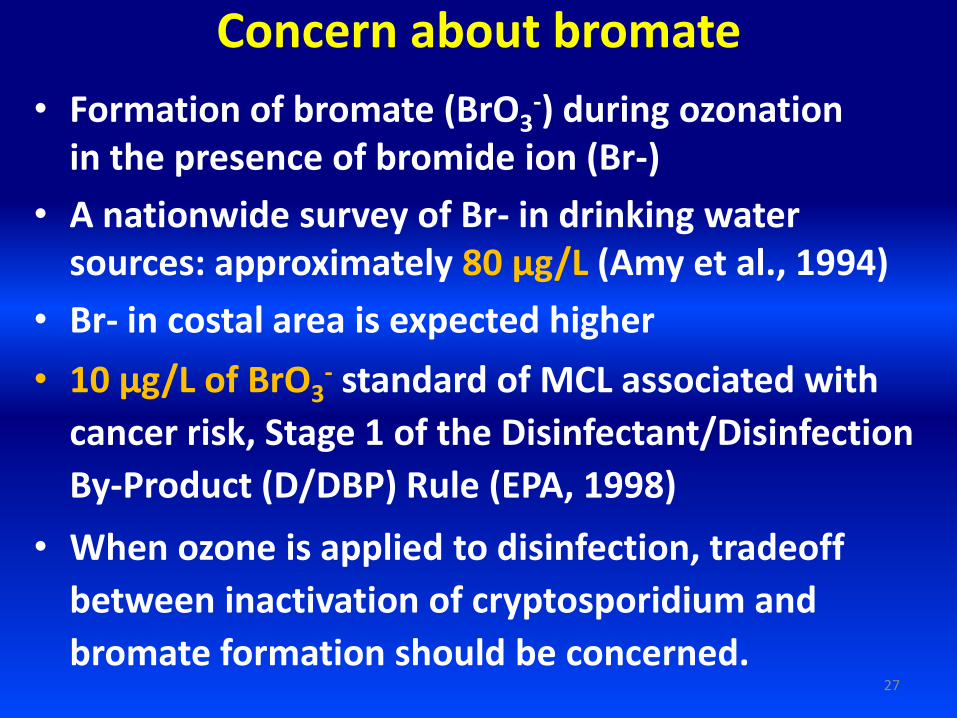
Concern about bromate
• Formation of bromate (BrO3-) during ozonation
in the presence of bromide ion (Br-)
• A nationwide survey of Br- in drinking water sources: approximately 80 μg/L (Amy et al., 1994)
• Br- in costal area is expected higher
• 10 μg/L of BrO3- standard of MCL associated with
cancer risk, Stage 1 of the Disinfectant/Disinfection
By-Product (D/DBP) Rule (EPA, 1998)
• When ozone is applied to disinfection, tradeoff
between inactivation of cryptosporidium and
bromate formation should be concerned. 27

Mechanisms of bromate formation
28
Simplified reaction scheme for bromate formation during ozonation
Ozone involving pathway HO• involving pathway
O3 + Br - → OBr
- + O2 160
OBr- + O3 → 2O2 + Br - 330
OBr- + O3 → O2 + BrO2 - 100
HOBr + O3 → O2 + BrO2 - + H+ <0.013
BrO2 - + O3 → BrO3 - + O2 5.7×10
4
O3 + Br• → BrO• + O2 1.5×10⁸
HO• + HOBr → BrO• + H2O 2.0×10⁹
HO• + OBr- → BrO• + OH- 4.2×10
9
HO• + Br- → Br• + OH- 1.1×10⁹
BrO• + BrO• + H2O → BrO2- + OBr- +2H+
5.0×10⁹
BrO• + BrO2- → OBr- + BrO2• 4.0×10⁸
At lower pH (pH<pKa=8.8), less BrO3- is produced via ozone
pathway since HOBr is dominant. As a result, O3 decay is slower.
pKa = 8.8
Disproportionation
k (M-1 s-1)

0.0
0.2
0.4
0.6
0.8
1.00.0
0.2
0.4
0.6
0.8
1.0
1.00E-09 1.00E-08 1.00E-07
f O3
f HO
•
*HO•+/*O3+
29
Contribution of O3 and HO• to the reactions with Br-
• More than 90% of oxidation of Br- occurs with O3.• Only at high [HO•+/*O3+, HO• oxidizes Br-.
Typical range for water treatment
30
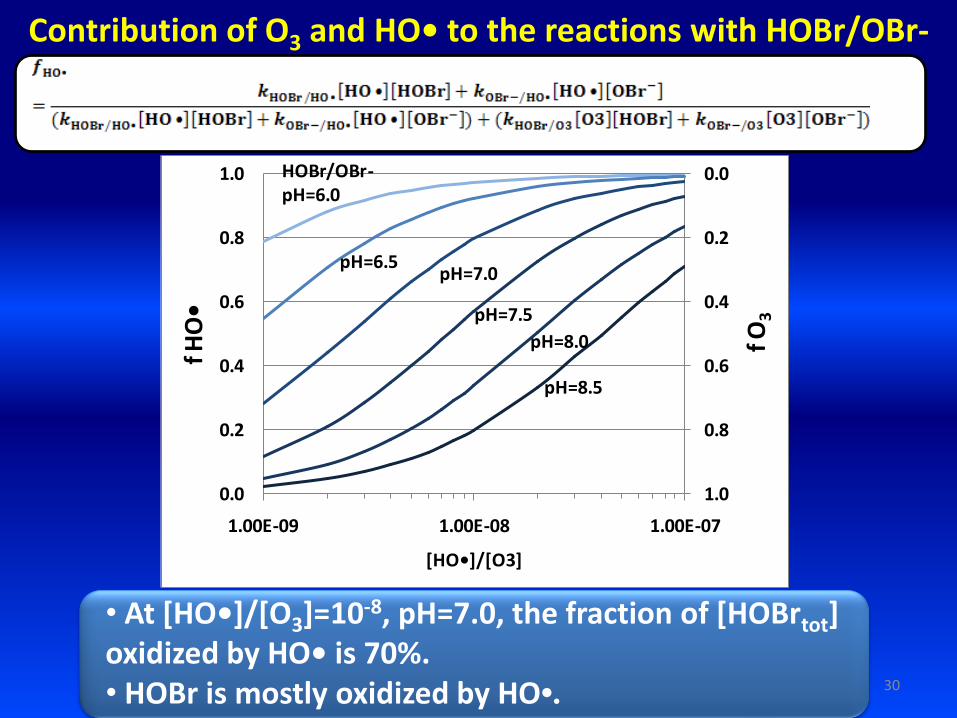
Contribution of O3 and HO• to the reactions with HOBr/OBr-
• At [HO•+/*O3]=10-8, pH=7.0, the fraction of [HOBrtot] oxidized by HO• is 70%.• HOBr is mostly oxidized by HO•.
0.0
0.2
0.4
0.6
0.8
1.00.0
0.2
0.4
0.6
0.8
1.0
1.00E-09 1.00E-08 1.00E-07
f O3
f HO
•
*HO•+/*O3+
HOBr/OBr-pH=6.0
pH=6.5pH=7.0
pH=8.5
pH=7.5
pH=8.0

Control of bromate formation 1 – pH depression-
• pH depression resulting in more HOBr due to pKa=8.8 of
HOBr reduces BrO3- formation. However, in drinking water
treatment at around neutral pH, HOBr is mainly oxidized by
HO•. Therefore, pH depression does not reduce BrO3-
formation drastically.
• At reduced pH, O3 decay is slower and the [HO•+/*O3] is
decreased during ozonation. As a result, reduction of BrO3-
at the steady state is distinctive. It is noted that it cannot
be expected the proportional relationship between
[HO•+/*O3] and BrO3- formation.
31

32
Model simulation - pH effect -HO• + NOM → products k = 19000 (mgC/L)-1s-1 Westerhoff et al 2007
Br• + NOM → Br- + products k = 83000 (mgC/L)-1s-1 Pinkernell and von Gunten 2001
0.0
0.2
0.4
0.6
0.8
1.0
0 10 20 30 40 50 60
O3
(mg
/L)
Time (min)
pH=6.0
pH=6.5
pH=7.0
pH=7.5
pH=8.0
pH=8.5
0
20
40
60
80
100
120
140
160
0 10 20 30 40 50 60
BrO
3-
(ug/
L)
Time (min)
pH=6.0
pH=6.5
pH=7.0
pH=7.5
pH=8.0
pH=8.5
Reactor type CMBR
Init O3 (mg/L) 1.0
pH 6, 6.5, 7, 7.5, 8, 8.5
Br- (µg/L) 300
NOM (mgC/L) 1.0

33
0.0E+00
5.0E-07
1.0E-06
1.5E-06
2.0E-06
2.5E-06
3.0E-06
3.5E-06
4.0E-06
0 10 20 30 40 50 60
HO
Br
(mo
le/L
)
Time (min)
pH=6.0
pH=6.5
pH=7.0
pH=7.5
pH=8.0
pH=8.5
0.00E+00
1.00E-07
2.00E-07
3.00E-07
4.00E-07
5.00E-07
6.00E-07
0 10 20 30 40 50 60O
Br-
(mo
le/L
)
Time (min)
pH=6.0
pH=6.5
pH=7.0
pH=7.5
pH=8.0
pH=8.5
HOBr and OBr- concentration profiles at different pH
It is observed that pH depression lowers OBr- concentration, which reacts with O3 at k=330 and 100 M-1 s-1 to produce Br-and BrO2-, respectively, whereas HOBr does not.

Control of bromate formation 2 - NH3 addition -
34
Simplified reaction scheme for controlling bromate formation
• The maximum effect is at high NH3 as HOBr becomes very small. However, it is observed that excess NH3 decreases the efficiency of bromate control. • Not efficient in water containing medium to high NH3
k (M-1
s-1
)
HOBr + NH3 → NH2Br + H2O 7.5×10⁷
OBr- + NH3 → NH2Br + OH- 7.6×10⁴
NH2Br + OH- → OBr- + NH3 7.5×10⁶

35
Model simulation - NH4+ addition -
0.0
0.2
0.4
0.6
0.8
1.0
0 10 20 30 40 50 60
O3
(mg/
L)
Time (min)
NH4+ = 0 ug/L
NH4+ = 50 ug/L
NH4+ = 100 ug/L
NH4+ = 200 ug/L
0
20
40
60
80
100
120
140
0 10 20 30 40 50 60
BrO
3-
(ug/
L)
Time (min)
NH4+ = 0 ug/L
NH4+ = 50 ug/L
NH4+ = 100 ug/L
NH4+ = 200 ug/L
NH4+ = 400 ug/L
NH4+ = 800 ug/L
Reactor type CMBR
Init O3 (mg/L) 1.0 (= 21 µM)
pH 8.0
Br- (µg/L) 300 (= 3.8 µM)NOM (mgC/L) 1.0
NH4+ (µg/L)0, 50, 100, 200, 400, 800
(0, 2.9, 5.8, 11, 23, 47 µM of NH3 tot)

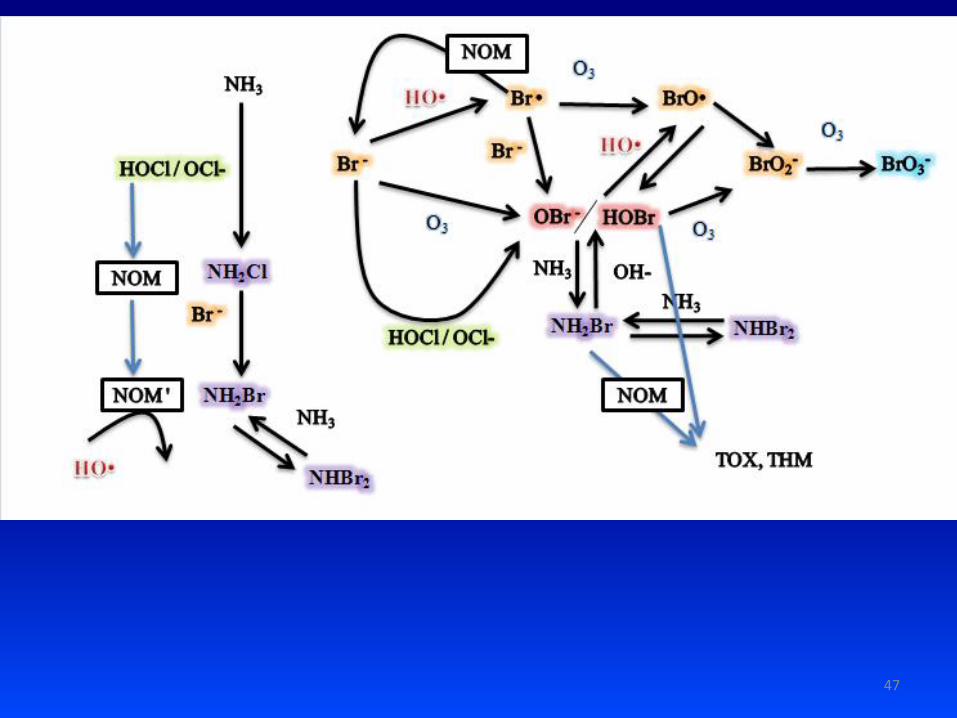
Control of bromate formation 3 – Cl2-NH3 process -
36
• HOCl hinders Br- oxidation to Br• by HO•
NH3 additionCl2 addition OzonationSource water
HOCl + Br- → HOBr + Cl- 1550
OCl- + Br- → OBr- + Cl- 0.001
HOCl ↔ OCl- + H+ pKa = 7.5
• NH3 reacts with both HOBr and HOCl
• Effective to hinder HO• during ozonation to reduce BrO3-• HOCl and NH2Cl oxidize specific moieties of NOM and reduces their reactivities toward O3, and also scavenge HO•.
* HOCl, NH2Br, and HOBr react with NOM to produce THMs and TOX
HOBr + NH3 → NH2Br + H2O 7.5×10⁷
OBr- + NH3 → NH2Br + OH- 7.6×10⁴
HOCl + NH3 → NH2Cl + H2O 4.2×10⁶

37
Model simulation – Cl2-NH3 process 1 -
• HOCl (5 min.): Bromide ion is converted into HOBr by HOCl. HOBr produced reacts with NOM.
0
50
100
150
200
250
300
0 1 2 3 4 5
Br-
(ug/
L)
Time (min.)
HOCl = 5 uM
HOCl = 10 uM
HOCl = 15 uM
0.0E+00
5.0E-07
1.0E-06
1.5E-06
2.0E-06
2.5E-06
0 1 2 3 4 5
HO
Br
tot
(M)
Time (min.)
HOCl = 5 uM
HOCl = 10 uM
HOCl = 15 uM
HOCl (µM) 0, 5, 10, 15
Br- (µg/L) 300 (=3.8 µM)
TOC (mgC/L) 1.0
pH 8.0
phosphate (M) 0.001
NH4+ (ug/L) 400 (23 µM of NH3 tot)
reactor type CMBR
O3 (mg/L) 1 (=21 µM)
Chlorination 5 min.
Ammonia addition 1 min.
Ozonation 60 min.

38
Model simulation – Cl2-NH3 process 2 -
0.0E+00
2.5E-07
5.0E-07
7.5E-07
0 0.5 1
HO
Br
(M)
Time (min.)
HOCl = 5 uM
HOCl = 10 uM
HOCl = 15 uM
• NH3 addition (1 min.):HOBr is significantly masked by NH3.
• O3 (60 min.): Pre-addition of HOCl followed by NH3 decreased BrO3- by factor of 2~7 as compared with the case of only NH3
addition.
0.0
0.2
0.4
0.6
0.8
1.0
0 20 40 60
O3
(mg
/L)
Time (min.)
HOCl = 0 uMHOCl = 5 uMHOCl = 10 uMHOCl = 15 uM
0.0
1.0
2.0
3.0
4.0
5.0
6.0
0 20 40 60
BrO
3-(
ug/
L)
Time (min.)
HOCl = 0 uM
HOCl = 5 uM
HOCl = 10 uM
HOCl = 15 uM

39
Model simulation – Cl2-NH3 process 3 –
Effect of reactions of NOM with NH2Br, HOCl, HOBr
0.0
1.0
2.0
3.0
4.0
5.0
6.0
0 20 40 60
BrO
3-(
ug/
L)
Time (min.)
HOCl = 0 uM
HOCl = 5 uM
HOCl = 10 uM
HOCl = 15 uM
0.0
2.0
4.0
6.0
8.0
10.0
12.0
14.0
16.0
0 20 40 60
BrO
3-(
ug/
L)
Time (min.)
HOCl = 0 uM
Series1
HOCl = 10 uM
HOCl = 15 uM
With reactions
Without reactions
The reactions of NOM with HOBr and NH2Br significantly reduces HOBr/OBr concentrations which are the key intermediates for the subsequent BrO3- formation.

[TTHM] = [Cl2]{ATTHM(1-exp(-kt)}
ln(k) = 5.41 – 0.38 ln + 0.27 ln([NH3-N]) – 1.12 ln(Temp) + 0.05 ln([Br-]) – 0.854 ln(pH)
ln(ATTHM)=-2.11-0.87 ln -0.41 ln([NH3-N]) + 0.21 ln([Cl2]) + 1.98 ln(pH)
[TTHM]=predicted trihalomethane conc. in initial phase (~5h), µg/L
[Cl2]=applied chlorine dose, mg/L
[DOC] = dissolved organic carbon, mgC/L
[NH3-N] = ammonia-nitrogen conc., mg/L as N
[Br-]= bromide concentration, µg/L
Temp = temperature, °C
t = reaction time, h
Model simulation – Cl2-NH3 process 4 –
TTHM formation
Improved EPA 1998 empirical model (Sohn et al., 2004)
0
2
4
6
8
10
12
14
16
0 10 20 30 40 50 60
TTH
M (
ug/
L)
Time (min)
HOCl = 5 uM
HOCl = 10 uM
HOCl = 15 uM
HOCl (uM) 0, 5, 10, 15
Br- (ug/L) 300
TOC (mgC/L) 1.0
pH 8.0
phosphate (M) 0.001
NH4+ (ug/L) 400
Chlorination 5 min.
Ammonia addition 1 min.
40

Control of bromate formation -optional (O3/H2O2 process)-
• Advanced oxidation process: O3/H2O2 process:
– HO2- + O3 → HO• + O2•- + O2 k = 2.2×10⁶ M-1s-1
– H2O2 + O3 → O2 + H2O k = 0.0065 M-1s-1
– produce more HO• at higher pH due to pKa = 11.6 (H2O2)
– H2O2 also scavenges HO•
• H2O2 + HO• → HO2• + H2O k = 2.7×10⁷ M-1s-1
=> optimum O3/H2O2 ratio (typically 2 ~ 3)
• H2O2 addition keeps the O3 concentration low.
• In the presence of Br-, H2O2/HO2- reacts with HOBr/OBr- to produce Br- resulting in BrO3- formation. In addition, there is significant contribution of the reaction of O3 with Br• in regard with BrO3- formation.
41

42
Model simulation – O3 with H2O2 process–CMBR
Init O3 (mg/L) 3
pH 7.5
Init H2O2 (mg/L) 1.5, 1.0, 0.5
ALK (mgCaCO3) 0
phosphate (mM) 0
Br- (ug/L) 300
NOM (mgC/L) 1
MtBE (ug/L) 300
0.0
0.5
1.0
1.5
2.0
2.5
3.0
0 20 40 60
O3
(mg/
L)
Time (sec)
H2O2 1.5 mg/L
H2O2 1mg/L
H2O2 0.5 mg/L
0
50
100
150
200
250
300
0 20 40 60
MtB
E (u
g/L)
Time (sec)
H2O2 1.5 mg/L
H2O2 1 mg/L
H2O2 0.5 mg/L

43
0
5
10
15
20
0 20 40 60
BrO
3-(
ug
/L)
Time (sec)
H2O2 1.5 mg/L
H2O2 1 mg/L
H2O2 0.5 mg/L
0.0E+00
7.0E-09
1.4E-08
0 20 40 60
HO
Br
tot
(M)
Time (sec)
H2O2 1.5 mg/L
H2O2 1 mg/L
H2O2 0.5 mg/L

Questions?

45

46
47


![Advanced Oxidation Processes for Treatment of Organics in ......advanced oxidation processes (AOPs), which are much more aggressive, having been shown in ... is expected [6]. Although](https://img.pdfslide.net/doc/110x75/602573e89f37b278791164ea/advanced-oxidation-processes-for-treatment-of-organics-in-advanced-oxidation.jpg)