Embed Size (px)
Citation preview
1
EVALUATION AND RE-DESIGN OF PUBLIC
EDUCATION NETWORKS: A CENTRALIZED
ANALYSIS1
Laura López-Torres
Diego Prior2
ABSTRACT
The vast number of studies on school efficiency confirms that it is a topic of interest
for researchers. While existing literature has focused on determining the features of
educational centers and environmental factors that influence students’ results, this
study aims to assess and re-design a sample of schools in the public education
network in Catalonia (north-eastern Spain) based on post-New Public Management,
through the use of a specific non-parametric frontier technique. This stream has
received less attention in the research of the field and evaluates the overall efficiency
of a set of units controlled by a central authority. The approach proposed in this study
involves the creation of an internal performance-based scheme that encourages an
effective level of accountability and efficiency for state schools. In this regard, three
theoretical models are proposed in order to improve the efficiency of the network: 1)
the expansion of the results for those state schools whose students’ grades could be
improved; 2) the constraint of the expenses for some state center without lowering the
quality, and 3) a mixture of the previous models. Obviously, the specific orientation to
follow is dependent on the strategies pursued by the government. The results indicate
the network could be improved to redistribute optimally the resources devoted to
education. The study also provides useful information for accountability and decision
making, regarding the implementation of improvement programs in state schools.
Therefore, this paper contributes significantly to the current literature as it uses a
pioneering theoretical approach to analyze school efficiency.
KEY WORDS: Education network, centralization, efficiency, Data Envelopment
Analysis (DEA), reallocation.
JEL CLASIFICATION: C61, D24, I21
1 We are grateful for the helpful comments by Manuel Muñiz, Javier Salinas and other participants at
the 20th Public Economics Meeting (Sevilla, February 2013) and also to the Consell Superior
d’Avaluació del Sistema Educatiu de Catalunya for providing us the data. The authors acknowledge the
financial support of Ministerio de Ciencia e Innovación (ECO2010-18967/ECON). 2 Business Department. Universitat Autònoma de Barcelona. [email protected] and

2
1. INTRODUCTION
In recent decades, interest in school efficiency has increased, from both practitioner
and academic points of view (Goldstein and Woodhouse, 2000). From the practical
side, one of the reasons for the emergence of such studies is the increasing importance
of the education sector in the economy3. This sector has provided intellectual training
for the population and better human capital and labor productivity (Blau, 1996).
Likewise, education is considered an essential tool for achieving higher economic
growth (Krueger and Lindahl, 2001).
The Spanish economic reality is currently at the center of a social and political debate.
In the public sector, the pressure to increase the performance implies that any action
to improve efficiency becomes a priority of economic policy so that under current
budget constraints, the continuity of organizations is a decision variable (Bel, Fageda
and Warner, 2010). In particular, to rationalize spending on education, the Spanish
government made budget cuts of 11% and passed the Royal Decree of Urgent
Measures (Real Decreto Ley de Medidas Urgentes). This Royal Decree managed to
save 3,000 million euros by implementing certain measures at the regional level, such
as increasing the students per classroom ratio, expanding the range of increases in
university fees, and delaying the replacement of teachers. However, despite the cuts,
the current system does not encourage schools to work effectively. For that to occur,
we need a reorganization that will motivate them to efficiently achieve good results.
The approach proposed in this study is to create an internal performance-based
scheme that encourages an effective level of performance and accountability for state
schools. In this respect, the optimal size of the network is first determined and, then,
in order to reach this size, the changes required in the allocation of the budget can be
imposed. The introduction of incentives would help the centers to be more efficient
and would allow them to be sustained over time (Burgess and Rato, 2003; Heinrich
and Marschke, 2009). In short, we introduce a number of rules into the field of public
education in the same way as have been done in other public service organizations
such as hospitals (Hafsteinsdottir and Siciliani, 2012) and local authorities (Balaguer-
Coll and Prior, 2009; Zafra-Gómez, Prior, Plata and López-Hernández, 2012; Zafra-
Gómez, Rodríguez and Alcaide, 2012).
3 In the case of Spain, the percentage share of this sector in the level of public spending relative to GDP
has increased by 2% on average from the 1990s (INE, 2011).

3
It should be noted that this process would guarantee the performance of students and
optimize the educational network’s functioning without losing its quality or public
benefits. To summarize, Figure 1 shows the sequence of the scheme proposed in this
paper.
[Insert Figure 1 here]
To develop the scheme, we first designed a management model that would encourage
good educational practices and penalize unsatisfactory results (part A of Figure 1).
Secondly, the rules would be applied to schools that had unsatisfactory results (part B
of Figure 1). Ultimately, we would re-design the public education network through
the application of incentive management (part C of Figure 1).
From the academic point of view, theoretical and methodological literature on school
efficiency is increasing (Coleman, Campbell and Hobson, 1966; Mar-Molinero, Prior,
Segovia and Portillo, 2012). The central hypothesis of school efficiency states that
certain school features and the environment affect the results achieved by students
(Thieme, Prior and Tortosa-Ausina, 2013). This study proposes that research be
conducted on improving school efficiency (ISE). There has been notable progress in
this line owing to, among other factors, the development of new methodological
applications that have improved the conceptualization and measurement of the
reasons that explain the results of students and schools (Johnson and Ruggiero, 2011).
Thus, the Data Envelopment Analysis (DEA) method that appeared in the seminal
work of Charnes, Cooper and Rhodes (1978) has become one of the most commonly
used techniques in the literature (Smith and Mayston, 1987; Thieme et al., 2013;
among others). This paper uses a specific stream of the DEA literature based on the
centralization. This focus has received less attention in the research of the field and
evaluates the overall efficiency of a set of units controlled by a central authority
(decision maker).
Through this framework, this paper addresses the following research questions: What
is the level of efficiency in the public education network? Is it possible to optimize its
performance?
This study is based on the concept of technical efficiency, proposed in the Theory of
Production (Farrell, 1957), and the principles of post-New Public Management (post-
NPM) (Walker and Boyne, 2006; Zafra-Gómez et al., 2012(1); Zafra-Gómez et al.,

4
2012(2)). It aims to evaluate the technical efficiency of a sample of schools in the
public education network in Catalonia (northeastern Spain), by using frontier
techniques. It also seeks possible reallocations that bring about improvements in the
performance of the network.
The results show that efficiency can be improved without losing outputs or inputs, but
this depends on the government’s objectives. The actions to achieve better results are
determined by three approaches: 1) the expansion of the results for those state schools
whose students’ grades could be improved; 2) the reduction of expenses for some
state centers without lowering the quality, and 3) a mix of the two previous actions.
The method proposed in this study has a direct and very important practical
application. It establishes the necessary actions to optimize the network through the
budgets’ reallocation. It also provides valuable information for the decision making
by public authorities. It facilitates the implementation of improvement programs in
schools and their accountability, which contributes to higher levels of quality,
motivation, and fairness within the system4. Therefore, this paper contributes
significantly to the current literature as it uses a pioneering theoretical approach to
analyze school efficiency focusing on the optimizations of the network outcomes.
Following this introduction, Section 2 describes the theoretical framework used in this
research. The third Section reviews the literature on school efficiency. Then, Section 4
details the proposed methodological approach. In Section 5, we comment on and
discuss the results. Finally, in Section 6, we establish the main conclusions and
implications of the study.
4 These topics are fully in line with the objectives of the proposed new Law for the Improvement of
Educational Quality announced in Spain in 2012 (Ley Orgánica para la Mejora de la Calidad
Educativa, LOMCE).

5
2. THEORETICAL FRAMEWORK: POST-NEW PUBLIC MANAGEMENT
The theoretical framework that addresses the objectives of this study fits within post-
New Public Management (post-NPM) (Walker and Boyne, 2006; Zafra-Gómez et al.,
2012(1); Zafra-Gómez et al., 2012(2)). This type of public administration
management, born in reaction to the criticism of New Public Management (NPM),
emerged in the late 20th
century owing to, among other things, excessive
decentralization, poor vertical control, lack of coordination across organizational
units, the focus on results, and short-sightedness about the overall welfare of citizens
(Christensen and Lægreid 2007; Diefenbach, 2009; Zafra-Gómez et al., 2012(1)).
The aforementioned constraints of NPM have created a debate about a new approach
in public sector management based on the post-NPM (Christensen, Lie and Laegreid,
2007). There are some authors argue that this new approach could be seen as a new
type of reforms to public administration because it changes the main features of NPM,
but on the other hand others think that it is not a breakup with the NPM model (Zafra-
Gómez et al., 2012(2)).
The new model of public sector management introduced by post-NPM emphasizes
objectives shared across organizational boundaries, as opposed to working alone
within an organization (NPM model). The post-NPM philosophy, thus, encompasses
the design and delivery of a large variety of policies, programs, and services that cross
organizational boundaries. On the one hand, the main objective is the re-centralization
of public administration to achieve better coordination and greater accountability and
transparency between public organizations (Walker and Boyne, 2006). On the other,
this approach emphasizes reducing fragmentation through structural integration,
increasing centralization, improving coordination, and strengthening core capabilities
and administrative policies (Christensen and Lægreid, 2008; Pollitt, 2009; Kuhlmann,
2010).
Table 1 shows the main features of this new governance model. As can be seen, post-
NPM fosters structural reorganization of the administration. Public entities can
cooperate and work together to reinforce control and coordination both vertically and
horizontally, by combining structural and cultural elements, in order to provide an
integrated service to citizens and achieve cost reduction and efficiency improvement
(Zafra-Gómez et al., 2012(1)). This type of coordinated organizations may be more

6
efficient than a fragmented system, which is focusing mainly on efficiency in service
delivery (Christensen and Lægreid, 2008).
[Insert Table 1 here]
This new form of management can be applied in state schools. The objective is to
design incentives for working effectively, to professionalize their management by
introducing competition mechanisms, and to evaluate the overall system efficiency,
arguments fully in line with the previously mentioned characteristics of post-NPM.
From this point of view, schools are treated as public service organizations in which
knowledge transfer occurs. As we mentioned in the introduction, educational
institutions are fundamental to human capital formation and the country’s economic
growth (Blau, 1996; Krueger and Lindahl, 2001).
The current public education system in Spain is characterized as being bureaucratic,
regulated, and directed (Heckman, Heinrich and Smith, 1997). This model has some
limitations that were mitigated by first introducing competition mechanisms to
improve organizational incentives and then applying management techniques to
optimize individual incentives. In this situation, post-NPM integrates the principles of
NPM (characterized by decentralization and outsourcing) and the bureaucratic model
(which is more authoritarian and centralized), seeking a re-centralization and re-
coordination of public administration to achieve the benefits of reduced costs and
improved efficiency and quality.
The application of this theoretical approach to school efficiency constitutes an
important contribution to the literature because, currently, there are no references that
deal with this subject. The management model suggested by post-NPM has been
applied to local government reforms (Christensen and Laegreid, 2007(2); Kinder,
2012; Zafra-Gómez et al., 2012(1); Zafra-Gómez et al., 2012(2)) and public hospitals
(Dent, 2005) but not to state schools. Therefore, this theoretical approach has
significant practical application. It is in line with the new educational reform recently
announced by the Spanish Ministry of Education, which aims to increase the quality
of the system and reduce the drop-out rate. It also aims to maintain central control (of
the budget, with common content and periodic evaluation) while granting autonomy
to schools.

7
3. DETERMINANTS VARIABLES OF SCHOOL EFFICIENCY
A public entity’s efficiency is a condition for its future permanence. The extreme
difficulty of any assessment process is a major problem in the public sector, due to its
multidimensional structure and the complexity of precisely defining the objectives
assigned. The ISE line of research is based on empirical studies designed to estimate
the magnitude of the impact of the school’s results promoted by the internal and
external environmental factors.
Since its inception, this line of research has provided several findings that have
contributed to improving the knowledge and understanding of the educational
elements that affect the development of students, thus providing information for
decision making in the classroom, school, and educational system. In this regard, for
more than two decades, educational researchers, politicians, and teachers have been
concerned with what makes an efficient center, that is, the factors that contribute to
achieving higher than expected results in a particular context (Goldstein and
Woodhouse, 2000). Some studies have indicated that students’ educational and socio-
economic characteristics explain the differences in their educational level not only in
school but also between centers (Opdenakker and Van Damme, 2001; Elacqua,
Schneider and Buckley, 2006; Cervini, 2009; Thieme et al., 2013).
Despite the importance of measuring school efficiency and its many positive
externalities, researchers have not reached a consensus about the variables taken into
account in determining what makes an efficient center. In this sense, there are still
difficulties in properly defining and measuring a center’s output. There is no
consensus on the importance of school inputs in achieving results. The only area in
which there is more agreement is on the effect of the environmental inputs.
The ISE line of research can be considered classical in educational research. The
report by Coleman et al. (1966), focused on inequality problems in education,
constitutes the beginning of this line of knowledge. Since the report’s publication,
research on this topic has changed in terms of the models and analysis techniques
used, including the variables and instruments for data collection. Despite its
limitations, Coleman report led to an important research line known as “educational
production function” (Boussofiane, Dyson and Thanassoulis, 1991). Furthermore, this

8
work showed the importance of students’ socio-economic environment and its effect
on their academic performance.
Table 2 summarizes the variables used in the literature to evaluate school efficiency.
As can be seen, most papers used results from an aptitude test that was homogeneous
for all students, and this was assessed as output. Furthermore, most studies
distinguished between teachers’ qualities and schools’ physical conditions for school
inputs. Finally, the non-discretionary inputs may have different origins and can be
based on environmental factors (which include students’ personal characteristics or
their close family environment) and complexity factors (variables reflecting the
diversity in the school).
[Insert Table 2 here]
Based on the literature review and considering the theoretical approach followed, it is
possible to build a school efficiency assessment model that collects in detail all of the
variables considered. However, although it would be useful to consider all evaluable
dimensions, the model would be too complex for this study’s objective. For this
reason, we propose a simplified school efficiency assessment model that considers
only the variables used in this study (Figure 2).
[Insert Figure 2 here]
As can be seen, the proposed model includes different variables in each category, and
the unit of analysis is the school. In this regard, it should be noted that this model is
descriptive and contains elements that constituted the school’s internal and external
context. Despite its approximate nature, this model could be useful for different target
audiences (teachers, researchers, or decision makers). It is important to highlight that
we do not have any data about the cost of the center and about the students' level. In
Catalonia it is very difficult to access data at this level of analysis, and the authorities
do not provide us with this kind of information.
Outputs are conditioned by different inputs, two of them are discretionary (number of
teachers and availability of teaching innovation projects) and the remainder are non-
discretionary. Through this procedure, we do not sacrifice the education quality nor
did we modify the number of students that compose the current educational network.
The objective is to determine the overall efficiency and the possible inefficiency of
the system.

9
Likewise, outputs are measured by three indicators that are considered at the same
level. However, in the reality of a school, there is a trade-off between the number of
approved students and the average final grade. As we have no indication of which
goal is more desirable, we define them at the same level, although some centers value
one more than the other. The variable “number of students with special educational
needs” is an indicator of output complexity. In this sense, we assume that these
students require more resources and attention from the teachers.
It is also important to highlight some aspects about the inputs. Firstly, the variable
“availability of teaching innovation projects” is an input rather than an output. This
indicator expresses the existence of valuable human capital and refers to the internal
consistency among teachers of the center. It is an indicator of the quality of inputs. It
gives us an idea of the teachers’ involvement in the school. Being a binary variable,
when the value is the unity, it indicated that teachers are more involved in school
management, set goals, and initiate an improvement project. In this regard, it is
important to underline the nature of this variable. Although it is binary, it does not
divide the sample into two groups. We follow Banker and Morey’s (1986) proposal
on how to introduce categorical variables in DEA models. Once this approach is
applied we perform a lenient assessment with those schools that do not have a
teaching innovation project. These types of center are compared with similar schools.
The schools with teaching innovation projects are compared with the entire sample.
Secondly, we considered a group of variables representing the internal complexity of
the center. This set of items is designed as non-discretionary because the school
cannot influence them. As we had 14 variables for this group, we decided to reduce
their number by performing a Principal Components Analysis (PCA) and we obtain
the six factors included in Figure 2. Likewise, we had 17 variables representing the
environmental context. As previously mentioned, we applied another PCA to reduce
the variables. Finally, we obtain three factors which are related to the socio-economic
and family educational level, unemployment and the student complexity5.
5 We do not show the tables of the two PCAs carried out for spaces’ reason. This data may be obtained
from the authors upon request.

10
4. METHODOLOGY
4.1. Variables, Sample, and Data Collection
Based on the literature review, we identified a number of variables that were related to
the ISE approach (Table 3). We developed our own database with interesting
variables for the study because it was difficult to find a secondary database that
contained all of the variables considered in previous theoretical reviews. We
contacted the Consell d'Avaluació del Sistema Educatiu de la Generalitat de
Catalunya to create a more complete database.
[Insert Table 3 here]
After several consultations, we developed a database with 1,695 centers for the
academic year 2009–2010. This figure represented almost all of the centers that
existed in Catalonia. We excluded the centers that only offered special education.
Once we obtained the database, we proceeded to externally validate it through the
Inspectors d’Educació de la Generalitat de Catalunya and an internal evaluation in
which the researchers analyzed each observation. This database allowed us to achieve
the primary objective of this study.
Secondly, the education network analysis through the DEA method required a new
database that detailed the distance between schools. To do this, we again contacted the
Consell d’Avaluació. Once we had carried out the same process described above, we
obtained a matrix of distances between centers (km) composed through 5,576
observations. This database allowed us to undertake the process of reallocating the
inputs in order to establish improvement solutions.
Both databases covered a large range. It was therefore considered that the best
approach for the study’s proposed objective was to choose a specific territorial area.
This was the first approximation for the centralized evaluation. Specifically, the study
of school efficiency was applied to the centers located within the territorial area of
Vallès Occidental, which constituted a sample of 132 centers.

11
4.2. Methodological Procedure
Even though the DEA method for measuring school efficiency is extensive, most
approaches separately consider decision-making units (DMUs), which provide a
relative efficiency index for each unit against the rest. However, few studies have
applied an approach in which they studied the units together and simultaneously
projected to the efficiency frontier with an overall objective (Table 4).
[Insert Table 4 here]
There are situations in which the DMUs operate under a common centralized
direction. This type of scenario is common when all units belong to the same
organization that provides the resources needed to achieve results, as can be the case
with bank branches, hospitals, universities, schools6, or police stations. The central
authority, despite being interested in the efficiency of each unit, is also concerned
with the total consumption of inputs by different DMUs and the overall production of
outputs.
Therefore, to develop this study’s objective, we carried out an analysis of allocation
inputs that projected the units together onto the efficiency frontier. This involved
applying a particular approach called “centralized DEA” (Lozano and Villa, 2004). In
the literature, some previous approaches have considered the DMUs together. These
centralized evaluation approaches have taken different perspectives, more or less
centralized, as shown in Appendix 1. This paper extends Mar-Molinero et al.’s (2012)
approach, which was initially proposed by Lozano and Villa (2004).
This centralized DEA has different orientations depending on the pursued objective.
For example, if we want to improve the results, the correct orientation is to increase
the output. However, if we have to reduce the budget we will have to use an input
orientation. There is also another approach, known as Directional Distance Function
(DDF) (Chambers, Chung and Färe, 1996). This approach is focused on increasing the
output and reducing the input at the same time. The results of this approach are
between the extremes of the two previous approaches. The most suitable approach
depends on the specific objectives of the decision maker.
6 If we take the example of schools, we may wonder why a teacher should be valued differently in two
different schools when doing the same job in the same manner and for the same education authority. It
would be more reasonable to impose the same model on all units operating under centralized direction
(Mar-Molinero et al., 2012).

12
Let us define the three approaches. Before starting the process, it is necessary to
clarify the meaning of the sub-index that appears in the analytical development: j, r =
1, 2, ..., n: sub-index for each DMU; i = 1, 2, ..., m: sub-index for each input; k = 1, 2,
..., p: sub-index for each output; xij = amount of input i consumed by DMUj; ykj =
amount of output produced by the DMUj; θ = technical efficiency ratio; (λ1r, λ2r, ...,
λnr) = intensity vector of the inputs and outputs of each DMUr; di symbolizes the
discretionary inputs (di = 1, ..., q); while ndi represents the non-discretionary inputs
(ndi = 1, ..., s).
This process contained several stages: first, we determined the efficiency of the
current educational network of Vallès Occidental with its total number of available
centers (n = 132). We then contrasted the possibilities for optimizing the network’s
efficiency. To do this, we found the optimum number of centers that the system
should comprise for it to be efficient (n = n*). These phases were developed through a
centralized DEA program based on that proposed by Lozano and Villa (2004), which
was simplified by Mar-Molinero et al.’s (2012) approach.
In this paper, firstly we develop the original output and input models of Lozano and
Villa (2004) and then we simplify these models using the Mar-Molinero et al., (2012)
approach. Finally, we present a specific proposal of the DDF models, the proportional
DDF model (Briec, 1997).
Model phase 1/radial/output-oriented/dual (Lozano and Villa, 2004)
.,0
,,...,1,1
,...,,1,
,,...,1,
,,...,1,
:..
,.max
1
1 1 1
1 1 1
1 1 1
free
nr
pk•yy
sndixx
mixx
ts
jr
n
j
jr
n
r
n
j
n
r
krkjjr
n
r
n
j
n
j
ndijndijjr
n
r
n
j
n
j
ijijjr
(Program 1A)

13
Model phase 1/radial/input-oriented/dual (Lozano and Villa, 2004)
.,0
,,...,1,1
,...,,1,
,,...,1,
,,...,1,
:..
,.min
1
1 1 1
1 1 1
1 1 1
free
nr
pkyy
sndixx
mixx
ts
jr
n
j
jr
n
r
n
j
n
r
krkjjr
n
r
n
j
n
j
ndijndijjr
n
r
n
j
n
j
ijijjr
(Program 1B)
These models determined the network efficiency while maintaining the total number
of operational centers. The number of unknowns in these formulas was n2+1 since
each unit created n lambdas, and the overall efficiency θ was also unknown. The
number of estimated unknowns increased as a quadratic function of the number of
units. This would lead to problems if it was a relatively small sample (Mar-Molinero
et al., 2012). In this case, Mar-Molinero et al. (2012) proposed the following
simplification.
Model phase 1/radial/output-oriented/dual (Mar-Molinero et al., 2012)
.,0
,
,,...,1,
,,...,1,
,,...,1,
:..
,.max
1
11
1 1
1 1
free
n
pkyy
sndixx
qdixx
ts
j
n
j
j
n
j
j
n
j
kjj
n
j
n
j
ndijndijj
n
j
n
j
dijdijj
(Program 2A)
14
Model phase 1/radial/input-oriented/dual (Mar-Molinero et al., 2012)
.,0
,
,,...,1,
,,...,1,
,,...,1,
:..
:.min
1
11
1 1
1 1
free
n
pkyy
sndixx
qdixx
ts
j
n
j
j
n
j
j
n
j
kjj
n
j
n
j
ndijndijj
n
j
n
j
dijdijj
(Program 2B)
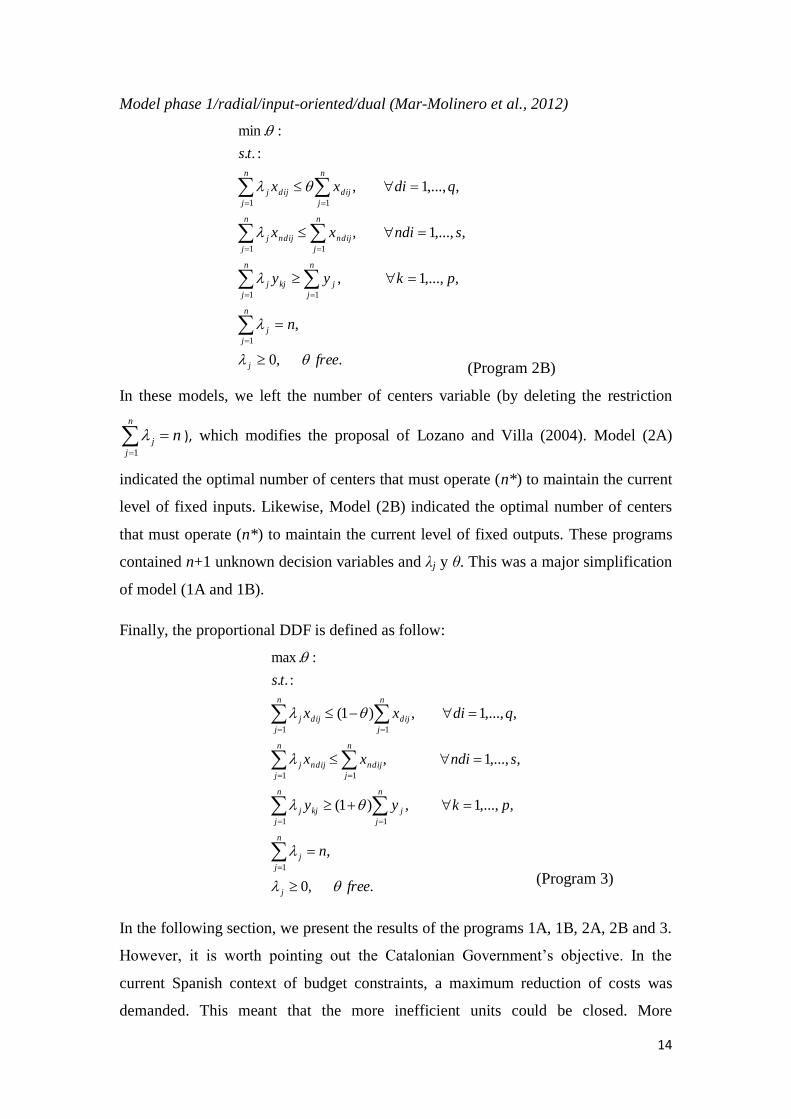
In these models, we left the number of centers variable (by deleting the restriction
n
j
j n1
), which modifies the proposal of Lozano and Villa (2004). Model (2A)
indicated the optimal number of centers that must operate (n*) to maintain the current
level of fixed inputs. Likewise, Model (2B) indicated the optimal number of centers
that must operate (n*) to maintain the current level of fixed outputs. These programs
contained n+1 unknown decision variables and λj y θ. This was a major simplification
of model (1A and 1B).
Finally, the proportional DDF is defined as follow:
.,0
,
,,...,1,)1(
,,...,1,
,,...,1,)1(
:..
:.max
1
11
1 1
1 1
free
n
pkyy
sndixx
qdixx
ts
j
n
j
j
n
j
j
n
j
kjj
n
j
n
j
ndijndijj
n
j
n
j
dijdijj
In the following section, we present the results of the programs 1A, 1B, 2A, 2B and 3.
However, it is worth pointing out the Catalonian Government’s objective. In the
current Spanish context of budget constraints, a maximum reduction of costs was
demanded. This meant that the more inefficient units could be closed. More
(Program 3)
15
specifically, in September 2012, the Catalan Government revealed the required cut to
be applied in the educational budget. In the present academic year Catalonia has
30,000 more students and 3,000 less teachers. The budget of the department of
education of Catalonia is 4,335 million euros. This figure reduces educational
spending to the level it was at in 2007. Because the government’s objective is to cut
the budget for education, the most appropriate model to reflect this target is program
2B. This model tells us the optimum number of centers that should make up the
education network in order to reduce costs and become more efficient.
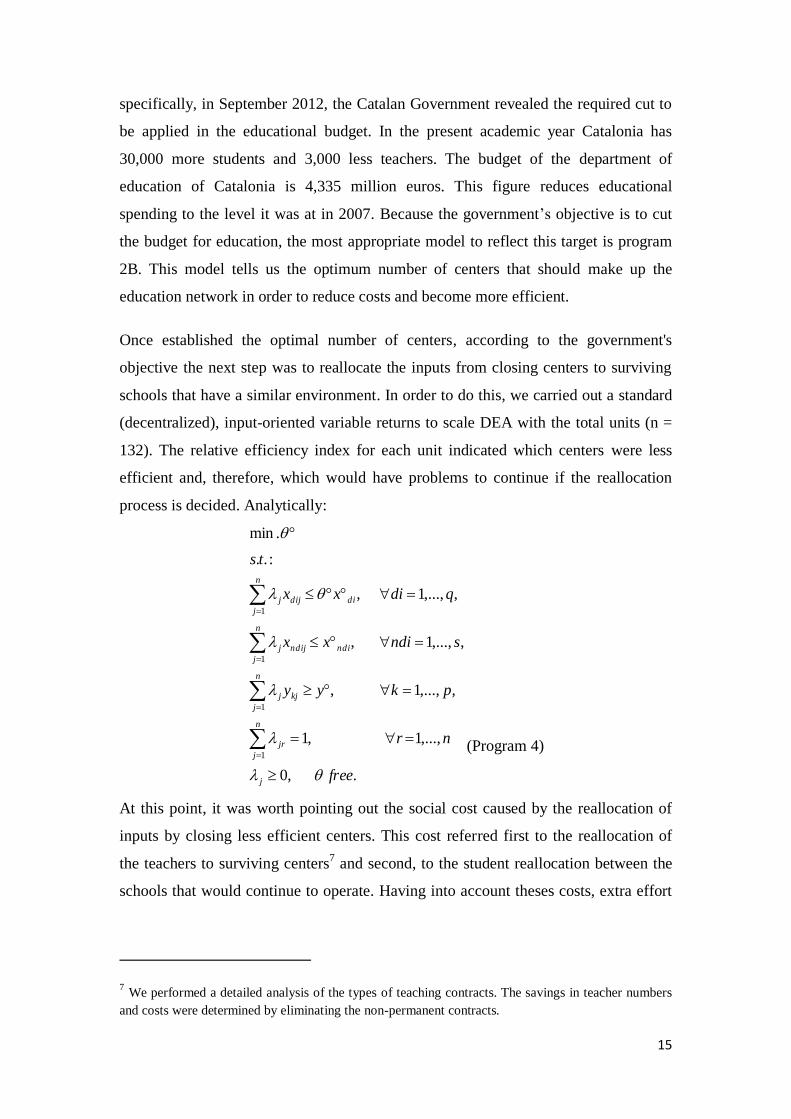
Once established the optimal number of centers, according to the government's
objective the next step was to reallocate the inputs from closing centers to surviving
schools that have a similar environment. In order to do this, we carried out a standard
(decentralized), input-oriented variable returns to scale DEA with the total units (n =
132). The relative efficiency index for each unit indicated which centers were less
efficient and, therefore, which would have problems to continue if the reallocation
process is decided. Analytically:
.,0
,...,1,1
,,...,1,
,,...,1,
,,...,1,
:..
.min
1
1
1
1
free
nr
pkyy
sndixx
qdixx
ts
j
n
j
jr
n
j
kjj
n
j
ndindijj
n
j
didijj
(Program 4)
At this point, it was worth pointing out the social cost caused by the reallocation of
inputs by closing less efficient centers. This cost referred first to the reallocation of
the teachers to surviving centers7 and second, to the student reallocation between the
schools that would continue to operate. Having into account theses costs, extra effort
7 We performed a detailed analysis of the types of teaching contracts. The savings in teacher numbers
and costs were determined by eliminating the non-permanent contracts.
16
was applied to minimize these side effects, attempting to minimize the possible
associated transportation costs.
The proposed reallocation process was conducted as follows. First, we proceeded to
compare each school that would survive with a more efficient peer. Once identified
the best performing center, we calculated the differences in terms of students and
teachers with respect to benchmark for each center that would still be operational.
From this procedure, we knew the reception capacity of students and teachers for each
school that would comprise the new network. Then, we calculated the distance
between each inefficient center and the rest of the sample. Subsequently, we listed the
distances in ascending order to reallocate students and teachers in the closest centers
possible.
The direction of the reallocation differed for students and teachers. In the case of the
students, this was performed in order of efficiency, that is, we reallocated the students
of the lowest inefficient centers first. In the case of the teachers, those who had to be
reallocated were moved to the nearest and most unbalanced center. The process was
the same for each center that was to close. This was an iterative and dynamic process,
so after the reallocation of the inputs of each inefficient center, we proceeded to
recalculate the reception capacity of other schools. This process is shown graphically
in the following diagram (Figure 3).
[Insert Figure 3 here]
The development of the above techniques was performed through specific routines
using the optimization package, GAMS (General Algebraic Modeling System).
5. RESULTS AND DISCUSSION
Table 5 summarizes the results of all the programs. As can be observed, the columns
indicate the program for each case. If we take the output orientation models, the
network’s inefficiency level is higher in the case of program 2A than in 1A. In the
former, outputs can be increased by 16.24 % without consuming more inputs, while in
the latter the required output increase is 15.93 %. These figures mean that the network
is not operating efficiently, so the students’ results can be increased without
consuming more inputs. By looking at these results in more detail, it can be seen that,

17
in order to minimize the cost per center, it is more efficient to copy the best schools.
The cloned centers were the peers in terms of size and socio-economic environment.
In this regard, the units cloned in program 1A are unit 19 (75 times) and unit 31 (57
times). On the other hand, the unit cloned in program 2A is only unit 19 (127 times).
So in this last program, the network should include only 127 schools instead of 132.
This situation would mean that five centers have to be closed.
If we move to the input oriented assessment, we find similar results. The network is
not efficient. In program 1B, the efficiency of the network is 0.8795, that is, it showed
that we could obtain the same system outputs even saving 12.05% of the discretionary
inputs. Otherwise, in the Mar-Molinero et al. (2012) program (2B) the network
operates with 86.03% efficiency. Later on we will go into more detail about this
program and the peer to be cloned.
Finally, the last option to obtain better results in the network is to maximize the output
and at the same time minimize the inputs. This alternative is represented by the DDF
model. If we look at the model 3A, keeping the number of centers constant, it is
possible to increase the outputs and reduce the inputs both by 6.89 %. However, if we
want to optimize the network’s overall efficiency we should keep the number of units
free. In this case, we can increase the outputs and reduce the inputs both by 7.51 %.
Once explained the results of the different programs, and following the Catalonia
government’s strategy, we expand now the specific results for the application of
programs 1B and 2B (Table 6). The columns indicate the number of centers for each
case. The most important columns are columns 4 and 6. When we applied program
(1B), we obtained the result in column 6. As we said before, the overall efficiency of
the group was 0.8795, that is, it showed that we could obtain the same system outputs
even if we saved 12.05 % of the controllable inputs.
[Insert Table 5 here]
However, as indicated above, this model included an unjustified restriction. It sought
to minimize the controllable input while keeping the total number of centers. Mar-
Molinero et al. (2012) suggested that there are situations in which the central
authority can change the inputs’ assignment by closing the most inefficient units or
opening new units. In the current context of budget constraints, the Catalonian
Government was requested that the maximum reduction of costs be achieved so the

18
more inefficient units could be closed. To do this, we ran program (2B) by changing
the value of n each time (range from n = (0.7)n to n = (1.8)n). Feasible solutions did
not exist for n < (0.7)n, and n > (1.8)n. This meant that it would be impossible to
obtain the current output level with less than 93 centers.
Although n = 132 was a feasible solution, it was possible to improve the results if we
reduced the number of operational centers. The global minimum (θ = 0.8603) was
reached when n = 109 centers (the cloned unit was unit 19 (109 times) (column 4 of
Table 6)). Thus, we can say that unit 19 was an ideal center for the system, and it
should be taken as the benchmark.
If we examine the main features of the center 19, we can observe that it is a big school
that obtains very good marks, despite the significant number of students with special
educational needs. Furthermore, the families' socio-economic level is high. However
the unemployment level is also high. Observing the internal features of the center, we
can describe the typology of the students and teachers. Specifically, the students'
complexity level is low, as we find few foreign students and students with special
economic needs. Likewise, it is a center with a low student mobility level. The student
and teacher absenteeism level is also low. Finally, it is a relatively new center. In its
seven years of operation, it has only had one change in the management team, so it
can be described as a stable center.
We obtained an important finding from this result: when we reallocated the excess
inputs of the 23 centers that closed, enlarging the remaining centers, we demonstrated
the existence of increasing returns to scale. That is, the 109 operating centers received
students and teachers. We achieved a result with schools with more students per
teacher ratio but without altering the results obtained by the students. This result is in
line with the strategy announced by the Catalonian Department of Education.
However, the proposed model is selective with the redirection of the budget.
Indiscriminate cuts are not performed to all network centers, we only penalize those
who perform worse.
From the methodological point of view, we found that the existence of variable
returns to scale (VRS) was demonstrated by observing the result compared to the
inefficient units. Analytically, we left the Σλ restriction free and not equal to 1

19
(Lozano and Villa, 2004) or n (Mar-Molinero et al., 2012): Σλ = n variable, where 0 ≤
n ≤ ∞.
In short, the method for optimizing the efficiency of the education network in the area
of Vallès Occidental is to increase the centers’ size. This management mechanism
would introduce internal competition between schools, and those that did not achieve
good results would be penalized. Through this process, we have created a
performance-based scheme of regulation that introduces incentives and motivates the
effective performance of schools. In turn, it achieves better coordination between
public entities and greater accountability and transparency between them (Walker and
Boyne, 2006). As can be seen, the results link with post-NPM. We would achieve an
administrative structural reorganization. The schools would improve their
performance in order to reduce costs, budget allocations and improve efficiency
(Zafra-Gómez et al., 2012). Figure 4 shows the solutions presented in Table 6. The
vertical line represents the current number of schools that make up the network. As
can be seen, the maximum saving on inputs occur when there are 109 operational
centers.
[Insert Figure 4 here]
The next step was to reallocate the students and teachers of the 23 centers that were to
close. A total of 8,263 students were reallocated from nearby schools considering that
no student should have to walk, in mean, more than four kilometers. Meanwhile, the
total number of teachers in the Vallès Occidental area was 3,789. Program (2B)
established that it was possible to save 13.97% of the controllable input without losing
outputs. This percentage represented 529 teachers. The total number of teachers from
the 23 centers that were to close was 675, 146 of whom were reallocated to nearby
and unbalanced schools, because the remaining teachers were non-permanent and near
retirement age. Appendix 2 summarizes the reassignment process that considered the
shortest distance of each inefficient center from the rest of the sample.
Despite the efficiency of this form of education system reorganization, it was still
restrictive. It forced the closure of the worst performing schools. It should be noted
that there are other forms of management that could improve the results of the current
educational network without any center needing to close. A viable alternative would

20
be decentralization, which is more in line with NPM (Behn, 2003), that is, giving
freedom and information to economic agents (the parents) to choose schools.
The way to allow this choice lies in transparency and accountability. For example, if
the Spanish centers were to provide more information to parents, they could make
better decisions8. An example, already implemented in the United States, is the
publication of the inspectors’ evaluation reports (Roderick, Jacob and Bryk, 2002). A
further example is in the United Kingdom where the Office for Standards in
Education (OFSTED) publishes the inspection reports annually9. This mechanism
introduces competence and motivates the centers to work effectively without
penalizing them. The publication of such reports disciplines the centers, because they
are aware of the consequences of poor performance (parents do not choose them, and
they cannot be sustained in the future).
Notwithstanding the importance of this issue, the limitations of the Spanish education
system (its scoring and distance systems) and the objective of this study prevented us
from addressing it more deeply. For this reason, this issue will be analyzed in
subsequent extensions of this study.
6. CONCLUSIONS, IMPLICATIONS, AND LIMITATIONS
This paper answers the question about the efficiency level of a specific public
education network in Spain and, if necessary, how to optimize its performance
through a new methodological approach. As we have seen, the DEA method (Charnes
et al., 1978) has become one of the most widely used techniques for measuring school
efficiency (Smith and Mayston, 1987; Thieme et al., 2013); however, centralized
DEA is comparatively less popular among researchers.
In this line of research, Lozano and Villa (2004) made a significant contribution. They
designed a centralized DEA model that equally valued all the inputs and outputs
regardless of the units that were used or produced. Subsequently, Mar-Molinero et al.
(2012) showed that this DEA model could be considerably simplified. This paper
8 However, the public education system in Spain is highly regulated by scoring and distance systems
(the latter measuring the distance from the students’ place of registration). 9 For further information, the reader can visit OFSTED’s website: http://www.ofsted.gov.uk/

21
applied such a simplification and went a step further, that is, it found the existence of
VRE by observing the result compared to the inefficient units (Σλ free).
We present different approaches in order to obtain efficiency improves inside the
network. However, if we take the Catalonia government strategy, the better option is
to follow an input orientation. This approach allows reduce inputs without lose
outputs. The results for this type of program indicate that, for the analyzed sample, the
current educational network is inefficient. Specifically, without modifying the results
obtained by the students, the school system could save 12.05% of its inputs. To
improve efficiency without losing outputs, the system should comprise by 109
centers, which would mean a saving of 13.97% of the inputs. This excess could be
distributed to centers with the capacity for more students and teachers, considering the
distance constraints between them. Therefore, the best option for improving
educational efficiency in this area is to create larger centers.
These conclusions have important implications for management practices. They
establish the actions that would be necessary in order optimize the network and to
optimally redistribute the budget available. Thus, the central authority would have an
objective justification for strengthening the efficient units and negative incentives for
supporting less efficient units. This study goes beyond a methodological application
of a data set: it is a proposed implementation involving a real case, so the applicability
of the results is very illustrative.
As indicated in the introduction, the current Spanish system does not encourage
schools to work effectively, so we need a reorganization that would motivate them to
efficiently achieve good results. The proposed approach would create a performance-
based scheme of regulation that would introduce a number of rules and encourage
effective functioning. In turn, it would achieve better coordination between state
schools and greater accountability and transparency (Walker and Boyne, 2006). As
can be seen, the results are in line with the strategy being followed by Catalonia and
the theoretical principles of post-NPM. We would obtain a structural reorganization of
the administration so schools could improve their performance in order to reduce
costs and improve their efficiency. The introduction of these incentives would help
the centers to be more efficient and would allow them to survive over time (Burgess
and Rato, 2003; Heinrich and Marschke, 2009). In this regard, this paper presents an
22
important theoretical contribution to the literature because, to date, we have not found
any papers that have addressed the study of school efficiency under this framework.
Despite the theoretical and practical implications, the paper has some limitations that
should be noted. First, the unit of analysis was a school. Thus, it would be very
interesting to have student-level data and, when possible, the distance walked by the
students from their residence to their school. We could then clearly outline the process
of reallocation. Moreover, we considered data for only one annual session of the
school. For further applications, it would be very fruitful to undertake a longitudinal
analysis of various academic years. We could carry out an evaluation of the added
value for schools.
7. REFERENCES
Asmild, M., Paradi, J. C. and Pastor, J. T. (2009), “Centralized Resource Allocation
BCC Models”, Omega. The International Journal of Management Science, 37,
40-49.
Athanassopoulos, A. D. (1995), “Goal Programming & Data Envelopment Analysis
(GoDEA) for Target-Based Multi-Level Planning: Allocating Central Grants to
the Greek Local Authorities”, European Journal of Operational Research, 87,
535-550.
Bacdayan, A. W. (1997), “A Mathematical Analysis of the Learning Production
Process and a Model for Determining What Matters In Education”, Economics
of Education Review, 16(1), 25-37.
Balaguer-Coll, M. and Prior, D. (2009), “Short and Long-Term Evaluation of
Efficiency and Quality. An Application to Spanish Municipalities”, Applied
Economics, 41(23), 2991-3002.
Banker, R. D. and Morey R. (1986), “The Use of Categorical Variables in Data
Envelopment Analysis”, Management Science, 32(12), 1613-1627.
Beasley, J. E. (2003), “Allocating Fixed Costs and Revenues via Data Envelopment
Analysis”, European Journal of Operational Research, 147, 198-216.
Behn, R. (2003), “Why Measure Performance? Different purposes require different
measures”, Public Administration Review, 63(5), 586-606.
Bel, G., Fageda, X. and Warner, M. (2010), “Is Private Production of Public Services
Cheaper Than Public Production? A Meta-Regression Analysis of Solid Waste
and Water Services”, Journal of Public Policy and Management, 29(3), 553-
577.
Bessent, A. M. and Bessent, E. W. (1980), “Determining the Comparative Efficiency
of Schools through Data Envelopment Analysis”, Educational Administration
Quarterly, 16(2), 57-75.
Bessent, A. M., Bessent, E. W., Kennington, J. and Reagan, B. (1982), “An
Application of Mathematical Programming to Assess Productivity in the
Houston Independent School District”, Management Science, 28(12), 1355-
1367.
23
Bifulco, R. and Bretscheneider, S. (2001), “Estimating School Efficiency. A
Comparison of Methods Using Simulated Data”, Economics of Education
Review, 20(5), 417-429.
Blau, F. (1996), “Symposium on Primary and Secondary Education”, Journal of
Economic Perspectives, 10(4), 3-8.
Boussofiane, A., Dyson, R. G. and Thanassoulis, E. (1991), “Applied Data
Envelopment Analysis”, European Journal of Operational Research, 15(5), 1-
15.
Briec, W. (1997), “A Graph-Type Extension of Farrell Technical Efficiency
Measure”, Journal of Productivity Analysis, 8(1), 95-110.
Burgess, S. and Rato, M. (2003), “The Role of Incentives in the Public Sector: Issues
and Evidence”, Oxford Review of Economic Policy, 19(2), 285-300.
Cervini, R. A. (2009), “Class, School, Municipal, and State Effects on Mathematics
Achievement in Argentina: A Multilevel Analysis”, School Effectiveness and
School Improvement, 20(3), 319-340.
Chambers, R. G.; Chung, Y. and Färe, R. (1996), “Benefit and Distance Functions”,
Journal of Economic Theory, 70(2), 407-419.
Charnes, A., Cooper, W. W. and Rhodes, E. (1978), “Measuring the efficiency of
Decision Making Units”, European Journal of Operational Research, 2(6), 429-
444.
Christensen, T. and Lægreid, P. (2007), “The Whole of Government Approach to
Public Sector Reform”, Public Administration Review, 67(6), 1059-1066.
Christensen, T. and Lægreid, P. (2007) (2), “Reformas Post Nueva Gestión Pública:
Tendencias Empíricas y Retos Académicos”, Gestión Política y Pública, 16(2),
539-564.
Christensen, T. Lie, A. and Laegreid, P. (2007), “Still Fragmented or Reassertion of
the Centre? In T. Christensen and P. Laegreid (Eds.), Trascending new public
management (pp. 17-42). Aldershot, UK: Ashgate.
Christensen, T. and Lægreid, P. (2008), “NPM and Beyond – Structure, Culture and
Demography”, International Review of Administrative Science, 74, 7-23.
Coleman, J. S., Campbell, E. Q. and Hobson, C. J. (1966), “Equality of Educational
Opportunity”, Washington DC: Government Printing Office.
Cordero, J. M., Pedraja, F. and Salinas, J. (2008), “Measuring Efficiency in
Education: An Analysis of Different Approaches for Incorporating Non-
Discretionary Inputs”, Applied Economics, 36(10), 1323-1339.
Cordero, J. M., Pedraja, F. and Santín, D. (2009), “Alternative Approaches to Include
Exogenous Variables in DEA Measures: A Comparison using Monte Carlo”,
Computers & Operations Research, 36(10), 2699-2706.
Cordero, J. M., Pedraja, F. and Santín, D. (2010), “ Enhacing the inclusión of non-
discretionary inputs in DEA”, Journal of the Operational Research Society, 61,
574-584.
De Witte, K., Thanassoulis, E., Simpson, G., Battisti, G. and Charlesworth-May, A.
(2010), “Assessing Pupil and School Performance by Non-Parametric and
Parametric Techniques”, Journal of the Operational Research Society, 61 (8),
1224-1237.
Deller, S. C. and Rudnicki, E. (1993), “Production Efficiency in Elementary
Education. The Case of Maine Public School”, Economics of Education Review,
12(1), 45-57.
Dent, M. (2005), “Post-New Public Management in public sector hospitals? The UK,
Germany and Italy”, Policy and Politics, 33(4), 623-636.

24
Dewey, J., Husted, T. and Kenny, L. (2000), “The Ineffectiveness of School Inputs: A
Product of Misspecification?” Economics of Education Review, 19, 27-45.
Diefenbach, T. (2009), “New Public Management in Public Sector Organizations: The
Dark Sides of Managerialist Enlightenment”, Public Administration, 87(4), 892-
909.
Ehrenberg, R. G. and Bewer, D. J. (1994), “Do School and Teacher Characteristics
Matter? Evidence from High School and Beyond”, Economics of Education
Review, 13(1), 1-17.
Elacqua, G., Schneider, M. and Buckley, J. (2006), “School choice in Chile: Is it class
or the classroom?” Journal of Policy Analysis and Management, 25(3), 577-
601.
Fang, L. and Zhang, C. Q. (2008), “Resource Allocation Based on the DEA Model”,
Journal of the Operational Research Society, 59, 1136-1141.
Färe, R., Grabowski, R., Grosskopf, S. and Kraft, S. (1997), “Efficiency of a Fixed
but Allocatable Input: A Non-Parametric Approach”, Economic Letters, 56,
187-193.
Färe, R., Grosskopf, S., Kerstens, K., Kirkley, J. E. and Squires, D. (2000),
“Assessing Short-Run and Medium-Run Fishing Capacity at the Industry Level
and Its Reallocation”, in: Microbehavior and Macroresults: Proceedings of the
Tenth Biennial Conference of the International Institute of Fisheries Economics
and Trade (IIFET), July 10-14, Corvallis, Oregon, USA.
Farrell, M. J. (1957), “The Measurement of Productive Efficiency”, Journal of the
Royal Statistical Society, Series A, 120, 21-35.
Giménez-García, V. M., Martínez-Parra, J. L. and Buffa, F. P. (2007), “Improving
Resource Utilization in Multi-Unit Networked Organizations: The Case of a
Spanish Restaurant Chain”, Tourism Management, 28, 262-270.
Golany, B., Phillips, F. Y. and Rousseau, J. J. (1993), “Models for Improved
Effectiveness Based on DEA Efficiency Results”, IIE Transactions, 25(6), 2-10.
Golany, B. and Tamir, E. (1995), “Evaluating Efficiency-Effectiveness-Equality
Trade-offs: a Data Envelopment Analysis approach”, Management Science,
41(7), 1172-1184.
Goldstein, H. and Woodhouse, G. (2000), “School Effectiveness Research And
Educational Policy”, Oxford Review of Education, 26(3), 353-363.
Hafsteinsdottir, E. J. G. and Siciliani, L. (2012), “Hospital Cost Sharing Incentives:
Evidences from Iceland”, Empirical Economics, 42(2), 539-561.
Hanushek, E. A. (1971), “Teachers’ Characteristics and Gains in Student
Achievement: Estimating Using Micro Data”, American Economic Review,
61(5), 280-288.
Hanushek, E. A. (1986), “The Economics of Schooling: Production and Efficiency in
Public Schools”, Journal of Economics Literature, 90(5), 1184-1208.
Heckman, J. J., Heinrich, C. J. and Smith, J. A. (1997), “Assessing the performance of
performance standards in public bureaucracies”, American Economic Review,
87(2), 389-395.
Heinrich, C. J. and Marschke, G. (2009), “Incentives and their dynamics in public
sector performance management systems”, working paper.
Instituto Nacional de Estadística (INE) (2011), INE Base, estadísticas.
Ito, R., Namatame, T. and Yamaguchi, T. (1999), “Resource Allocation Problem
Based on the DEA Model”, Journal of the Operations Research Society of
Japan, 42(2), 149-166.

25
Johnson, A. L. and Ruggiero, J. (2011), “Nonparametric Measurement of Productivity
and Efficiency in Education”, Annals of Operations Research, forthcoming.
DOI 10.1007/s10479-011-0880-9.
Kinder, T. (2012), “Learning, Innovating and Performance in Post-New Public
Management of Locally Delivered Public Services”, Public Management
Review, 14(3), 403-428.
Krueger, A. B. and Lindahl, M. (2001), “Education and Growth: why and for whom?”
Journal of Economic Literature, 39, 1101-1136.
Kuhlmann, S. (2010), “New Public Management for the Classical Continental
European Administration: Modernization at the Local Level in Germany, France
and Italy”, Public Administration, 88(4), 1116-1130.
Kumar, C. K. and Sinha, B. K. (1999), “Efficiency Based Production Planning and
Control Methods”, European Journal of Operational Research, 117, 450-469.
Li, S. K. and Ng, Y. Ch. (1995), “Measuring the Productive Efficiency of a Group of
Firms”, International Advances in Economic Research, 1(4), 377-390.
Li, X. Y. and Cui, J. C. (2008), “A Comprehensive DEA Approach for the Resource
Allocation Problem based on Scale Economies Classification”, Journal of
System Science & Complexity, 21(4), 540-557.
Lozano, S. and Villa, G. (2004), “Centralized Resource Allocation Using Data
Envelopment Analysis”, Journal of Productivity Analysis, 22, 143-61.
Lozano, S., Villa, G. and Adenso-Diaz (2004), “Centralized Target Setting for
Regional Recycling Operations Using DEA”, OMEGA, The International
Journal of Management Science, 32, 101-110.
Lozano, S. and Villa, G. (2005), “Centralized DEA Models with the Possibility of
Downsizing”, Journal of the Operational Research Society, 56, 357-364.
Lozano, S., Villa, G. and Braennlund, R. (2009), “Centralized Reallocation of
Emission Permits using DEA”, European Journal of Operational Research,
193, 752-760.
Lozano, S., Villa, G. and Canca, D. (2011), “Application of Centralized DEA
Approach to Capital Budgeting in Spanish Ports”, Computers & Industrial
Engineering, 60, 455-465.
Madaus, G. F., Kellaghan, T., Rakow, E. A. and King, D. J. (1979), “The Sensitivity
of Measures of Schools’ Effectiveness”, Harvard Educational Review, 49(2),
207-230.
Mancebón, M. J. and Mar-Molinero, C. (2000), “Performance in primary schools”,
Journal of the Operational Research Society, 51, 843-854.
Mancebón, M. J. and Muñiz, M. (2008), “Private versus Public High Schools in
Spain: Disentangling Managerial and Programme Efficiencies”, Journal of the
Operational Research Society, 59(7), 892-901.
Mar-Molinero, C., Prior, D., Segovia, M. M. and Portillo, F. (2012), “On Centralized
Resource Utilization and its Reallocation by using DEA”, Annals of Operations
Research, DOI: 10.1007/s10479-012-1083-8.
Mizala, A., Romaguera, P. and Farren, D (2002), “The technical efficiency of schools
in Chile”, Applied Economics, 34(12), 1533-1552.
Muñiz, M. (2002), “Separating Managerial Inefficiency and External Conditions in
Data”, European Journal of Operational Research, 143(3), 625-643.
Muñiz, M., Paradi, J., Ruggiero, J. and Yang, Z. (2006), “Evaluating Alternative DEA
Models used to Control for Non-Discretionary Inputs”, Computers and
Operations Research, 33, 1173-1183.
Nesterenko, V. and Zelenyuk, V. (2007), “Measuring Potential Gains From
Reallocation of Resources”, Journal of Productivity Analysis, 28, 107-116.

26
Opdenakker, M. C. and Van Damme, J. (2001), “Relationship between School
Composition and Characteristics of School Process and their Effect on
Mathematics Achievement”, British Educational Research Journal, 27(4), 407-
432.
Ouellette, P. and Vierstraete, V. (2005), “An Evaluation of the Efficiency of Québec
School Boards using Data Envelopment Analysis Method”, Applied Economics,
37(14), 1643-1653.
Ouellette, P. and Vierstraete, V. (2010), “Malmquist Indexes with Quasi-fixed Inputs:
An Application to School Districts in Québec”, Annals of Operations Research,
173(1), 57-76.
Pepin, B. (1999), “Mobility of Mathematics Teachers across England, France and
Germany”, European Educational Researcher, 5(1), 5-15.
Pérez, G., Ortiz, D., Zafra-Gómez, J. L. and Alcaide, L. (2011), “De la New Public
Management a la Post New Public Management, evolución de las reformas en la
gestión de las administraciones públicas españolas”, Revista de Contabilidad y
Dirección, 13, 129-150.
Phillips, M. (1997), “What Makes Schools Effective? A Comparison of the
Relationships of Communitarian Climate and Academic Climate to
Mathematics Achievement and Attendance during Middle School”, American
Educational Research Journal, 34(4), 633-662.
Pollitt, C. (2009), “Bureaucracies Remember, Post-Bureaucratic Organizations
Forget?” Public Administration, 87(2), 198-218.
Ray, S. C. (1991), “Resource Use Efficiency in Public Schools: A Study of
Connecticut Data”, Management Science, 37(12), 1620-1628.
Roderick, M., Jacob, B. A. and Bryk, A. S. (2002), “The impact of high-stakes testing
in Chicago on student achievement in the promotional gate grades”,
Educational Evaluation and Policy Analysis, 24(4), 333-357.
Ruggiero, J. (1998), “Non-Discretionary Inputs in Data Envelopment Analysis”,
European Journal of Operational Research, 111, 461-469.
Ruggiero, J., Duncombe, W. and Miner, J. (1995), “On the Measurement and Causes
of Technical Inefficiency in Local Public Services: With an Application to
Public Education”, Journal of Public Administration Research and Theory,
5(4), 403-428.
Silva-Portela, M. C. A. and Camacho, A. S. (2010), “Analysis of Complementary
Methodologies for the Estimation of School Value Added”, Journal of the
Operational Research Society, 61(7), 1122-1132.
Silva-Portela, M. C. A. and Thanassoulis, E. (2001), “Decomposing School and
School-Type Efficiency”, European Journal of Operational Research, 132,
357-373.
Smith, P. and Mayston, D. (1987), “Measuring Efficiency in the Public Sector”,
OMEGA International Journal of Management Science, 15(3), 181-189.
Thanassoulis, E. (1993), “A Comparison of Regression Analysis and Data
Envelopment Analysis as Alternative Methods for Assessing Performance”,
Journal of the Operational Research Society, 44, 1129-1145.
Thanassoulis, E. (1999), “Setting Achievements Targets for School Children”,
Education Economics, 7(2), 101-119.
Thanassoulis, E. and Dunstan, P. (1994), “Guiding Schools to Improved Performance
Using Data Envelopment Analysis: An Illustration with Data from Local
Education Authority”, Journal of the Operational Research Society, 45(11),
1247-1262.

27
Thanassoulis, E. and Silva-Portela, M. C. A. (2002), “School Outcomes: Sharing the
Responsibility between Pupil and School”, Education Economics, 10(2), 183-
207.
Thieme, C., Prior, D. and Tortosa-Ausina, E. (2013), “A Multilevel Decomposition of
School Performance Using Robust Nonparametric Frontier”, Economics of
Education Review, 32, 104-121.
Walker, R. M. and Boyne, G. A. (2006), “Public Management Reform and
Organizational Performance: An empirical assessment of the U.K. Labour
government’s public service improvement strategy”, Journal of Policy Analysis
and Management, 25(2), 371-393.
Wu, J. and An, Q. X. (2012), “New Approaches for Resource Allocation via DEA
Models”, International Journal of Information Technology & Decision Making,
11(1), 103-117.
Zafra-Gómez, J. L., Prior, D., Plata, A. M. and López-Hernández, A. M. (2012) (1),
“Reducing costs in times of crisis: delivery forms in small and medium sized
local governments’ waste management services”, Public Administration,
forthcoming DOI: 10.1111/j.1467-9299.2011.02012.x.
Zafra-Gómez, J. L.; Rodríguez, M. P. and Alcaide, L. (2012) (2), Contrasting New
Public Management (NPM) Versus Post-NPM through Financial Performance:
A Cross-Sectional Analysis of Spanish Local Governments, Administration and
Society, DOI: 10.1177/0095399711433696.

28
Appendix 1. Resources reallocation and centralized DEA studies
AUTHORS METHODOLOGY VARIABLES
Golany, B., Phillips, F. Y. and Rousseau, J. J. (1993)
Input-oriented linear program for reallocation. From solving a DEA additive, they create a model to achieve an overall efficiency index. They use the efficiency index series and the
average productivity of each DMU to see the change in system performance.
Numerical example with two inputs, two outputs and 10 units.
Golany, B. and Tamir, E.
(1995)
Output-oriented DEA program for reallocation. Model for achieving overall efficiency index
by setting a restriction on the upper limit of available resources. The model allows variations
on the limits.
Numerical example with two inputs, two outputs and
20 units.
Li, S. K. and Ng, Y. Ch.
(1995)
They use a centralized DEA. The inputs and outputs reallocation are introduced in all units.
The number of DMUs remains constant.
They compared the results in two different samples:
20 public hospitals in Hong Kong and 26 public
textile companies.
Athanassopoulos, A. D. (1995) He uses a centralized DEA combined with Goal Programming (GoDEA). The inputs and outputs reallocation is introduced in all units. The number of DMUs remains constant. He
uses a sample of 62 local authorities in Greece.
Three discretional inputs (salary costs, maintenance and loans) and three discretional outputs (local taxes
and charges, investment expenditure and service
delivery).
Färe, R., Grabowski, R.,
Grosskopf, S. and Kraft, S.
(1997)
Output-oriented DEA Model with two steps. The model allows the reallocation of a fixed
amount of shared inputs.
The authors reallocated types of land for different
crops.
Kumar, D. K. and Sinha, B. K.
(1999)
Two DEA programs (one input-oriented and one output-oriented) for a multi-period model of
production that considers each time period as a DMU. The objective function is presented as
the period’s average efficiency.
Numerical example with two inputs, two outputs and
five DMUs (time periods).
Ito, R., Namatame, T. and
Yamaguchi, T. (1999)
Firstly, they measure the efficiency of the current activity of each DMU. Then, they estimate
the management resources to reallocate to maximize results. They take into account the
current activity of the DMU, where it is assumed that the DEA’s efficient frontier is a mutually-exclusive proposal for each DMU.
The theoretical development is illustrated with
several hypothetical examples.
Färe, R., Grosskopf, S.,
Kerstens, K., Kirkley, J. E. and
Squires, D. (2000)
DEA with data panel (1987-1990) about the activity of nine boats. One output, two inputs (days at sea and man/days), a
fixed factor (boat characteristics) and an allocable
factor (stock abundance).
Beasley, J. E. (2003) Nonlinear reallocation model with the objective of maximizing the period average. The approach is based on the radial model and it requires specific upper limits over the total
number of inputs and outputs.
Theoretical examples with two inputs and one output.
Lozano, S., Villa, G. and
Adenso-Diaz, B. (2004)
They use a DEA in two stages: in the first, they maximize the added output (total of recycled
glass in all municipalities), while in the second they maximize the slack of the aggregate controllable input (number of containers). Alternatively, they develop a parallel model
wherein the objective function is to minimize the number (integer) of containers without
changing the total amount of recycled glass.
Glass recycling operations in 62 municipalities of
Asturias. The inputs are the number of glass containers assigned to each municipality and the
population and the number of bars and restaurants in
town. The number of containers is the discretional
factor, the other two are considered not controllable environmental.

29
AUTHORS METHODOLOGY VARIABLES
Lozano, S. and Villa, G.
(2004)
Centralized DEA model (input orientation, primal and dual, radial and non-radial, in two
stages) and then, they propose an example obtained from the literature (Golany et al., 1993) with two inputs, two outputs, and 10 units.
XY problem: one input and one output, 7 DMUs.
XX1 problem: two inputs and one output, 7 DMUSs. Literature problem: two inputs and two outputs, 10
DMUs.
Lozano, S. and Villa, G.
(2005)
Centralized DEA models with possibility of downsizing (three stages) and then, they propose
an example from the literature (Golany et al., 1993) with two inputs, two outputs and 10 units.
Two inputs and two outputs, 10 DMUs. Once the
program is proposed, they apply the three explained models.
Giménez-García, V. M.,
Martínez-Parra, J. L. and
Buffa, F. P. (2007)
They use a centralized DEA model in three stages. The reallocation of inputs and outputs is
introduced in the efficient units. Number of DMUs remains constant. The sample consists of
54 fast food restaurants in Spain. The analysis period runs from October 2001 to May 2002.
Output variables: sales (millions of €) and the quality
index for each restaurant (0 to 100). Inputs that can
be reallocated: total number of waiters and kitchen staff. Non-reallocated inputs: the number of seats
and the number of server counters. The non-
controllable inputs: location, number of competitors
and ticket price paid by consumers. Nesterenko, V. and Zelenyuk
V. (2007)
They use a centralized DEA. The inputs and outputs reallocation is introduced in the efficient
units. They introduce non-transferable variables. The final number of units can vary.
The sample is composed of simulated data from 20
units with two inputs and two outputs (taken from a
previous study). The authors use two measures of
inputs (X1 and X2) and two outputs (Y1 and Y2).
Fang, L. and Zhang, C. Q. (2008)
Centralized DEA model. The proposed program solves two objective functions, one concerning the overall efficiency and the other concerning the individual DMU: multi-
objective programming.
Sample of 10 units (fire offices) with two outputs (proportion of lives saved over lives at risk and
number of emergency calls) and two inputs (number
of firefighters and amount of expenditure) obtained
from the fire department's network of China. Li, X. Y. and Cui, J. C. (2008) The authors construct a macro algorithm using complete DEA tools, including CCR and BCC
models, inverse DEA model, the common model of weights analysis, and the algorithm of
additional resources.
The authors provide a few simple examples of
different units, two inputs and two outputs to
illustrate the analytical development.
Lozano, S., Villa, G. and Brannlund, R. (2009)
They propose a three-stage model with different objectives: maximizing desirable aggregate production (phase 1), minimizing undesirable production (emissions) (phase 2), and
minimizing inputs used (phase 3). In turn, the authors contrast this alternative with a model in
two phases.
The model is applied to a sample of manufacturers of paper pulp from Sweden (41 units). The variables are
revenue, costs and profit. The number of units is
constant.
Asmild, M., Paradi, J. C. and Pastor, J. T. (2009)
They use a centralized DEA model. The inputs and outputs reallocation is introduced in the inefficient units. For this, the process requires a pre-phase (DEA additive) which is divided
into efficient units (p) and inefficient units (q). Next, the model applies the CRAI-DEA
program of reassignment. The number of DMUs remains constant. They introduce non-
transferable outputs and uncontrollable variables.
The sample is composed of 16 public service companies controlled by a central government. The
services can be divided into three different sets: sub-
model A has three outputs, one of which is
considered non-transferable and other uncontrollable. Sub-models B and C have three and two regular
outputs.

30
AUTHORS METHODOLOGY VARIABLES
Lozano, S., Villa, G. and
Canca, D. (2011)
They propose six alternative models. There are two approaches: one maximizes the output
(Models I, II, V and VI) and the other minimizes the total cost (models III and IV). They present the models in pairs, one allows reallocation and the other does not allow it.
Sample of 28 Spanish ports. They used the port area
(in m2), the length of the pier, number of tugs and cranes as inputs. As output, they used the port traffic
in tons, the ship calls and the TEU (unit of
measurement of shipping container capacity). The
number of the ports at the end was the same, and none were closed.
Mar-Molinero, C., Prior, D.,
Segovia, M. M. and Portillo, F.
(2012)
Centralized DEA model (weak centralization, the number of DMUs after reallocation can
change). The sample consists of 54 secondary schools in Barcelona, Spain.
Three controllable inputs (hours/teacher week,
hours/special education teacher per week, capital
investment in the last decade. One uncontrollable input (enrollment). Two outputs (number of students
who pass the final test, number of students who
continue their studies at the end of the academic
year). Wu, J. and An, Q. X. (2012) Three integrated models for resource reallocation. The first minimizes the inputs, the second
maximizes the total outputs with current resources, and the third maximizes the overall results
with the resources planned for the next production season.
The authors illustrated the proposed model with a
numerical example of 25 supermarkets, two inputs
and one output.
Source: Self devised
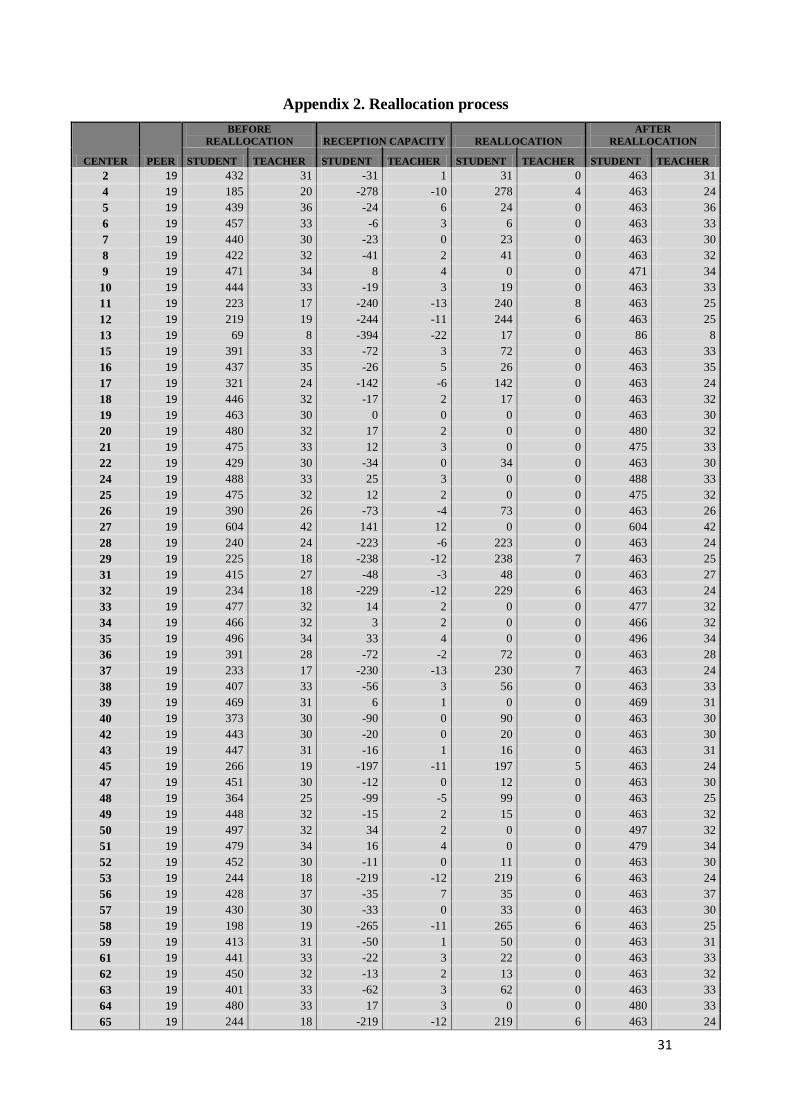
31
Appendix 2. Reallocation process
CENTER PEER
BEFORE
REALLOCATION RECEPTION CAPACITY REALLOCATION
AFTER
REALLOCATION
STUDENT TEACHER STUDENT TEACHER STUDENT TEACHER STUDENT TEACHER
2 19 432 31 -31 1 31 0 463 31
4 19 185 20 -278 -10 278 4 463 24
5 19 439 36 -24 6 24 0 463 36
6 19 457 33 -6 3 6 0 463 33
7 19 440 30 -23 0 23 0 463 30
8 19 422 32 -41 2 41 0 463 32
9 19 471 34 8 4 0 0 471 34
10 19 444 33 -19 3 19 0 463 33
11 19 223 17 -240 -13 240 8 463 25
12 19 219 19 -244 -11 244 6 463 25
13 19 69 8 -394 -22 17 0 86 8
15 19 391 33 -72 3 72 0 463 33
16 19 437 35 -26 5 26 0 463 35
17 19 321 24 -142 -6 142 0 463 24
18 19 446 32 -17 2 17 0 463 32
19 19 463 30 0 0 0 0 463 30
20 19 480 32 17 2 0 0 480 32
21 19 475 33 12 3 0 0 475 33
22 19 429 30 -34 0 34 0 463 30
24 19 488 33 25 3 0 0 488 33
25 19 475 32 12 2 0 0 475 32
26 19 390 26 -73 -4 73 0 463 26
27 19 604 42 141 12 0 0 604 42
28 19 240 24 -223 -6 223 0 463 24
29 19 225 18 -238 -12 238 7 463 25
31 19 415 27 -48 -3 48 0 463 27
32 19 234 18 -229 -12 229 6 463 24
33 19 477 32 14 2 0 0 477 32
34 19 466 32 3 2 0 0 466 32
35 19 496 34 33 4 0 0 496 34
36 19 391 28 -72 -2 72 0 463 28
37 19 233 17 -230 -13 230 7 463 24
38 19 407 33 -56 3 56 0 463 33
39 19 469 31 6 1 0 0 469 31
40 19 373 30 -90 0 90 0 463 30
42 19 443 30 -20 0 20 0 463 30
43 19 447 31 -16 1 16 0 463 31
45 19 266 19 -197 -11 197 5 463 24
47 19 451 30 -12 0 12 0 463 30
48 19 364 25 -99 -5 99 0 463 25
49 19 448 32 -15 2 15 0 463 32
50 19 497 32 34 2 0 0 497 32
51 19 479 34 16 4 0 0 479 34
52 19 452 30 -11 0 11 0 463 30
53 19 244 18 -219 -12 219 6 463 24
56 19 428 37 -35 7 35 0 463 37
57 19 430 30 -33 0 33 0 463 30
58 19 198 19 -265 -11 265 6 463 25
59 19 413 31 -50 1 50 0 463 31
61 19 441 33 -22 3 22 0 463 33
62 19 450 32 -13 2 13 0 463 32
63 19 401 33 -62 3 62 0 463 33
64 19 480 33 17 3 0 0 480 33
65 19 244 18 -219 -12 219 6 463 24

32
CENTER PEER BEFORE
REALLOCATION
RECEPTION
CAPACITY REALLOCATION
AFTER
REALLOCATION
STUDENT TEACHER STUDENT TEACHER STUDENT TEACHER STUDENT TEACHER
66 19 477 33 14 3 0 0 477 33
67 19 234 18 -229 -12 229 6 463 24
68 19 449 33 -14 3 14 0 463 33
69 19 421 29 -42 -1 42 0 463 29
70 19 232 18 -231 -12 231 6 463 24
71 19 196 17 -267 -13 267 8 463 25
72 19 279 21 -184 -9 184 3 463 24
73 19 445 32 -18 2 18 0 463 32
74 19 452 32 -11 2 11 0 463 32
75 19 457 32 -6 2 6 0 463 32
76 19 446 33 -17 3 17 0 463 33
77 19 459 31 -4 1 4 0 463 31
78 19 446 31 -17 1 17 0 463 31
79 19 488 33 25 3 0 0 488 33
80 19 601 43 138 13 0 0 601 43
81 19 226 17 -237 -13 237 7 463 24
82 19 379 36 -84 6 84 0 463 36
83 19 461 32 -2 2 2 0 463 32
84 19 490 34 27 4 0 0 490 34
85 19 454 31 -9 1 9 0 463 31
87 19 162 16 -301 -14 301 9 463 25
89 19 458 33 -5 3 5 0 463 33
90 19 441 31 -22 1 22 0 463 31
92 19 225 19 -238 -11 238 5 463 24
93 19 442 30 -21 0 21 0 463 30
94 19 449 31 -14 1 14 0 463 31
95 19 457 32 -6 2 6 0 463 32
96 19 471 35 8 5 0 0 471 35
97 19 453 31 -10 1 10 0 463 31
99 19 488 35 25 5 0 0 488 35
101 19 353 27 -110 -3 110 0 463 27
102 19 488 33 25 3 0 0 488 33
103 19 273 21 -190 -9 190 3 463 24
105 19 210 18 -253 -12 253 6 463 24
106 19 138 17 -325 -13 325 7 463 24
107 19 432 33 -31 3 31 0 463 33
108 19 210 19 -253 -11 253 5 463 24
109 19 227 17 -236 -13 236 7 463 24
110 19 476 34 13 4 0 0 476 34
111 19 454 31 -9 1 9 0 463 31
112 19 226 17 -237 -13 237 7 463 24
113 19 541 38 78 8 0 0 541 38
114 19 419 32 -44 2 44 0 463 32
115 19 495 34 32 4 0 0 495 34
116 19 450 32 -13 2 13 0 463 32
119 19 447 31 -16 1 16 0 463 31
120 19 173 18 -290 -12 290 6 463 24
121 19 491 34 28 4 0 0 491 34
122 19 413 29 -50 -1 50 0 463 29
123 19 443 32 -20 2 20 0 463 32
124 19 283 25 -180 -5 180 0 463 25
126 19 290 27 -173 -3 173 0 463 27
127 19 455 31 -8 1 8 0 463 31
130 19 406 29 -57 -1 57 0 463 29
132 19 445 30 -18 0 18 0 463 30
Source: Self devised

33
Table 1. Post-New Public Management (post-NPM) features
Configuration Re-centralization: vertical and horizontal coordination
Conception of the citizen Citizen orientation: responsibility, information and accountability
Regulation Administrative law: transparency
Processes Professionalization of management
Structure Networks
Evaluation Control and management evaluation
Personal Professionalization of the civil service
Source: Pérez et al. (2001:134).
Table 2. School efficiency studies revised
VARIABLE DESCRIPTION PAPERS
SCHOLAR
INPUTS (center
level)
Teachers’ qualities (personal
and educational, experience,
leadership role, assessment
policy, innovation projects,
teaching methodology).
Bessent and Bessent (1980); Bessent et al. (1982); Hanushek (1986);
Smith and Mayston (1987); Deller and Rudnicki (1993); Ehrenberg
and Bewer (1994); Ruggiero et al. (1995); Phillips (1997); Dewey,
Husted and Kenny (2000); Opdenakker and Van Damme (2001);
Silva-Portela and Thanassoulis (2001); Ouellette and Vierstraete
(2005); Ouellette and Vierstraete (2010); Johnson and Ruggiero
(2011); Mar-Molinero et al. (2012).
Schools’ physical conditions
(school size and environment,
school budget, sports
facilities, laboratories).
Hanushek (1986); Smith and Mayston (1987); Deller and Rudnicki
(1993); Phillips (1997); Dewey, Husted and Kenny (2000);
Opdenakker and Van Damme (2001); Silva-Portela and Thanassoulis
(2001); Ouellette and Vierstraete (2005); Ouellette and Vierstraete
(2010); Mar-Molinero et al. (2012).
ENVIRONMENT
AL INPUTS
(student and
context level)
Students’ personal
characteristics (personality,
motivation, academic
aspirations).
Bessent and Bessent (1980); Bacdayan (1997); Mancebón and Muñiz
(2008); Johnson and Ruggiero (2011).
Family environment
features (socio-economic and
educational family features,
family involvement, spill-over
effect).
Coleman et al. (1966); Hanushek (1971); Smith and Mayston (1987);
Thanassoulis and Dunstan (1994); Ruggiero et al. (1995); Pepin
(1999); Mancebón and Mar-Molinero (2000); Silva-Portela and
Thanassoulis (2001); Ouellette and Vierstraete (2005); Mancebón and
Muñiz (2008); Cordero, Pedraja and Salinas (2008).
OUTPUT
Academic performance
(homogeneous test results,
number of approved,
repeaters, students with
special needs).
Madaus, Kellaghan, Rakow and King (1979); Smith and Mayston
(1987); Ray (1991); Thanassoulis and Dunstan (1994); Ruggiero et al.
(1995); Mancebón and Mar-Molinero (2000); Silva-Portela and
Thanassoulis (2001); Ouellette and Vierstraete (2005); Mancebón and
Muñiz (2008); Ouellette and Vierstraete (2010); Johnson and
Ruggiero (2011); Mar-Molinero et al. (2012).
Source: Self devised

34
Table 3. Description of variables
VARIABLE VARIABLE
TYPE DESCRIPTION SOURCE
X1 Number of teachers Input Total number of teachers at the
school SIDEN
10
X2 Availability of teaching
innovation projects Input
Quality indicator. Availability
of Innovation Projects (0. No,
1.Yes)
Inspecció, Departament
d'Ensenyament
Xnd1 Student mobility level
Non-
discretional
Input
Factor representing the total
movement of school students
(newly incorporated students
and students leaving)
Inspecció, Departament
d'Ensenyament
Xnd2 Newly incorporated
students
Non-
discretional
Input
Factor representing the newly
incorporated children (at the
beginning of an academic year
or midway through the year)
Inspecció, Departament
d'Ensenyament
Xnd3 Teacher absenteeism Non-
discretional
Input
Factor representing the
teachers’ absences during the
academic year
Inspecció, Departament
d'Ensenyament
Xnd4 Student absenteeism Non-
discretional
Input
Factor representing the
students’ absences during the
academic year (more than 75%
of the days)
Inspecció, Departament
d'Ensenyament
Xnd5 Newly incorporated
teachers
Non-
discretional
Input
Factor representing the newly
incorporated teachers
Inspecció, Departament
d'Ensenyament
Xnd6 Instability of the
management team
Non-
discretional
Input
Factor representing the changes
in the management team since
the center started operating
Inspecció, Departament
d'Ensenyament
Xnd7 Families’ socio-
economic level
Non-
discretional
Input
Factor representing the parents’
profession and education IDESCAT
11
Xnd8 Families’
unemployment level
Non-
discretional
Input
Factor representing the
unemployment level of the
center's families
Inspecció, Departament
d'Ensenyament
Xnd9 Students’ complexity
level
Non-
discretional
Input
Factor representing the
complexity of the classroom
(number of non-Spanish
students, number of grants)
Inspecció, Departament
d'Ensenyament
Y1 Number of students
approved Output
Total enrolled – repeaters –
absentee students (more than
75% of absences each quarter)
Inspecció, Departament
d'Ensenyament
Y2 Average test mark, 6th
Yr. Course Output
Measures the quality of
teaching. It defines the average
test mark obtained by the
center’s students in the general
test in sixth grade of primary
school
Consell d’Avaluació del
Sistema Educatiu,
Generalitat de Catalunya
Y3
Number of students
with special
educational needs
Output
Total of students with special
educational needs
(reinforcement classes)
SIDEN
Source: Self devised
10
SIDEN: Sistema de Información Estadística de Catalunya. 11 IDESCAT: Institut d’Estadística de Catalunya.

35
Table 4. School efficiency studies that applied DEA
FRONTIER METHODOLOGY: Non-parametric techniques
– DEA: Bessent and Bessent (1980); Bessent et al. (1982); Smith and Mayston (1987); Ruggiero et al.
(1995); Mancebón and Mar-Molinero (2000); Bifulco and Bretschneider (2001); Silva-Portela and
Thanassoulis (2001); Mizala et al. (2002); Ouellette and Vierstraete (2005).
– Multi-stage DEA: Ray (1991); Ruggiero (1998); Muñiz (2002); Muñiz, Paradi, Ruggiero and Yang
(2006); Cordero, Pedraja and Santín (2009), Cordero, Pedraja and Santín (2010).
– Multilevel DEA: Thanassoulis (1999); Silva-Portela and Thanassoulis (2001); Thanassoulis and Silva-
Portela (2002); Mancebón and Muñiz (2008); Cervini (2009); Silva-Portela and Camacho (2010); Thieme et
al. (2013).
– Centralized DEA: Athanassopoulos (1995); Lozano and Villa (2004, 2005); Lozano, Villa and Adenso-
Diaz (2004); Giménez-García, Martínez-Parra and Buffa (2007); Nesterenko and Zelenyuk (2007); Fang and
Zhang (2008); Asmild, Paradi and Pastor (2009); Lozano, Villa and Braennlund (2009); Oullette and
Vierstraete (2010); Lozano, Villa and Canca (2011); Mar-Molinero et al. (2012).
– Longitudinal DEA: Oullette and Vierstraete (2010); Johnson and Ruggiero (2011).
– Free Disposal Hull (FDH): De Witte, Thanassoulis, Simpson, Battisti and Charlesworth-May (2010).
– Simulated data: Thanassoulis (1993); Ruggiero (1998); Muñiz, Paradi, Ruggiero and Yang (2006);
Cordero, Pedraja and Santín (2009).
Source: Self devised
Table 5. Results of Programs
Program (1A) (2A) (1B) (2B) (3A) (3B)
Model
Lozano and
Villa, 2004
(OO)
Mar-
Molinero et
al., 2012
(OO)
Lozano and
Villa, 2004
(IO)
Mar-
Molinero et
al., 2012 (IO)
DDF (Briec,
1997)
DDF (Briec,
1997)
Centers n Optimum n* n Optimum n* n Optimum n*
Global
Efficiency
(θ) 1.1594 1.1625 0.8795 0.8602 0.069 0.0751
λ
19 75 126.3 23.7293 108.6517 38.7522 116.8130
31 57 0 78 0 78 0
37 0 0 30.2707 0 15.2478 0
Σλ 132 127 132 109 132 117
Source: Self devised
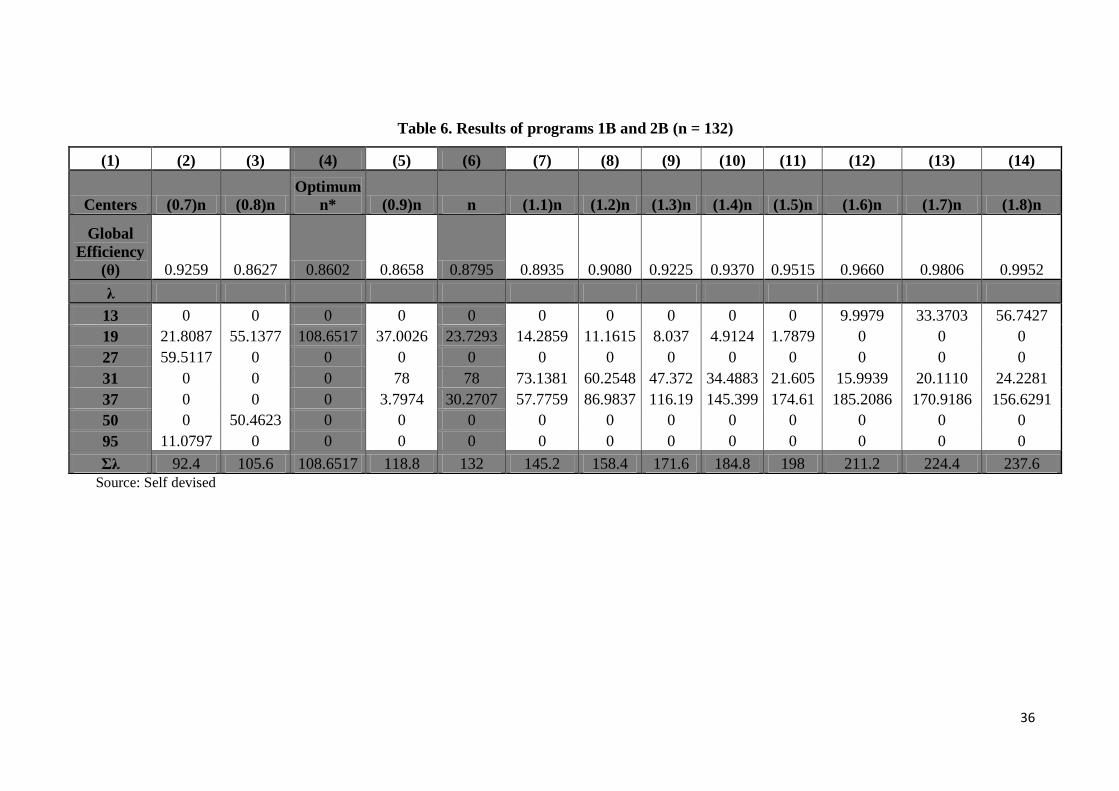
36
Table 6. Results of programs 1B and 2B (n = 132)
(1) (2) (3) (4) (5) (6) (7) (8) (9) (10) (11) (12) (13) (14)
Centers (0.7)n (0.8)n
Optimum
n* (0.9)n n (1.1)n (1.2)n (1.3)n (1.4)n (1.5)n (1.6)n (1.7)n (1.8)n
Global
Efficiency
(θ) 0.9259 0.8627 0.8602 0.8658 0.8795 0.8935 0.9080 0.9225 0.9370 0.9515 0.9660 0.9806 0.9952
λ
13 0 0 0 0 0 0 0 0 0 0 9.9979 33.3703 56.7427
19 21.8087 55.1377 108.6517 37.0026 23.7293 14.2859 11.1615 8.037 4.9124 1.7879 0 0 0
27 59.5117 0 0 0 0 0 0 0 0 0 0 0 0
31 0 0 0 78 78 73.1381 60.2548 47.372 34.4883 21.605 15.9939 20.1110 24.2281
37 0 0 0 3.7974 30.2707 57.7759 86.9837 116.19 145.399 174.61 185.2086 170.9186 156.6291
50 0 50.4623 0 0 0 0 0 0 0 0 0 0 0
95 11.0797 0 0 0 0 0 0 0 0 0 0 0 0
Σλ 92.4 105.6 108.6517 118.8 132 145.2 158.4 171.6 184.8 198 211.2 224.4 237.6
Source: Self devised
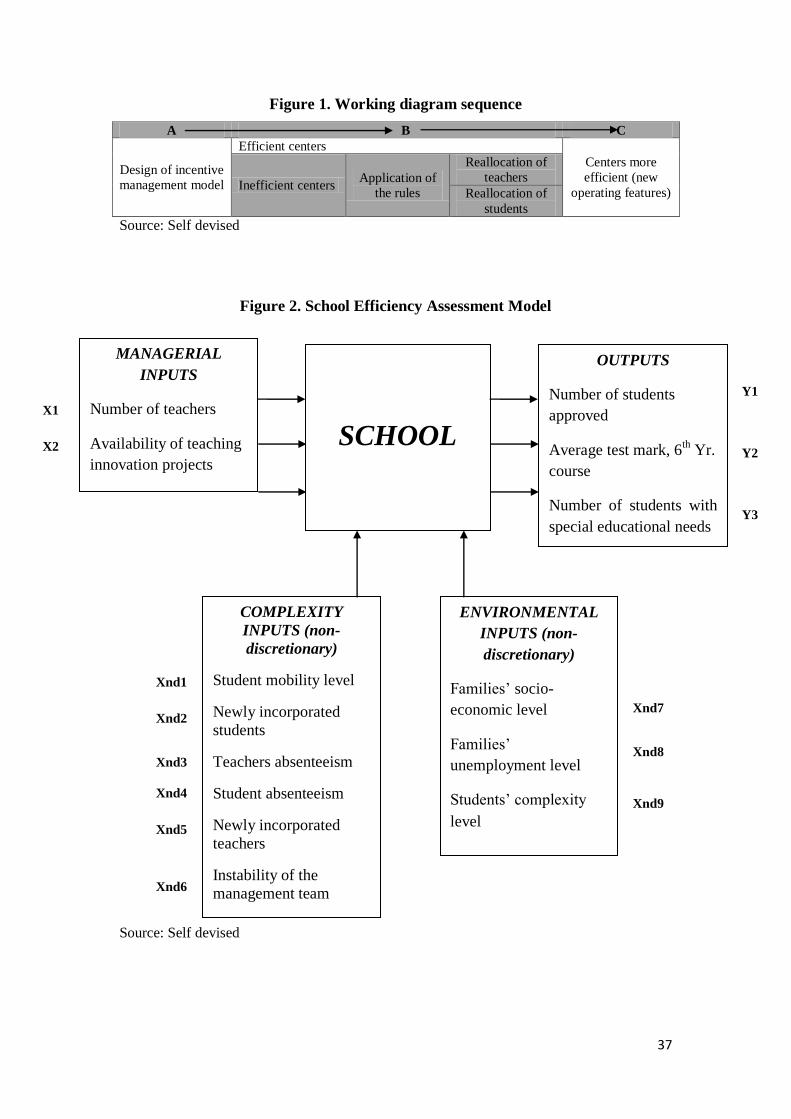
37
Figure 1. Working diagram sequence
A B C
Design of incentive
management model
Efficient centers
Centers more
efficient (new
operating features) Inefficient centers
Application of
the rules
Reallocation of
teachers
Reallocation of
students
Source: Self devised
Figure 2. School Efficiency Assessment Model
Source: Self devised
COMPLEXITY
INPUTS (non-
discretionary)
Student mobility level
Newly incorporated
students
Teachers absenteeism
Student absenteeism
Newly incorporated
teachers
Instability of the
management team
Xnd1
Xnd2
Xnd3
Xnd4
Xnd5
Xnd6
X1
X2
Y1
Y2
Y3
SCHOOL
MANAGERIAL
INPUTS
Number of teachers
Availability of teaching
innovation projects
OUTPUTS
Number of students
approved
Average test mark, 6th
Yr.
course
Number of students with
special educational needs
ENVIRONMENTAL
INPUTS (non-
discretionary)
Families’ socio-
economic level
Families’
unemployment level
Students’ complexity
level
Xnd7
Xnd8
Xnd9
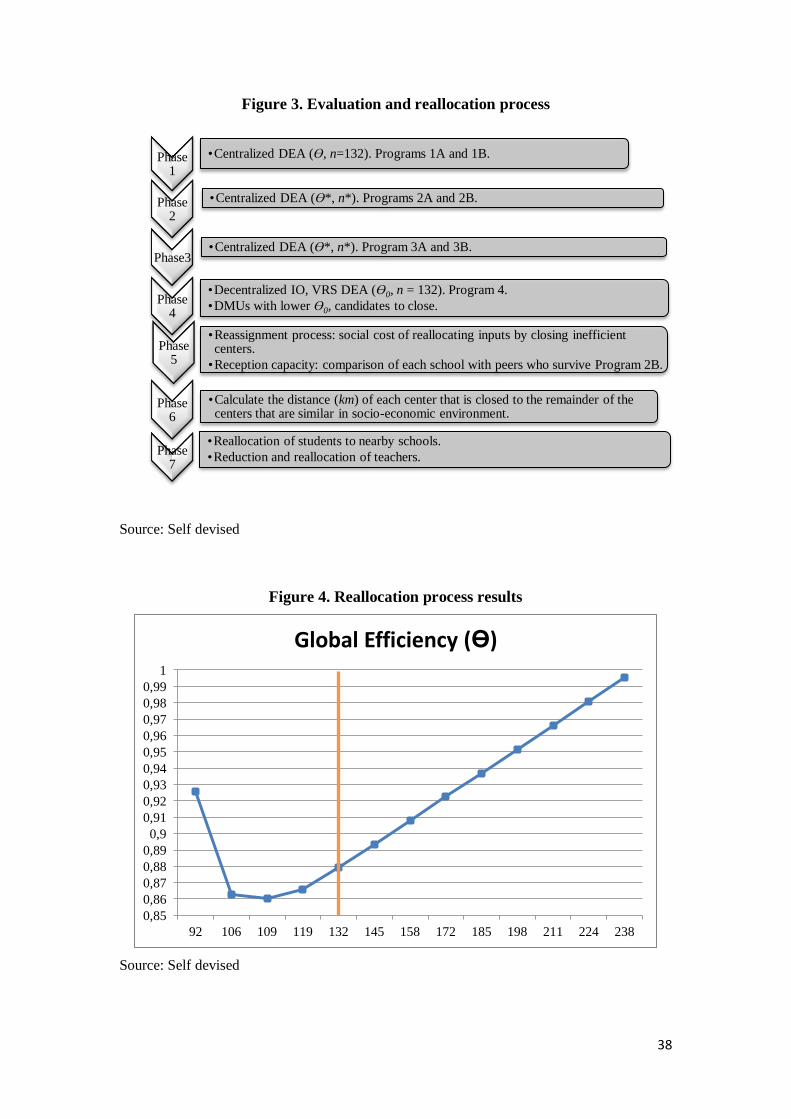
38
Figure 3. Evaluation and reallocation process
Source: Self devised
Figure 4. Reallocation process results
Source: Self devised
Phase 1
•Centralized DEA (ϴ, n=132). Programs 1A and 1B.
Phase 2
•Centralized DEA (ϴ*, n*). Programs 2A and 2B.
Phase3 •Centralized DEA (ϴ*, n*). Program 3A and 3B.
Phase 4
•Decentralized IO, VRS DEA (ϴ0, n = 132). Program 4.
•DMUs with lower ϴ0, candidates to close.
Phase 5
•Reassignment process: social cost of reallocating inputs by closing inefficient centers.
•Reception capacity: comparison of each school with peers who survive Program 2B.
Phase 6
•Calculate the distance (km) of each center that is closed to the remainder of the centers that are similar in socio-economic environment.
Phase 7
•Reallocation of students to nearby schools.
•Reduction and reallocation of teachers.
0,85
0,86
0,87
0,88
0,89
0,9
0,91
0,92
0,93
0,94
0,95
0,96
0,97
0,98
0,99
1
92 106 109 119 132 145 158 172 185 198 211 224 238
Global Efficiency (ϴ)