Embed Size (px)
Citation preview
Evaluation & Critique 1
Running Head: CRITIQUE OF THE BEERY DEVELOPMENTAL TEST OF VISUAL
MOTOR INTEGRATION
An Evaluation and Critique of the Beery Developmental Test of Visual Motor Integration (5th)
Chapman University
Evaluation & Critique 2
An Evaluation and Critique of the Beery Developmental Test of Visual Motor Integration (5th)
Description
The title of the assessment that will be discussed and critiqued in this paper is the Beery
Visual Motor Integration Test (Beery VMI). The Beery VMI was authored by Keith E. Beery,
Ph.D., Natasha A. Beery, M.A., and Norman Buktenica (who designed four of the geometric
forms in the test). The Beery VMI can be either group or individually administered, and is a
norm-referenced assessment designed to assess the extent to which individuals can integrate their
visual and motor abilities (eye-hand coordination). The Full Form booklet is designed for ages
two through 18 years. The Beery VMI purports to measure eye-hand coordination through test
items that require the examinee to copy particular shapes that are displayed in the test booklet.
The authors note that because children with different backgrounds often have widely varying
degrees of experience with alphabets and numbers, geometric forms are used instead of letter or
numeric forms, and that this distinction makes the assessment virtually culture-free.
Content and Use
The Beery VMI is comprised of 30 items total, and can be administered in about 10 to 15
minutes. There is a Short Form (21-item) version available for children ages 2 through 7 years as
well. Because the test can be administered to a group, the authors note that it is appropriate to use
in a classroom setting for young children. The authors claim that the Beery VMI can be used as
an early screener to help identify significant difficulties that some children may have integrating
their finger and hand movement abilities, and that further difficulties can be prevented by
appropriate interventions. Their rationale behind that claim rests on an unfounded assumption:
that a test of visual-motor integration will help some children move toward fully integrating their
Evaluation & Critique 3
physical, intellectual, emotional, and spiritual parts with the whole of their selves and others
(Beery & Beery, 2004, p. 9). The authors casually reference “Sherrington” (likely referring to the
English physiologist and Nobel laureate Charles Scott Sherrington known for his work on neuron
integration) in conjunction with one study conducted over 60 years ago, to justify they premise
upon which the test was based. Their lack of specificity and clarity in their attempt to justify the
rationale behind the assessment is a clear limitation. Furthermore, the test developers do not
provide any evidence to support the claim that replicating geometric images is a satisfactory step
to identify individuals with visual-motor integration difficulties.
The authors then state that another purpose of the test is to identify the need to bring
services of various kinds to individuals who attain a low score, but do not specify what those
various services might include. Their suggestion that the Beery VMI may be useful for
evaluating the effectiveness of the services provided (educational, psychological, or medical) to a
child who attained a low score, is also unsubstantiated.
The Beery VMI includes two optional standardized supplemental tests: Visual Perception
and Motor Coordination. The authors note that these supplemental tests are provided for those
who wish to statistically compare an individual’s Beery VMI results with relatively pure visual
and motor performance. In the Visual Perception test, the first three items require young children
to identify parts of their own bodies, picture outlines, and parts of a picture. For the remaining
items, one geometric form that is exactly the same as each stimulus is to be chosen (by pointing
to the appropriate image on the test booklet) from others that differ from the stimulus image. The
examinees have three minutes to point to as many images as possible. In the Motor Coordination
test, the first three items require young children to climb on a chair, hold a pencil with their
Evaluation & Critique 4
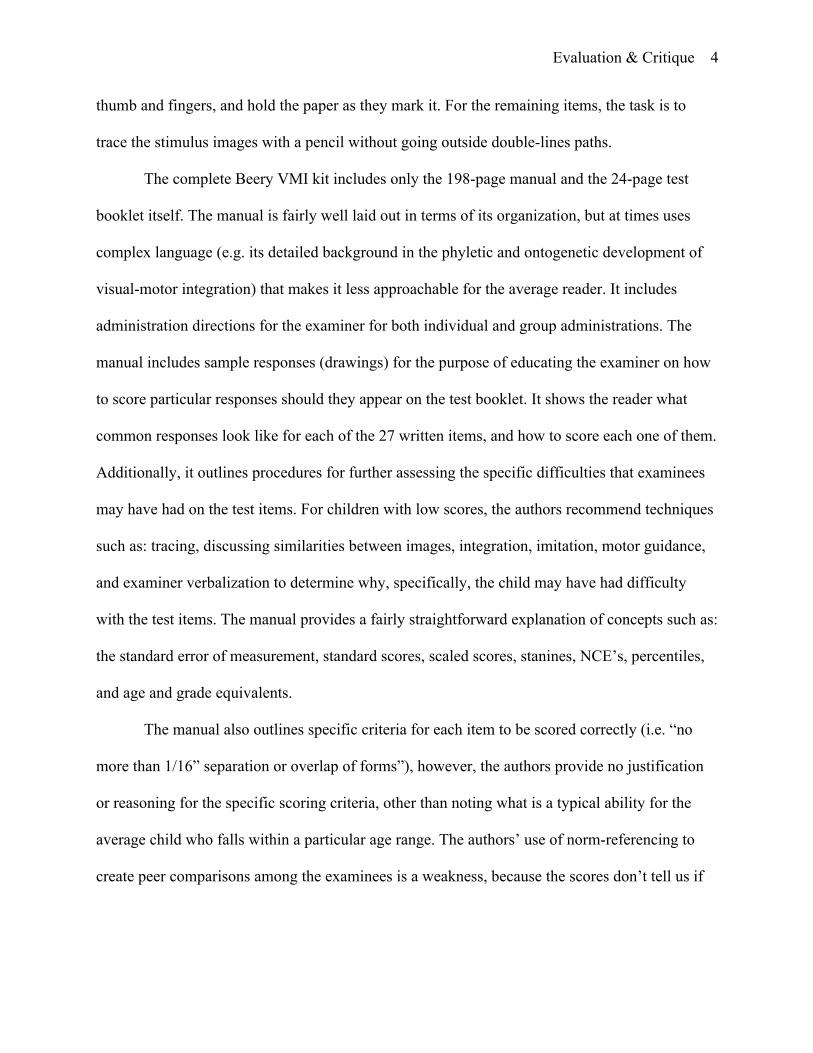
thumb and fingers, and hold the paper as they mark it. For the remaining items, the task is to
trace the stimulus images with a pencil without going outside double-lines paths.
The complete Beery VMI kit includes only the 198-page manual and the 24-page test
booklet itself. The manual is fairly well laid out in terms of its organization, but at times uses
complex language (e.g. its detailed background in the phyletic and ontogenetic development of
visual-motor integration) that makes it less approachable for the average reader. It includes
administration directions for the examiner for both individual and group administrations. The
manual includes sample responses (drawings) for the purpose of educating the examiner on how
to score particular responses should they appear on the test booklet. It shows the reader what
common responses look like for each of the 27 written items, and how to score each one of them.
Additionally, it outlines procedures for further assessing the specific difficulties that examinees
may have had on the test items. For children with low scores, the authors recommend techniques
such as: tracing, discussing similarities between images, integration, imitation, motor guidance,
and examiner verbalization to determine why, specifically, the child may have had difficulty
with the test items. The manual provides a fairly straightforward explanation of concepts such as:
the standard error of measurement, standard scores, scaled scores, stanines, NCE’s, percentiles,
and age and grade equivalents.
The manual also outlines specific criteria for each item to be scored correctly (i.e. “no
more than 1/16” separation or overlap of forms”), however, the authors provide no justification
or reasoning for the specific scoring criteria, other than noting what is a typical ability for the
average child who falls within a particular age range. The authors’ use of norm-referencing to
create peer comparisons among the examinees is a weakness, because the scores don’t tell us if
Evaluation & Critique 5
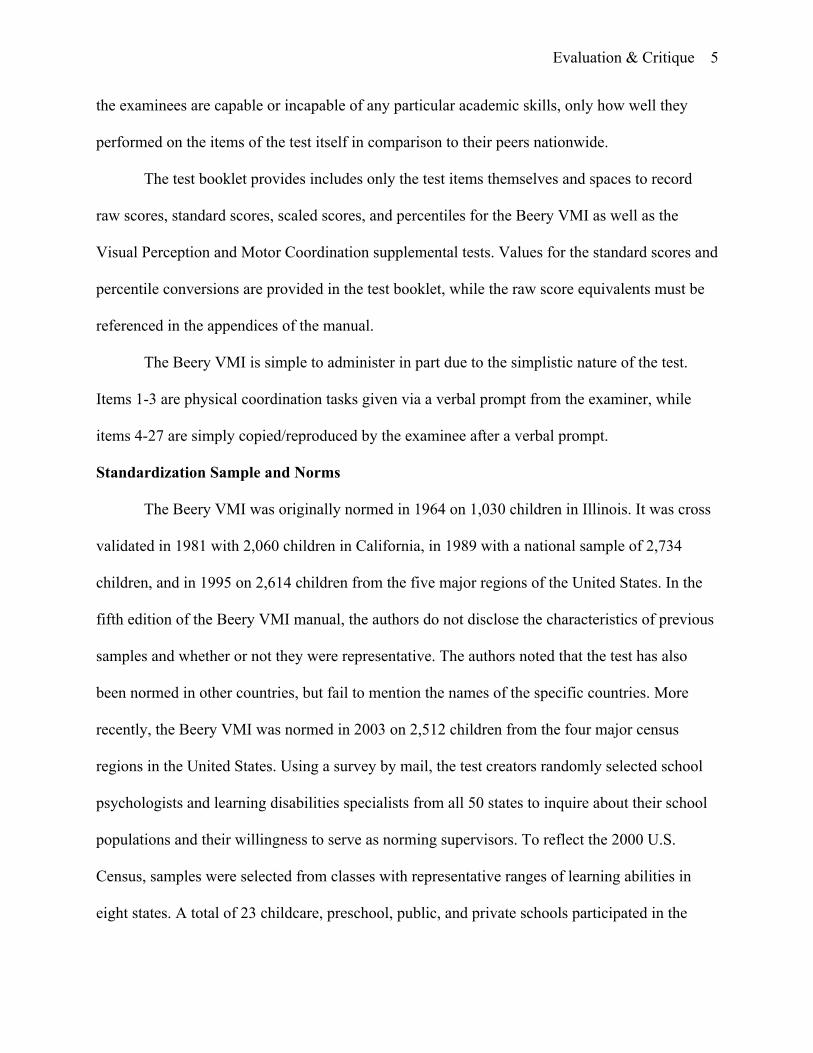
the examinees are capable or incapable of any particular academic skills, only how well they
performed on the items of the test itself in comparison to their peers nationwide.
The test booklet provides includes only the test items themselves and spaces to record
raw scores, standard scores, scaled scores, and percentiles for the Beery VMI as well as the
Visual Perception and Motor Coordination supplemental tests. Values for the standard scores and
percentile conversions are provided in the test booklet, while the raw score equivalents must be
referenced in the appendices of the manual.
The Beery VMI is simple to administer in part due to the simplistic nature of the test.
Items 1-3 are physical coordination tasks given via a verbal prompt from the examiner, while
items 4-27 are simply copied/reproduced by the examinee after a verbal prompt.
Standardization Sample and Norms
The Beery VMI was originally normed in 1964 on 1,030 children in Illinois. It was cross
validated in 1981 with 2,060 children in California, in 1989 with a national sample of 2,734
children, and in 1995 on 2,614 children from the five major regions of the United States. In the
fifth edition of the Beery VMI manual, the authors do not disclose the characteristics of previous
samples and whether or not they were representative. The authors noted that the test has also
been normed in other countries, but fail to mention the names of the specific countries. More
recently, the Beery VMI was normed in 2003 on 2,512 children from the four major census
regions in the United States. Using a survey by mail, the test creators randomly selected school
psychologists and learning disabilities specialists from all 50 states to inquire about their school
populations and their willingness to serve as norming supervisors. To reflect the 2000 U.S.
Census, samples were selected from classes with representative ranges of learning abilities in
eight states. A total of 23 childcare, preschool, public, and private schools participated in the
Evaluation & Critique 6
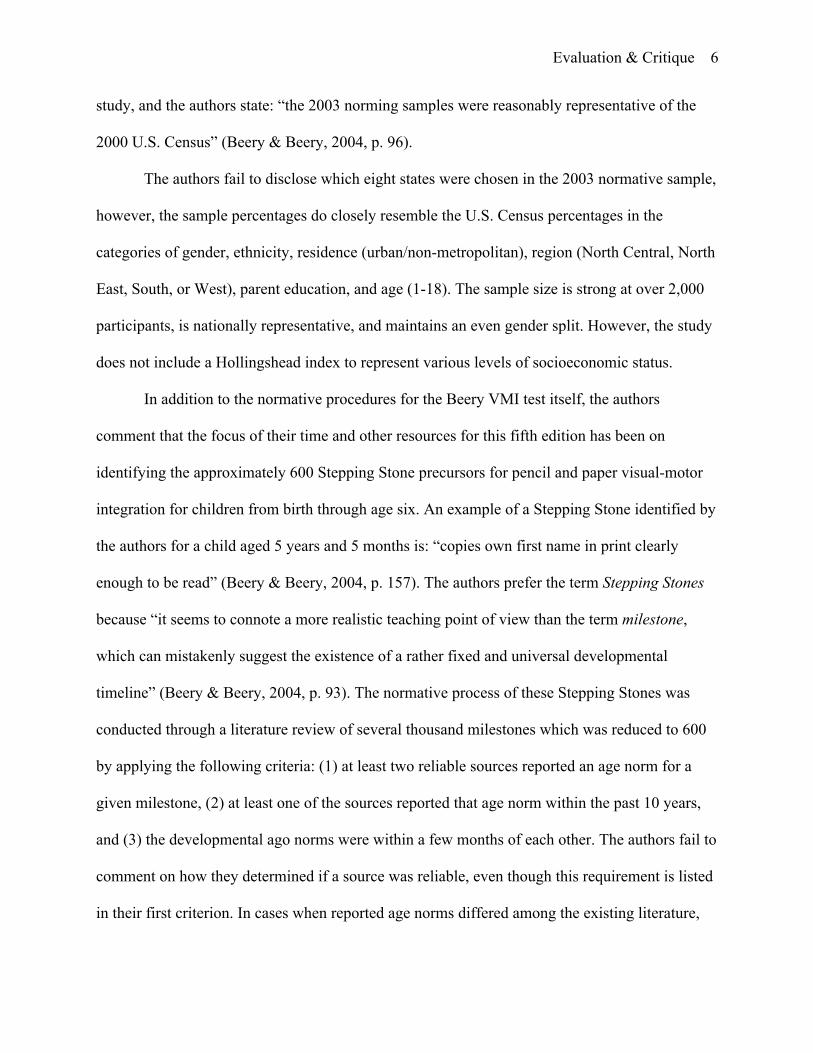
study, and the authors state: “the 2003 norming samples were reasonably representative of the
2000 U.S. Census” (Beery & Beery, 2004, p. 96).
The authors fail to disclose which eight states were chosen in the 2003 normative sample,
however, the sample percentages do closely resemble the U.S. Census percentages in the
categories of gender, ethnicity, residence (urban/non-metropolitan), region (North Central, North
East, South, or West), parent education, and age (1-18). The sample size is strong at over 2,000
participants, is nationally representative, and maintains an even gender split. However, the study
does not include a Hollingshead index to represent various levels of socioeconomic status.
In addition to the normative procedures for the Beery VMI test itself, the authors
comment that the focus of their time and other resources for this fifth edition has been on
identifying the approximately 600 Stepping Stone precursors for pencil and paper visual-motor
integration for children from birth through age six. An example of a Stepping Stone identified by
the authors for a child aged 5 years and 5 months is: “copies own first name in print clearly
enough to be read” (Beery & Beery, 2004, p. 157). The authors prefer the term Stepping Stones
because “it seems to connote a more realistic teaching point of view than the term milestone,
which can mistakenly suggest the existence of a rather fixed and universal developmental
timeline” (Beery & Beery, 2004, p. 93). The normative process of these Stepping Stones was
conducted through a literature review of several thousand milestones which was reduced to 600
by applying the following criteria: (1) at least two reliable sources reported an age norm for a
given milestone, (2) at least one of the sources reported that age norm within the past 10 years,
and (3) the developmental ago norms were within a few months of each other. The authors fail to
comment on how they determined if a source was reliable, even though this requirement is listed
in their first criterion. In cases when reported age norms differed among the existing literature,
Evaluation & Critique 7
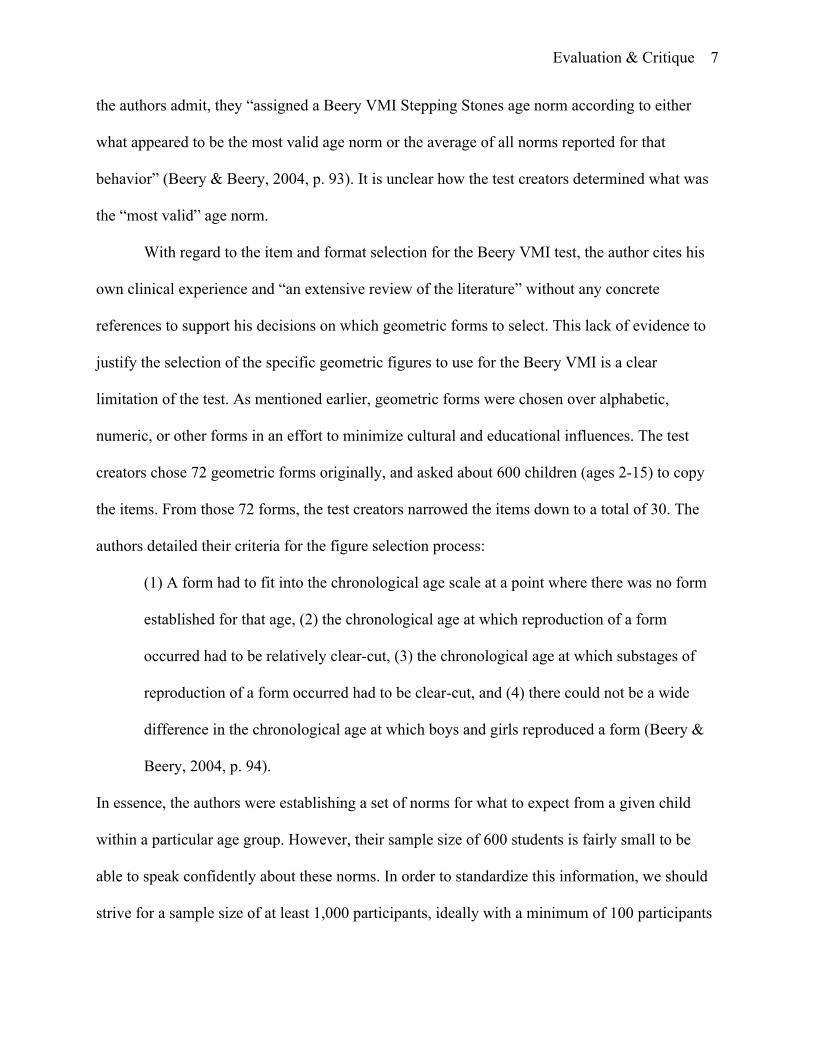
the authors admit, they “assigned a Beery VMI Stepping Stones age norm according to either
what appeared to be the most valid age norm or the average of all norms reported for that
behavior” (Beery & Beery, 2004, p. 93). It is unclear how the test creators determined what was
the “most valid” age norm.
With regard to the item and format selection for the Beery VMI test, the author cites his
own clinical experience and “an extensive review of the literature” without any concrete
references to support his decisions on which geometric forms to select. This lack of evidence to
justify the selection of the specific geometric figures to use for the Beery VMI is a clear
limitation of the test. As mentioned earlier, geometric forms were chosen over alphabetic,
numeric, or other forms in an effort to minimize cultural and educational influences. The test
creators chose 72 geometric forms originally, and asked about 600 children (ages 2-15) to copy
the items. From those 72 forms, the test creators narrowed the items down to a total of 30. The
authors detailed their criteria for the figure selection process:
(1) A form had to fit into the chronological age scale at a point where there was no form
established for that age, (2) the chronological age at which reproduction of a form
occurred had to be relatively clear-cut, (3) the chronological age at which substages of
reproduction of a form occurred had to be clear-cut, and (4) there could not be a wide
difference in the chronological age at which boys and girls reproduced a form (Beery &
Beery, 2004, p. 94).
In essence, the authors were establishing a set of norms for what to expect from a given child
within a particular age group. However, their sample size of 600 students is fairly small to be
able to speak confidently about these norms. In order to standardize this information, we should
strive for a sample size of at least 1,000 participants, ideally with a minimum of 100 participants
Evaluation & Critique 8
per age group. Furthermore, the authors fail to describe how the sample was chosen, and the
representative characteristics (i.e. age, geographic location, race/ethnicity, sex, disability) of that
sample. These are clear weaknesses in the construction of the overall test, as we cannot say with
confidence that particular geometric shapes should be able to be copied by children at a
particular chronological age.
The 30 geometric forms were then given to another sample of 600 children, again a
sample size too small to base important test construction decisions on. The final 27 forms that
were selected for the test were chosen using the criteria mentioned above, but also included more
forms appropriate for the preschool/kindergarten level.
Scores and Interpretation
In the Beery VMI manual, the authors include a short but informative chapter on the
interpretation of test results. They outline concepts such as: raw and derived scores, the
normative population, standard scores, a standard error of measurement (SEM), scaled scores,
stanines, NCE’s, percentiles, and age and grade equivalents. The authors include helpful
cautionary advice for those interpreting scores (e.g. age/grade equivalents and percentiles are
misleading to many because they do not represent equal units of measurement). True as this
advice may be, I was surprised to see the authors mention this information because of the nature
of the test. The Stepping Stones that are intended to represent specific developmental abilities of
children at specific age groups seems to run counter to the idea that one should avoid
comparisons based on an individual’s chronological age.
The test creators include a Profile box on the cover of the Beery VMI test booklet, which
provides a convenient place to record and chart raw scores, standard scores, percentiles, and
other scaled scores for easy reference. The authors note that the simplistic table can be an aid
Evaluation & Critique 9
when creating visual representations of the data for the purpose of communicating strengths and
areas of improvement for the student, teacher, and/or parent. The authors recommend the use of
standard scores when interpreting the results of the Beery VMI, and provide a table in the
appendix for the conversion of raw scores to standard scores based on chronological age. In the
following appendix, the authors provide a table for the conversion of standard scores to
percentiles and other scaled scores (e.g. NCE’s and T Scores). Because of the simplistic nature of
the test, the conversion process for each of the scores is straightforward and can be done in a
very short period of time.
Reliability
The Beery VMI’s internal consistency has been evaluated numerous times since its
creation in 1967. In this fifth edition, the authors note that the tests for reliability were not
repeated because of the high consistency of scores that have occurred throughout time. The
authors remind the reader that the majority of the time spent differentiating this edition from
previous editions was in the form of creating the Stepping Stones mentioned above. They
reference an earlier page in the manual that notes a correlation of internal consistency at .99. For
the purposes of educational and clinical applications we should expect a value of at least .90, so
this high measure of internal consistency is strong. The authors explain further:
The Beery VMI was normed in the United States five times during a period of 40 years
on a total of more than 11,000 children with virtually no changes in mean raw scores for
ages three through 18 for the 24 original forms between the first norming in 1964 and the
fifth norming in 2003 (Beery & Beery, 2014, p. 93).
Evaluation & Critique 10
Content reliability. The test creators used a Rasch-Wright analysis to assess how well
the test items consistently follow the direction of the author’s test construct, how well the items
are separated from each other, and how well they differentiate among individual examinees.
They explain that a Rasch-Wright to measure content reliability is appropriate for power tests,
(i.e. those that are not timed), which accurately describes the Beery VMI. However, the
supplemental tests of the Beery VMI are timed, and therefore the correlations provided for those
tests are merely for information purposes, as they are quasi-power tests. The authors provide a
table that outlines the measures of internal consistency for each age group (3-17) as well as the
mean correlations for both group-item separation (a range from .94-.99 across age groups) and
group-person separation (a range from .75-.95 across age groups). There are three limitations of
the data provided. First, although some of these correlations are high (above .90), others remain
below a value of .80. An internal consistency correlation of .80 or higher is to be expected for
tests that serve as screeners; the authors of the Beery VMI claim this test is should be used as a
screener, and therefore should look to improve this measure of internal consistency. Second, the
sample used for these data consisted of only 50 children per age group. A larger sample size for
each age group (i.e. at least 100) should be used if we are to place much confidence in these
measures of reliability. Third, these analyses were most recently conducted in 1995. As it has
been almost 20 years since the last analysis was conducted, the procedure should be done again
in order to provide the most up to date information for the reader.
Split-half method. A second method the test creators used to gauge the internal
consistency of the measure was the split-half method, in which the children were assessed on
how well they performed on half of the 24 directly copied forms compared with the other half of
the forms. This technique (which determines how homogeneous the test items are) itself has
Evaluation & Critique 11
limitations, namely that it shortens the number of items on the test and therefore makes the data
less reliable. This undermines the value of the measure of internal consistency of the Beery VMI
in particular because the full test contains only 24-27 items (depending on the age of the
examinee). The limited number of items on the full test is a limitation, and using the split-half
method only further weakens the reliability of the measure. However, the authors did apply the
Spearman-Brown (a formula that corrects for attenuation) for the same sample mentioned above
and reported odd-even split-half correlations ranging from .82-.93 across ages 2-17. Although
these correlations are strong, we should not place too much confidence in these values because of
the small sample sizes used for the analysis. Moreover, full ability ranges of K-12 students prior
to the fourth edition of the Beery VMI has yielded single-grade split-half correlations ranging
from .53-.92. The correlation at the low end of this range, though the authors don’t clarify which
age group it applies to, is far too weak to base any research, educational, or clinical decisions on.
Coefficient alpha. The third measure of internal consistency the authors use is the
coefficient alpha (also called Cronbach’s alpha), which is correctly chosen because of the Beery
VMI’s multiple response format. The authors explain that “the measure splits and correlates
items in every possible way and yields the same results as Kuder-Richardson formula 20” (Beery
& Beery, 2004, p. 101). The alpha values are once again provided in a table for each age group
with the mean: .82. This strong correlation is adequate for a measure that is to be used as a
screener, as the Beery VMI is intended, but falls short of the .90 value expected for any
educational and clinical applications. Again, the sample size per age group for the alpha was
only 50, and should be increased to at least 100 if we are to place much confidence in these
values.
Evaluation & Critique 12
Standard Error of Measurement. A fourth type of reliability evidence the authors
provide is a discussion of the Standard Error of Measurement (SEM). They provide a clear
explanation of the SEM in the manual, and note that there is typically some degree of error even
in the most rigorous attempts at accurate measurement. The authors provide the SEM for each
split-half reliability coefficient in each age group for the Beery VMI, as well as the
supplementary tests. They provide these values in rounded terms for standard scores for easy
comparison; each value has a mean of 100 and standard deviation of 15. The authors provide the
SEM for these values using a 68% confidence level, but comment that in order to calculate the
SEM using a 95% confidence level (which is preferred), the reader can double the SEM value
provided in the table. Across the age groups in the sample (which we know includes only 50
participants per age group), the average SEM at a 95% confidence level is just over 10. This
means that we can state with 95% confidence that when an examinee obtains a standard score of
100 on the Beery VMI, that his/her score falls within a range from 90-110. Typically, we expect
a SEM of at least five for a reliable measure. The SEM value for the Beery VMI is appropriate
for its purposes as a screener. One limitation of the test creators’ discussion of the SEM is that
they do not include any information about the Standard Error of the Estimate, which is similar to
the SEM, but takes any regression into consideration.
Temporal stability. The fifth type of reliability evidence the test creators provide is their
assessment of the temporal stability of the Beery VMI, which utilized a test-retest approach. The
fifth edition of the test along with the two supplementary tests were administered in March of
2003 to a sample of 115 children between the ages of 5 and 11 in public school classrooms with
proportionate numbers of children with disabilities. The time between the initial administration
and the retest averaged 10 days, and the overall test-retest raw score coefficient for the Beery
Evaluation & Critique 13
VMI was .89. There are two limitations to the test creators’ assessment of temporal stability.
First, the sample size for each age group of administration should be at least 100, but the authors
used far less. Second, the ages of examinees were between the ages of 5 and 11, while the Beery
VMI is designed to test children ages 2-18. The omission of ages 2-4 and 12-18 is a clear
weakness in the test-retest data. The coefficient value of .89 is quite a strong value for the
temporal stability of the test, but its small sample size and incomplete representation of age
groups limits the validity of this finding. The authors provide helpful information regarding test-
retest coefficients for developmental tests, noting that individual scores are expected to change
over fairly long periods of time because of maturation and/or learning. They conclude the section
on time sampling with data regarding the temporal stability of the Beery VMI when administered
to institutionalized emotionally disturbed children over a two-week period. The correlation was a
mere .59, indicating that the test’s temporal stability for atypical student populations could be
much weaker than for typically functioning students.
Interrater reliability. The sixth and final piece of evidence to support the reliability of
the Beery VMI is interrater/interscorer reliability. For this fifth edition norming study, two
individuals independently scored 100 Beery VMI (and the two supplementary tests) of a random
sample of the norming group. The interscorer reliability for the Beery VMI was .92. Prior to the
fourth edition of the test, reliability coefficients ranged from .73-.99 for a variety of preschool
through elementary-aged children. The authors commented that in some studies that yielded
coefficient values near .73, an additional training workshop was provided to the appropriate
teachers/school psychologists, and the coefficient values increased to .98. The large
improvement in interscorer reliability in a short period of time is likely due to the limited number
of items on the test. Although the overall correlation of .92 is strong, there are two limitations to
Evaluation & Critique 14
the information the authors provided. First, they do not describe the individuals who scored 100
Beery VMI tests. Because the strength of the expected correlation depends largely on the types
of individuals (i.e. parent, teacher, child, adult), it makes it difficult to interpret the results.
Second, the authors do not provide the ages included in the random sample chosen, again making
it difficult to interpret the results which much specificity.
Validity
The authors begin their discussion of validity by referencing the content validity of the
Beery VMI. They describe the concept as “the degree to which the content of a test provides a
representative sample of the behaviors the test is designed to assess” (Beery & Beery, 2004, p.
105). They note that the content can be assessed by evaluating the item construction and
selection procedures described earlier, and by analyzing the Rasch-Wright and other item
analysis methods. To restate the earlier critique of the test’s item construction and selection
procedures, the authors fail to provide citations for the literature that supported the decisions on
which geometric forms to select. Furthermore, at 600, the sample sizes on which the two tests
were administered were too small. To establish a valid representation of the population one can
expect at least 100 students per grade (i.e. K-12 should consist of at least 1,300 participants). For
these reasons we cannot say with confidence that the content on the Beery VMI was validly
selected and should therefore be cautious in our interpretations of the test itself.
Criterion-related validity.
Concurrent validity. Also known as congruent validity, concurrent validity is evaluated
by comparing the results of a test to those of other tests that were designed to measure similar
constructs. During the fourth edition norming study of the Beery VMI, the test creators
correlated the measure with the Copying subtest of the Developmental Test of Visual Perception
Evaluation & Critique 15
(DTVP-2) as well as the Drawing subtest of the Wide Range Assessment of Visual Motor
Abilities (WRAVMA). Both tests were administered to 122 students from regular public school
classrooms in grades K-5. The Beery VMI’s correlation with the WRAVMA Drawing was .52,
while its correlation with the DTVP-2 Copying was .75. There are two main concerns with this
data. First, the Beery VMI was only administered to children in grades K-5, while the test is
designed for children K-12. The sample that was administered the tests should be inclusive of
these additional age groups to increase validity. Second, while the correlation between the Beery
VMI and the DTVP-2 Copying was moderately strong at .75, the correlation between the Beery
VMI and the WRAVMA Drawing was only .52, well below the .7 value that we should expect
between tests that attempt to measure similar constructs. This weak correlation should lower our
confidence in the Beery VMI’s ability to measure what it attempts to.
Predictive validity. An assessment’s predictive validity refers to whether or not a test
predicts what it claims to predict. The authors of the Beery VMI claim that the test predicts
academic achievement and can help to identify children who, if they remain without additional
services and intervention, will have difficulty reading as they mature. The authors begin their
section on predictive validity by referencing a report released by the National Research Council
which shows “letter identification” and “reading readiness” had greater roles in predicting
reading difficulties at school entry than other language skills (Snow, C.E., et al., 1998).
However, there are three problems with the authors’ assertion. First, the creators of the Beery
VMI purposefully avoid using any letters on the test forms, so any comparison between the
geometric shapes on the Beery VMI and letter identification in children is void. Second, the
authors do not explain what is meant by the terms “letter identification” or “reading readiness”
but still make the claim that both rely heavily on visual-motor skills. The reader is unable to
Evaluation & Critique 16
make any relevant comparisons between features of the test and these ill-defined concepts. Third,
the authors note that the strength of the relationships between reading difficulties at school entry
and “letter identification” and “reading readiness” are .52 and .57 respectively, and that they
correlate more closely than other factors. While these concepts may correlate more closely than
other factors, correlations of .52 and .57 are only moderate, and fall below the ideal value for
criterion-related validity of .6-.7. For these reasons, the above claims from the authors about the
predictive value of the Beery VMI are not supported by the data.
The authors state that the Beery VMI is a valuable predictor of academic achievement
when used in combination with other measures, such as the Test for Auditory Comprehension of
Language and the Florida Kindergarten Screening Test. However, they note that visual-motor
predictive correlations appear to decline as children move up in grade levels, and were only able
to predict academic achievement effectively up through the second grade. One possible reason
for this phenomenon, the authors note, is the instructional shift from visual-spatial skills to
language-based skills as grade level increase. The authors reference a study by Fletcher & Satz
(1982) that found that inclusion of the Beery VMI with three other brief tests correctly predicted
85% of kindergarten children who were problem readers seven years later. Lastly, the authors
cite the effectiveness of Beery VMI results when coupled with pediatricians’ ratings to predict
school grade failures or retentions, as well as kindergarten teacher ratings to predict second-
grade reading problems.
Despite the numerous claims made by the authors to support the predictive validity of the
Beery VMI, there are several holes in their argument. Simply put, that data do not adequately
support their claim that the Beery VMI is a good predictor of academic achievement and reading
difficulties in children. First, the test creators admit they were only able to demonstrate any
Evaluation & Critique 17
predictive relationships at all with children in kindergarten through second grade. The reader is
not provided with any information about children in grade levels outside of this range. Second,
although the authors were able to cite research supporting the predictive capacities of the Beery
VMI when paired with “three other brief tests”, we are not given the names of these tests or the
specific skillsets they measure, making proper interpretation difficult. Third, the study that
utilized these three tests was conducted in 1982, over 30 years ago. It should be noted that nearly
all of the studies cited by the authors throughout their discussion of the measure’s predictive
validity are more than 20 years old. The information being referenced throughout this section
should be updated with more current research. Lastly, the authors’ discussion of the predictive
validity of the test when paired with ratings of pediatricians or kindergarten teachers should be
interpreted with caution, as we are given no specific information on how these ratings were
conducted and with what criteria. For a stronger support of these claims, the authors should
provide more concrete information about the research they choose to cite, and provide the reader
with more current research than is currently provided in the manual.
Despite the authors’ assertion that the Beery VMI is a strong predictor of academic
achievement and reading difficulties, research on the topic remains ambivalent. Goldstein & Britt
Jr. (1994) found that when a child’s general intelligence (the measure in their study was the
intelligence quotient) was accounted for, “visual-motor test scores may only predict achievement
to the extent that they reflect [a student’s] general cognitive ability” (p. 822). In other words,
reading difficulties and poor academic achievement in school are better more strongly correlated
with a student’s general intelligence, rather than their visual-motor test scores. The authors of the
study note that their findings also support previous research (Lesiak, 1984; McKay & Neale,
1985; Wright & DeMers, 1982) which showed no relationship between visual-motor
Evaluation & Critique 18
coordination and academic achievement.
Construct validity. The authors begin their analysis of the construct validity of the Beery
VMI by outlining their process: first, they identify several constructs thought to underlie test
performance, next, they generate hypotheses based on those constructs, and finally they verify
the hypotheses using empirical data or logic. Five of the seven most relevant constructs analyzed
by the authors are discussed below (the final two not discussed here are Item and Person
Separations and Disabling Conditions).
Hypothesis 1: chronological age. Because the abilities measured by the Beery VMI are
developmental in nature, it is hypothesized that results from the test should be related to
chronological age. Because the test creators normed the test with a fairly large representative
sample of students, we can interpret test scores confidently for the purposes of peer comparison
based only on a student’s chronological age.
Hypothesis 2: part-whole intercorrelations. The abilities measured by the Beery VMI
and its supplemental tests are related to one another because each supplemental test (Visual
Perception and Motor Coordination) measures a part of what the Beery VMI measures. It is
reasonable to hypothesize that results from one test will correlate at least moderately well with
results from another test.
Hypothesis 3: part-whole hierarchy. Because each of the supplemental tests measure a
part, but not the entirety, of what the Beery VMI measures, the Beery VMI should be more
demanding than either of the supplemental tests. The authors support this hypothesis with
evidence from their norming study, stating that children made more correct responses on each of
the supplemental tests than on the Beery VMI. The authors argue this information supports their
claim that “the Beery VMI measures the integration factor in addition to visual perception and
Evaluation & Critique 19
motor coordination… [and that its] whole is greater than the sum of its parts” (p. 110). The
authors continue to cite neurological research that posits separate visual perception and visual-
motor neural pathways in the brain (Grafton et al., 1992; Ross et al., 1995).
Hypothesis 4: intelligence. The authors claim that the abilities measured by the Beery
VMI and its supplemental tests are related to nonverbal aspects of intelligence. However, they
provide no evidence whatsoever for this claim. Any further interpretation should be made with
caution. In an attempt to demonstrate convergent validity (which tests that constructs that should
be related, are in fact related), the test creators correlated the results of the Beery VMI with those
of the Revised Wechsler Intelligence Scale for Children (WISC-R) based on a sample of 17
children ages six and 12. The average correlation was .58, slightly below the .60 value that we
should expect to demonstrate that these constructs (a measure of intelligence) are in fact related.
Furthermore, the small sample of 17 children limits how confident we can be in that correlation
value. Prior to the fourth edition, the Beery VMI was correlated with mental age on the Primary
Mental Abilities test at .59 for first grade, .37 for fourth grade, and .38 for seventh grade. Again,
we can see how the Beery VMI measures become less reliable as the grade level of the child
increases and the correlation values decrease. Further correlations between the Beery VMI and
the Stanford-Binet-Suzuki among Japanese children ranged from .38 to .45. Likely because the
authors attempt to demonstrate convergent validity was met with mediocre correlation values,
the authors maintain that the Beery VMI correlates more highly with chronological age.
Hypothesis 5: academic achievement. The authors claim that the abilities measured by
the Beery VMI and its supplemental tests are related to academic achievement, despite extant
literature that refutes this claim (Goldstein & Britt Jr., 1994; Lesiak, 1984; McKay & Neale,
1985; Wright & DeMers, 1982). Further interpretation should be made with caution. In another
Evaluation & Critique 20
attempt to demonstrate convergent validity, the test creators correlated the results of the Beery
VMI with those of the Comprehensive Test of Basic Skills (CTBS) based on a sample of 44
fourth and fifth grade students. The correlation values ranged from .40 to.60, indicating a slightly
weaker correlation than is to be expected to demonstrate a test has strong construct validity.
Another limiting factor in the Beery VMI’s construct validity is the omission of a
demonstration of divergent validity (which shows that constructs believed to be unrelated, are
indeed unrelated).
Factor analysis. The authors include a very brief paragraph regarding their factor
analysis and how the variables relate to each other. They state only that the closed forms (those
with acute and oblique angles) on the test accounted for the largest amount of variance [25%]).
Conclusion
The Beery VMI and its supplementary tests of Visual Perception and Motor Coordination
is an easy to use assessment of how effectively examinees can integrate their visual and motor
abilities. Since its creation in 1967 the test has undergone rigorous norming procedures with
large samples sizes of over 2,000 individuals that were part of a representative sample based on
Census information at the time. This stringent norming procedures combined with the use of
non-cultural geometric forms as test items, led to a culturally fair assessment with a low degree
of bias. The Beery VMI is fairly easy to score, though it allows for some subjectivity. There are
some concerns in regards to the test’s reliability, namely its content reliability. Because some
values from the Rasch-Wright analysis fell below the expected .80, we cannot say with
confidence that the test items differ much from one another or how well they differentiate among
individual examinees. Additionally, the test creators often used sample sizes that were too small
to generalize their findings in their analyses, and failed to include all of the age groups as well.
Evaluation & Critique 21
Lastly, the small number of test items is a clear limitation to the measure’s reliability. In terms of
the Beery VMI’s validity, there were some serious concerns. The test’s content (item
construction) was based largely on the test creator’s own professional experience. He neither
cited any evidence to support the geometric figures he selected, nor did he justify how the items
were representative of the abilities he claimed they measured. The Beery VMI’s poor
demonstration of criterion-validity is the most damaging to the test. It shows weak values of
concurrent validity, indicating that the test does not measure what it intends to (i.e. academic
achievement, intelligence, and later reading difficulties) very well, and that other tests may be
more appropriate. In the face of literature against the validity of the Beery VMI in its ability to
predict academic achievement, intelligence, or later reading difficulties, the test creators fail to
offer strong evidence in favor of its predictive ability.
Evaluation & Critique 22
REFERENCES
Goldstein, D.J., Britt, T.W. (1994) Visual-Motor Coordination and Intelligence as Predictors of
Reading, Mathematics, and Written Language Ability. Perceptual and Motor Skills, 78,
p. 819-823.
McCrimmon, A.W., Altomare, A. A., Matchullis, R. L., Jitlina, K. (2010). Test Review: The
Beery Developmental Test of Visual-Motor Integration (6th ed.). Journal of
Psychoeducational Assessment, 30(6), p. 588–592.
Kulp, M.T. (1999). Relationship Between Visual Motor Integration Skill and Academic
Performance in Kindergarten through Third Grade. Optometry and Vision Science, 76(3),
p. 159-163.
Yurdugul, H. (2008). Minimum Sample Size for Cronbach’s Coefficient Alpha: A Monte-Carlo
Study. H. U. Journal of Education, 35, p. 397-405.