Embed Size (px)
Citation preview
Evaluation in Visualization
Universidade de Aveiro Departamento de Electrónica, Telecomunicações e Informática
Information Visualization Beatriz Sousa Santos, 2016/2017

How can we produce a Visualization?
2
• There are no “recipes” to chose adequate Visualization techniques
• There are principles (derived form human perception and cognition)
paradigms (examples resulting form past experience)
and many methods
• To obtain efficacy it is fundamental:
– a correct definition of goal and user tasks
– apply adequate methods and evaluate
in several iterations until the goals are satisfied …

3
• A correct definition of goal is fundamental
• Different use cases imply different visualizations of the same phenomenon
How can we evaluate a Visualization?
Reveal shape Analyze structure
(Simulation of an astrophysical phenomenon) (Keller & Keller, 1993)
5
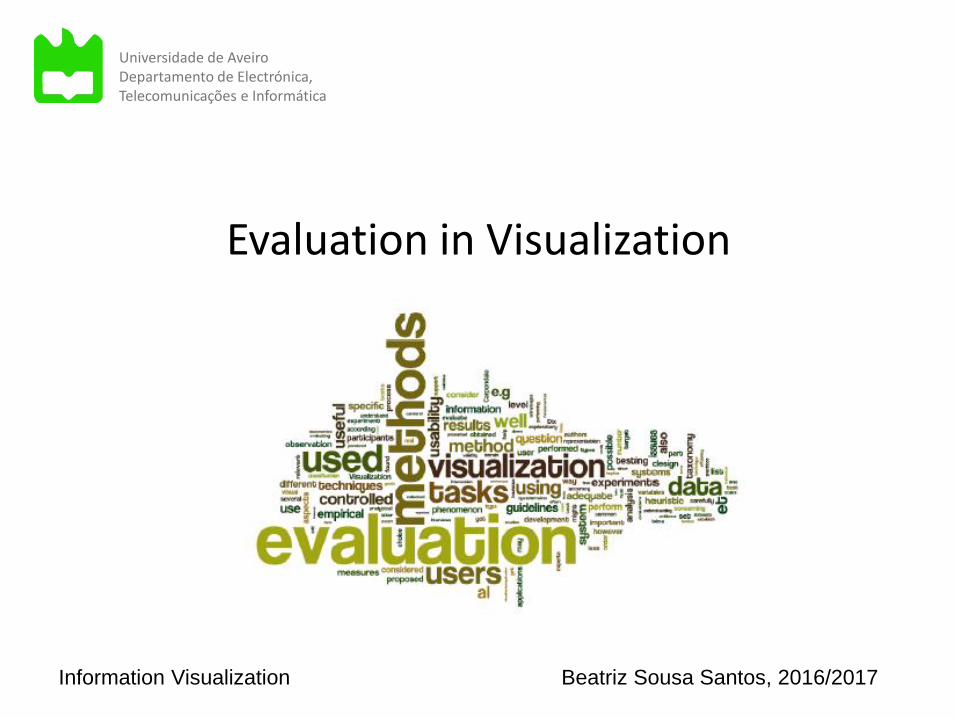
• Evaluating a visualization technique should involve evaluation of all phases: - data transformation e.g. low level: accuracy of methods (errors, artifacts) high level: efficacy and efficiency in supporting users tasks - visual mapping e.g. high level, efficacy and efficiency in supporting users tasks - view creation low level: accuracy of methods (errors, artifacts) high level: efficacy and efficiency in supporting users tasks • Cannot forget the interaction (not only visual) aspects!
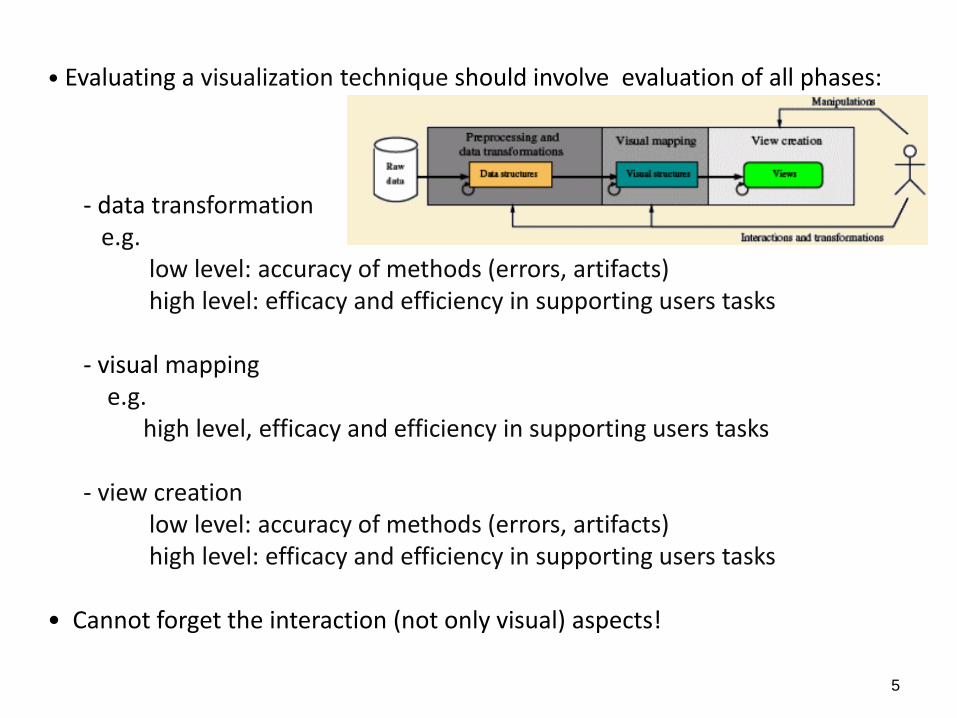
• Motivation/ goal (why? / what for?)
• Test data (which data sets? How many?)
• Evaluation methods (which methods?)
• Collected data (which measures? Which observations?)
• Data analysis (which methods?)
Main Issues for evaluation planning
6
Much related with the methods

Motivation influences the choice of methods
Explorative evaluation – there is not specific goal yet, just understand possibilities and limitations …
• Formative evaluation: e.g. how can we improve this? what should we test next?
Adequate methods: e.g. heuristic evaluation, observation, interview, ...
• Summative evaluation:
e.g. how good is this?
how does it compare with that?
Adequate methods: e.g. controlled experiments, observation, questionnaires, …
7
• Motivation and goal are the starting point of an evaluation
For example:
Which is the best representation of specific data to support specific users while performing specific tasks?
• Influence the choice of
– method
– data sets
– ...
8
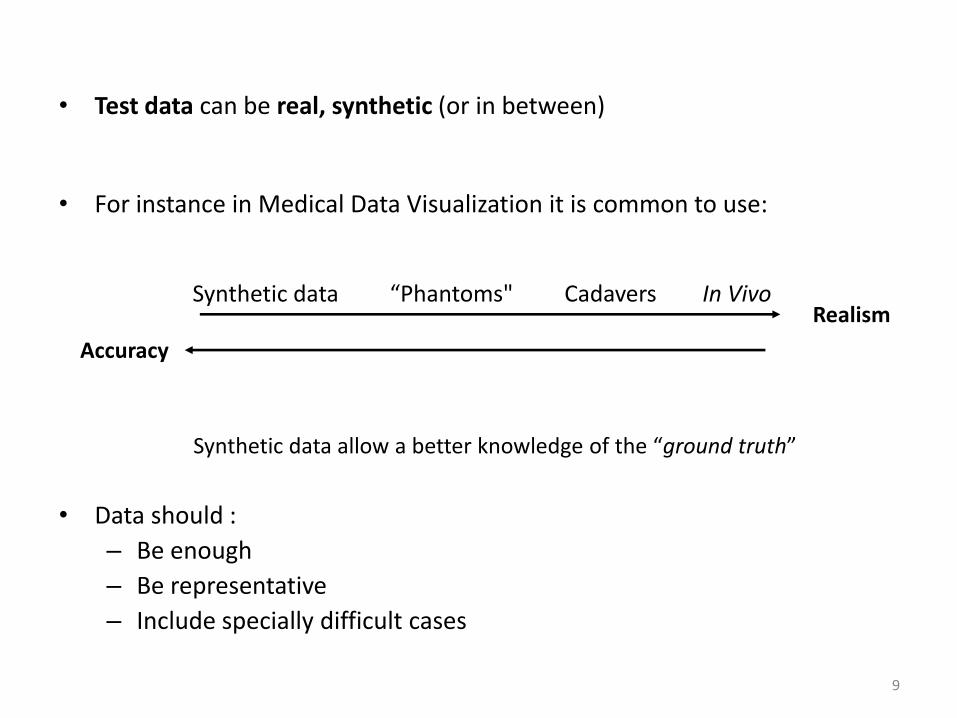
• Test data can be real, synthetic (or in between)
• For instance in Medical Data Visualization it is common to use:
Synthetic data “Phantoms" Cadavers In Vivo
Synthetic data allow a better knowledge of the “ground truth”
• Data should :
– Be enough
– Be representative
– Include specially difficult cases
Accuracy
9
Realism
• Analysis of the collected data has an impact on the results credibility
• Selecting methods should take into consideration:
– Nature of what is being measured (continuous/ discrete)
– Level of representation and measuring scale
– Size of the sample
– Statistical distribution
– Etc.
11
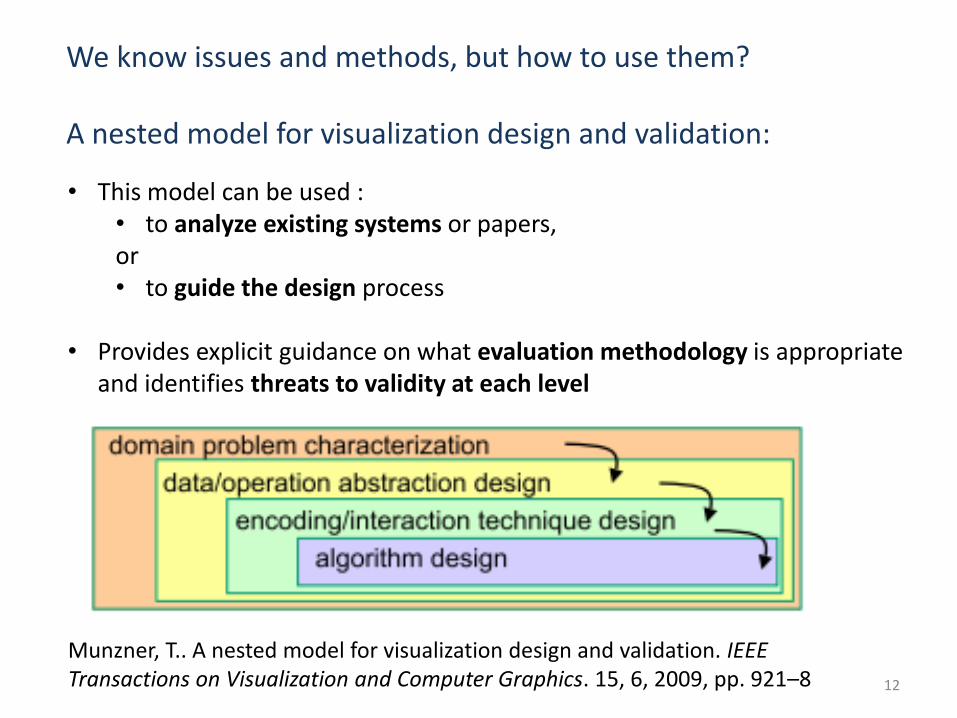
We know issues and methods, but how to use them? A nested model for visualization design and validation:
12
Munzner, T.. A nested model for visualization design and validation. IEEE Transactions on Visualization and Computer Graphics. 15, 6, 2009, pp. 921–8
• This model can be used : • to analyze existing systems or papers, or • to guide the design process
• Provides explicit guidance on what evaluation methodology is appropriate
and identifies threats to validity at each level
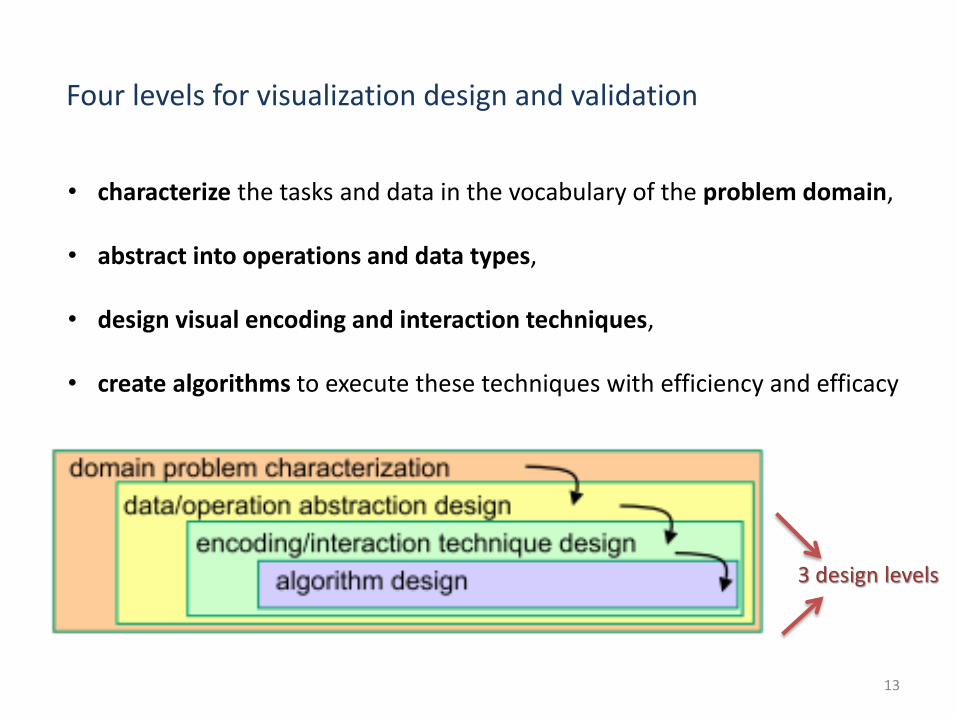
Four levels for visualization design and validation
13
• characterize the tasks and data in the vocabulary of the problem domain, • abstract into operations and data types,
• design visual encoding and interaction techniques,
• create algorithms to execute these techniques with efficiency and efficacy
3 design levels
In each of the four levels it is necessary to :
• 1- learn about the tasks and data of target users in some particular target domain,
• 2- map problems and data from the vocabulary of the specific domain into a more abstract and generic description that is in the vocabulary of computer science,
• 3- design the visual encoding and interaction,
• 4- create an algorithm to carry out the visual encoding and interaction designs automatically. The issues of algorithm design are not unique to visualization .
14
15
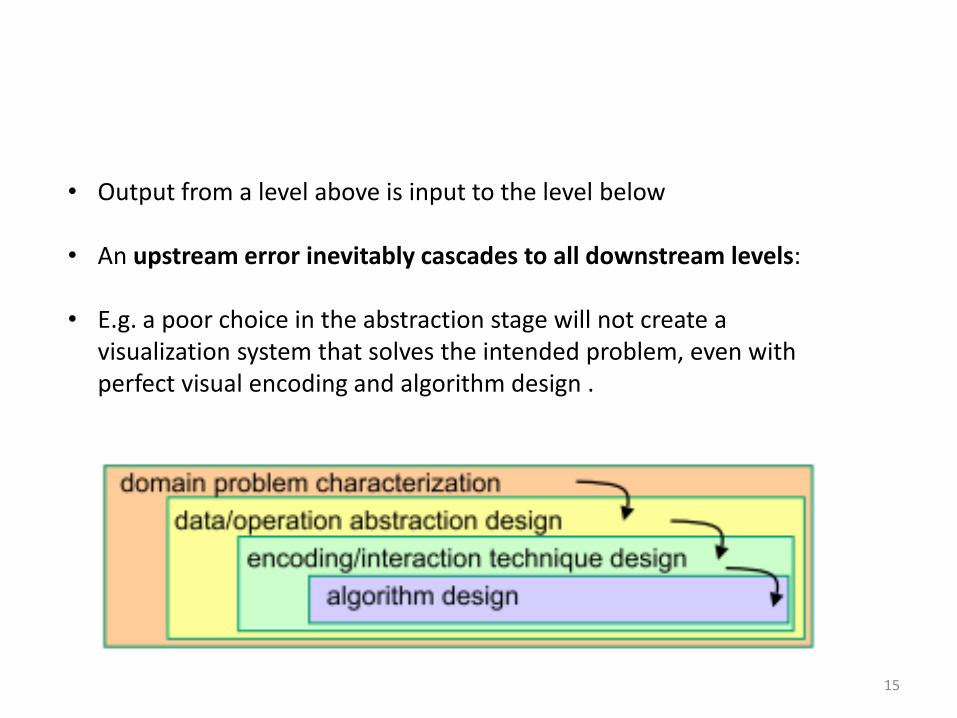
• Output from a level above is input to the level below
• An upstream error inevitably cascades to all downstream levels:
• E.g. a poor choice in the abstraction stage will not create a visualization system that solves the intended problem, even with perfect visual encoding and algorithm design .
Four categories of threats to validity:
• wrong problem: they don’t do that,
• wrong abstraction: you’re showing them the wrong thing,
• wrong encoding/interaction: the way you show it doesn’t work,
• wrong algorithm: your code is not adequate, too slow…
Where: they – users;
you – the designer
17
How can we produce a Visualization?
18
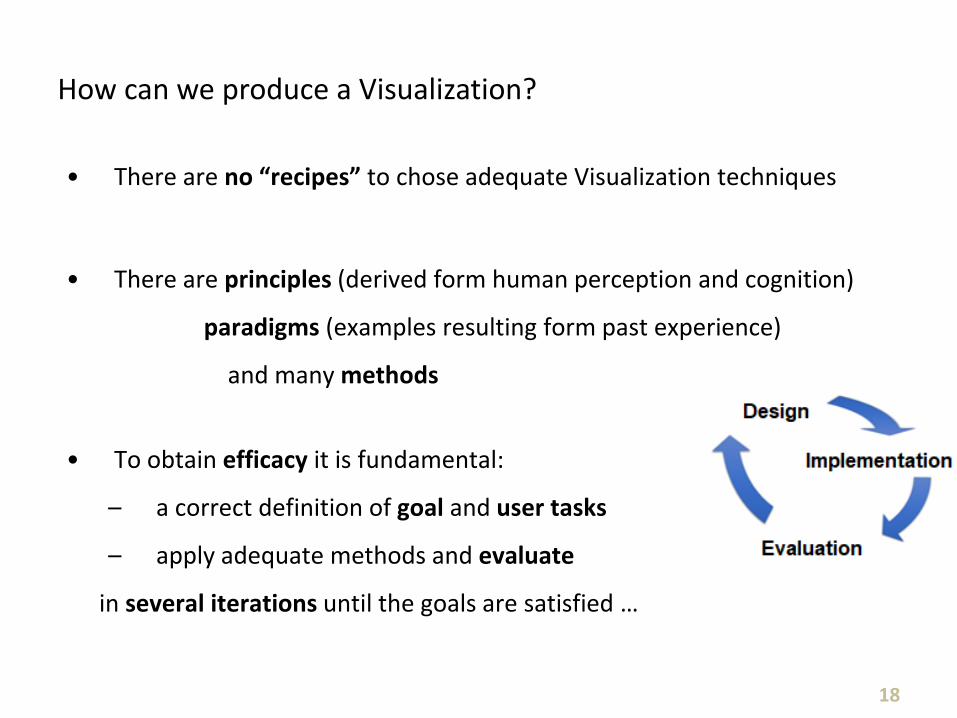
• There are no “recipes” to chose adequate Visualization techniques
• There are principles (derived form human perception and cognition)
paradigms (examples resulting form past experience)
and many methods
• To obtain efficacy it is fundamental:
– a correct definition of goal and user tasks
– apply adequate methods and evaluate
in several iterations until the goals are satisfied …
• Evaluation methods
– Many can be adapted from other disciplines (e.g. HCI, Image Processing)
– Have different potential and limitations
– In a specific evaluation several methods should be used
– Several taxonomies exist that can be used:
• Quantitative / qualitative (Carpendale, 2008)
• Empirical / analytical (Dix et al., 2004)
19
• Methods from other disciplines can be adapted, e.g.
– “Low level” evaluation: methods used in Image Processing: - Quality indices
- Controlled experiments with observers
- Digital observers
– “High level” evaluation: methods used in Human-Computer-Interaction: - Controlled experiments with users
- Observation
- Query methods (questionnaires, interviews)
- Inspection methods (heuristic evaluation) …
• Specific methods are appearing (e.g. insight based methods)
20
Quantitative methods: Controlled experiments
• “workhorse” of experimental science (Carpendale, 2008)
• with benchmark tasks, the primary method for rigorously evaluating visualizations (North, 2006)
• Example: which of several methods allows domain experts to do a specific task more efficiently?
• Involve:
– Hypothesis
– Independent (input) variables (what is controlled)
– Dependent (output) variables (what is measured)
– Secondary variables (what more could influence results)
– Experimental design (between groups / within groups)
– Statistical analysis
21

• Most likely will continue to be the backbone of experimental science
• It is relatively easy to find fault in an experiment (difficult to completely control all factors)
• If they are completely controlled, external and ecological validity can be impacted
• This is particularly true for studies involving humans
• Imply making choices about what factors are important and understanding the strengths and limitations of any given study and its results
Controlled experiments
23

Qualitative methods
• Use a more holistic approach
• Consider the interplay among factors that influence visualizations, their development, and their use
• Lend themselves to being more grounded in more realistic settings
• Can be incorporated into all types of studies
24
(Carpendale, 2008)

• Some methods from HCI may and have been adapted to evaluate aspects of Visualization solutions
25
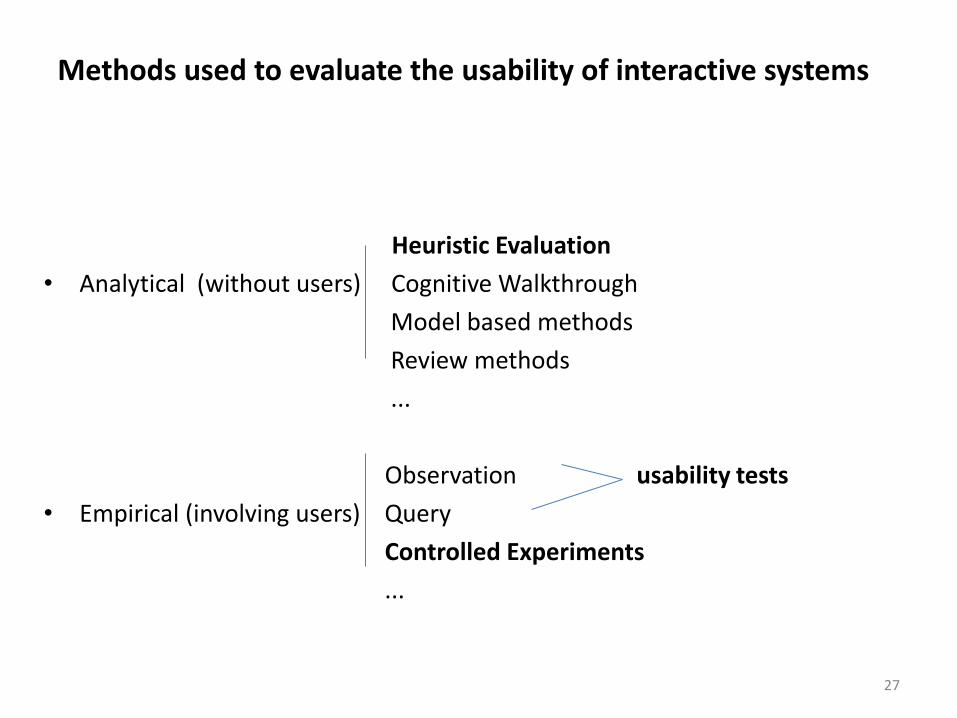
Methods used to evaluate the usability of interactive systems
Heuristic Evaluation
• Analytical (without users) Cognitive Walkthrough
Model based methods
Review methods
...
Observation usability tests
• Empirical (involving users) Query
Controlled Experiments
...
27
Heuristic Evaluation (Nielsen and Molich 1990)
• A “discount usability engineering method” for quick, cheap, and easy evaluation of a UI design
• Most popular usability inspection method; yet is subjective
• It is a systematic inspection of a design for usability
• Meant to find the usability problems in the design so that they can be attended to as part of an iterative design process
• Involves a small set of analysts judging the UI against a list of usability principles ("heuristics")
https://www.nngroup.com/articles/how-to-conduct-a-heuristic-evaluation/
28
How to perform HE
• Should be performed by several evaluators (one person will never be able to find all the problems)
• Evaluators should work independently: – First get a general idea of the UI
– Then perform a detailed inspection using a set of heuristics
– Listing usability problems (heuristics not followed and severity degree)
• Findings of all evaluators should be integrated in the same report
• The report should help the development teem to prioritize problem fixing
29
• Nielsen proposed 10 general usability heuristics, yet there are others
• More details on how to conduct a heuristics evaluation at:
http://www.nngroup.com/articles/how-to-conduct-a-heuristic evaluation
• And how to rate the severity of the usability problems found:
http://www.nngroup.com/articles/how-to-rate-the-severity-of-usability-problems/
• The list of problems and severity rates should help the development team to priorityse problem fixing
31
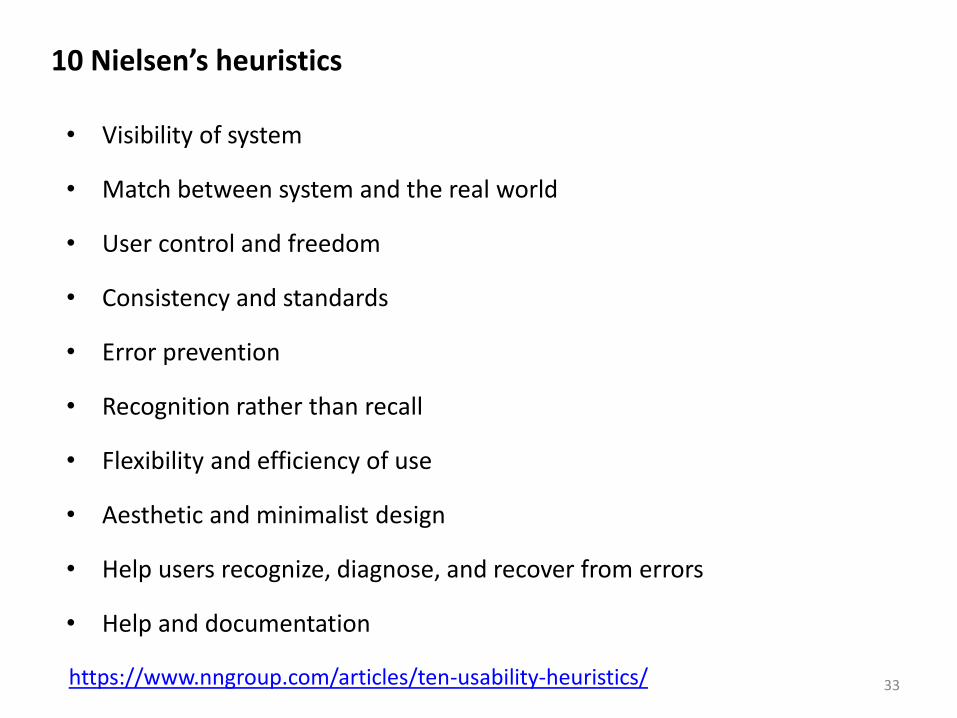
10 Nielsen’s heuristics
• Visibility of system
• Match between system and the real world
• User control and freedom
• Consistency and standards
• Error prevention
• Recognition rather than recall
• Flexibility and efficiency of use
• Aesthetic and minimalist design
• Help users recognize, diagnose, and recover from errors
• Help and documentation
33 https://www.nngroup.com/articles/ten-usability-heuristics/
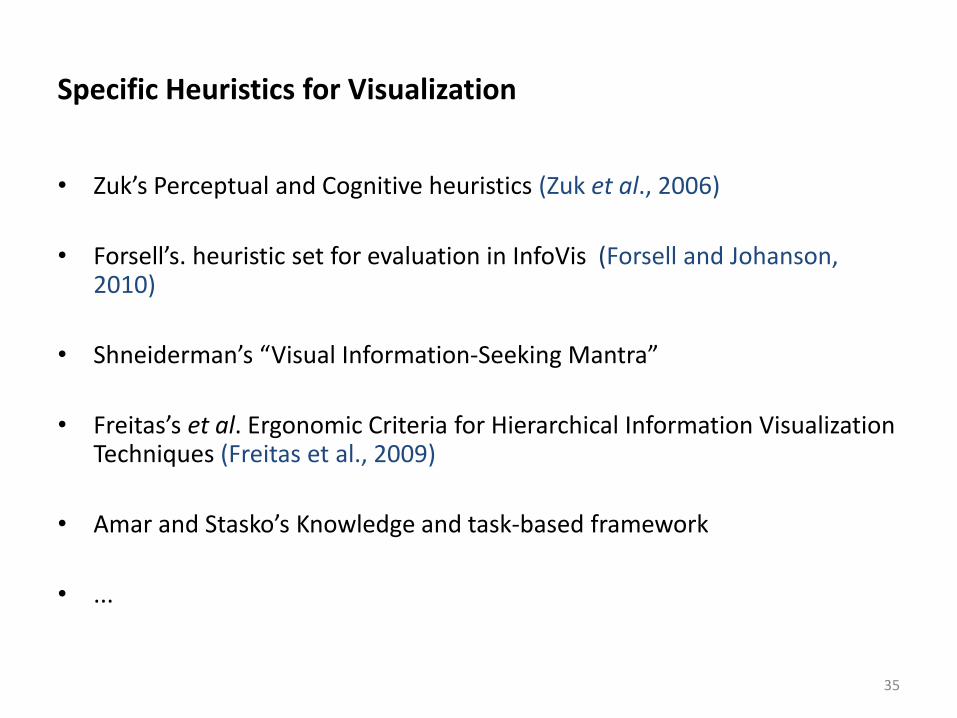
Specific Heuristics for Visualization
• Zuk’s Perceptual and Cognitive heuristics (Zuk et al., 2006)
• Forsell’s. heuristic set for evaluation in InfoVis (Forsell and Johanson, 2010)
• Shneiderman’s “Visual Information-Seeking Mantra”
• Freitas’s et al. Ergonomic Criteria for Hierarchical Information Visualization Techniques (Freitas et al., 2009)
• Amar and Stasko’s Knowledge and task-based framework
• ...
35
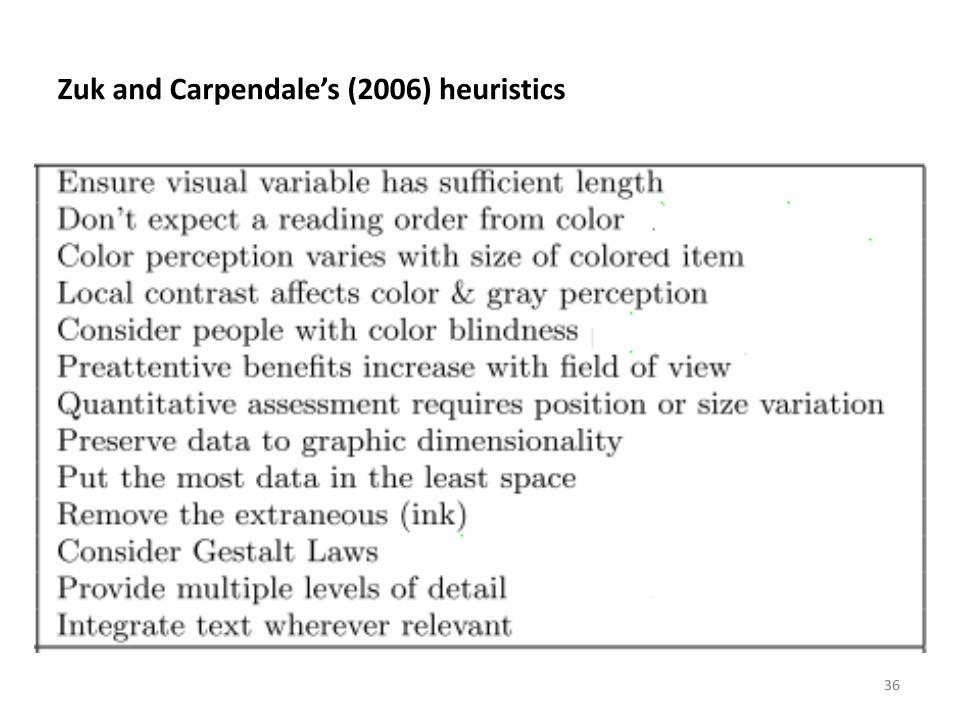
Zuk and Carpendale’s (2006) heuristics
36
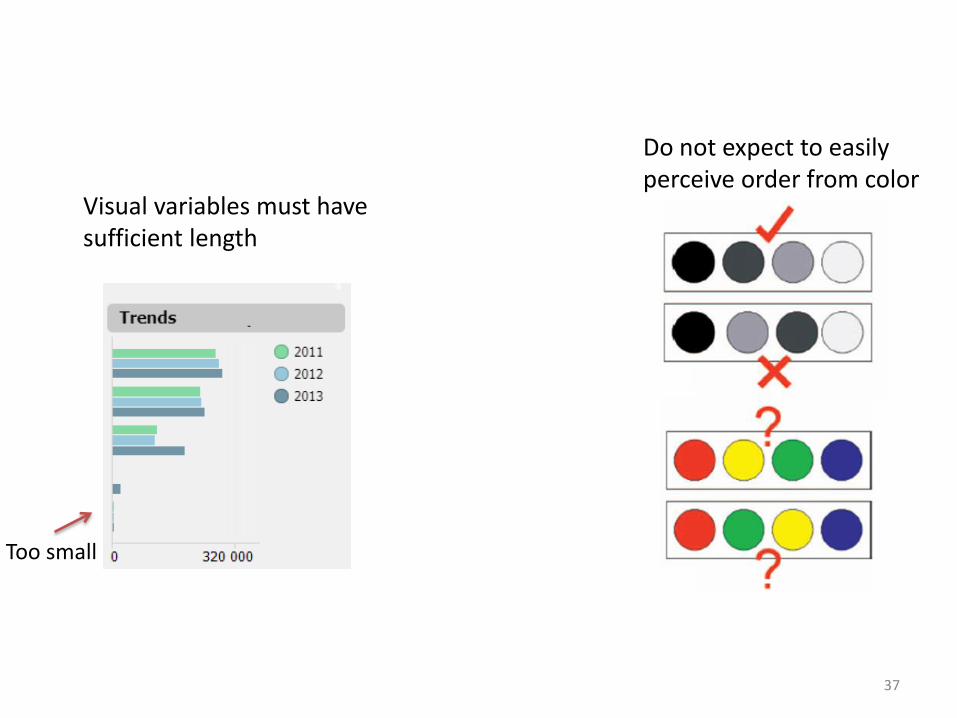
Visual variables must have sufficient length
37
Too small
Do not expect to easily perceive order from color
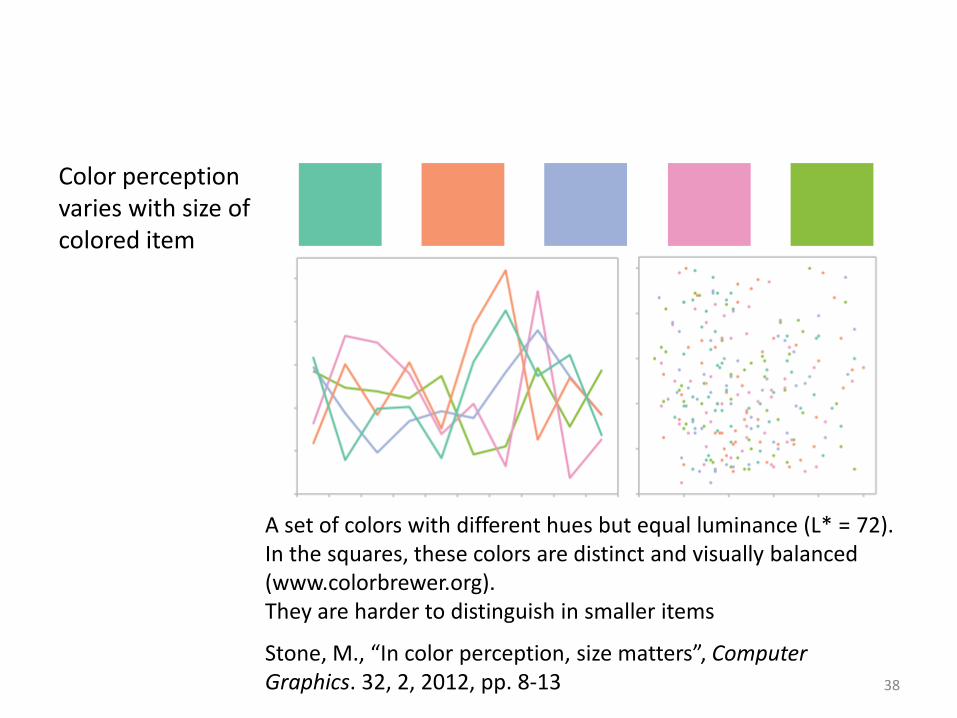
38
Color perception varies with size of colored item
A set of colors with different hues but equal luminance (L* = 72). In the squares, these colors are distinct and visually balanced (www.colorbrewer.org). They are harder to distinguish in smaller items
Stone, M., “In color perception, size matters”, Computer Graphics. 32, 2, 2012, pp. 8-13

Consider people with color blindness
The most common form of color blindness is deuteranopia (“daltonism”)
There are color blindness simulators
Deuteranopia
Tritanopia
Normal vision
http://www.colourblindawareness.org/
http://www.color-blindness.com/coblis-
color-blindness-simulator
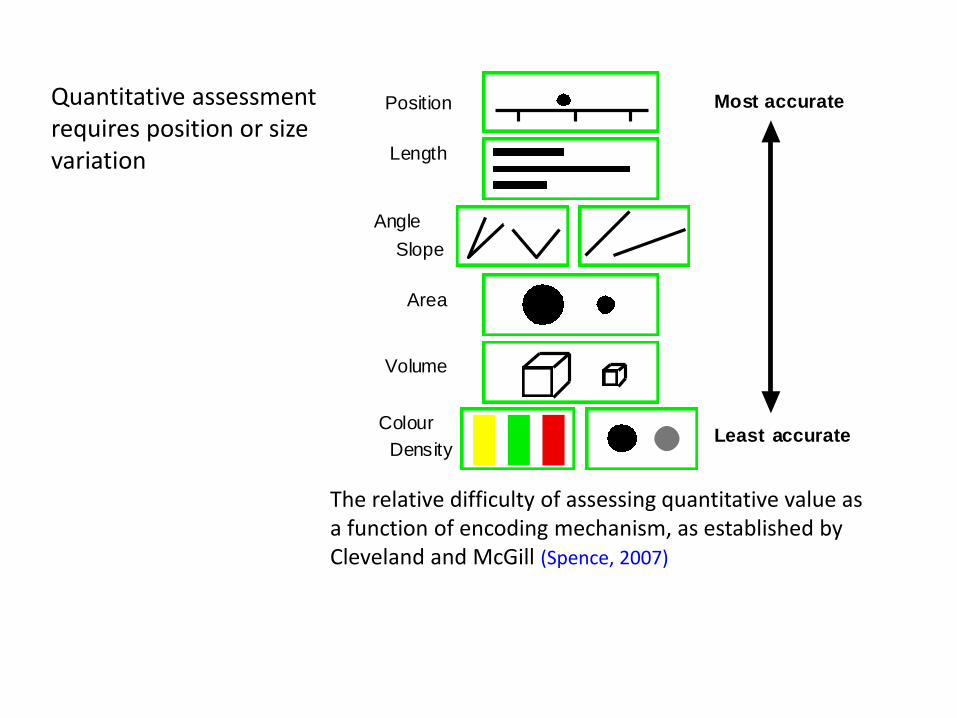
The relative difficulty of assessing quantitative value as a function of encoding mechanism, as established by Cleveland and McGill (Spence, 2007)
Length
Position
Angle
Slope
Area
Volume
Colour
Density
Most accurate
Least accurate
Quantitative assessment requires position or size variation
41
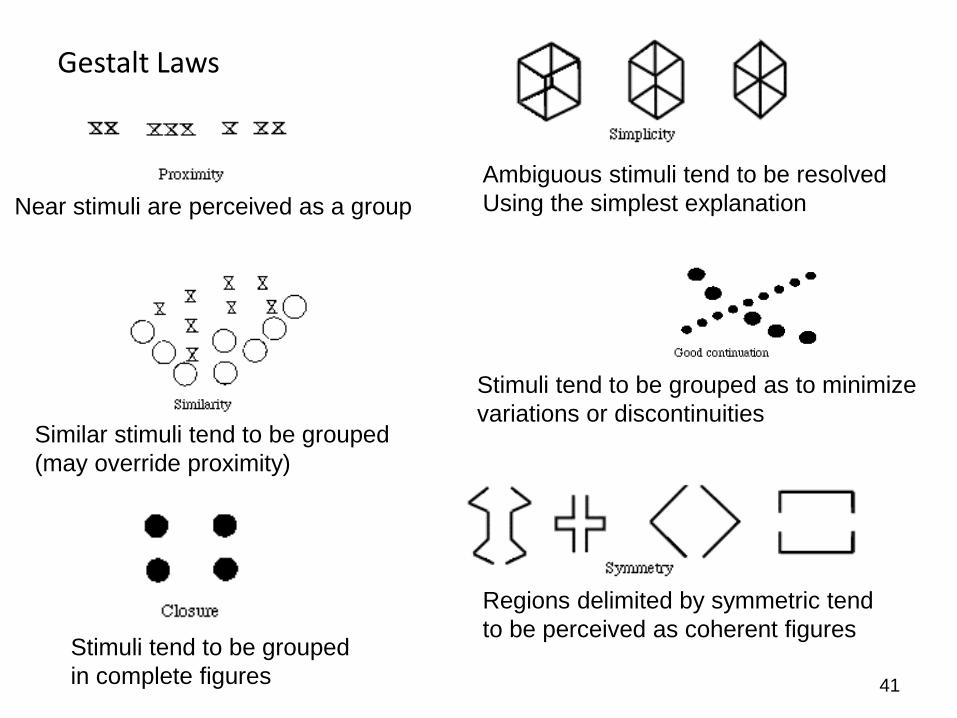
Gestalt Laws
Near stimuli are perceived as a group
Ambiguous stimuli tend to be resolved
Using the simplest explanation
Stimuli tend to be grouped as to minimize
variations or discontinuities
Regions delimited by symmetric tend
to be perceived as coherent figures Stimuli tend to be grouped
in complete figures
Similar stimuli tend to be grouped
(may override proximity)

Forsell´s et al. (2010) heuristics
42
Uses heuristics from other sets: B- Freitas et al. C - Nielsen D- Zuck and Carpendale E- Bastien & Scapin
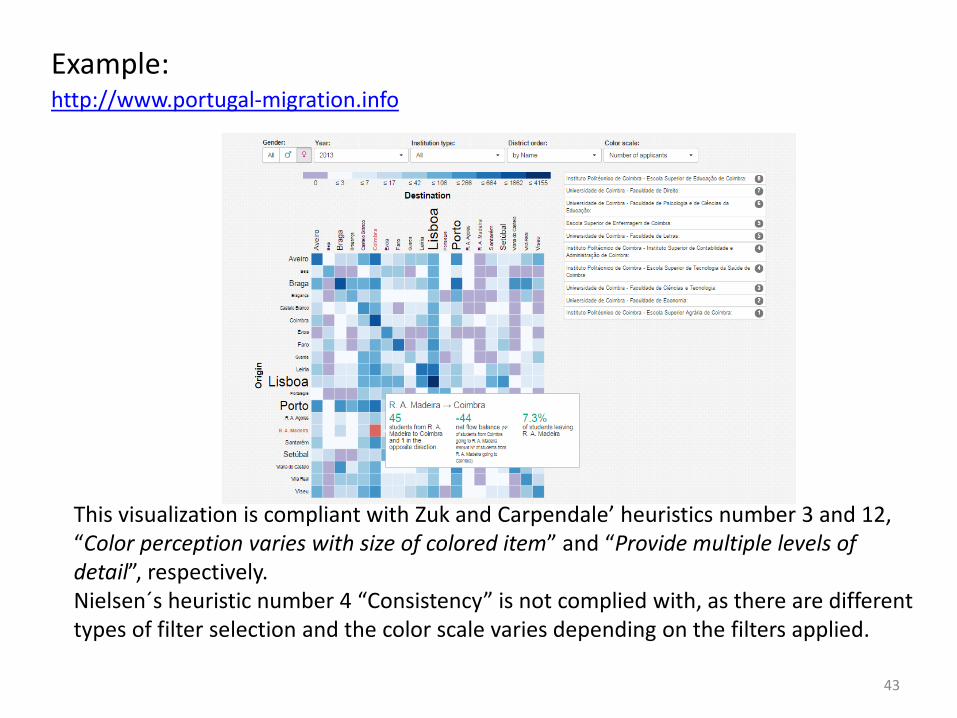
Example:
43
This visualization is compliant with Zuk and Carpendale’ heuristics number 3 and 12, “Color perception varies with size of colored item” and “Provide multiple levels of detail”, respectively. Nielsen´s heuristic number 4 “Consistency” is not complied with, as there are different types of filter selection and the color scale varies depending on the filters applied.
http://www.portugal-migration.info
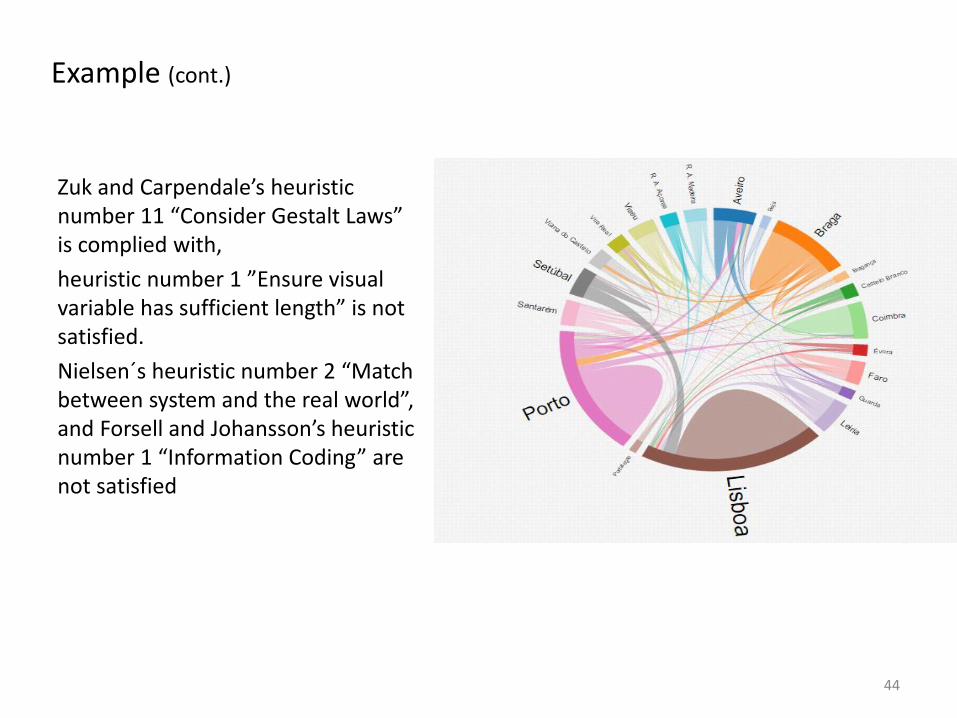
Zuk and Carpendale’s heuristic number 11 “Consider Gestalt Laws” is complied with,
heuristic number 1 ”Ensure visual variable has sufficient length” is not satisfied.
Nielsen´s heuristic number 2 “Match between system and the real world”, and Forsell and Johansson’s heuristic number 1 “Information Coding” are not satisfied
44
Example (cont.)
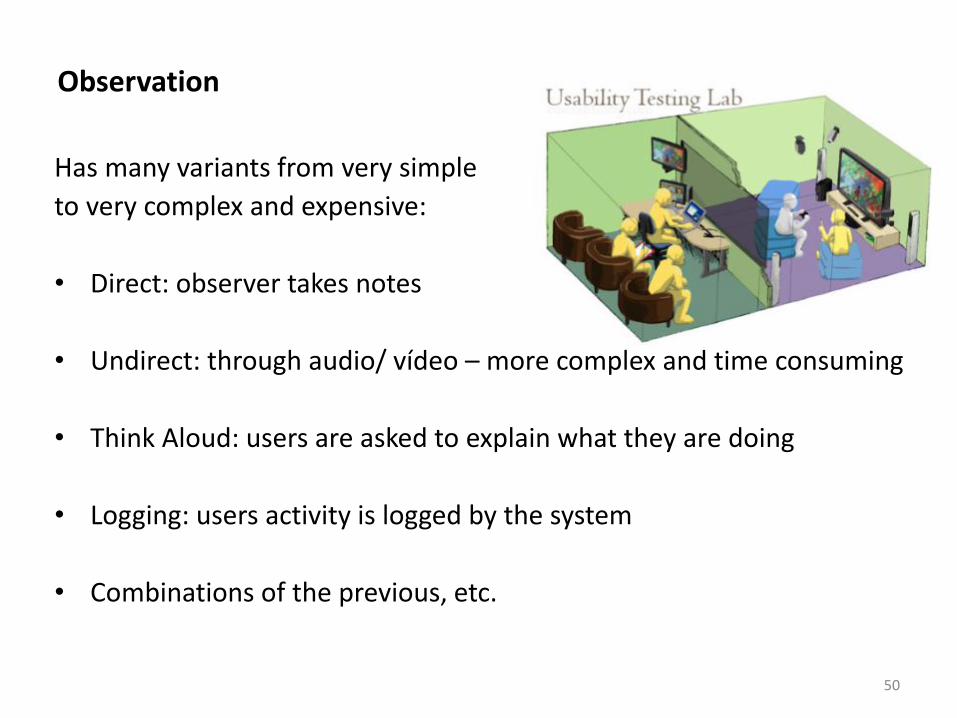
Observation
Has many variants from very simple
to very complex and expensive:
• Direct: observer takes notes
• Undirect: through audio/ vídeo – more complex and time consuming
• Think Aloud: users are asked to explain what they are doing
• Logging: users activity is logged by the system
• Combinations of the previous, etc.
50
Query
• Two main variants:
– Questionnaire (reach more people; less flexible)
– Interview
• Should be carefully prepared and tested
• Collected data should be carefully analyzed
51

Controlled experiments
• The work horse of science ...
• Important issues to consider:
– Hypothesis
– Variables (input or independent; output or dependent)
– Secondary variables
– Experimental design (within groups; between groups)
– Participants (number, profile)
– Statistics
52
Usability tests
• Involve observation and query
• Main aspects:
– Participants
– Tasks
– Test facilities and systems
– Experimental design
– Usability measures
– Data analysis
• Have a complex logistics
53
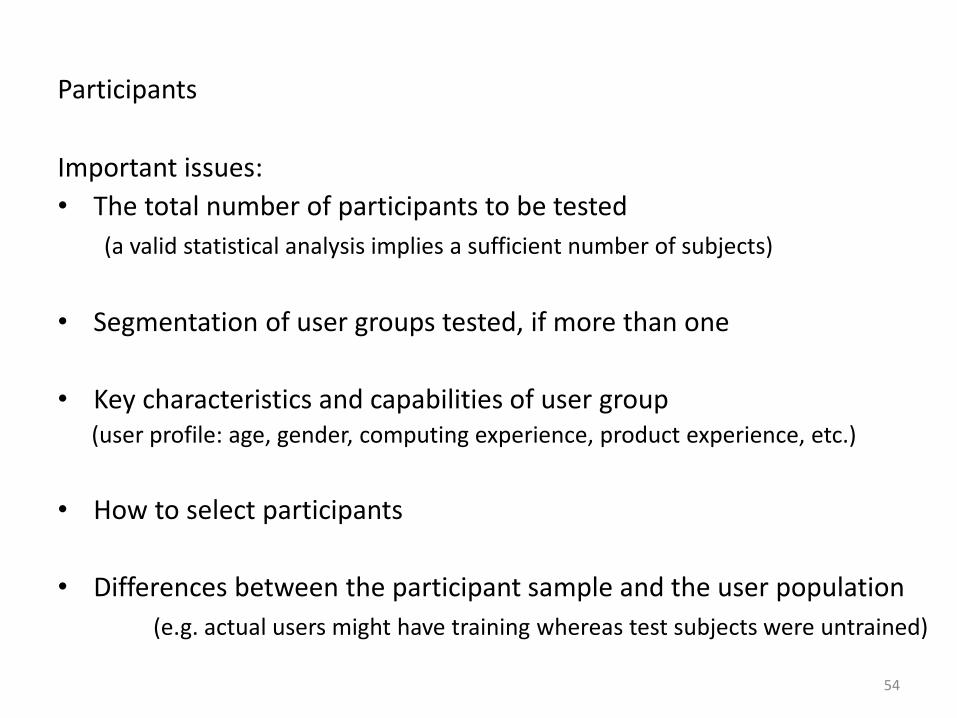
Participants
54
Important issues:
• The total number of participants to be tested
(a valid statistical analysis implies a sufficient number of subjects)
• Segmentation of user groups tested, if more than one
• Key characteristics and capabilities of user group (user profile: age, gender, computing experience, product experience, etc.)
• How to select participants
• Differences between the participant sample and the user population
(e.g. actual users might have training whereas test subjects were untrained)
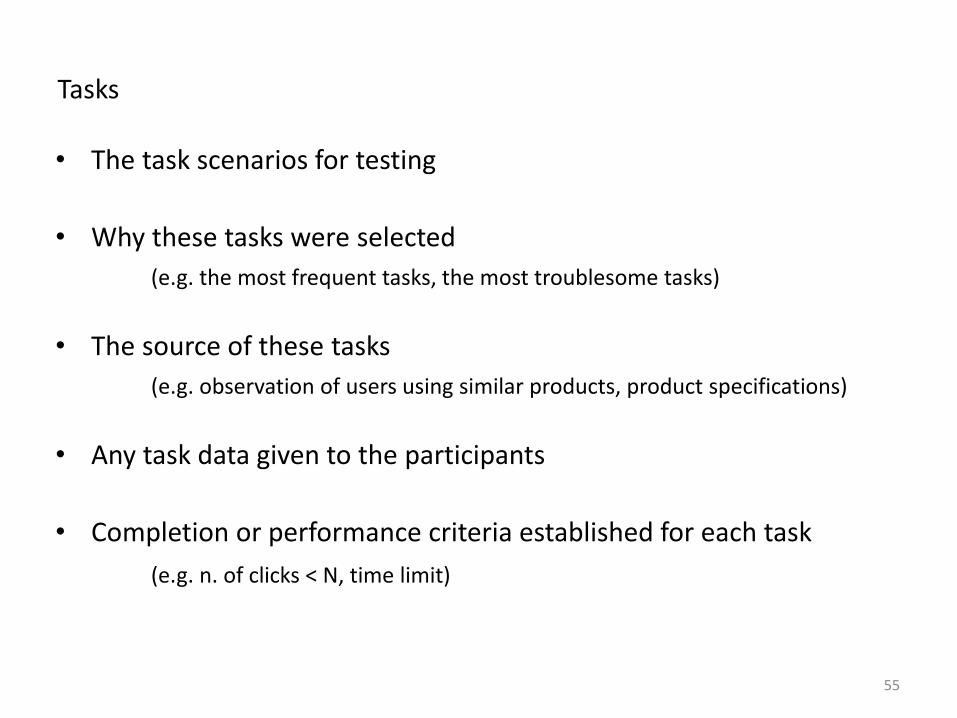
Tasks
55
• The task scenarios for testing
• Why these tasks were selected
(e.g. the most frequent tasks, the most troublesome tasks)
• The source of these tasks
(e.g. observation of users using similar products, product specifications)
• Any task data given to the participants
• Completion or performance criteria established for each task
(e.g. n. of clicks < N, time limit)
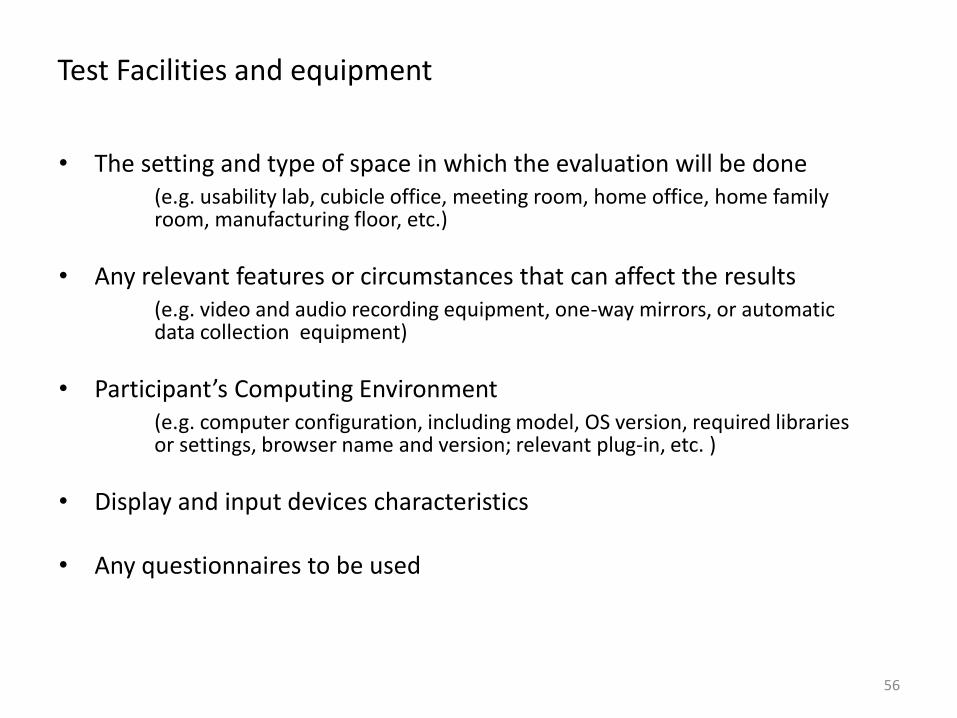
Test Facilities and equipment
• The setting and type of space in which the evaluation will be done (e.g. usability lab, cubicle office, meeting room, home office, home family room, manufacturing floor, etc.)
• Any relevant features or circumstances that can affect the results (e.g. video and audio recording equipment, one-way mirrors, or automatic data collection equipment)
• Participant’s Computing Environment (e.g. computer configuration, including model, OS version, required libraries or settings, browser name and version; relevant plug-in, etc. )
• Display and input devices characteristics
• Any questionnaires to be used
56
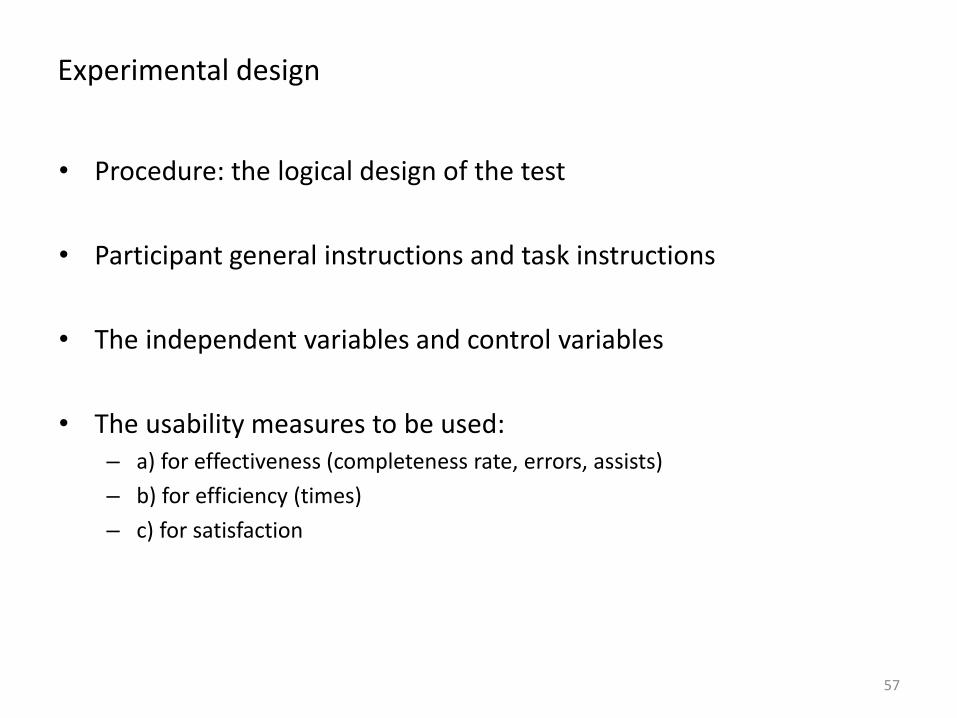
Experimental design
• Procedure: the logical design of the test
• Participant general instructions and task instructions
• The independent variables and control variables
• The usability measures to be used: – a) for effectiveness (completeness rate, errors, assists)
– b) for efficiency (times)
– c) for satisfaction
57
Ethics in applying empirical methods
Involving users implies specific cautions:
– Asking for explicit consent
– Confidentiality
– Security (avoid any risk)
– Freedom (users may give up at any time)
– Limit stress
It’s the system that is under evaluation not the user!
59
62
Evaluating Visualizations: examples@ua
Universidade de Aveiro Departamento de Electrónica, Telecomunicações e Informática
- Data Vis example: visualizing the Left Ventricle and quantifying its performance from Angio Computer Tomography data
- InfoVis example: comparing a modified pedigree tree visualization method with the original method
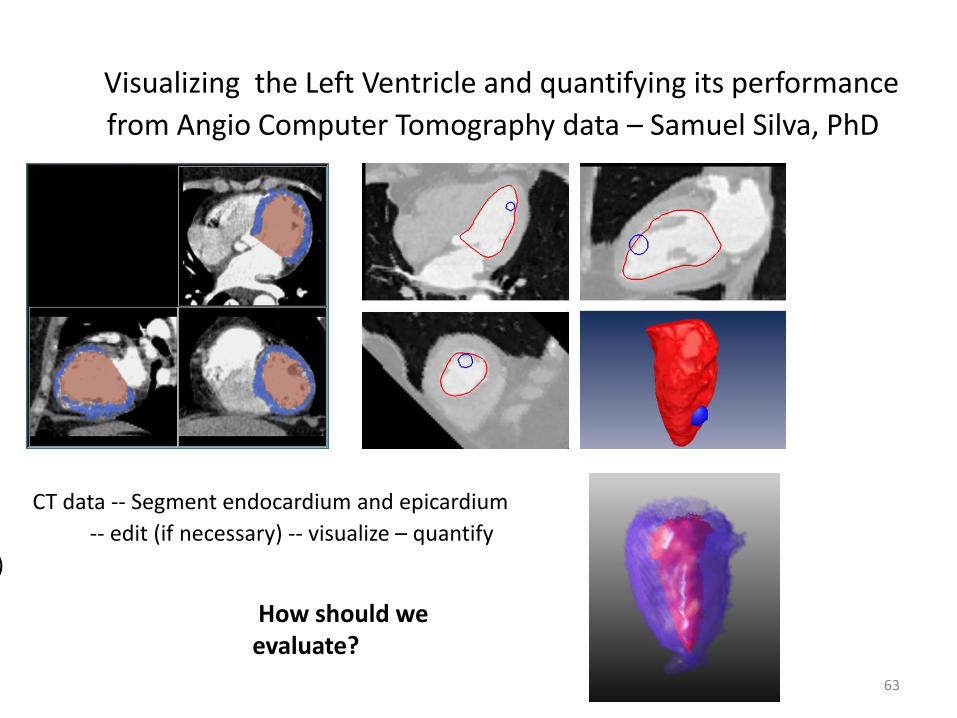
Visualizing the Left Ventricle and quantifying its performance
from Angio Computer Tomography data – Samuel Silva, PhD
CT data -- Segment endocardium and epicardium
-- edit (if necessary) -- visualize – quantify
)
How should we evaluate?
63

• Selecting a similarity measure to compare segmentations
• Evaluating a segmentation method
• Evaluating a 3D segmentation editing tool
.
64
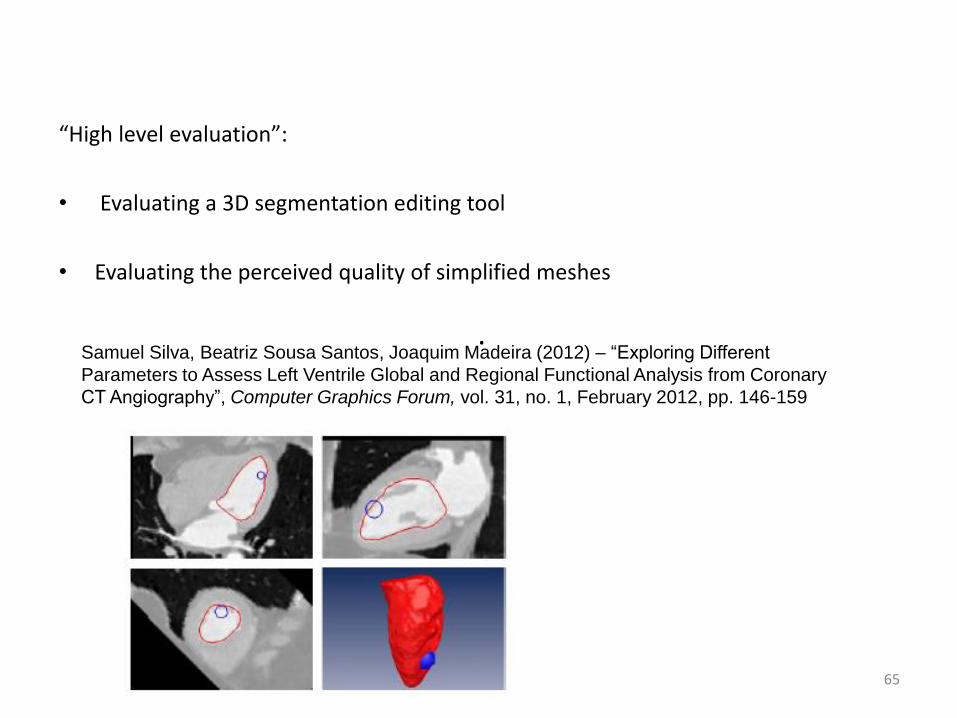
“High level evaluation”:
• Evaluating a 3D segmentation editing tool
• Evaluating the perceived quality of simplified meshes
.
65
Samuel Silva, Beatriz Sousa Santos, Joaquim Madeira (2012) – “Exploring Different
Parameters to Assess Left Ventrile Global and Regional Functional Analysis from Coronary
CT Angiography”, Computer Graphics Forum, vol. 31, no. 1, February 2012, pp. 146-159
66
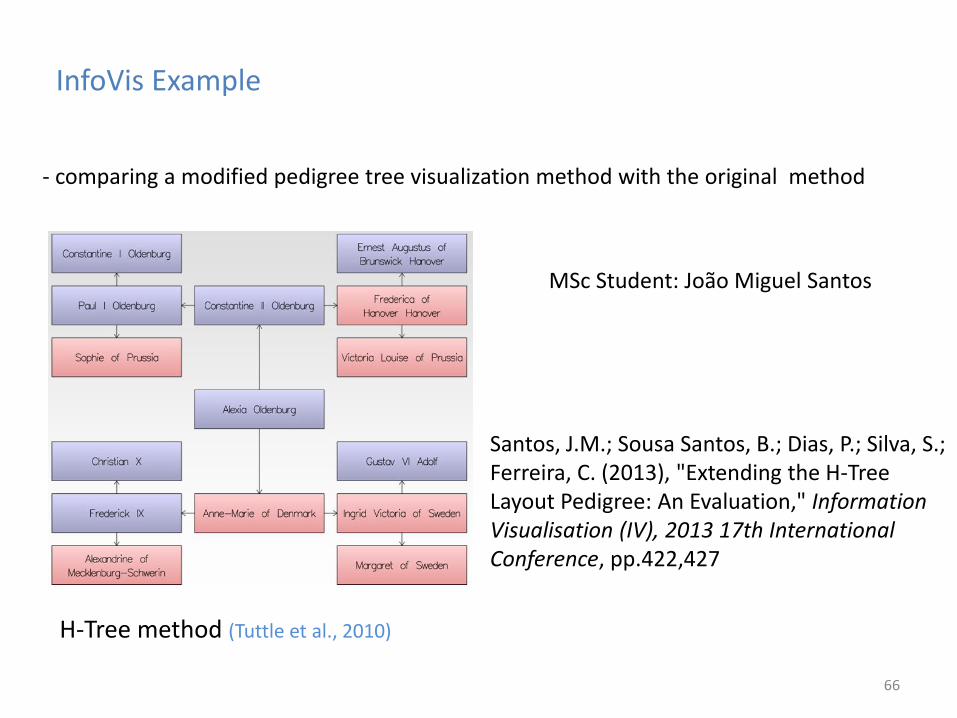
- comparing a modified pedigree tree visualization method with the original method
InfoVis Example
H-Tree method (Tuttle et al., 2010)
MSc Student: João Miguel Santos
Santos, J.M.; Sousa Santos, B.; Dias, P.; Silva, S.; Ferreira, C. (2013), "Extending the H-Tree Layout Pedigree: An Evaluation," Information Visualisation (IV), 2013 17th International Conference, pp.422,427
67
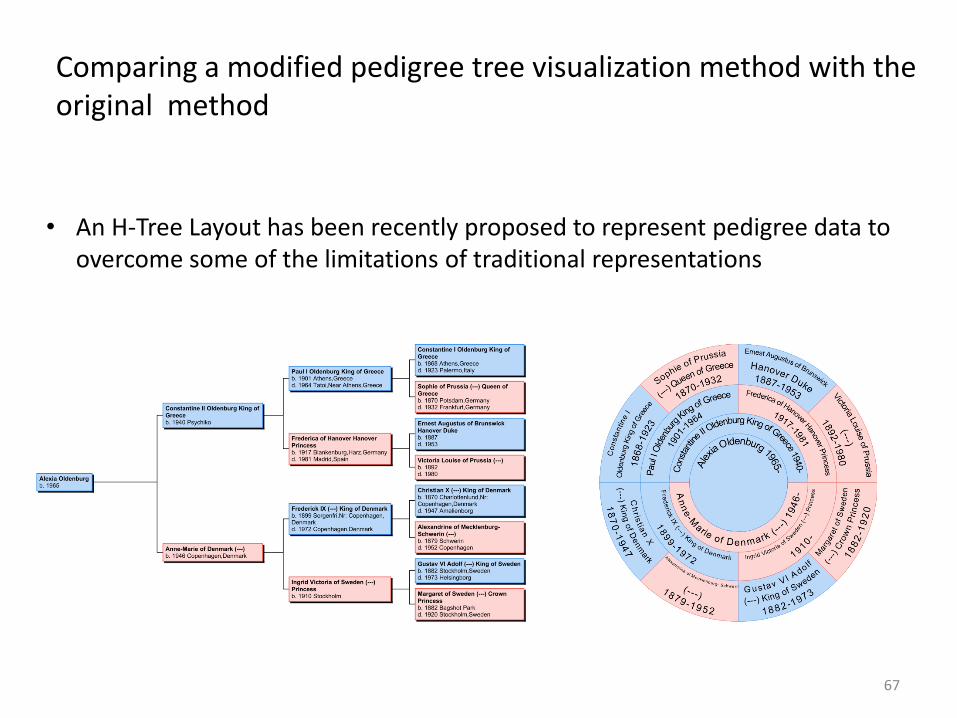
Comparing a modified pedigree tree visualization method with the original method
• An H-Tree Layout has been recently proposed to represent pedigree data to overcome some of the limitations of traditional representations

68
Traditional representations of pedigree trees
• Are only capable of representing a limited number of generations simultaneously
• Genealogy applications address this problem by combining:
- a small amount of generations at each time
- techniques such as zooming and panning
• A holistic vision of the whole family structure may be preferable (e.g. when):
- studying genetically transmitted diseases - tracing individuals’ genetic characteristics
69
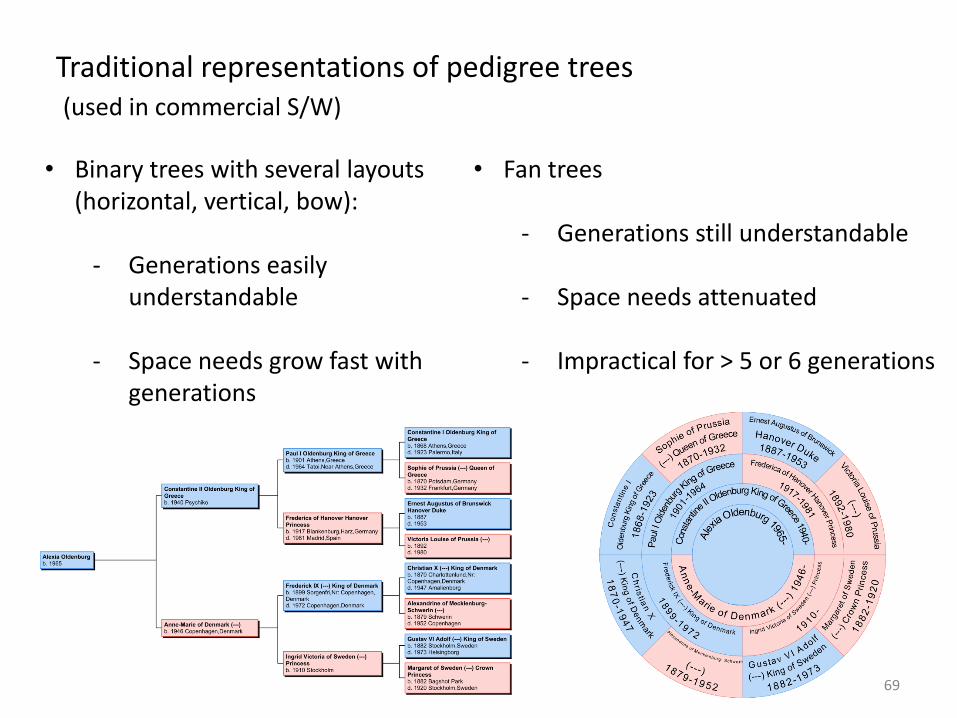
Traditional representations of pedigree trees (used in commercial S/W)
• Binary trees with several layouts (horizontal, vertical, bow):
- Generations easily
understandable
- Space needs grow fast with generations
• Fan trees
- Generations still understandable
- Space needs attenuated
- Impractical for > 5 or 6 generations
70
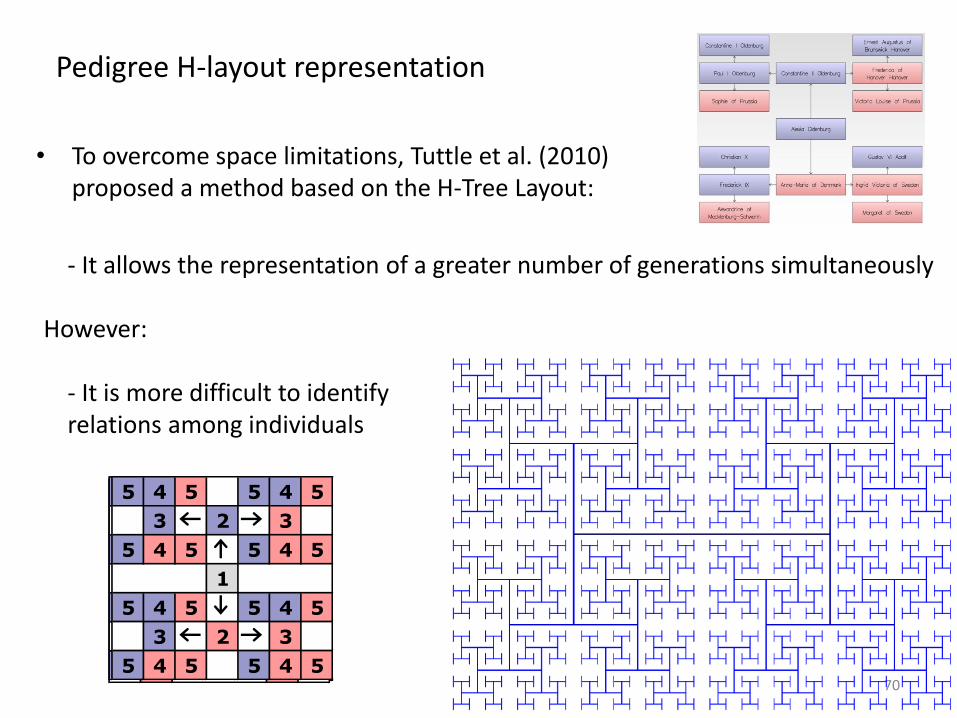
Pedigree H-layout representation
• To overcome space limitations, Tuttle et al. (2010)
proposed a method based on the H-Tree Layout:
- It allows the representation of a greater number of generations simultaneously
However: - It is more difficult to identify relations among individuals
2
1
2
3 2 3
1
3 2 3
4 4
3 2 3
4 4
1
4 4
3 2 3
4 4
5 4 5 5 4 5
3 2 3
5 4 5 5 4 5
1
5 4 5 5 4 5
3 2 3
5 4 5 5 4 5
5 4 5 5 4 5
3 2 3
5 4 5 5 4 5
1
5 4 5 5 4 5
3 2 3
5 4 5 5 4 5
71
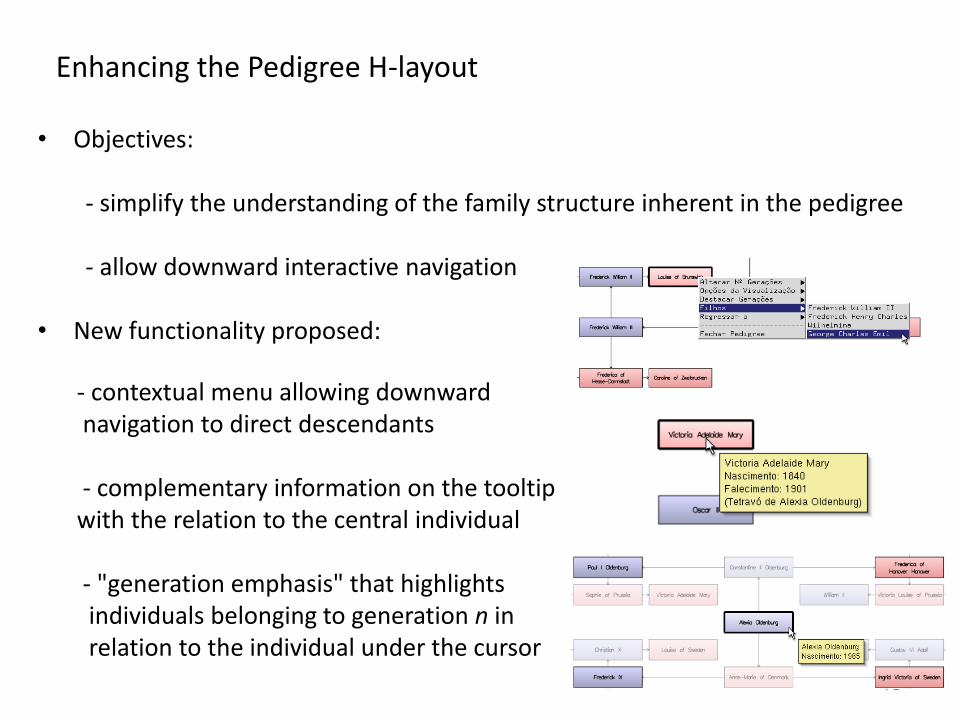
Enhancing the Pedigree H-layout
• Objectives:
- simplify the understanding of the family structure inherent in the pedigree - allow downward interactive navigation
• New functionality proposed:
- contextual menu allowing downward
navigation to direct descendants
- complementary information on the tooltip with the relation to the central individual
- "generation emphasis" that highlights individuals belonging to generation n in relation to the individual under the cursor

Evaluating the Enhanced Pedigree H-Tree
• Does the enhanced method better support the family structure understanding? (comparative evaluation)
• How good is the enhanced method (for specific tasks/users)?
(outright evaluation)
• Two types:
– Analytical
– Empirical
72
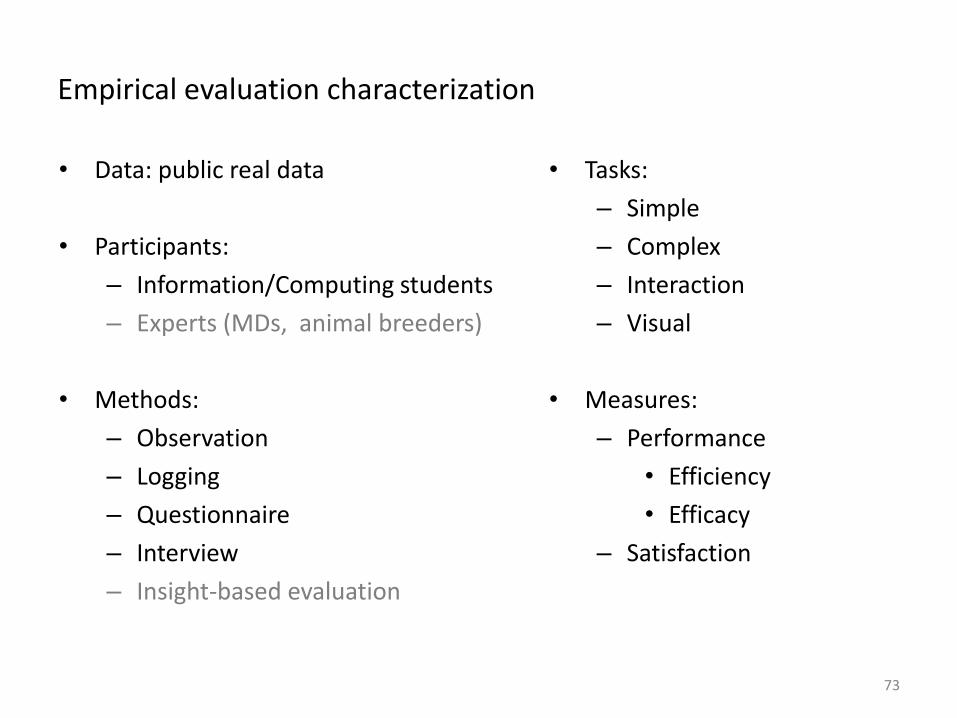
Empirical evaluation characterization
• Data: public real data
• Participants:
– Information/Computing students
– Experts (MDs, animal breeders)
• Methods:
– Observation
– Logging
– Questionnaire
– Interview
– Insight-based evaluation
• Tasks:
– Simple
– Complex
– Interaction
– Visual
• Measures:
– Performance
• Efficiency
• Efficacy
– Satisfaction
73
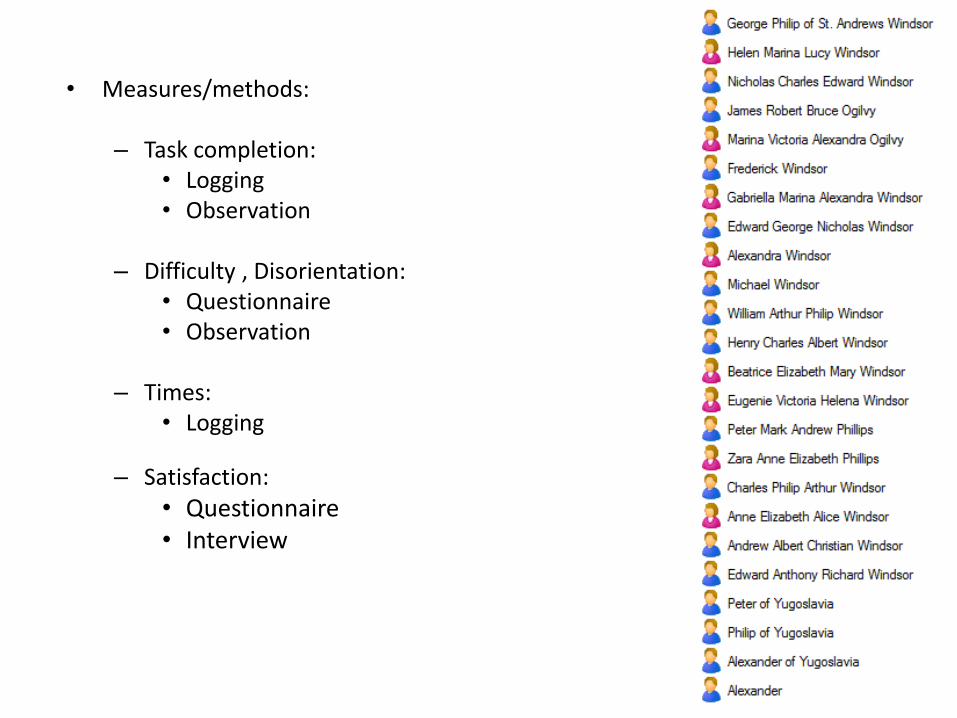
• Measures/methods:
– Task completion: • Logging • Observation
– Difficulty , Disorientation:
• Questionnaire • Observation
– Times:
• Logging
– Satisfaction:
• Questionnaire • Interview
74
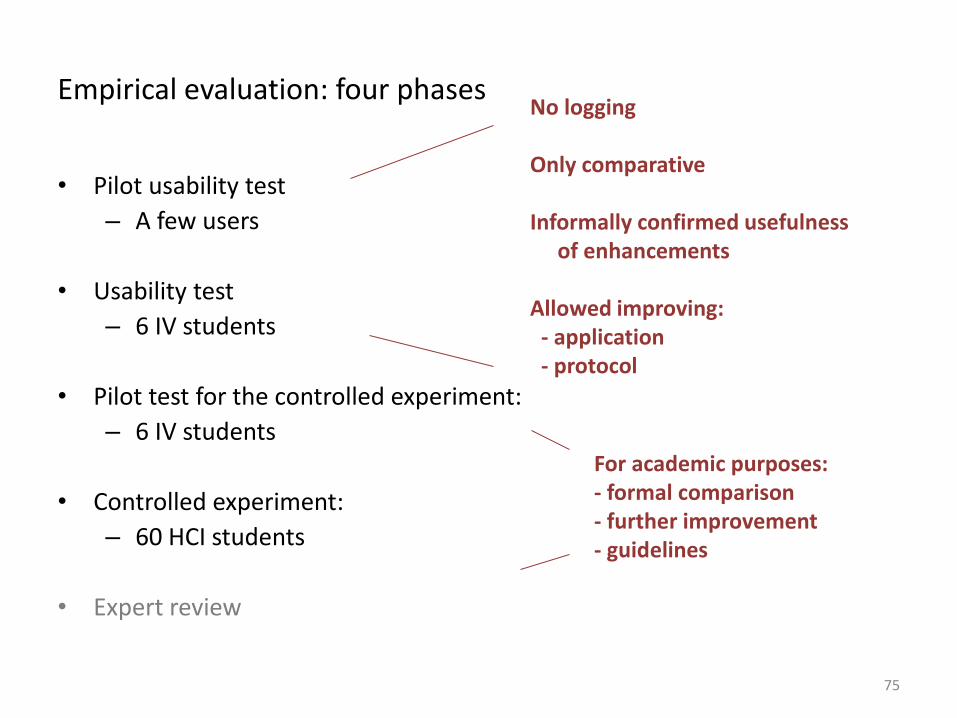
Empirical evaluation: four phases
• Pilot usability test
– A few users
• Usability test
– 6 IV students
• Pilot test for the controlled experiment:
– 6 IV students
• Controlled experiment:
– 60 HCI students
• Expert review
For academic purposes: - formal comparison - further improvement - guidelines
No logging Only comparative Informally confirmed usefulness of enhancements Allowed improving: - application - protocol
75
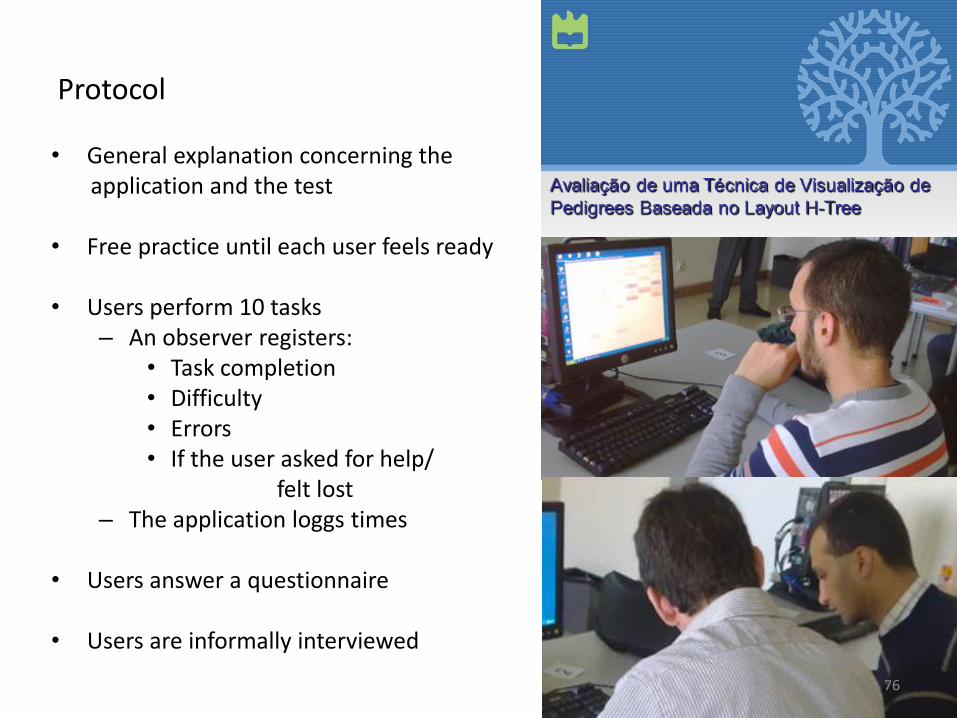
Protocol
• General explanation concerning the application and the test
• Free practice until each user feels ready
• Users perform 10 tasks
– An observer registers: • Task completion • Difficulty • Errors • If the user asked for help/ felt lost
– The application loggs times
• Users answer a questionnaire
• Users are informally interviewed
76
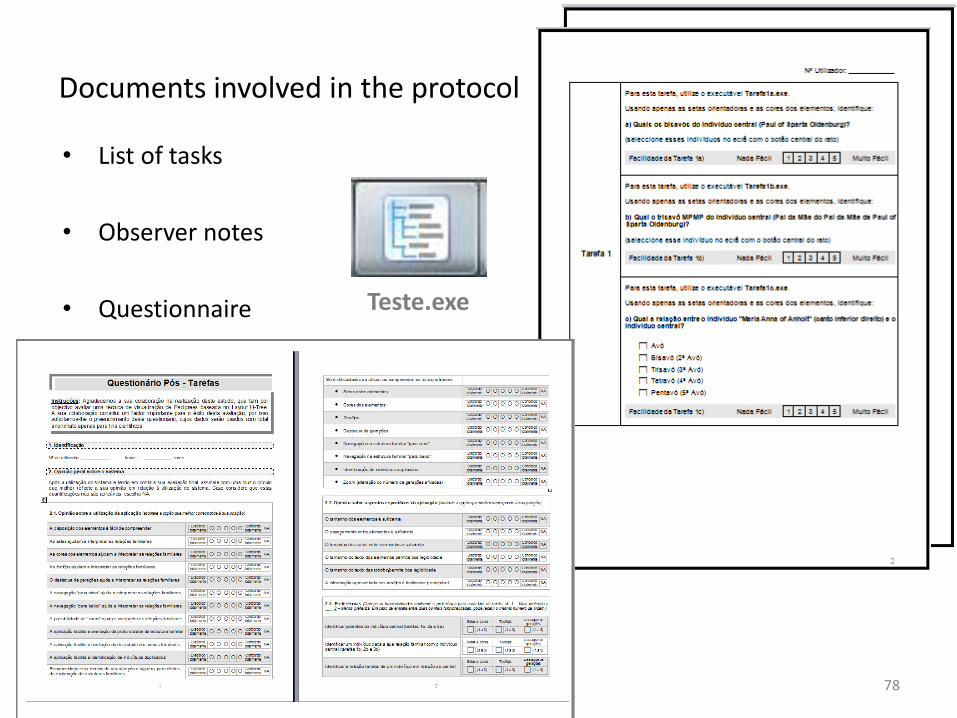
Documents involved in the protocol
• List of tasks
• Observer notes
• Questionnaire
78
Teste.exe
• Evaluating Visualizations is challenging
• It will become more challenging as Visualization evolves to be more
interactive, collaborative, distributed, multi-sensorial, mobile …
• It is fundamental to:
- evaluate solutions to specific cases
- develop new visualization methods / systems
- establish guidelines
- i.e. to make Visualization more useful, more usable, and more used
80
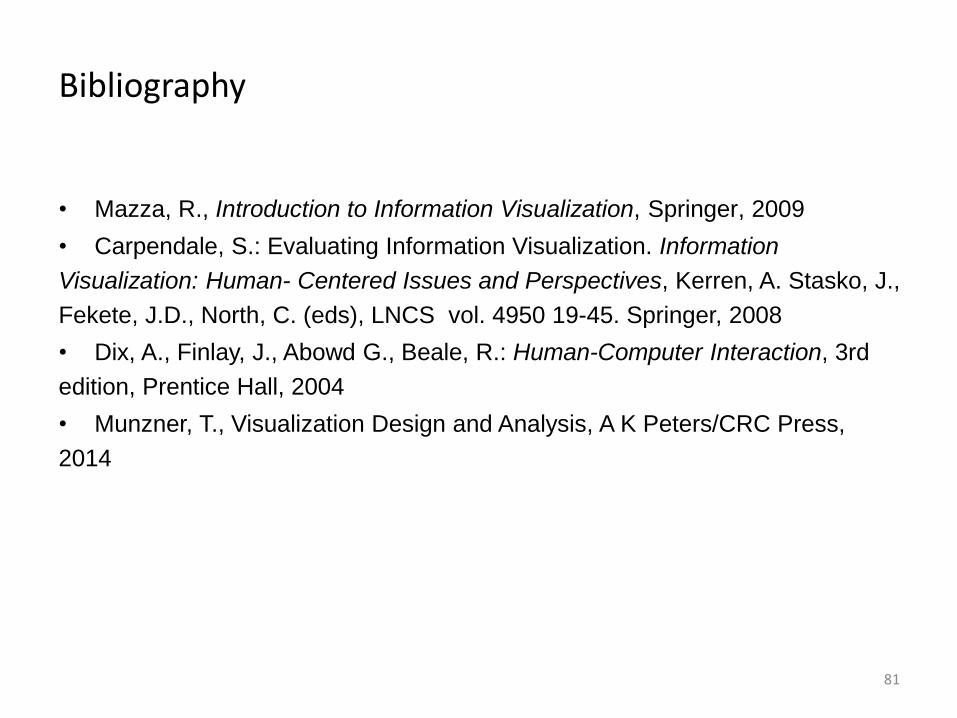
Bibliography
• Mazza, R., Introduction to Information Visualization, Springer, 2009
• Carpendale, S.: Evaluating Information Visualization. Information
Visualization: Human- Centered Issues and Perspectives, Kerren, A. Stasko, J.,
Fekete, J.D., North, C. (eds), LNCS vol. 4950 19-45. Springer, 2008
• Dix, A., Finlay, J., Abowd G., Beale, R.: Human-Computer Interaction, 3rd
edition, Prentice Hall, 2004
• Munzner, T., Visualization Design and Analysis, A K Peters/CRC Press,
2014
81

• Carpendale, S. Evaluating Information Visualizations Challenges in Evaluating Information Visualizations. In A. et al. Karren (Ed.), Information Visualization , Human-centered issues and perspectives, 2008, pp. 19 – 45.
• Ellis, G. and Dix, A. An Explorative Analysis of User Evaluation Studies in Information Visualisation. BELIV’06 Proceedings of the 2006 AVI workshop on BEyond time and errors: novel evaluation methods for information visualization, 2006.
• Forsell, C. , Johanson, J. An heuristic set for evaluation in information visualization. In Proceedings of the International Conference on Advanced Visual Interfaces AVI2010, 2010, pp. 199–206.
• Freitas, C. M. D. S., Pimenta, M. S., & Scapin, D. User-Centered Evaluation of Information Visualization Techniques : Issues and Perspectives. In Anais do Colóquio em Informática: Brasil / INRIA, Cooperações, Avanços e Desafios, 2009, pp. 2603–2606.
• Munzner, T.. A nested model for visualization design and validation. IEEE Transactions on Visualization and Computer Graphics. 15, 6, 2009, pp. 921–8.
• Munzner, T. Visualization Analysis and Design. A K Peters/CRC Press, 2014.
• Zuk, T., Schlesier, L., Neumann, P., Hancock, M. S., & Carpendale, S. Heuristics for Information Visualization Evaluation. In BELIV’06, 2006, pp. 1–6.
Evaluation in Visualization Bibliography

Usability Evaluation Bibliography – Books and links
• Alan Dix, Janet Finlay, Gregory Abowd, Russell Beale, Human-Computer Interaction, 3rd
edition, Prentice Hall, 2004
• Jackob Nielsen, Usability Engineering, Morgan Kaufmann, 1993
• Peter Mitchell, A Step-by-step Guide to Usability Testing, iUniverse, 2007
• Gilbert Cockton, Usability Evaluation. In: Soegaard, Mads and Dam, Rikke Friis (eds.), The Encyclopedia of Human-Computer Interaction, 2nd Ed, 2013, Aarhus, Denmark: The Interaction Design Foundation, 2013
http://www.interaction-design.org/encyclopedia/usability_evaluation.html
• Norman/ Nielsen Group - http://www.nngroup.com/articles/
• Standard ISO 9241-11 - Ergonomic requirements for office work with visual display
terminals Part 11 : Guidance on usability
• UXPA Code of Professional Conduct
http://www.usabilityprofessionals.org/about_upa/leadership/code_of_conduct.html
83
Usability Evaluation Bibliography - Papers
• Spencer, R. The Streamlined Cognitive Walkthrough Method, Working Around Social Constraints Encountered in a Software Development Company, CHI 2000 vol.2 issue 1, 2000, pp353–359
• Wharton, C. Bradford, J. Jeffries, J. Franzke, M. Applying Cognitive Walkthroughs to more Complex User Interfaces: Experiences, Issues and Recommendations CHI ’92, 1992, pp381–388
• Gilbert Cockton, Usability Evaluation. In: Soegaard, Mads and Dam, Rikke Friis (eds.), The Encyclopedia of Human-Computer Interaction, 2nd Ed, 2013, Aarhus, Denmark: The Interaction Design Foundation, 2013
http://www.interaction-design.org/encyclopedia/usability_evaluation.html
84
Evaluation in Visualization Links
• http://www.wikiviz.org/wiki/Information_Visualization_Evaluation#Evaluation_criteria
• BELIV
85