Embed Size (px)
Citation preview

Evaluation of a patient-reported continuity of care modelfor older adults
Suzanne E. Bentler • Robert O. Morgan •
Beth A. Virnig • Fredric D. Wolinsky
Accepted: 8 July 2013
� Springer Science+Business Media Dordrecht 2013
Abstract
Purpose Although continuity of care (CoC) is a corner-
stone of many health policies, there is no theoretically
driven model of CoC that incorporates the experiences of
older adults. We evaluated such a model in data collected
for another purpose.
Methods We used data on 2,620 Medicare beneficiaries
who completed all of the necessary components of the 2004
National Health and Health Services Use Questionnaire
(NHHSUQ). The NHHSUQ solicited information on usual
primary provider, place of care, and the quality and duration
of the patient–provider relationship. We used confirmatory
factor analysis to evaluate the patient-reported CoC model
and examined factorial invariance across sex, race/ethnic-
ity, Medicare plan type, and perceived health status.
Results Our thirteen-item CoC model consisted of longitu-
dinal (care site and provider duration) and interpersonal
(instrumental and affective) domains. Although the overall chi-
square goodness-of-fit statistic was significant (v2 = 1,091.8,
df = 57, p \ .001), model fit was good based on standard
indices (GFI = 0.94, NFI = 0.96, CFI = 0.96,
RMSEA = 0.08). Cronbach’s alpha for the longitudinal care
site (two items) and provider duration (three items) scales was
0.88 and 0.75, respectively, while the instrumental and affec-
tive relationship scales (four items each) were 0.88 and 0.87,
respectively. Factorial invariance between sexes was observed,
with relatively minor variance across race/ethnicity, Medicare
plan type, and perceived health.
Conclusion We evaluated a theoretically derived model
of CoC in older adults and found that the assessment of
CoC should include the patient experience of both the
longitudinal and the interpersonal dimensions of CoC.
Keywords Continuity of care � Patient reports �Older adults
Abbreviations
CAHPS Consumer Assessment of Healthcare
Providers and Systems
CFA Confirmatory factor analysis
CFI Comparative fit index
CoC Continuity of care
FFS Medicare fee-for-service
GFI Goodness-of-fit index
MCBS Medicare Current Beneficiary Survey
MMC Medicare managed care
NFI Normed fit index
NHHSUQ National health and health services use
questionnaire
PCMH Patient-centered medical home
RMSEA Root mean square error of approximation
TLI Tucker–Lewis index
Introduction
Over the past two decades, the Institute of Medicine has
consistently highlighted the importance of continuity of
S. E. Bentler (&) � F. D. Wolinsky
Department of Health Management and Policy, College of
Public Health, The University of Iowa, 105 North River Street,
N207-CPHB, Iowa City, IA 52246, USA
e-mail: [email protected]
R. O. Morgan
Division of Management, Policy, and Community Health,
University of Texas School of Public Health, Houston, TX, USA
B. A. Virnig
Division of Health Services Research and Policy, School of
Public Health, University of Minnesota, Minneapolis, MN, USA
123
Qual Life Res
DOI 10.1007/s11136-013-0472-z

care (CoC) for obtaining a high-quality health care system
in the United States [1, 2]. Thus, CoC has become a cor-
nerstone of many health policies, including the primary
care-based model of health care delivery known as the
patient-centered medical home (PCMH) [3, 4]. CoC within
the context of the PCMH and other health policies, how-
ever, is difficult to define and measure [5]. Many CoC
assessments used in evaluations derive from administrative
claims data [6, 7]. However, the importance of patient
reports is gaining recognition among those evaluating
health policies such as the PCMH [8–11]. Yet, there are
few theoretically driven, patient-reported models of CoC
especially that incorporate the constructs of knowledge,
trust, and respect within the enduring patient–provider
relationship and particularly that are specific to older adults
[6, 7, 12].
Theoretical dimensions of CoC have been proposed
previously. In 2003, John Saultz published a conceptual
hierarchy for CoC that included informational (medical
record knowledge), longitudinal (ongoing healthcare
interactions), and interpersonal (patient–provider rela-
tionship) dimensions of continuity. The underlying
implication of this hierarchy is that at least some infor-
mational CoC is required to establish longitudinal CoC
and one could only have interpersonal CoC in the
presence of longitudinal CoC [13]. And, within the
interpersonal CoC dimension, there are affective (mode
of provider behavior toward the patient) and instrumental
(content of provider knowledge about the patient) sub-
components of the patient–provider relationship [14, 15].
In practice, medical records, billing claims, or patient
reports could be used to measure informational and
longitudinal CoC, but only patient and/or provider
reports could adequately measure the interpersonal CoC
dimensions.
The main objective of this research was to evaluate a
theoretically derived, patient-reported CoC model for
older adults, who are most likely to benefit from CoC
given their propensity to have multiple chronic condi-
tions needing management [16, 17]. To do this, we used
patient reports from 2,620 Medicare beneficiaries who
completed all of the necessary components of the 2004
National Health and Health Services Use Questionnaire
(NHHSUQ) [18, 19]. The NHHSUQ collected self-
reported data on usual primary provider and place of
care, as well as data on the quality and duration of the
patients’ relationship with their provider. These data
enabled us to empirically evaluate a multidimensional
model of CoC that incorporates two of the theoretically
key patient-reported aspects of continuity—longitudinal
(with site and provider) and interpersonal (of both the
affective and instrumental relationship).
Methods
Study design
The NHHSUQ survey was designed to identify factors
affecting enrollment in Medicare managed care plans [19].
It was mailed to a disproportionately stratified random
sample of 6,060 community-residing Medicare beneficia-
ries 65 years old or older in the fall of 2004 to obtain equal
numbers of participants with regard to race/ethnicity
(white, black, Hispanic), Medicare plan type [Medicare
fee-for-service (FFS) or Medicare managed care (MMC)],
sex, and population density (metropolitan or nonmetro-
politan). The sampling frame included six urban areas (Los
Angeles, Phoenix, Chicago, Houston, New York City, and
Tampa) and nonmetropolitan counties in three broad
regions—the southwest (California, Nevada, and Arizona),
mid-south (Texas and Louisiana), and southeast (Florida).
These regions provided wide geographic diversity and
comparable numbers of MMC and FFS enrollees in each of
the race/ethnicity and sex groups. After adjusting for the
363 survey recipients who were ineligible (e.g., noncom-
munity residing, moved out of the geographic area, or died
before the survey was mailed), the overall response rate
was 53 % (2,997/5,697) [19]. Both the Baylor College of
Medicine and University of Iowa institutional review
boards approved this study.
Measures
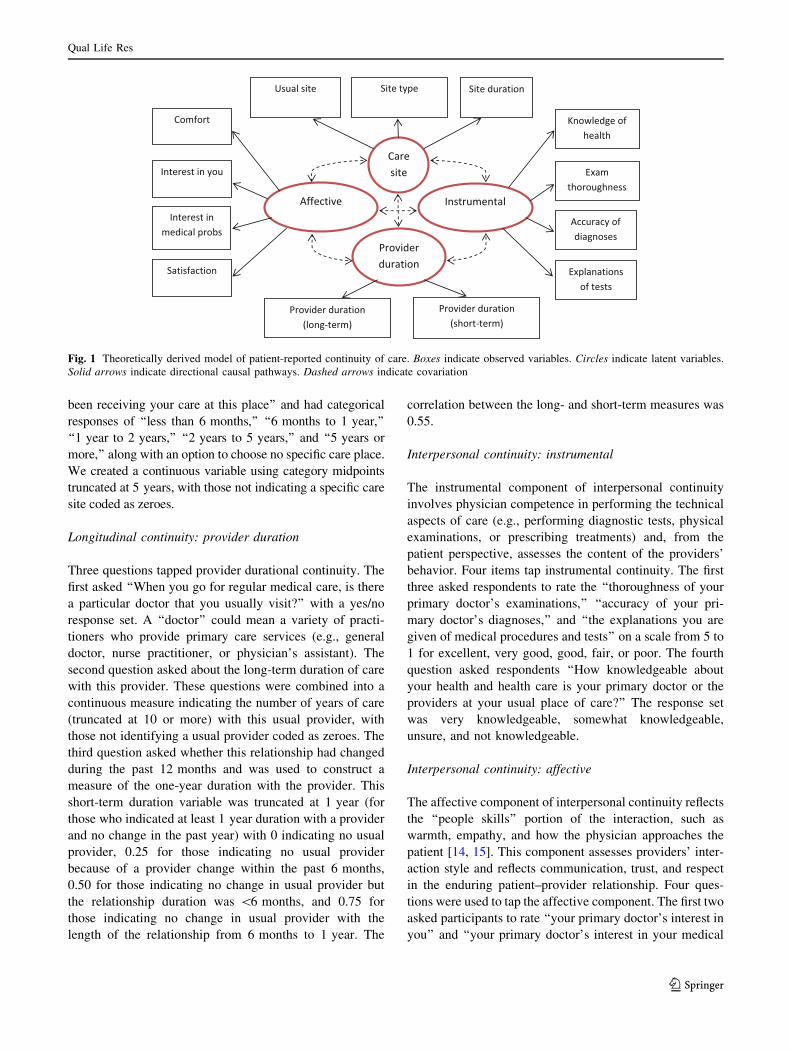
We hypothesized and evaluated a model of self-reported
continuity using the NHHSUQ data. This theoretically
derived CoC model has four dimensions: longitudinal
continuity of the care site and provider, and instrumental
and affective interpersonal continuity. Figure 1 depicts this
a priori conceptualization.
Longitudinal continuity: care site
The NHHSUQ asked two questions about the usual place of
care. The first was, ‘‘Of the places you go for medical care,
where do you go most often for care if you are sick or need
advice about your health?’’ Reponses included a doctor’s
office or clinic, walk-in urgent care center or emergency room,
Veteran’s Affairs Medical Center (VAMC), other, or ‘‘no
specific place I visit most often for care.’’ We created a binary
marker for any usual place of care, and an ordinal variable for
the type of care site that ranked the responses from the least to
the most conducive setting to promote continuity of care
(0 = no specific place, 1 = other, nonspecific, 2 = urgent
care/emergency room, 3 = VAMC, 4 = doctor’s office).
The second question was ‘‘Approximately how long have you
Qual Life Res
123
been receiving your care at this place’’ and had categorical
responses of ‘‘less than 6 months,’’ ‘‘6 months to 1 year,’’
‘‘1 year to 2 years,’’ ‘‘2 years to 5 years,’’ and ‘‘5 years or
more,’’ along with an option to choose no specific care place.
We created a continuous variable using category midpoints
truncated at 5 years, with those not indicating a specific care
site coded as zeroes.
Longitudinal continuity: provider duration
Three questions tapped provider durational continuity. The
first asked ‘‘When you go for regular medical care, is there
a particular doctor that you usually visit?’’ with a yes/no
response set. A ‘‘doctor’’ could mean a variety of practi-
tioners who provide primary care services (e.g., general
doctor, nurse practitioner, or physician’s assistant). The
second question asked about the long-term duration of care
with this provider. These questions were combined into a
continuous measure indicating the number of years of care
(truncated at 10 or more) with this usual provider, with
those not identifying a usual provider coded as zeroes. The
third question asked whether this relationship had changed
during the past 12 months and was used to construct a
measure of the one-year duration with the provider. This
short-term duration variable was truncated at 1 year (for
those who indicated at least 1 year duration with a provider
and no change in the past year) with 0 indicating no usual
provider, 0.25 for those indicating no usual provider
because of a provider change within the past 6 months,
0.50 for those indicating no change in usual provider but
the relationship duration was \6 months, and 0.75 for
those indicating no change in usual provider with the
length of the relationship from 6 months to 1 year. The
correlation between the long- and short-term measures was
0.55.
Interpersonal continuity: instrumental
The instrumental component of interpersonal continuity
involves physician competence in performing the technical
aspects of care (e.g., performing diagnostic tests, physical
examinations, or prescribing treatments) and, from the
patient perspective, assesses the content of the providers’
behavior. Four items tap instrumental continuity. The first
three asked respondents to rate the ‘‘thoroughness of your
primary doctor’s examinations,’’ ‘‘accuracy of your pri-
mary doctor’s diagnoses,’’ and ‘‘the explanations you are
given of medical procedures and tests’’ on a scale from 5 to
1 for excellent, very good, good, fair, or poor. The fourth
question asked respondents ‘‘How knowledgeable about
your health and health care is your primary doctor or the
providers at your usual place of care?’’ The response set
was very knowledgeable, somewhat knowledgeable,
unsure, and not knowledgeable.
Interpersonal continuity: affective
The affective component of interpersonal continuity reflects
the ‘‘people skills’’ portion of the interaction, such as
warmth, empathy, and how the physician approaches the
patient [14, 15]. This component assesses providers’ inter-
action style and reflects communication, trust, and respect
in the enduring patient–provider relationship. Four ques-
tions were used to tap the affective component. The first two
asked participants to rate ‘‘your primary doctor’s interest in
you’’ and ‘‘your primary doctor’s interest in your medical
Fig. 1 Theoretically derived model of patient-reported continuity of care. Boxes indicate observed variables. Circles indicate latent variables.
Solid arrows indicate directional causal pathways. Dashed arrows indicate covariation
Qual Life Res
123

problems’’ on a scale from 5 to 1 for excellent, very good,
good, fair, or poor. The third question asked participants
‘‘how satisfied are you with your health care’’ on a scale
from 4 to 1 for very satisfied, somewhat satisfied, somewhat
dissatisfied, and very dissatisfied, with ‘‘not sure’’ responses
coded as 2.5. The fourth question asked ‘‘How comfortable
are you with your primary doctor or with the providers at
your usual place of care’’ on a scale from 5 to 1 for very
comfortable, somewhat comfortable, not sure, somewhat
uncomfortable, and very uncomfortable.
Statistical analyses
AMOS version 20 [20] and SPSS version 20 were used for
all analyses. As a first step, sensitivity analyses were
conducted after alternately assigning the lowest level of
continuity to ‘‘not sure’’ responses (assuming those stating
uncertainty perhaps had limited continuity); because these
results were essentially equivalent, the original coding was
retained. We used confirmatory factor analysis (CFA) to
formally evaluate the conceptual model shown in Fig. 1
and the alternative models (based on modification and fit
indices) that imposed additional constraints to identify the
best configural model representing the data. For the initial
model, items were allowed to load on a single latent factor
only, errors were uncorrelated, and the factors were
allowed to covary. We also evaluated two alternative
higher-order models to account for the potential hierar-
chical nature of CoC and compared them to the four-factor
model. The first included interpersonal continuity (from the
instrumental and affective factors) and longitudinal conti-
nuity (from the care site and provider duration factors) as
second-order factors, and the second included one higher-
order construct, Continuity.
We evaluated the CFA models using a range of fit
measures. Because the overall chi-squared goodness-of-fit
statistics are more sensitive to large sample sizes [21], we
expected inflated chi-square statistics. Therefore, we also
selected and reviewed several other fit indices that are less
influenced by sample size, including the goodness-of-fit
index (GFI), the normed fit index (NFI), the comparative fit
index (CFI), and the Tucker–Lewis index (TLI). Values of
these indices range from 0 to 1, with values of C0.90
indicating a good fit and values C0.95 indicating an
excellent fit [22]. We also evaluated the root mean square
error of approximation (RMSEA) statistic that is sensitive
to model complexity [23]. RMSEA values also range from
0 to 1, with values B0.05 indicative of a good fit and values
up to 0.10 suggesting adequate fit. Cronbach’s alpha [24]
was calculated to assess the internal consistency of the final
four-factor model with values greater than 0.70 considered
acceptable. To evaluate whether the complex, stratified
sampling design had any effect on our final model, we
reestimated the model after applying the sampling weights
by using a weighted correlation matrix as the input data
file.
The final model was evaluated for factorial equivalence
across sex, race/ethnicity, Medicare plan type, as well as a
median split on general health status. Sex and race/eth-
nicity were self-reported, and factorial equivalence was
expected. Medicare plan type was defined as FFS or MMC
at the time of the survey. We hypothesized that differences
might exist between FFS and MMC respondents because
options for health care might be dictated by health plan
restrictions. We created two health status groups based on
responses to the self-rated health question from the SF-8
Health Survey [25]—good general health (responses of
‘‘excellent,’’ ‘‘very good,’’ or ‘‘good’’) and not good gen-
eral health (responses of ‘‘fair,’’ ‘‘poor,’’ or ‘‘very poor’’)—
because CoC perceptions might vary based on health
status.
Because our objective was to evaluate the consistency of
the final model across the various groups, our multigroup
analyses fitted a model that imposed constraints by forcing
the factor loadings to be equal across groups and compared
this to the baseline configural model without constraints.
Measurement invariance holds if the constraints make a
significant improvement in the model fit. One assessment
of whether or not there is significant improvement is to
assess the Dv2 between the two models. Failure to observe
statistical differences between the baseline configural
model and the constrained models when examining the Dv2
is one indicator of factorial invariance across groups.
However, since Dv2 is a function of sample size and we
have a relatively large sample, using the change of fit
indices (noted above) to determine whether factorial
invariance holds is recommended. [26–29].
Results
Respondent characteristics
Of the 2,997 respondents in the NHHSUQ survey, 2,620
(87.4 %) had complete responses to all items used in the
CFA models. Table 1 displays the characteristics of these
respondents. Age ranged from 65 to 100 years old (mean
age = 74.3; SD = 6.5). Most respondents had at least a
high school education (65 %), 49 % reported an annual
income \$20,000, and most (61 %) reported good to
excellent health. By design, the sex, race-ethnic, and care
plan distributions were nearly equivalent. Fifty-one percent
were men, 38 % were white, 30 % black, and 30 % His-
panic, and about half were in managed Medicare care plans
(53 %). Also by design, most respondents were from urban
areas (62 %).
Qual Life Res
123

Confirmatory factor analyses
CFA was initially conducted on the model shown in Fig. 1,
which assumes that each of the error terms are independent
and the four factors are correlated. With the exception of
‘‘Site duration,’’ the items generally had strong loadings as
hypothesized (ranging from 0.55 to 0.97). The chi-square
goodness-of-fit was 2,828.7 with 59 degrees of freedom
(df) and was statistically significant (p \ .001). The other
fit indices indicated that the model did not fit the
data adequately (GFI = 0.86, CFI = 0.89, NFI = 0.89,
TLI = 0.86, and RMSEA = 0.13).
In our conceptual model, the ‘‘Site duration’’ item was
included with the Care Site construct because the focus of
the construct was continuity at a care site. However, based
on the modification indices from the initial CFA, it was
apparent that the ‘‘Site duration’’ item contributed far more
to the Provider Duration construct than the Care Site con-
struct. In hindsight, this is intuitively plausible because
providers are nested within care sites. Therefore, it is rea-
sonable that duration with a care site might also contribute
to a Provider Duration construct. In effect, this created a
Care Site construct specific to the identification of a usual
care site/provider of care and a Provider Duration construct
specific to the notion of duration of continuity, with both
constructs theoretically contributing to longitudinality.
Upon additional review of the modification indices, the
error terms between ‘‘Satisfaction’’ and ‘‘Comfort,’’ and
between ‘‘Site duration’’ and ‘‘Provider duration (long-
term)’’ were allowed to correlate (i.e., were freely esti-
mated). Standardized factor loadings were all above 0.50
except for the ‘‘Site duration’’ item, which had a factor
loading of 0.42. These changes drastically reduced the chi-
square (1,091.8, df = 57) although it remained statistically
significant. The other fit indices, however, indicated that
this revised model had an adequate to good fit (GFI = 0.94,
CFI = 0.96, NFI = 0.96, TLI = 0.95, RMSEA = 0.08).
Cronbach’s alpha coefficients for the longitudinal con-
tinuity scales of care site (two items) and provider duration
(three items) were 0.88 and 0.75, respectively, for this
second model. The instrumental and affective relationship
continuity scales (each with four items) had Cronbach’s
alpha coefficients of 0.88 and 0.87, respectively. Thus, all
four scale constructs had acceptable internal consistency.
The correlations between the four factors ranged from 0.11
(between care site and both affective and instrumental) to
0.89 (between affective and instrumental). Based on the
modification indices for Model 2, we allowed the error
term for ‘‘Knowledge of health’’ to be correlated with the
error term for ‘‘Comfort’’ in Model 3. This cross-factor
correlation (factorial complexity) improved the fit (chi-
square = 752.4, df = 56; p \ .001); however, the GFI,
CFI, NFI, TLI, and RMSEA values remained virtually
unchanged. Because the fit indices did not markedly
improve with the addition of the cross-factor correlation,
Model 2 was retained as the four-factor configural model to
compare with the higher-order alternative models.
The first alternative hierarchical model included the two
second-order latent constructs of Interpersonal and Longi-
tudinal continuity, and the model chi-square was 1,093.59
(df = 58). The addition of the two second-order constructs
did not significantly improve the model fit (v2diff ¼ 1:8;
df = 1; p [ .05). The second alternative hierarchical model
included one second-order latent construct (Continuity),
Table 1 Characteristics of respondents to the NHHSUQ survey
(n = 2,620)
Characteristic Number of
respondents
Percentage
Age
65–74 1,479 56.5
C75 1,127 43.0
Missing 14 0.5
Sex
Female 1,276 49
Male 1,344 51
Race/ethnicity
White 1,002 38
Black 794 30
Hispanic 775 30
Other 49 2
Medicare plan type
Traditional fee-for-service 1,219 47
Medicare managed care 1,401 53
Population density
Metropolitan 1,624 62
Nonmetropolitan 996 38
Income ($)
C35,000 542 21
20,000–34,999 594 23
\20,000 1,271 49
Not reported 213 8
Education
CHigh school 1,698 65
\High school 820 31
Not reported 102 4
SF-8a general health status
Good, very good, excellent 1,592 61
Fair, poor, very poor 1,000 38
Missing 28 1
a The SF-8TM health survey
Qual Life Res
123

and the model chi-square was 1,180.74 (df = 59) with the
chi-square difference test (v2diff ¼ 88:9; df = 2; p \ .001)
indicating that this specification also did not improve the
model fit. Applying the sampling weights to these models
did not appreciably alter the findings. Factor loadings dif-
fered primarily at the second decimal and goodness-of-fit
criteria differed at the third decimal (results available upon
request). Given these findings and due to software limita-
tions, the unweighted, first-order model in Fig. 2 was
retained for evaluating factorial invariance.
Factorial invariance
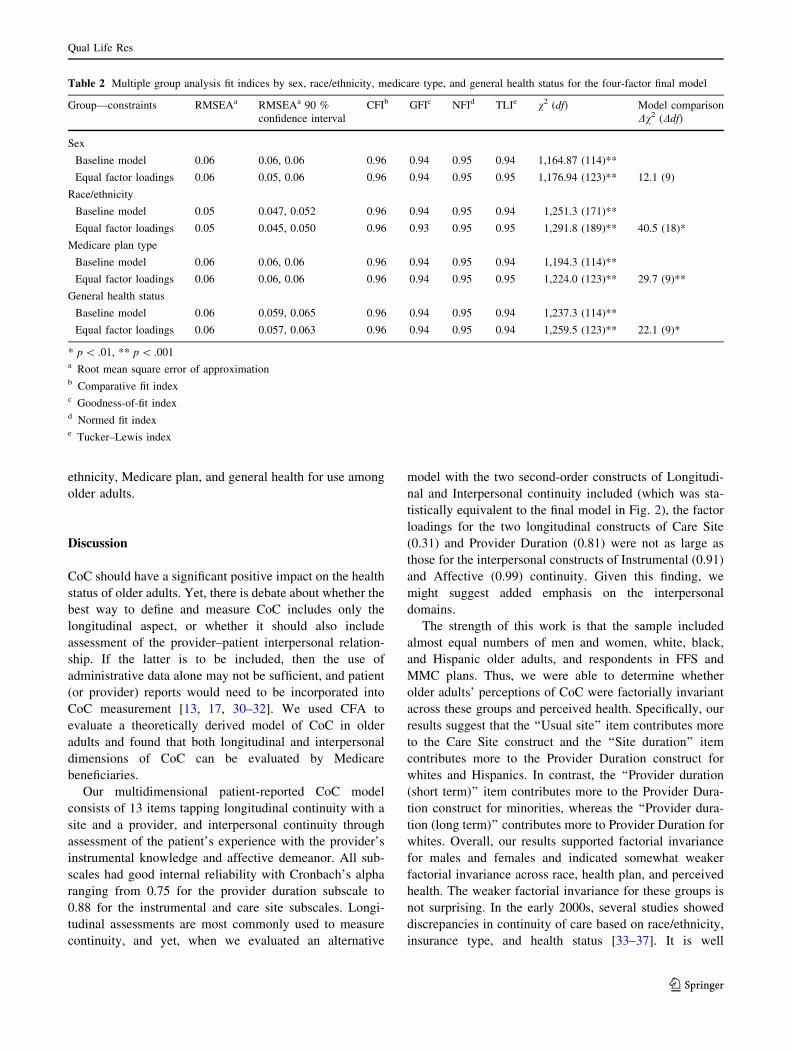
Table 2 presents the multiple group CFA fit indices for the
four-factor configural model across sex, race/ethnicity,
Medicare plan type, and general health status. For each
analysis (with the exception of sex), the model comparison
chi-square values were statistically significant (p \ .01),
suggesting potential model differences across the groups.
All factor loading differences between Medicare plan
types, health status, or among race/ethnic groups were less
than 0.10 with the following exceptions. Factor loadings
for two items, ‘‘Usual site’’ and ‘‘Site duration,’’ were
higher for whites (?0.16 and ?0.24, respectively) and
Hispanics (?0.18 and ?0.12, respectively) compared to
blacks. For the ‘‘Provider duration (long term)’’ item,
factor loadings were higher for whites than either His-
panics (?0.17) or blacks (?0.24), but for the ‘‘Provider
duration (short term)’’ item, factor loadings were lower for
whites compared to either Hispanics (-0.20) or blacks
(-0.21). However, given these minimal differences along
with good overall model fit (RMSEA \ 0.08 and CFI, GFI,
NFI, and TLI [ 0.95), the first-order, four-factor model
(Model 2) is sufficiently consistent across sex, race/
.84
.87
.77
.30
.94
.31
.35
.69
.90
.18
.45
.65
.50
.81
.42
.95
.83
.60
.56
.97
.97.95
.25
.27
.10
.43
.25
.11
.55
.88
.93
E1
E2
E3
EExam thoroughness
Instrumental
EAccuracy of diagnosis
Explanations of tests
Knowledge of health
Interest in you
Interest in medical probs
Satisfaction
Comfort
Usual site
Site type
Site duration
Provider duration (long-term)
Provider duration (short-term)
Affective
Care Site
Provider Duration
E4
E5
E6
E7
E8
E9
E10
E11
E12
E13
.92
.89
.67
RMSEA (90 % CI) CFI GFI NFI TLI 2 (df) p-value
0.08 (0.08, 0.09) 0.96 0.94 0.96 0.95 1091.8 (57) p<.001
Fig. 2 CFA model of
continuity. Boxes indicate
observed factors, and circles
indicate latent factors. Single-
headed arrows indicate direct
causal pathways, and double-
headed arrows represent
covariation
Qual Life Res
123
ethnicity, Medicare plan, and general health for use among
older adults.
Discussion
CoC should have a significant positive impact on the health
status of older adults. Yet, there is debate about whether the
best way to define and measure CoC includes only the
longitudinal aspect, or whether it should also include
assessment of the provider–patient interpersonal relation-
ship. If the latter is to be included, then the use of
administrative data alone may not be sufficient, and patient
(or provider) reports would need to be incorporated into
CoC measurement [13, 17, 30–32]. We used CFA to
evaluate a theoretically derived model of CoC in older
adults and found that both longitudinal and interpersonal
dimensions of CoC can be evaluated by Medicare
beneficiaries.
Our multidimensional patient-reported CoC model
consists of 13 items tapping longitudinal continuity with a
site and a provider, and interpersonal continuity through
assessment of the patient’s experience with the provider’s
instrumental knowledge and affective demeanor. All sub-
scales had good internal reliability with Cronbach’s alpha
ranging from 0.75 for the provider duration subscale to
0.88 for the instrumental and care site subscales. Longi-
tudinal assessments are most commonly used to measure
continuity, and yet, when we evaluated an alternative
model with the two second-order constructs of Longitudi-
nal and Interpersonal continuity included (which was sta-
tistically equivalent to the final model in Fig. 2), the factor
loadings for the two longitudinal constructs of Care Site
(0.31) and Provider Duration (0.81) were not as large as
those for the interpersonal constructs of Instrumental (0.91)
and Affective (0.99) continuity. Given this finding, we
might suggest added emphasis on the interpersonal
domains.
The strength of this work is that the sample included
almost equal numbers of men and women, white, black,
and Hispanic older adults, and respondents in FFS and
MMC plans. Thus, we were able to determine whether
older adults’ perceptions of CoC were factorially invariant
across these groups and perceived health. Specifically, our
results suggest that the ‘‘Usual site’’ item contributes more
to the Care Site construct and the ‘‘Site duration’’ item
contributes more to the Provider Duration construct for
whites and Hispanics. In contrast, the ‘‘Provider duration
(short term)’’ item contributes more to the Provider Dura-
tion construct for minorities, whereas the ‘‘Provider dura-
tion (long term)’’ contributes more to Provider Duration for
whites. Overall, our results supported factorial invariance
for males and females and indicated somewhat weaker
factorial invariance across race, health plan, and perceived
health. The weaker factorial invariance for these groups is
not surprising. In the early 2000s, several studies showed
discrepancies in continuity of care based on race/ethnicity,
insurance type, and health status [33–37]. It is well
Table 2 Multiple group analysis fit indices by sex, race/ethnicity, medicare type, and general health status for the four-factor final model
Group—constraints RMSEAa RMSEAa 90 %
confidence interval
CFIb GFIc NFId TLIe v2 (df) Model comparison
Dv2 (Ddf)
Sex
Baseline model 0.06 0.06, 0.06 0.96 0.94 0.95 0.94 1,164.87 (114)**
Equal factor loadings 0.06 0.05, 0.06 0.96 0.94 0.95 0.95 1,176.94 (123)** 12.1 (9)
Race/ethnicity
Baseline model 0.05 0.047, 0.052 0.96 0.94 0.95 0.94 1,251.3 (171)**
Equal factor loadings 0.05 0.045, 0.050 0.96 0.93 0.95 0.95 1,291.8 (189)** 40.5 (18)*
Medicare plan type
Baseline model 0.06 0.06, 0.06 0.96 0.94 0.95 0.94 1,194.3 (114)**
Equal factor loadings 0.06 0.06, 0.06 0.96 0.94 0.95 0.95 1,224.0 (123)** 29.7 (9)**
General health status
Baseline model 0.06 0.059, 0.065 0.96 0.94 0.95 0.94 1,237.3 (114)**
Equal factor loadings 0.06 0.057, 0.063 0.96 0.94 0.95 0.94 1,259.5 (123)** 22.1 (9)*
* p \ .01, ** p \ .001a Root mean square error of approximationb Comparative fit indexc Goodness-of-fit indexd Normed fit indexe Tucker–Lewis index
Qual Life Res
123

documented that minorities have access barriers to health
care [33, 34], individuals in managed care plans may have
more discontinuities in care [34, 35], and individuals with
health problems have varying degrees of continuity [36,
37]. It is therefore important to account for these potential
differences when assessing the implications of CoC.
There are some limitations to this work. One is that we
were not able to design the content or format of the survey
questions. Although the longitudinal and interpersonal
continuity questions were designed to map well to the
Consumer Assessment of Healthcare Providers and Systems
(CAHPS) [38] and the Medicare Current Beneficiary Survey
(MCBS) [39], we could not fine tune the questions nor
control the number of items used to assess each construct.
That being said, our final model did have one subscale with
only two items (one of which had a dichotomous response)
stemming from one survey question. This fact may limit the
validity of Cronbach’s alpha as a test for the internal con-
sistency of this subscale and increase the likelihood of
measurement error. Another limitation is that we did not
have access to information about nonrespondents for
assessing the potential impact of differential response rates.
Finally, the perceptions of CoC held by these older Medicare
beneficiaries may not generalize to younger people.
The limitations imposed by our data and the fact that we
were not able to include all known continuity of care domains
(e.g., informational continuity from the Saultz hierarchy)
limit our ability to recommend this 13-item scale as a
definitive measure of care continuity. However, our results
strongly suggest that both the longitudinal and interpersonal
domains, as experienced by the patient, should routinely be
included in the assessment of continuity. These findings
support the work of Gulliford and colleagues [40] who
developed and tested an experience-based measure of con-
tinuity of care for diabetic patients. By evaluating the patient
experience of continuity across a more heterogeneous group
of older adult patients, we expand upon the relevance of this
earlier work in highlighting the importance of the patient
experience when measuring CoC.
Our results are important for two reasons. First, the most
commonly used measures of CoC are those that only
identify longitudinal care. Our findings show that longitu-
dinal continuity is only part of the concept. Second, the
longitudinal measures are most commonly used because
they are easily calculated using administrative claims. Yet,
there is no way to measure interpersonal continuity using
claims data. Interpersonal continuity can only be measured
through assessment of the patient experience. This finding
supports the interests advanced by organizations such as
the Patient-Centered Outcomes Research Institute (PCORI)
and the National Committee for Quality Assurance
(NCQA) who advocate for the importance of using the
patient perspective in the evaluation of health care quality.
In future research, we will link the NHHSUQ data to each
beneficiary’s Medicare claims to expand upon this work by
evaluating how well this patient-reported CoC measure
relates to extant claim-based CoC measures and subse-
quently validating these CoC measures by relating them to
health outcomes and service use in older adults.
Acknowledgments This work was supported by an Alvin R. Tarlov
and John E. Ware Jr. Doctoral Dissertation Award and funds from the
University of Iowa John W. Colloton Chair.
References
1. Institute of Medicine (IOM). (1996). Primary care: America’s
health in a new era. Washington, DC: National Academy of
Sciences.
2. Institute of Medicine (IOM). (2003). Priority areas for national
action: Transforming health care quality. Washington, DC:
National Academy of Sciences.
3. Ginsburg, P. B., Maxfield, M., O’Malley, A. S., Peikes, D., &
Pham, H. H. (2008). Making medical homes work: Moving from
concept to practice. In Policy perspective No. 1, December 2008.
Washington, DC: Mathematica Policy Research, Inc.
4. AAFP, AAP, ACP, & AOA. (February 2007). Joint principles of
the patient centered medical home. Available at the patient-cen-
tered primary care collaborative. http://pcpcc.net/content/joint-
principles-patient-centered-medical-home. Accessed 15 Feb
2012.
5. Carrier, E., Gourevitch, M. N., & Shah, N. R. (2009). Medical
homes: Challenges in translating theory into practice. Medical
Care, 47(7), 714–722.
6. O’Malley, A. S., Peikes, D., & Ginsburg, P. B. (2008). Qualifying
practices as medical homes. In Policy perspective No. 1,
December 2008. Washington, DC: Mathematica Policy Research,
Inc.
7. Stanek, M., & Takach, M. (2010). Evaluating the patient-cen-
tered medical home: Potential and limitations of claims-based
data. Portland, ME: National Academy for State Health Policy.
8. Scholle, S. H., Torda, P., Peikes, D., Han, E., & Genevro, J. (June
2010). Engaging patients and families in the medical home.
Prepared by Mathematica Policy Research under Contract No.
HHSA290200900019I TO2. AHRQ Publication No. 10-0083-EF.
Rockville, MD: Agency for Healthcare Research and Quality.
9. Bitton, A., Martin, C., & Landon, B. E. (2010). A nationwide
survey of patient centered medical home demonstration projects.
Journal of General Internal Medicine, 25(6), 584–592.
10. National Partnership for Women and Families. (2009). Principles
for patient- and family-centered care: the medical home from the
consumer perspective. Available at http://www.nationalpartner
ship.org/site/DocServer/Advocate_Toolkit-Consumer_Principles_
3-30-09.pdf?docID=4821. Accessed 31 March 2012.
11. National Committee for Quality Assurance. (2010a). PCMH 2011
public comment—Optional module: Recognition in patient
experiences. Available at http://www.ncqa.org/portals/0/public
comment/pcmh_publi_%20comment_patient_exp_527FINAL.pdf.
Accessed 31 March 2012.
12. Gray, B. M., Weng, W., & Holmboe, E. S. (2012). An assessment
of patient-based and practice infrastructure-based measures of the
patient-centered medical home: Do we need to ask the patient?
Health Services Research, 47(1), 4–21.
13. Saultz, J. W. (2003). Defining and measuring interpersonal con-
tinuity of care. The Annals of Family Medicine, 1(3), 134–143.
Qual Life Res
123
14. Ben-Sira, Z. (1976). The function of the professional’s affective
behavior in client satisfaction: A revised approach to social
interaction theory. Journal of Health and Social Behavior, 17(1),
3–11.
15. Ben-Sira, Z. (1980). Affective and instrumental components in
the physician–patient relationship: An additional dimension of
interaction theory. Journal of Health and Social Behavior, 21(2),
170–180.
16. Anderson, G. (2010). Chronic care: Making the case for ongoing
care (p. 12). Princeton, NJ: Robert Wood Johnson Foundation.
17. Jee, S. H., & Cabana, M. D. (2006). Indices for continuity of care:
A systematic review of the literature. Medical Care Research and
Review, 63(2), 158–188.
18. Wei, I. I., Virnig, B. A., John, D. A., & Morgan, R. O. (2006).
Using a Spanish surname match to improve identification of
Hispanic women in Medicare administrative data. Health Ser-
vices Research, 41(4), 1469–1481.
19. Morgan, R. O., Teal, C. R., Hasche, J. C., Petersen, L. A., Byrne,
M. M., Paterniti, D. A., et al. (2008). Does poorer familiarity with
Medicare translate into worse access to health care? JAGS, 56,
2053–2060.
20. Arbuckle, J. L. (2011). Amos (Version 20.0) [computer program].
Chicago: SPSS.
21. Bentler, P. M., & Bonett, D. G. (1980). Significance tests and
goodness of fit in the analysis of covariance structures. Psycho-
logical Bulletin, 88(3), 588–606.
22. Hu, L., & Bentler, P. M. (1999). Cutoff criteria for fit indexes in
covariance structure analysis: Conventional criteria versus new
alternatives. Structural Equation Modeling, 6, 1–55.
23. Byrne, B. M. (2001). Structural equation modeling with AMOS:
Basic concepts, applications, and programming. Mahway, NF:
Lawrence Erlbaum Associates.
24. Cronbach, L. J. (1951). Coefficient alpha and the internal struc-
ture of tests. Psychometrika, 16, 297–334.
25. Ware, J. E., Kosinski, M., Dewey, J. E., & Gandek, B. (2001).
How to score and interpret the single-item health status mea-
sures: A manual for users of the SF-8 Health Survey. Lincoln, RI:
QualityMetric Incorporated.
26. Keith, T. Z. (1997). Using confirmatory factor analysis to aid in
understanding the constructs measured by intelligence tests. In D.
P. Flanagan, J. L. Genshaft, & P. L. Harrison (Eds.), Contem-
porary intellectual assessment: Theories, tests, and issues (pp.
373–402). New York: Guilford Press.
27. Robles, J. (1995). Confirmation bias in structural equation mod-
eling. Structural Equation Modeling, 3, 73–83.
28. Millsap, R. E. (2011). Statistical approaches to measurement
invariance. New York: Routledge.
29. Raju, N. S., Laffitte, L. J., & Byrne, B. M. (2002). Measurement
equivalence: A comparison of methods based on confirmatory
factor analysis and item response theory. Journal of Applied
Psychology, 87(3), 517–529.
30. Reid, R. J., Haggerty, J. L., & McKendry, R. (2002). Defusing the
confusion: Concepts and measures of continuity of healthcare.
Ottawa, ON: Canadian Health Services Research Foundation.
31. Haggerty, J. L., Reid, R. J., Freeman, G. K., Starfield, B. H.,
Adair, C. E., & McKendry, R. (2003). Continuity of care: A
multidisciplinary review. BMJ, 327(7425), 1219.
32. Ridd, M. J., Lewis, G., Peters, T. J., & Salisbury, C. (2011).
Patient–Doctor depth-of-relationship scale: Development and
validation. The Annals of Family Medicine, 9(6), 538–545.
33. Doescher, M. P., Saver, B. G., Fiscella, K., & Franks, P. (2001).
Racial/ethnic inequities in continuity and site of care: Location,
location, location. HSR. Health Services Research, 36(6), 78–89.
34. Phillips, K. A., Mayer, M. L., & Aday, L. (2000). Barriers to care
among racial/ethnic groups under managed care. Health Affairs,
19(4), 65–75.
35. Flocke, S. A., Stange, K. C., & Zyzanski, S. J. (1997). The impact
of insurance type and forced discontinuity on the delivery of
primary care. Journal of Family Practice, 45(2), 129–135.
36. Cabana, M. D., & Jee, S. H. (2004). Does continuity of care improve
patient outcomes? Journal of Family Practice, 53(12), 974–980.
37. Nutting, P. A., Goodwin, M. A., Flocke, S. A., Zyzanski, S. J., &
Stange, K. C. (2003). Continuity of primary care: To whom does
it matter and when? The Annals of Family Medicine, 1, 149–155.
38. Agency for Healthcare Research and Quality. Expanded 12-month
survey with CAHPS patient-centered medical home (PCMH) items.
Available at https://www.cahps.ahrq.gov/Surveys-Guidance/CG/
PCMH.aspx. Accessed 2 April 2012.
39. U.S. Dept. of Health and Human Services, Health Care Financing
Administration. Medicare Current Beneficiary Survey, Access to
Care: [United States]. 2nd ICPSR release. Baltimore, MD: U.S.
Dept. of Health and Human Services, Health Care Financing
Administration [producer]. Ann Arbor, MI: Inter-university
Consortium for Political and Social Research [distributor].
40. Gulliford, M. C., Naithani, S., & Morgan, M. (2006). Measuring
continuity of care in diabetes mellitus: An experience-based
measure. The Annals of Family Medicine, 4, 548–555.
Qual Life Res
123