Embed Size (px)
Citation preview
A2BP1 and Obesity
1
Evaluation of A2BP1 as an Obesity Gene
Running Title: A2BP1 and Obesity
Lijun Ma1, Robert L. Hanson1, Michael T. Traurig1, Yunhua L. Muller1, Bakhshish P. Kaur1, Jessica M. Perez1, David Meyre2, Mao Fu3, Antje Körner4, Paul W. Franks5, Wieland Kiess4,
Sayuko Kobes1, William C. Knowler1, Peter Kovacs6, Philippe Froguel2, Alan R. Shuldiner3, Clifton Bogardus1, and Leslie J. Baier1
1Phoenix Epidemiology and Clinical Research Branch, National Institute of Diabetes and
Digestive and Kidney Disease, National Institutes of Health, Phoenix, AZ 2CNRS 8090- Institute of Biology, Pasteur Institute, Lille, France
3Division of Endocrinology, Diabetes and Nutrition, University of Maryland School of Medicine, Baltimore, MD 21201
4University Hospital for Children & Adolescents, University of Leipzig, 04103 Leipzig, Germany
5Genetic Epidemiology and Clinical Research Group, Department of Public Health and Clinical Medicine, Section for Medicine, Umeå University Hospital, Umeå, Sweden.
6Interdisciplinary Centre for Clinical Research, University of Leipzig, 04103 Leipzig, Germany
Corresponding authors: Leslie Baier Ph.D.
E-mail: [email protected] or
Lijun Ma, M.D., Ph.D. E-mail: [email protected]
Submitted 30 October 2009 and accepted 8 August 2010.
Additional information for this article can be found in an online appendix at
http://diabetes.diabetesjournals.org This is an uncopyedited electronic version of an article accepted for publication in Diabetes. The American Diabetes Association, publisher of Diabetes, is not responsible for any errors or omissions in this version of the manuscript or any version derived from it by third parties. The definitive publisher-authenticated version will be available in a future issue of Diabetes in print and online at http://diabetes.diabetesjournals.org.
Diabetes Publish Ahead of Print, published online August 19, 2010
Copyright American Diabetes Association, Inc., 2010
A2BP1 and Obesity
2
OBJECTIVE―A genome-wide association study (GWAS) in Pima Indians (n = 413) identified variation in the ataxin-2 binding protein 1 gene (A2BP1) that was associated with percent body fat. Based on this association and the obese phenotype of ataxin-2 knockout mice, A2BP1 was genetically and functionally analyzed to assess its potential role in human obesity. RESEARCH DESIGN AND METHODS―Variants spanning A2BP1 were genotyped in a population-based sample of 3,234 full-heritage Pima Indians, 2,843 of whom were not part of the initial GWAS study and therefore could serve as a sample to assess replication. Published GWAS data across A2BP1 were additionally analyzed in French adult (n = 1,426) and children cases/controls (n = 1,392) (1). Selected variants were genotyped in 2 additional samples of Caucasians (Amish, n = 1,149 and German children cases/controls, n = 998) and 1 additional Native American (n = 2,531) sample. Small interfering RNA (siRNA) was used to knockdown A2bp1 message levels in mouse embryonic hypothalamus cells. RESULTS―No single variant in A2BP1 was reproducibly associated with obesity across the different populations. However, different variants within intron 1 of A2BP1 were associated with body mass index (BMI) in full-heritage Pima Indians (rs10500331, P = 1.9 × 10⁻⁷) and obesity in French Caucasian adult (rs4786847, P = 1.9 × 10⁻¹⁰) and children (rs8054147, P = 9.2 x 10⁻⁶) cases/controls. Reduction of A2bp1 in mouse embryonic hypothalamus cells decreased expression of Atxn2, Insr, and Mc4r. CONCLUSIONS―Association analysis suggests that variation in A2BP1 influences obesity and functional studies suggest that A2BP1 could potentially affect adiposity via the hypothalamic MC4R pathway. Recent large-scale genome-wide association studies (GWASs) have uncovered common variants in several loci associated with obesity in multiple populations (1-7). Most of these studies have been done in populations of European ancestry. Additional GWASs in diverse ethnic groups could confirm previously identified obesity-associated genes, identify novel ethnic specific susceptibility genes, or identify ethnic specific variation within a previously identified gene. Several examples exist of common variation in a gene contributing to obesity in one population, but unique, rare variation contributing to obesity in another different population. For example, a common obesity-associated variant, rs17782313, near MC4R has been widely replicated in Europeans (3,5,6), but this same variant is nearly monomorphic for the Caucasian non-
risk allele (T allele) in full-heritage Pima Indians; whereas, rare coding variants in MC4R, one of which is a novel frameshift mutation that has not been reported in other populations, do contribute to obesity in Pima Indians (8,9). Similarly, a common obesity-associated variant in SIM1 has been reproducibly associated with obesity in Native Americans but not French Caucasians (10), whereas both rare deletions and rare missense variants in SIM1 have been reported to be associated with severe obesity in Caucasians (11-19). To search for loci that may be important in determining obesity in Pima Indians, we recently completed a GWAS using the Affymetrix 100K genotyping array in a group of 413 non-diabetic full-heritage Pima Indians who were phenotyped for various measures of body composition including percent body fat.
A2BP1 and Obesity
3
Our most significant association with percent body fat was in the A2BP1 gene (rs10500331, P = 6.6 × 10⁻⁶) which encodes for the ataxin-2 binding protein 1 (also known as FOX-1) and is involved in tissue-specific alternative splicing (20). In addition to containing RNA-binding motifs, A2BP1 also interacts with ataxin-2 (ATXN2) (21), a protein thought to be involved with RNA metabolism (22). ATXN2 has been implicated in the neurodegenerative disorder spinocerebellar ataxia type 2 (SCA2) (22) and hyperphagia and obesity are two major clinical features reported in an Egyptian family with SCA2 (23). Consistent with this observation, ataxin-2 knockout mice (Sca-/-) are reported to be much more obese than their wild type littermates when both are fed a high fat diet (24,25). Therefore, based on the genetic associations with percent body fat in our GWAS and the obese phenotype of the Sca2-/- mouse, we studied A2BP1 as a potential candidate gene for human obesity. RESEARCH DESIGN AND METHODS Subjects and phenotypes. Descriptions of subjects used in the association analyses are shown in Table 1. The “GWAS” sample consists of 413 non-diabetic, full-heritage Pima Indian volunteers who had been metabolically characterized as inpatients in our Clinical Research Center and were informative for quantitative traits related to obesity and diabetes, including percent body fat and BMI. Some of these healthy, metabolically characterized subjects were first degree relatives (413 subjects came from 264 sibships, 98 of whom consisted of ≥2 siblings). Body composition was estimated by underwater weighing until January, 1996, and by dual energy X-ray absorptiometry (DPX-1, Lunar Radiation Corp, Madison, WI) thereafter. A conversion equation derived from comparative analyses was used to make estimates of body composition equivalent between the two methods (26). Associations
were further assessed in a full-heritage Pima Indian population-based sample (“full-heritage Pima population”, n = 3,234) derived from our longitudinal study of the etiology of type 2 diabetes in the Gila River Indian Community in Central Arizona (27). Most of the residents are Pima Indians and many are related to one another. The study includes biennial exams performed on individuals who provide informed consent and include measurements of height, weight, and a 75g oral glucose tolerance test, where diabetes was diagnosed according to 1997 American Diabetes Association criteria. BMI was calculated as weight (kg)/height (m2). Analysis of BMI was restricted to all exams after the subjects reached the age of 15 years (number of BMI measurements for all 3,234 subjects = 15,722). Of these 3,234 subjects, 391 had been included in the GWAS sample; therefore, to assess independent replication of the GWAS associations, the 2,843 “non-overlapping with GWAS” subjects were additionally analyzed separately (number of BMI measurements for the 2,843 subjects = 13,751). Selected variants were genotyped in a second population-based sample from our study of the Gila River Indian Community which consisted of all of the remaining longitudinally studied individuals who had a BMI measure after the age of 15 years and a DNA sample available for genotyping (n = 2,531). In contrast to the full-heritage Pima sample, no restrictions on heritage were applied for subjects in this second sample. The subjects in this “mixed-heritage”, predominately Native American sample (number of BMI measurements for 2,531 subjects = 6,973) self-reported their heritage as, on average, ½ Pima Indian and ¾ Native American, with 59 individuals reporting no Native American heritage. The Old Order Amish subjects (n = 1,149) were from the Amish Family Diabetes Study (28). The German school children consisted of 715 lean subjects (controls, mean age =
A2BP1 and Obesity
4
11.7 ± 2.7 years, BMI between 16th and 85th percentile) and 283 obese subjects (cases, mean age = 11.5 ± 3.7 years, BMI >90th percentile) (29). French adult and children cases/controls from a GWAS for obesity have been described elsewhere (1). Briefly case children were in the 97th age-and sex-specific percentile of BMI and had evidence of familial obesity and control children had a BMI <90th percentile. Case adults had a BMI ≥40kg/m2 and evidence of familial obesity and control adults had a repeated BMI measure of <25 kg/m2. Genotyping for GWAS data. Subjects in the Pima GWAS were genotyped using the Affymetrix 100K Human Mapping Array (Affymetrix, Santa Clara, CA) and the methodology and quality control assessment have been described previously (27). Published genotypic data across A2BP1 for the French Caucasian adults and children were obtained from the Illumina Human CNV370 Duo Array (1). Sequencing and genotyping. DNA samples from 24 full-heritage Pima Indians (12 obese/12 non-obese), who were not first-degree relatives, were sequenced to identify novel variants in A2BP1. Overlapping primers were designed to sequence all 16 exons, 5’ and 3’-untranslated regions, and 2 kb of the adjacent 5’ region. Sequencing reactions were performed using a Big Dye Terminator v1.1 cycle sequencing kit (Applied Biosystems, Foster City, CA) and run on an automated DNA capillary sequencer (model 3730xl, Applied Biosystems, Foster City, CA). Sequence information for the two novel variants (A2BP1E3 and A2BP1E15) is provided at the bottom of Supplemental Table 2 in the online appendix available at http://diabetes.diabetesjournals.org. Linkage disequilibrium plots (D’ and r2) were generated using the Haploview program (Haploview, http//:www.broad.mit.edu/mpg/ haploview). Genotyping of the full-heritage
Pima Indian and “mixed-heritage” samples was performed using SNPlex (Applied Biosystems, Foster City, CA) on an automated DNA capillary sequencer (model 3730xl, Applied Biosystems, Foster City, CA). Selected variants were genotyped in the Old Order Amish subjects (28) and German school children (29) using Taqman genotyping assays (Applied Biosystems, Foster City, CA). Statistical analysis. Statistical analyses were performed using the statistical analysis system of the SAS Institute (Cary, North Carolina). For the GWAS data, linear regression models were used to assess the association between genotype and percent body fat or BMI adjusting for covariates including age and sex. The logarithm of BMI was used to reduce skewness. The generalized estimating equations (GEE) procedure was used to account for family membership since some subjects were siblings. The method of genomic control was used to “correct” the P values to their expected distribution. As described by Devlin et al., the mean chi-square value was used to obtain the inflation parameter (λ) and the corrected P value was calculated from an F test with 1 df in the numerator and the number of markers in the denominator (30). The λ was 1.14 for percent body fat and 1.16 for BMI. In addition, to provide a test that is robust to stratification (minimizes the false positive rate), a modification of the method described by Abecasis et al. was used where the associations are partitioned into between- and within-family components (31); for the present analyses these components were represented, respectively, by the mean number of risk alleles for the sibship and each individuals departure from this mean. For the longitudinally studied population-based samples, the association between genotype and BMI was examined using all of the BMI measurements for each individual measured after the age of 15 years. In these analyses a
A2BP1 and Obesity
5
linear mixed model (PROC MIXED) was fitted that included genotype as a fixed effect along with age, sex, birth year, diabetic status, and duration of diabetes as covariates. For examinations at which an individual did not have diabetes, the duration variable was coded as “0” this approach can account for the observation that BMI tends to decline after the diagnosis of diabetes in this population (32). In addition, the model included random effects representing sibship (to account for the fact that some individuals were siblings) and individual (to account for multiple examinations within an individual). An autoregressive correlation structure was used to model the relationship between multiple examinations within an individual. To reduce computation time, the random effects were estimated once in the absence of genotypic effects, and in subsequent analyses were held fixed at the values estimated in the full data. The likelihood ratio test was used to assess statistical significance. In the second population-based sample where many individuals were of mixed-heritage, the individual estimate of Indian admixture was also used as a covariate. These estimates were derived by using a published method (33) from 32 markers selected for having large differences in allele frequency between Amerindians and Caucasians (34). Tests for genotypic association were undertaken assuming an additive effect of the alleles on the phenotype. To assess the evidence for association when both population-based samples of Native Americans were combined, the coefficients for the genotypic effect were combined and weighted by the inverse of their variance estimates (35). P values were not adjusted for multiple comparisons. The association of BMI versus genotypes in the Amish sample was performed using generalized linear model after adjusting for age, sex, and family membership. Comparison of genotype frequencies between the lean and obese German school children
cases/controls were performed by logistic regression analysis adjusted for age, sex, pubertal stage and height (SDS). Since parameter estimates for case-control and quantitative trait analyses are not comparable, results were combined across studies using Stouffer’s method of combining P values (36). Tissue profiling for A2BP1. Primers located in exons 5 and 6 of the A2BP1 transcript (accession ID AF107203) were used to amplify cDNA from the following human tissues: adipose, hypothalamus, pituitary (BD Marathon-Ready cDNA; BD Bioscience/Clontech), brain, skeletal muscle, heart, fetal liver, adult liver, kidney, pancreas (BD Human MTC Multiple Tissue cDNA Panels I and II; BD Bioscience/Clontech), pancreatic islets (kindly provided by Dr. Lorella Marcelli at Joslin Diabetes Center), and preadipocytes isolated from Pima Indians. PCR products were sequenced to confirm that they encoded A2BP1. Isolation of preadipocytes and synthesis of cDNA. Subjects for adipose tissue biopsies were admitted as inpatients to our Clinical Research Center and, after an overnight fast, underwent a subcutaneous abdominal needle biopsy under local anesthesia with 1% lidocaine. Collagenase digestion of the subcutaneous abdominal adipose tissue biopsy samples was done as previously described (37,38). Cell Culture and A2bp1 Knockdown. Mouse N-41 hypothalamus cell line (Cat No. CLU121) was purchased from Cellutions Biosystems, Inc. (Burlington, ON, Canada) and used within 10 passages of the original vial. Cells were grown in Dulbecco’s modified Eagle’s Medium (Invitrogen, Carlsbad, CA) supplemented with 10% fetal bovine serum (ATCC, Manassas, VA) and 20mM glucose (EM Science, Cincinnati, OH) at 37 ℃ with 5% CO2. Prior to small interfering RNA (siRNA) transfection, N-41 cells were seeded in six-well plates at a density of ~105 cells per well. For each
A2BP1 and Obesity
6
transfection, 9 ul of siPORT Amine Transfection Agent (Silencer siRNA Transfection II Kit, Ambion, Austin, Texas) and A2bp1 siRNA were resuspended separately in 100ul of GIBCO Opti-MEM I medium (Invitrogen, Carlsbad, CA). After incubating for 10 min at room temperature, the siRNA and transfection agent mixtures were combined (total 200ul) and siRNA:transfection agent complexes were allowed to form for 10 min. Following the 10 minute incubation, the 200ul transfection mixture was added to each well and after 8-24 hrs the media was replaced. The transfected cells were incubated for 48 hrs and then harvested for RNA extraction. SiRNA (sense, 5’-GAUUUGGUUUCGUAACUUUtt-3’and antisense, 5’-AAAGUUACGAAACCAAAUCcc-3’; assay ID si114129) targeting the mouse A2bp1 transcript and negative control (scrambled) siRNA (assay ID 4618G) were purchased from Ambion (Austin, TX). Total RNA was extracted from the transfected N-41 cells using an RNeasy Mini Kit (Qiagen, Valencia, CA). To remove any residual DNA, the purified RNA was treated with DNase using an RNase-free DNase set (Qiagen, Valencia, CA). First-strand cDNA was synthesized using an Ambion RT-for-PCR kit (Austin, TX). Gene expression levels for mouse A2bp1, Atxn2, Insr, Mc4r, Lepr, and Npy1r were quantified by real-time PCR using predesigned gene expression assays (assay IDs: A2bp1, Mm00480615_m1; Atxn2, Mm00485932_m1; Insr, Mm00439693_m1; Mc4r, Mm00457483_s; Lepr, Mm00440181_m1; and Npy1r, Mm00650798_g1; Applied Biosystems, Foster City, CA). Real-time PCR was performed using an ABI-7700 sequence detection system (Applied Biosystems, Foster City, CA). Assays were performed in replicates of 6 and the mean values were used to calculate expression levels using the relative standard curve method.
Glyceraldehyde-3-phosphate dehydrogenase (Gapdh, assay ID Mm03302249_g1, Applied Biosystems, Foster City, CA ) was used as the endogenous control to obtain normalized values. Each experiment was independently repeated three times. Student’s t-test was used to compare the means for cells transfected with A2bp1 siRNA with those transfected with control siRNA. RESULTS Association analyses among 413 metabolically characterized, non-diabetic full-heritage Pima Indians who had been genotyped using the Affymetrix 100K Human Mapping Array identified rs10500331 as the strongest genome-wide signal for percent body fat (P = 6.6 × 10⁻⁶ after genomic control, adjusted for age, and sex; Supplemental Figure. 1 and designated in bold in Supplemental Table 1). Among these 413 “GWAS” subjects, rs10500331 was also associated with BMI (P = 8.1 × 10⁻⁵ after genomic control, adjusted for age, and sex; Table 2 and Supplemental Table 1). To validate this GWAS association, rs10500331 was genotyped in a longitudinally studied, full-heritage Pima Indian population-based sample (n = 3,234) where individuals had multiple measures of BMI (description of the subjects is given in Table 1). Rs10500331 was associated with BMI in this “full-heritage Pima population” sample (P = 1.9 × 10⁻⁷) and remained significant after excluding all subjects that over-lapped with the initial GWAS study (“non-overlapping with GWAS” full-heritage sample, n = 2,843; P = 1.9 × 10⁻⁵) (Table 2). Although independently replicated, these associations do not quite meet the proposed threshold for genome-wide significance of P <7 × 10⁻⁸ (39). To further substantiate these associations by ruling out potential confounding effects of population stratification, we utilized the family structure of these samples and performed a within-family analysis, where rs10500331 was again
A2BP1 and Obesity
7
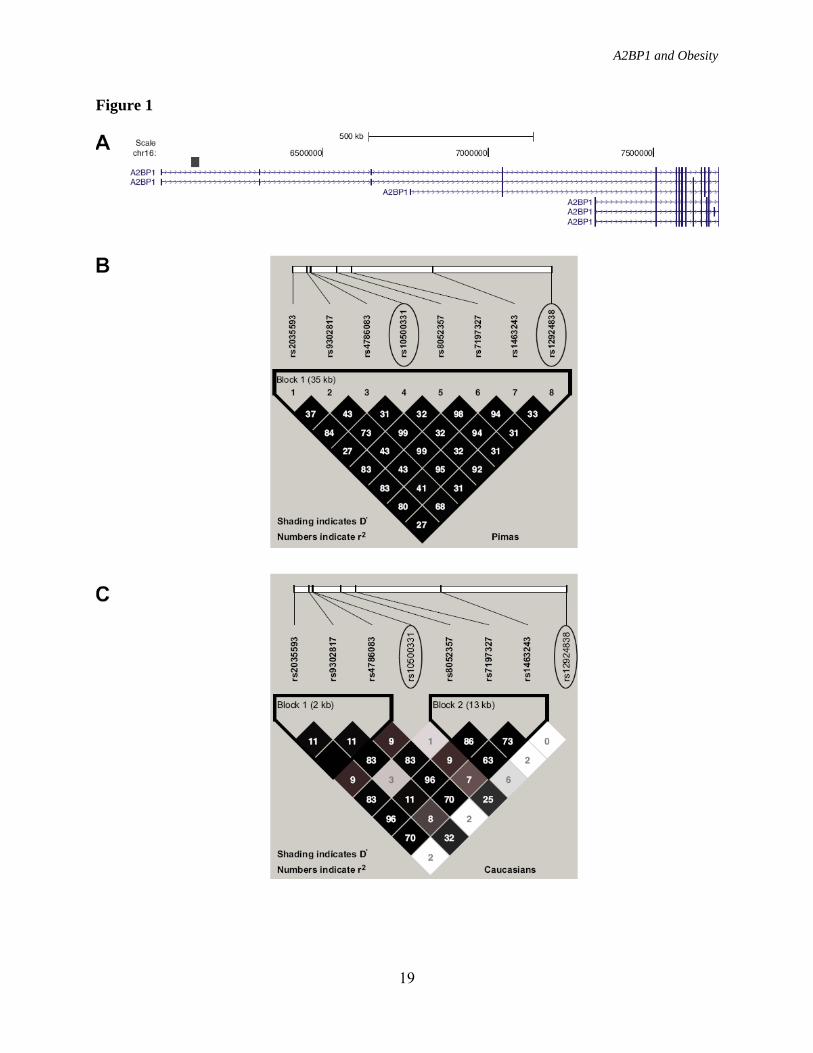
associated with BMI in the initial “GWAS” sample (P = 5.3 × 10⁻², Supplemental Table 1), the entire “full-heritage Pima population” sample and the population sample after excluding the overlapping GWAS subjects (P = 7.4 ×10⁻³ and 3.2 ×10⁻², respectively) (Supplemental Table 2). Rs10500331 maps within intron 1 of the A2BP1 gene and several other variants within A2BP1 also showed significant associations with percent body fat and BMI in the GWAS study (Supplemental Table 1). To directly examine A2BP1 as a candidate gene for obesity in Pima Indians, all exons and 2 kb of the upstream region of this gene were sequenced in 24 Pima Indians selected for being obese or non-obese. Twelve variants were identified of which two were rare novel substitutions (frequencies of the minor alleles = 0.03 and 0.09; sequences are provided in Supplemental Table 2). One hundred and eight additional variants spanning A2BP1 were then selected for genotyping in the “full-heritage Pima population” sample (n = 3,234). The 108 variants consisted of 66 tag SNPs (minor allele frequency ≥0.15 and a pair-wise r2 ≥0.8) from our previous 100K GWAS, 34 variants selected from our ongoing 1M GWAS, and 8 variants identified by sequencing including the 2 novel variants. Linkage disequilibrium (LD) plots (r2 and D’) for all 109 variants (including rs10500331) are shown in Supplemental Figure. 2. Associations for all 109 variants with BMI, using both general and within-family analytical models, are shown for the entire “full-heritage Pima population” sample to preserve power (n = 3,234), as well as for the 2,843 “non-overlapping with GWAS” sample (Supplemental Table 2). Several variants displayed modest associations (general and within-family analyses) in both samples, however, none of the associations was as strong as rs10500331. Two variants, rs10500331 and rs12924838, which are in high LD in full-heritage Pima
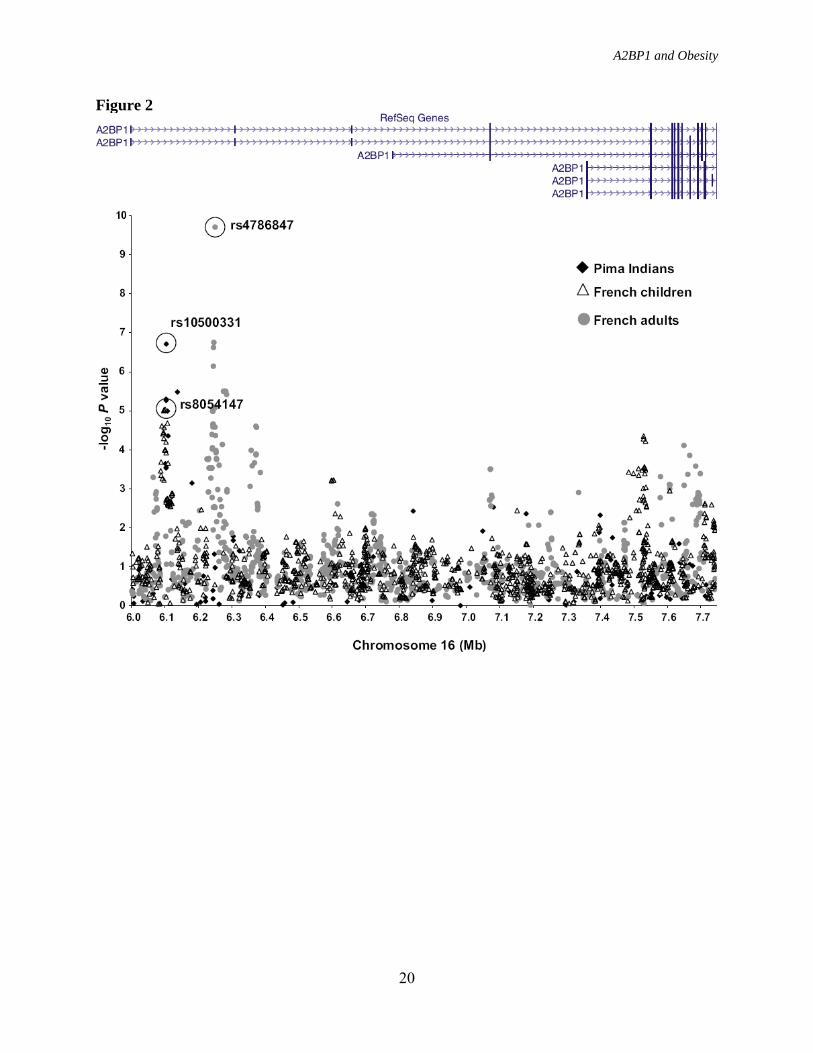
Indians but not Caucasians (D’ = 0.96, r2 = 0.92 in Pima and D’ = 0.83, r2 = 0.25 in Caucasians; Figure 1B and 1C) were significantly and reproducibly associated with BMI in Pima Indians (Table 2). These variants were further evaluated in 4 additional cohorts of European ancestry including French adult cases/controls (1), French children cases/controls (1), Amish families (28), and German school children cases/controls (29). There was no evidence of association of rs10500331 with obesity in the French adult or children cases/controls nor was there an association of this variant with BMI in the Amish or German school children cases/controls (Table 2); however, rs12924838 was nominally associated with obesity the French adult case/control sample (P = 0.03) and when all of the European data were combined (n = 4,965, P = 0.02) (Table 2). Although neither rs10500331 nor rs12924838, which both map within intron 1 of A2BP1, appear to be convincingly associated with obesity or BMI in these European cohorts, a prior GWAS for severe obesity using case/control samples of either French children or French adults identified several other variants within intron 1 of A2BP1 that were significantly associated with severe obesity (1). In the French children case/control stage 1 samples, rs8054147 displayed the strongest association with obesity (P = 9.2 × 10⁻⁶, Fig. 2), whereas in the French adult case/control stage 1 samples, rs4786847 had the strongest association (P = 1.9 × 10⁻¹⁰, Fig. 2). The striking association of rs4786847 with obesity was specific for the stage 1 French adult sample. For the stage 2 sample which included 519 obese children and 566 lean young adults of French origin, 377 obese children and 731 lean children of German origin, 135 obese adults and 794 lean adults of French origin, 1,036 obese adults and 320 randomly selected adults of Swiss origin, a general population of 5,291 Finnish children, and a general population of 4,417
A2BP1 and Obesity
8
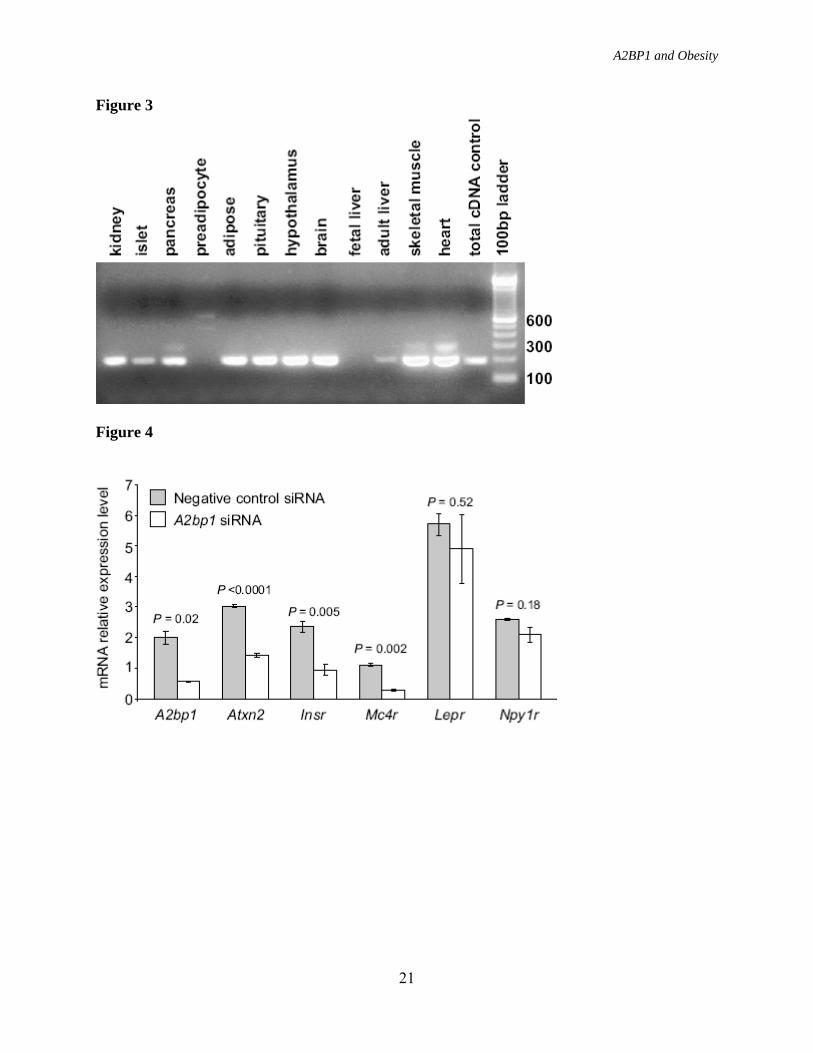
French adults, the association of rs4786847 with obesity or BMI was nominal (all stage 2 children P = 0.005, all stage 2 adults P = 0.76, entire stage 2 sample P = 0.03) (1). To determine whether the associations observed with BMI in the Pima Indians represent a signal specific for Native Americans, 5 variants (rs9302818, rs10500331, rs8052357, rs12924838 and rs1946127) with the strongest associations with BMI in the full-heritage Pima Indians, and 1 variant (rs4786847) most strongly associated with BMI in the French adults were genotyped in a second population-based sample of 2,531 individuals who were predominately Native Americans of “mixed-heritage”. Although none of the five variants most strongly associated with BMI in the full-heritage Pima Indians replicated in this “mixed-heritage” Native American sample, rs4786847 which had the strongest association in the French adult cases/controls (P = 1.9 × 10⁻¹⁰) modestly replicated (P = 0.02, Table 3). Combining the full-heritage Pima and mixed- heritage Native American population-based samples provided strong associations with BMI for all 6 variants; however, only the association with rs4786847 was strengthened from the combination of the two samples; whereas, the other associations were solely due to the full- heritage Pima sample (Table 3). European genotypic data was additionally available on 3 of these variants making an “all sample” (i.e., subjects in Table 1) analysis possible. “All sample” P values for these 3 variants ranged from 0.02-0.0002 (Table 3), where significance was largely derived from a single sample. A2BP1 is expressed in various tissues including hypothalamus, a major tissue in body weight regulation (Fig. 3), and it has also been reported to be expressed in brain, heart, and skeletal muscle tissue (21). To functionally investigate a possible role of A2BP1 in hypothalamic body weight regulation, siRNA that target the mouse
A2bp1 gene were used to knockdown A2bp1 expression in a mouse embryonic hypothalamic cell line (N-41) and mRNA levels of 5 target genes were assessed by RT-PCR. These 5 genes included Atxn2, which encodes the binding partner of A2bp1 and has been implicated in human hyperphagia (23) and 4 additional genes, Insr, Lepr, Npy1r, and Mc4r, known to function in key pathways of central regulation of energy balance and known to be expressed in N-41 cells. RT-PCR of A2bp1 was also used to assess the efficiency of the siRNA knockdown.
We found that a 75% reduction in A2bp1 expression in the N-41 cells led to a 53%, 60%, and 75% decrease in gene expression levels for Atxn2, Insr and Mc4r respectively, while expression levels for Lepr and Npy1r were largely unaffected (Fig. 4). DISCUSSION The associations between variants in A2BP1 with both percent body fat and BMI in our 100K GWAS and the evidence for association of these variants with longitudinally measured BMI in a large population based sample of full-heritage Pima Indians, along with the obese phenotypes observed with Atxn2 knockout mice (24,25) and high expression levels of A2BP1 in the hypothalamus leads us to speculate that A2BP1 has a role in body weight regulation. However, the highly significant associations obtained with different variants in each of the Pima Indian, French adult and French children studies is inconsistent with a single common variant giving rise to this phenotype. Among populations representing different ethnicities, lack of reproducibility with a specific variant may be due to the existence of an untyped causal variant with differing linkage disequilibrium patterns between ethnic groups (40). Pezzolesi et al., describe a similar pattern where different variants across the same locus (ELMO1) in different ethnic groups, Caucasians (41), African-Americans
A2BP1 and Obesity
9
(42), Japanese (43), are associated with diabetic nephropathy (41). They suggest that this allelic heterogeneity is probably the result of different ancestral genetic backgrounds and propose that rare variants in ELMO1 may be common to each ethnic group and are being tagged by the common variants found in the individual studies (41). This concept, however, cannot explain strong associations of different variants in French adults and in French children. Another hypothesis more consistent with our observations is that strong, yet distinct associations within a region of a biologically relevant gene would be observed if there are multiple rare causative variants that can occur within a single ethnic group. These rare variants, all of which could affect a potential functionally important region (e.g., intron 1 of A2BP1), may be more highly represented by chance in one sample set than in another; and thus, provide association signals with different tag SNPs in one group of individuals than in another. Deep re-sequencing across intron 1 of A2BP1 in each of the different populations may be the best approach to test this hypothesis. At present the costs of deep re-sequencing in a large number of subjects make this line of investigation difficult. Therefore we chose to investigate the function of A2BP1 directly based on the current association data and the observation that atxn2-/- mice become obese. A2BP1 is a RNA-binding protein involved in regulating tissue-specific alternative splicing by binding the RNA cis-regulatory element UGCAUG (44). A2BP1 binding to UGCAUG elements downstream of the exon enhances exon inclusion, while binding to UGCAUG elements upstream of the exon represses exon inclusion (44). The UGCAUG motif is highly enriched in brain-specific intronic regions flanking exons and alternative exons (45). A recent genome-wide survey for the UGCAUG element identified 1,103 genes with at least one predicted UGCAUG element. Included in this gene list
were A2BP1 (5 elements), ATXN2 (2 elements), and INSR (2 elements) (45). In addition to binding the UGCAUG splicing motif, A2BP1 is a binding partner for the ataxin 2 (ATXN2) protein (21) which also contains predicted RNA binding and RNA splicing motifs and is thought to be involved in mRNA degradation and regulating translation (46,47). In the human hypothalamus, LEPR and INSR sense the peripheral leptin and insulin signals to control food intake and energy homeostasis through POMC-MC4R and NPY-Y1R pathways. Central nervous system deficiencies of these pathways are known to affect energy homeostasis and result in severe obesity (48,49). Following knockdown of A2bp1 in the N-41 mouse embryonic hypothalamic cells, we observed a decrease in both INSR and MC4R expression. Knockdown of A2BP1 also resulted in a decrease in Atxn2 gene expression, and it has been shown by others that Atxn2 knockout mice become obese (24,25). However, the mechanism whereby deficiency of A2BP1 expression leads to a decrease in mRNA levels for these three genes is unknown. Since both ATXN2 and INSR have predicted UGCAUG splicing elements (45), mRNA splicing for the two genes may be affected by a decrease in A2BP1 leading to unstable transcripts which are subsequently degraded. Unlike ATXN2 and INSR, the transcript for Mc4R codes for only one exon and does not appear to contain bindings sites for A2BP1. Therefore, instead of affecting mRNA stability, the reduction in A2BP1 may result in the decrease of Mc4R indirectly by affecting some transcriptional regulatory protein involved in the expression of Mc4R. In conclusion, GWAS data in Pima Indians and French Caucasians suggest that multiple variants in A2BP1 may exist that contribute to human obesity, and A2bp1 knockdown studies suggest that deficiency of A2bp1 could play a role in the hypothalamic
A2BP1 and Obesity
10
regulation of feeding. However, deep re-sequencing of A2BP1 and further in vivo studies are necessary to confirm the biological role of this gene in the pathogenesis of obesity. Author contributions. L.M. researched data, contributed to discussion, wrote manuscript. R.H. researched data, contributed to discussion, review/edited manuscript. M.T. review/edited manuscript. Y.M. contributed to discussion, review/edited manuscript. B.K. researched data. J.P. researched data. D.M. researched data, review/edited manuscript. M.F. researched data, review/edited manuscript. A.K. researched data, contributed to discussion, review/edited manuscript. P.F. contributed to discussion, review/edited manuscript. W.K. researched data, review/edited manuscript. S.K. researched data, review/edited manuscript. WC.K. researched data, review/edited manuscript. P.K. researched data, review/edited manuscript. P.F. researched data,
review/edited manuscript. A.S. researched data, review/edited manuscript. C.B. researched data, contributed to discussion, review/edited manuscript. LJ. B. researched data, contributed to discussion, wrote manuscript, review/edited manuscript. ACKNOWLEDGMENTS This work was supported by the intramural research program of NIDDK, NIH, and NIH Grants R01 DK54261 (to A Shuldiner) NIH P30 DK072488 (Clinical Nutrition Research Unit of Maryland) and NIH P60 DK079637 (Baltimore Diabetes Research and Training Center). Grant support was also provided by the American Diabetes Association (individually to C. Bogardus and A Shuldiner). Additional support was provided by grants from the Deutsche Forschungsgemeinschaft (DFG) KFO 152: project KO 3512/1–1, 1264/10–1 and the European Community integrated project grant “PIONEER.”
REFERENCES 1. Meyre D, Delplanque J, Chèvre JC, Lecoeur C, Lobbens S, Gallina S, Durand E, Vatin V, Degraeve F, Proença C, Gaget S, Körner A, Kovacs P, Kiess W, Tichet J, Marre M, Hartikainen AL, Horber F, Potoczna N, Hercberg S, Levy-Marchal C, Pattou F, Heude B, Tauber M, McCarthy MI, Blakemore AI, Montpetit A, Polychronakos C, Weill J, Coin LJ, Asher J, Elliott P, Järvelin MR, Visvikis-Siest S, Balkau B, Sladek R, Balding D, Walley A, Dina C, Froguel P: Genome-wide association study for early-onset and morbid adult obesity identifies three new risk loci in European populations. Nat Genet 41:157–159, 2009 2. Frayling TM, Timpson NJ, Weedon MN, Zeggini E, Freathy RM, Lindgren CM, Perry JR, Elliott KS, Lango H, Rayner NW, Shields B, Harries LW, Barrett JC, Ellard S, Groves CJ, Knight B, Patch AM, Ness AR, Ebrahim S, Lawlor DA, Ring SM, Ben-Shlomo Y, Jarvelin MR, Sovio U, Bennett AJ, Melzer D, Ferrucci L, Loos RJ, Barroso I, Wareham NJ, Karpe F, Owen KR, Cardon LR, Walker M, Hitman GA, Palmer CN, Doney AS, Morris AD, Smith GD, Hattersley AT, McCarthy MI: A common variant in the FTO gene is associated with body mass index and predisposes to childhood and adult obesity. Science 316:889–894, 2007 3. Liu YJ, Liu XG, Wang L, Dina C, Yan H, Liu JF, Levy S, Papasian CJ, Drees BM, Hamilton JJ, Meyre D, Delplanque J, Pei YF, Zhang L, Recker RR, Froguel P, Deng HW: Genome-wide association scans identified CTNNBL1 as a novel gene for obesity. Hum Mol Genet 17:1803–1813, 2008
A2BP1 and Obesity
11
4. Loos RJ, Lindgren CM, Li S, Wheeler E, Zhao JH, Prokopenko I, Inouye M, Freathy RM, Attwood AP, Beckmann JS, Berndt SI; Prostate, Lung, Colorectal, and Ovarian (PLCO) Cancer Screening Trial, Jacobs KB, Chanock SJ, Hayes RB, Bergmann S, Bennett AJ, Bingham SA, Bochud M, Brown M, Cauchi S, Connell JM, Cooper C, Smith GD, Day I, Dina C, De S, Dermitzakis ET, Doney AS, Elliott KS, Elliott P, Evans DM, Sadaf Farooqi I, Froguel P, Ghori J, Groves CJ, Gwilliam R, Hadley D, Hall AS, Hattersley AT, Hebebrand J, Heid IM; KORA, Lamina C, Gieger C, Illig T, Meitinger T, Wichmann HE, Herrera B, Hinney A, Hunt SE, Jarvelin MR, Johnson T, Jolley JD, Karpe F, Keniry A, Khaw KT, Luben RN, Mangino M, Marchini J, McArdle WL, McGinnis R, Meyre D, Munroe PB, Morris AD, Ness AR, Neville MJ, Nica AC, Ong KK, O'Rahilly S, Owen KR, Palmer CN, Papadakis K, Potter S, Pouta A, Qi L; Nurses' Health Study, Randall JC, Rayner NW, Ring SM, Sandhu MS, Scherag A, Sims MA, Song K, Soranzo N, Speliotes EK; Diabetes Genetics Initiative, Syddall HE, Teichmann SA, Timpson NJ, Tobias JH, Uda M; SardiNIA Study, Vogel CI, Wallace C, Waterworth DM, Weedon MN; Wellcome Trust Case Control Consortium, Willer CJ; FUSION, Wraight, Yuan X, Zeggini E, Hirschhorn JN, Strachan DP, Ouwehand WH, Caulfield MJ, Samani NJ, Frayling TM, Vollenweider P, Waeber G, Mooser V, Deloukas P, McCarthy MI, Wareham NJ, Barroso I, Jacobs KB, Chanock SJ, Hayes RB, Lamina C, Gieger C, Illig T, Meitinger T, Wichmann HE, Kraft P, Hankinson SE, Hunter DJ, Hu FB, Lyon HN, Voight BF, Ridderstrale M, Groop L, Scheet P, Sanna S, Abecasis GR, Albai G, Nagaraja R, Schlessinger D, Jackson AU, Tuomilehto J, Collins FS, Boehnke M, Mohlke KL: Common variants near MC4R are associated with fat mass, weight and risk of obesity. Nat Genet 40:768–775, 2008 5. Cho YS, Go MJ, Kim YJ, Heo JY, Oh JH, Ban HJ, Yoon D, Lee MH, Kim DJ, Park M, Cha SH, Kim JW, Han BG, Min H, Ahn Y, Park MS, Han HR, Jang HY, Cho EY, Lee JE, Cho NH, Shin C, Park T, Park JW, Lee JK, Cardon L, Clarke G, McCarthy MI, Lee JY, Lee JK, Oh B, Kim HL: A large-scale genome-wide association study of Asian populations uncovers genetic factors influencing eight quantitative traits. Nat Genet 41:527–534, 2009 6. Willer CJ, Speliotes EK, Loos RJ, Li S, Lindgren CM, Heid IM, Berndt SI, Elliott AL, Jackson AU, Lamina C, Lettre G, Lim N, Lyon HN, McCarroll SA, Papadakis K, Qi L, Randall JC, Roccasecca RM, Sanna S, Scheet P, Weedon MN, Wheeler E, Zhao JH, Jacobs LC, Prokopenko I, Soranzo N, Tanaka T, Timpson NJ, Almgren P, Bennett A, Bergman RN, Bingham SA, Bonnycastle LL, Brown M, Burtt NP, Chines P, Coin L, Collins FS, Connell JM, Cooper C, Smith GD, Dennison EM, Deodhar P, Elliott P, Erdos MR, Estrada K, Evans DM, Gianniny L, Gieger C, Gillson CJ, Guiducci C, Hackett R, Hadley D, Hall AS, Havulinna AS, Hebebrand J, Hofman A, Isomaa B, Jacobs KB, Johnson T, Jousilahti P, Jovanovic Z, Khaw KT, Kraft P, Kuokkanen M, Kuusisto J, Laitinen J, Lakatta EG, Luan J, Luben RN, Mangino M, McArdle WL, Meitinger T, Mulas A, Munroe PB, Narisu N, Ness AR, Northstone K, O'Rahilly S, Purmann C, Rees MG, Ridderstråle M, Ring SM, Rivadeneira F, Ruokonen A, Sandhu MS, Saramies J, Scott LJ, Scuteri A, Silander K, Sims MA, Song K, Stephens J, Stevens S, Stringham HM, Tung YC, Valle TT, Van Duijn CM, Vimaleswaran KS, Vollenweider P, Waeber G, Wallace C, Watanabe RM, Waterworth DM, Watkins N; Wellcome Trust Case Control Consortium, Witteman JC, Zeggini E, Zhai G, Zillikens MC, Altshuler D, Caulfield MJ, Chanock SJ, Farooqi IS, Ferrucci L, Guralnik JM, Hattersley AT, Hu FB, Jarvelin MR, Laakso M, Mooser V, Ong KK, Ouwehand WH, Salomaa V, Samani NJ, Spector TD, Tuomi T, Tuomilehto J, Uda M, Uitterlinden AG, Wareham NJ, Deloukas P, Frayling TM, Groop LC, Hayes RB, Hunter DJ, Mohlke KL, Peltonen L, Schlessinger D, Strachan DP, Wichmann HE, McCarthy MI, Boehnke M, Barroso I, Abecasis GR, Hirschhorn JN; Genetic Investigation of
A2BP1 and Obesity
12
ANthropometric Traits Consortium: Six new loci associated with body mass index highlight a neuronal influence on body weight regulation. Nat Genet 41:25–34, 2009 7. Thorleifsson G, Walters GB, Gudbjartsson DF, Steinthorsdottir V, Sulem P, Helgadottir A, Styrkarsdottir U, Gretarsdottir S, Thorlacius S, Jonsdottir I, Jonsdottir T, Olafsdottir EJ, Olafsdottir GH, Jonsson T, Jonsson F, Borch-Johnsen K, Hansen T, Andersen G, Jorgensen T, Lauritzen T, Aben KK, Verbeek AL, Roeleveld N, Kampman E, Yanek LR, Becker LC, Tryggvadottir L, Rafnar T, Becker DM, Gulcher J, Kiemeney LA, Pedersen O, Kong A, Thorsteinsdottir U, Stefansson K: Genome-wide association yields new sequence variants at seven loci that associate with measures of obesity. Nat Genet 41:18–24, 2009 8. Ma L, Tataranni PA, Bogardus C, Baier LJ: Melanocortin 4 receptor gene variation is associated with severe obesity in Pima Indians. Diabetes 53:2696–12699, 2004 9. Krakoff J, Ma L, Kobes S, Knowler WC, Hanson RL, Bogardus C, Baier LJ: Lower metabolic rate in individuals heterozygous for either a frameshift or a functional missense MC4R variant. Diabetes 57:3267–3272, 2008 10. Traurig M, Mack J, Hanson RL, Ghoussaini M, Meyre D, Knowler WC, Kobes S, Froguel P, Bogardus C, Baier LJ: Common variation in SIM1 is reproducibly associated with BMI in Pima Indians. Diabetes 58:1682–1689, 2009 11. Turleau C, Demay G, Cabanis MO, Lenoir G, de Grouchy J: 6q1 monosomy: a distinctive syndrome. Clin Genet 34:38–42, 1988 12. Villa A, Urioste M, Bofarull JM, Martínez-Frías ML: De novo interstitial deletion q16.2q21 on chromosome 6. Am J Med Genet 55:379–383, 1995 13. Holder JL Jr, Butte NF, Zinn AR: Profound obesity associated with a balanced translocation that disrupts the SIM1 gene. Hum Mol Genet 9:101–108, 2000 14. Gilhuis HJ, van Ravenswaaij CM, Hamel BJ, Gabreëls FJ: Interstitial 6q deletion with a Prader-Willi-like phenotype: a new case and review of the literature. Eur J Paediatr Neurol 4:39–43, 2000 15. Faivre L, Cormier-Daire V, Lapierre JM, Colleaux L, Jacquemont S, Geneviéve D, Saunier P, Munnich A, Turleau C, Romana S, Prieur M, De Blois MC, Vekemans M: Deletion of the SIM1 gene (6q16.2) in a patient with a Prader-Willi-like phenotype. J Med Genet 39:594–596, 2002 16. Varela MC, Simões-Sato AY, Kim CA, Bertola DR, De Castro CI, Koiffmann CP: A new case of interstitial 6q16.2 deletion in a patient with Prader-Willi-like phenotype and investigation of SIM1 gene deletion in 87 patients with syndromic obesity. Eur J Med Genet 49:298–305, 2006 17. Bonaglia MC, Ciccone R, Gimelli G, Gimelli S, Marelli S, Verheij J, Giorda R, Grasso R, Borgatti R, Pagone F, Rodrìguez L, Martinez-Frias ML, van Ravenswaaij C, Zuffardi O: Detailed phenotype-genotype study in five patients with chromosome 6q16 deletion: narrowing the critical region for Prader-Willi-like phenotype. Eur J Hum Genet Jul 23, 2008 18. Wang J, Turner L, Lomax B, Eydoux P: A 5-Mb microdeletion at 6q16.1-q16.3 with SIM gene deletion and obesity. Am J Med Genet A 146A:2975–2978, 2008 19. Stutzmann F, Ghoussaini M, Couturier C, Marchand M, Vatin V, Corset L, Lecoeur C, Balkau B, Horber F, Driscoll DJ, Goldstone AP, Weill J, Michaud JL, Meyre D, Froguel P: Loss-of-function mutations in SIM1 cause a specific form of Prader-Willi-like syndrome. Diabetologia 52:[Suppl1]S1–S550, 2009 20. Kuroyanagi H: Fox-1 family of RNA-binding proteins. Cell Mol Life Sci 66:3895–3907, 2009
A2BP1 and Obesity
13
21. Shibata H, Huynh DP, Pulst SM: A novel protein with RNA-binding motifs interacts with ataxin-2. Hum Mol Genet 9:1303–1313, 2000 22. Lastres-Becker I, Rüb U, Auburger G: Spinocerebellar ataxia 2 (SCA2). Cerebellum 7:115–124, 2008 23. Abdel-Aleem A, Zaki MS: Spinocerebellar ataxia type 2 (SCA2) in an Egyptian family presenting with polyphagia and marked CAG expansion in infancy. J Neurol 255:413–9, 2008 24. Kiehl TR, Nechiporuk A, Figueroa KP, Keating MT, Huynh DP, Pulst SM: Generation and characterization of Sca2 (ataxin-2) knockout mice. Biochem Biophys Res Commun 339:17–24, 2006 25. Lastres-Becker I, Brodesser S, Lütjohann D, Azizov M, Buchmann J, Hintermann E, Sandhoff K, Schürmann A, Nowock J, Auburger G: Insulin receptor and lipid metabolism pathology in ataxin-2 knockout mice. Hum Mol Genet 17:1465–81, 2008 26. Norman RA, Thompson DB, Foroud T, Garvey WT, Bennett PH, Bogardus C, Ravussin E: Genomewide search for genes influencing percent body fat in Pima Indians: suggestive linkage at chromosome 11q21-q22. Pima Diabetes Gene Group. Am J Hum Genet 60:166–173, 1997 27. Hanson RL, Bogardus C, Duggin D, Kobes S, Knowlton M, Infante AM, Marovich L, Benitez D, Baier LJ, Knowler WC: A search for variants associated with young-onset type 2 diabetes in American Indians in a 100k genotyping array. Diabetes 56:3045–3052, 2007 28. Hsueh WC, Mitchell BD, Aburomia R, Pollin T, Sakul H, Ehm MG, Michelsen B, Wagner MJ, St. Jean PL, Knowler WC, Burns DK, Bell CJ, Shuldiner AR: Diabetes in the Old Order Amish: Characterization and heritability analysis of the Amish Family Diabetes Study Diabetes Care 23, 595–601, 2000 29. Körner A, Berndt J, Stumvoll M, Kiess W, Kovacs P: TCF7L2-gene polymorphisms confer an increased risk for early impairment of glucose metabolism and increased height in obese children. J Clin Endocrinol Metab 92:1956–1960, 2007 30. Devlin B, Bacanu SA, Roeder K: Genomic Control to the extreme. Nat Genet 36:1129–1130, 2004 31. Abecasis GR, Cardon LR, Cookson WO: A general test of association for quantitative traits in nuclear families. Am J Hum Genet 66:279–292, 2000 32. Looker HC, Knowler WC, Hanson RL: Changes in BMI and weight before and after the development of type 2 diabetes. Diabetes Care 24:1917–1922, 2001 33. Hanis CL, Chakraborty R, Ferrell RE, Schull WJ: Individual admixture estimates: disease associations and individual risk of diabetes and gallbladder disease among Mexican-Americans in Starr County, Texas. Am J Phys Anthropol 70:433–441, 1986 34. Tian C, Hinds DA, Shigeta R, Adler SG, Lee A, Pahl MV, Silva G, Belmont JW, Hanson RL, Knowler WC, Gregersen PK, Ballinger DG, Seldin MF: A genomewide single-nucleotide-polymorphism panel for Mexican American admixture mapping. Am J Hum Genet 80:1014–1023, 2007 35. Petitti DB: Statistical methods in meta-analysis. In Meta-Analysis, Decision Analysis and Cost-Effectiveness Analysis: Methods for Quantitative Synthesis in Medicine. Petitti DB, Ed. Oxford, Oxford University Press, 2000, p.94–118 36. Stouffer SA, Suchman EA, DaVinney LC, Star SA, Williams RM: How the volumes were produced. In The American Soldier, Volume i: Adjustment to Army Life Princeton, NJ, Princeton University Press, 1949, p. 45
A2BP1 and Obesity
14
37. Permana PA, Nair S, Lee YH, Luczy-Bachman G, Vozarova de Courten B, Tataranni PA: Subcutaneous abdominal preadipocyte differentiation in vitro inversely correlates with central obesity. Am J Physiol Endocrinol Metab 286:E958–E962, 2004 38. Lee YH, Nair S, Rousseau E, Allison DB, Page GP, Tataranni PA, Bogardus C, Permana PA: Microarray profiling of isolated abdominal subcutaneous adipocytes from obese vs non-obese Pima Indians: increased expression of inflammation-related genes. Diabetologia 48:1776–1783, 2005 39. Dudbridge F, Gusnanto A: Estimation of significance thresholds for genomewide association scans.Genet Epidemiol. 32:227-234, 2008 40. Lin PI, Vance JM, Pericak-Vance MA, Martin ER: No gene is an island: the flip-flop phenomenon. Am J Hum Genet 80:531–8538, 2007 41. Pezzolesi MG, Katavetin P, Kure M, Poznik GD, Skupien J, Mychaleckyj JC, Rich SS, Warram JH, Krolewski AS: Confirmation of Genetic Associations at ELMO1 in the GoKinD Collection Support its Role as a Susceptibility Gene in Diabetic Nephropathy. Diabetes 2009 Aug 3. [Epub ahead of print] 42. Leak TS, Perlegas PS, Smith SG, Keene KL, Hicks PJ, Langefeld CD, Mychaleckyj JC, Rich SS, Kirk JK, Freedman BI, Bowden DW, Sale MM: Variants in intron 13 of the ELMO1 gene are associated with diabetic nephropathy in African Americans. Ann Hum Genet 73:152–159, 2009 43. Shimazaki A, Kawamura Y, Kanazawa A, Sekine A, Saito S, Tsunoda T, Koya D, Babazono T, Tanaka Y, Matsuda M, Kawai K, Iiizumi T, Imanishi M, Shinosaki T, Yanagimoto T, Ikeda M, Omachi S, Kashiwagi A, Kaku K, Iwamoto Y, Kawamori R, Kikkawa R, Nakajima M, Nakamura Y, Maeda S: Genetic variations in the gene encoding ELMO1 are associated with susceptibility to diabetic nephropathy. Diabetes 54:1171–1178, 2005 44. Kuroyanagi H: Fox-1 family of RNA-binding proteins. Cell Mol Life Sci 2009 Aug 18. [Epub ahead of print] 45. Zhang C, Zhang Z, Castle J, Sun S, Johnson J, Krainer AR, Zhang MQ: Defining the regulatory network of the tissue-specific splicing factors Fox-1 and Fox-2. Genes Dev 22:2550–2563, 2008 46. Tharun S: Roles of eukaryotic Lsm proteins in the regulation of mRNA function. Int Rev Cell Mol Biol 272:149–189, 2009 47. van de Loo S, Eich F, Nonis D, Auburger G, Nowock J: Ataxin-2 associates with rough endoplasmic reticulum. Exp Neurol 215:110–118, 2009 48. Lin X, Taguchi A, Park S, Kushner JA, Li F, Li Y, White MF: Dysregulation of insulin receptor substrate 2 in beta cells and brain causes obesity and diabetes. J Clin Invest 114:908–916, 2004 49. Balthasar N, Dalgaard LT, Lee CE, Yu J, Funahashi H, Williams T, Ferreira M, Tang V, McGovern RA, Kenny CD, Christiansen LM, Edelstein E, Choi B, Boss O, Aschkenasi C, Zhang CY, Mountjoy K, Kishi T, Elmquist JK, Lowell BB: Divergence of melanocortin pathways in the control of food intake and energy expenditure. Cell 123:493–9505, 2005
A2BP1 and Obesity
15
FIGURE LEGENDS FIG. 1. Linkage disequilibrium plots (D’ and r2) for the region around rs10500331 and rs12924838. D’ is indicated by the intensity of the shading and the numbers in the boxes indicate r2. A: Schematic showing A2BP1 gene structures. Black box indicates the location of the region shown in (B) and (C). B: Linkage disequilibrium pattern for Pima Indians. C: Linkage disequilibrium pattern for Caucasians. FIG. 2. Association analyses between BMI/obesity and variants spanning 1.2 Mb of A2BP1. Black diamonds, association results for BMI in the population-based sample of full-heritage Pima Indians. Open triangles, association results for obesity in the French children case/control samples. Gray circles, Association results for obesity in the French adult case/control samples. FIG. 3. Expression profile for A2BP1 in different human tissues. FIG. 4. Relative gene expression for A2bp1, Atxn2, Insr, Mc4r, Lepr, and Npy1r in A2bp1 knockdown N-41 mouse embryonic hypothalamus cells. Gray shaded bars, N-41 cells transfected with a negative control (scrambled) siRNA. Open bars N-41 cells transfectesd with A2bp1 siRNA. Negative control siRNA was a scrambled, randomly selected non-specific siRNA sequence.
A2BP1 and Obesity
16
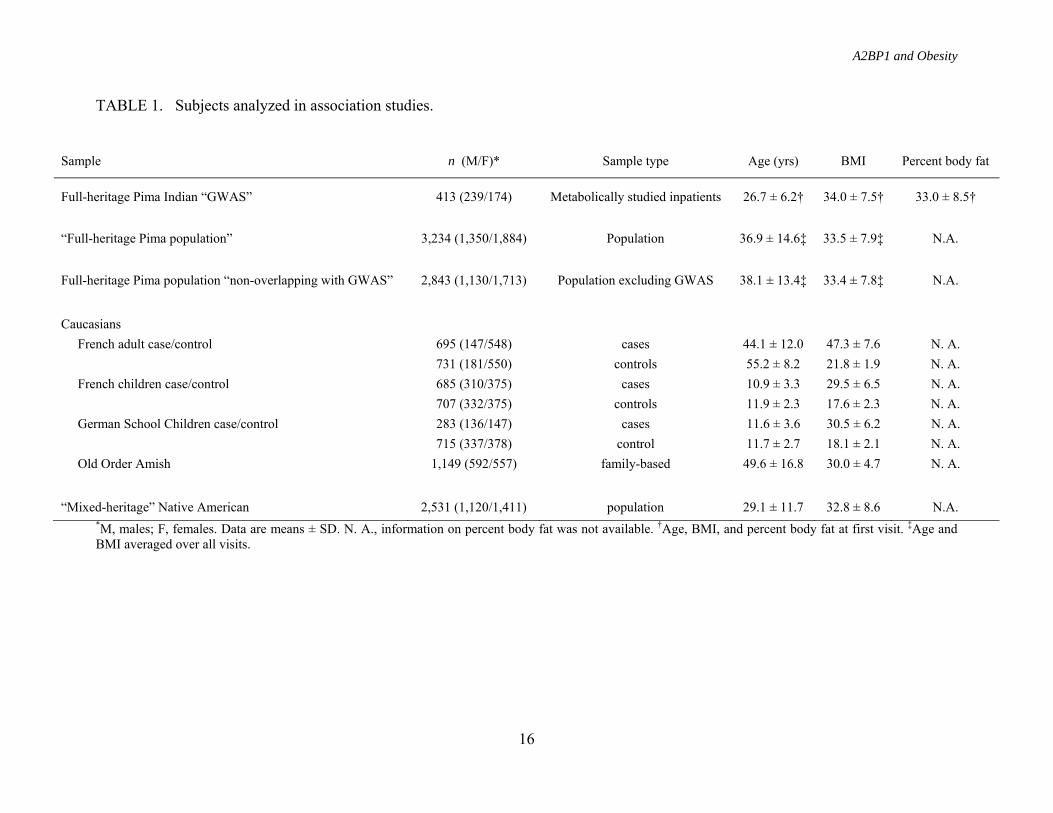
TABLE 1. Subjects analyzed in association studies.
*M, males; F, females. Data are means ± SD. N. A., information on percent body fat was not available. †Age, BMI, and percent body fat at first visit. ‡Age and BMI averaged over all visits.
Sample n (M/F)* Sample type Age (yrs) BMI Percent body fat
Full-heritage Pima Indian “GWAS” 413 (239/174) Metabolically studied inpatients 26.7 ± 6.2† 34.0 ± 7.5† 33.0 ± 8.5†
“Full-heritage Pima population” 3,234 (1,350/1,884) Population 36.9 ± 14.6‡ 33.5 ± 7.9‡ N.A.
Full-heritage Pima population “non-overlapping with GWAS” 2,843 (1,130/1,713) Population excluding GWAS 38.1 ± 13.4‡ 33.4 ± 7.8‡ N.A.
Caucasians French adult case/control 695 (147/548) cases 44.1 ± 12.0 47.3 ± 7.6 N. A. 731 (181/550) controls 55.2 ± 8.2 21.8 ± 1.9 N. A. French children case/control 685 (310/375) cases 10.9 ± 3.3 29.5 ± 6.5 N. A. 707 (332/375) controls 11.9 ± 2.3 17.6 ± 2.3 N. A. German School Children case/control 283 (136/147) cases 11.6 ± 3.6 30.5 ± 6.2 N. A. 715 (337/378) control 11.7 ± 2.7 18.1 ± 2.1 N. A. Old Order Amish 1,149 (592/557) family-based 49.6 ± 16.8 30.0 ± 4.7 N. A.
“Mixed-heritage” Native American 2,531 (1,120/1,411) population 29.1 ± 11.7 32.8 ± 8.6 N.A.
A2BP1 and Obesity
17
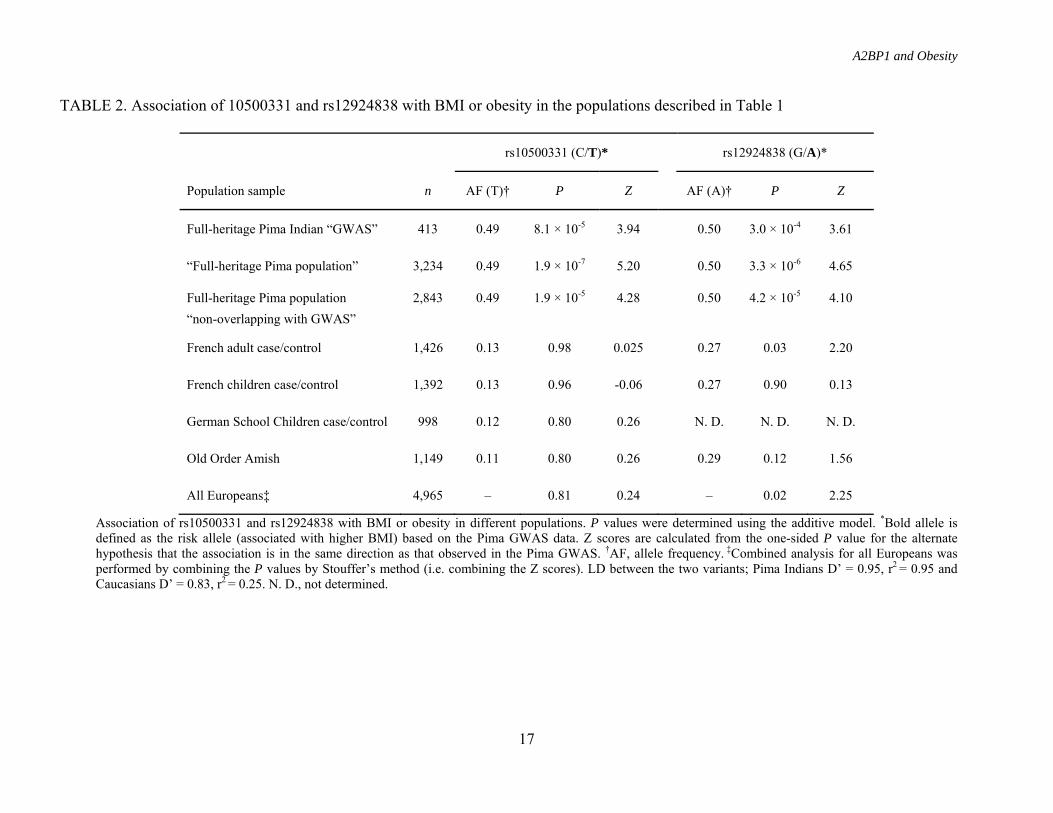
TABLE 2. Association of 10500331 and rs12924838 with BMI or obesity in the populations described in Table 1
rs10500331 (C/T)* rs12924838 (G/A)*
Population sample n AF (T)† P Z AF (A)† P Z
Full-heritage Pima Indian “GWAS” 413 0.49 8.1 × 10⁻⁵ 3.94 0.50 3.0 × 10⁻⁴ 3.61
“Full-heritage Pima population” 3,234 0.49 1.9 × 10⁻⁷ 5.20 0.50 3.3 × 10⁻⁶ 4.65
Full-heritage Pima population 2,843 0.49 1.9 × 10⁻⁵ 4.28 0.50 4.2 × 10⁻⁵ 4.10 “non-overlapping with GWAS”
French adult case/control 1,426 0.13 0.98 0.025 0.27 0.03 2.20
French children case/control 1,392 0.13 0.96 -0.06 0.27 0.90 0.13
German School Children case/control 998 0.12 0.80 0.26 N. D. N. D. N. D.
Old Order Amish 1,149 0.11 0.80 0.26 0.29 0.12 1.56
All Europeans‡ 4,965 – 0.81 0.24 – 0.02 2.25
Association of rs10500331 and rs12924838 with BMI or obesity in different populations. P values were determined using the additive model. *Bold allele is defined as the risk allele (associated with higher BMI) based on the Pima GWAS data. Z scores are calculated from the one-sided P value for the alternate hypothesis that the association is in the same direction as that observed in the Pima GWAS. †AF, allele frequency. ‡Combined analysis for all Europeans was performed by combining the P values by Stouffer’s method (i.e. combining the Z scores). LD between the two variants; Pima Indians D’ = 0.95, r2 = 0.95 and Caucasians D’ = 0.83, r2 = 0.25. N. D., not determined.
A2BP1 and Obesity
18
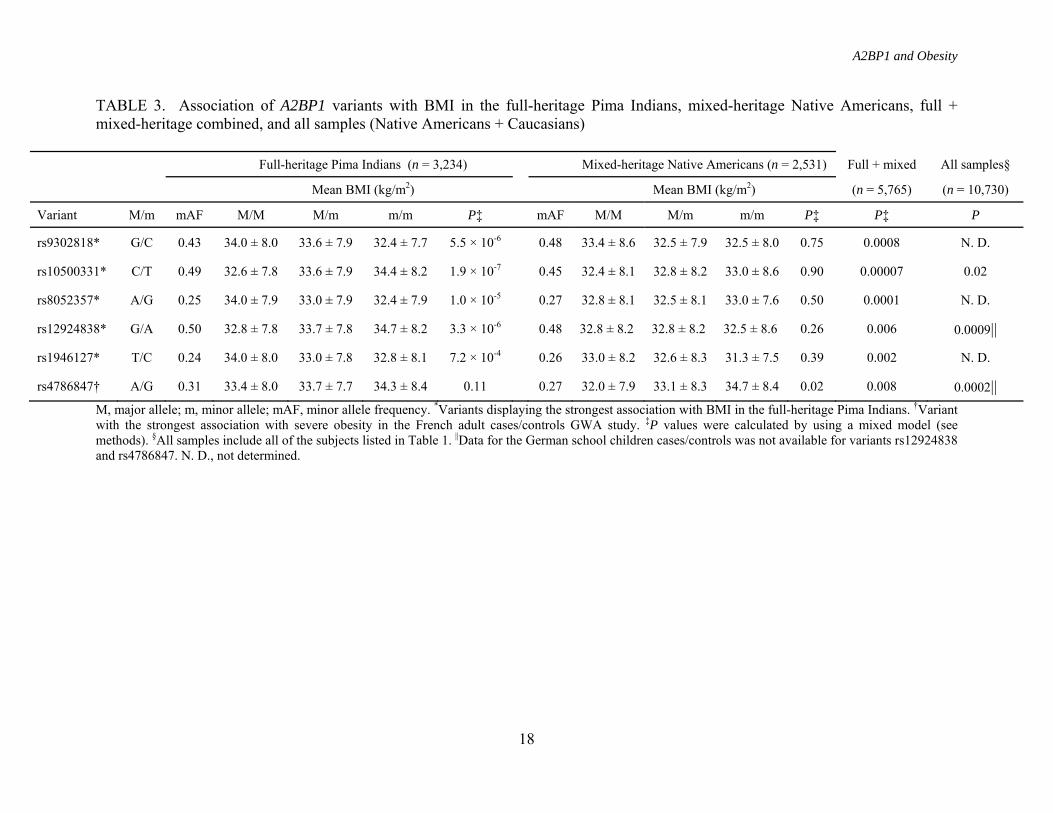
TABLE 3. Association of A2BP1 variants with BMI in the full-heritage Pima Indians, mixed-heritage Native Americans, full + mixed-heritage combined, and all samples (Native Americans + Caucasians)
Full-heritage Pima Indians (n = 3,234) Mixed-heritage Native Americans (n = 2,531) Full + mixed All samples§
Mean BMI (kg/m2) Mean BMI (kg/m2) (n = 5,765) (n = 10,730) Variant M/m mAF M/M M/m m/m P‡ mAF M/M M/m m/m P‡ P‡ P
rs9302818* G/C 0.43 34.0 ± 8.0 33.6 ± 7.9 32.4 ± 7.7 5.5 × 10⁻⁶ 0.48 33.4 ± 8.6 32.5 ± 7.9 32.5 ± 8.0 0.75 0.0008 N. D.
rs10500331* C/T 0.49 32.6 ± 7.8 33.6 ± 7.9 34.4 ± 8.2 1.9 × 10⁻⁷ 0.45 32.4 ± 8.1 32.8 ± 8.2 33.0 ± 8.6 0.90 0.00007 0.02
rs8052357* A/G 0.25 34.0 ± 7.9 33.0 ± 7.9 32.4 ± 7.9 1.0 × 10⁻⁵ 0.27 32.8 ± 8.1 32.5 ± 8.1 33.0 ± 7.6 0.50 0.0001 N. D.
rs12924838* G/A 0.50 32.8 ± 7.8 33.7 ± 7.8 34.7 ± 8.2 3.3 × 10⁻⁶ 0.48 32.8 ± 8.2 32.8 ± 8.2 32.5 ± 8.6 0.26 0.006 0.0009||
rs1946127* T/C 0.24 34.0 ± 8.0 33.0 ± 7.8 32.8 ± 8.1 7.2 × 10⁻⁴ 0.26 33.0 ± 8.2 32.6 ± 8.3 31.3 ± 7.5 0.39 0.002 N. D.
rs4786847† A/G 0.31 33.4 ± 8.0 33.7 ± 7.7 34.3 ± 8.4 0.11 0.27 32.0 ± 7.9 33.1 ± 8.3 34.7 ± 8.4 0.02 0.008 0.0002|| M, major allele; m, minor allele; mAF, minor allele frequency. *Variants displaying the strongest association with BMI in the full-heritage Pima Indians. †Variant with the strongest association with severe obesity in the French adult cases/controls GWA study. ‡P values were calculated by using a mixed model (see methods). §All samples include all of the subjects listed in Table 1. ||Data for the German school children cases/controls was not available for variants rs12924838 and rs4786847. N. D., not determined.
A2BP1 and Obesity
19
Figure 1
A2BP1 and Obesity
20
Figure 2
A2BP1 and Obesity
21
Figure 3
Figure 4