Embed Size (px)
Citation preview
MCSF Gene, Fat Intake, and Obesity
An epidemiologic study on gene-diet interaction in obesity development.
Prevalence of Obesity
Diet-induced obesity: the single most common health abnormality in the US, a risk factor of cancer and heart disease.
Definition:
overweight (BMI 25)
obesity (BMI 30)
extreme obesity (BMI 40)
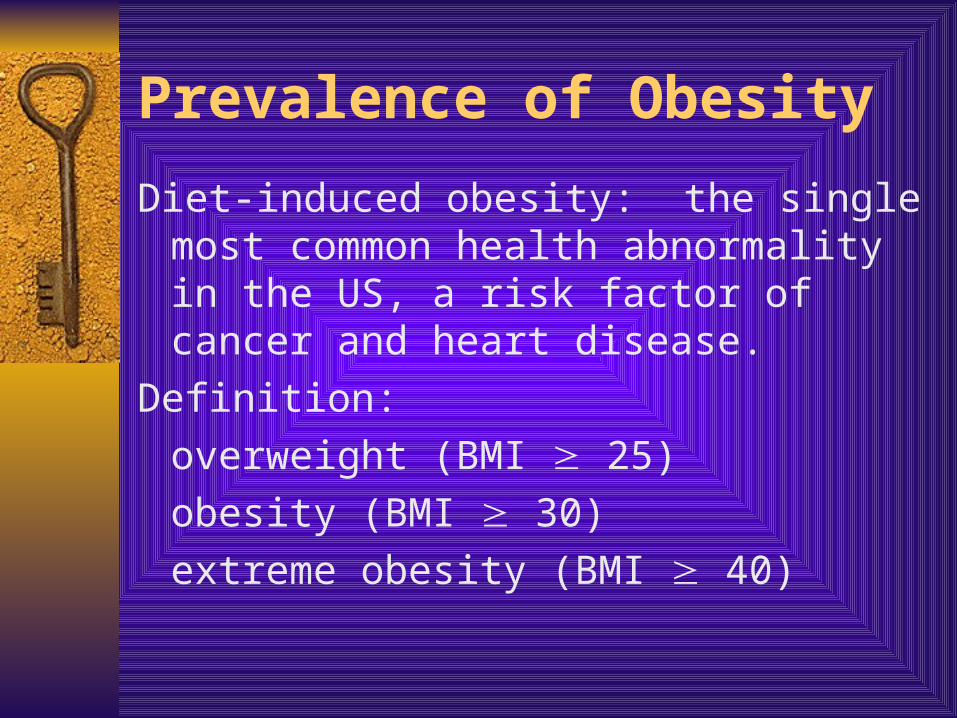
Prevalence of obesity (cont.)
MCSF gene
COLONY-STIMULATING FACTOR 1; CSF1Alternative titles; symbols
COLONY-STIMULATING FACTOR, MACROPHAGE-SPECIFIC; MCSF
Gene map locus 1p21-p13CLONING Kawasaki et al. (1985) isolated cDNA clones encoding human
macrophage-specific colony-stimulating factor (CSF1). Although it is a single-copy gene, its expression results in the synthesis of several mRNAs, ranging in size from about 1.5 to 4.5 kb.
Ladner et al. (1987) showed that there are 2 forms of CSF1, with 224 and 522 amino acids, resulting from alternative splicing.
MCSF Structure and Function
GENE STUCTURELadner et al. (1987) showed that the CSF1 gene
contains 10 exons and 9 introns spanning 20 kb.GENE FUNCTION
MCSF is a multifunctional protein that regulates the differentiation, proliferation, and survival of mononuclear phagocytes by binding to a specific cell surface receptor. It functions as a chemotactic agent for monocytes and can regulate the effectors functions of mature monocytes and macrophages. MCSF modulates inflammatory response by stimulating the production of several cytokines and growth factors.
MCSF Structure and Function (cont.)
Overfeeding induced MCSF over-expression.
Over-expression of MCSF via transfer led to increase in adipose tissue growth with cell proliferation.
Levine et al. JCI. 1998;101:1557
Scientific rationale
MCSF gene expression with relation to dietary fat intake suggested a gene-diet interaction for the association between fat intake and obesity.
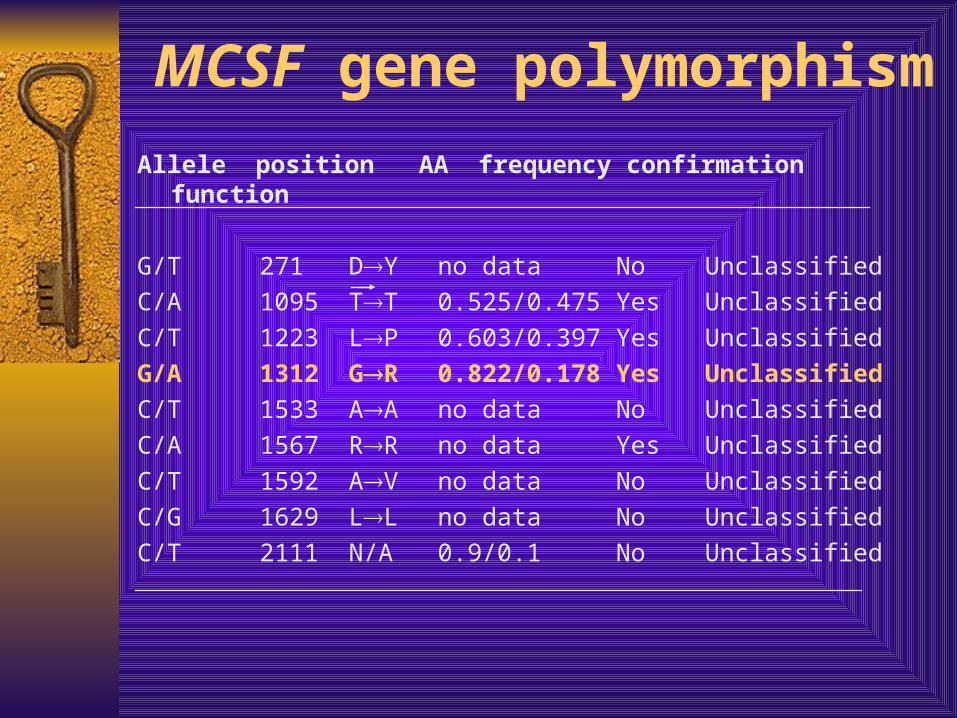
MCSF gene polymorphism
Allele position AA frequency confirmation function
G/T 271 DY no data No Unclassified
C/A 1095 TT 0.525/0.475 Yes Unclassified
C/T 1223 LP 0.603/0.397 Yes Unclassified
G/A 1312 GR 0.822/0.178 Yes Unclassified
C/T 1533 AA no data No Unclassified
C/A 1567 RR no data Yes Unclassified
C/T 1592 AV no data No Unclassified
C/G 1629 LL no data No Unclassified
C/T 2111 N/A 0.9/0.1 No Unclassified
Study populationthe Los Angeles Atherosclerosis Study
A cohort study Eligibility Primary interest Additional interest
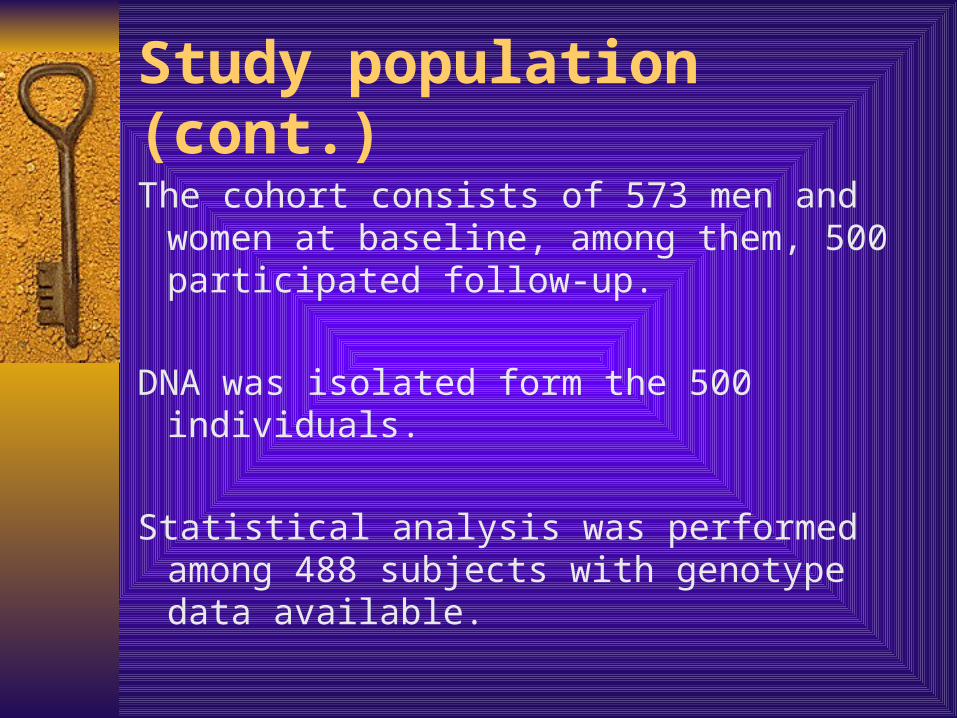
Study population (cont.)
The cohort consists of 573 men and women at baseline, among them, 500 participated follow-up.
DNA was isolated form the 500 individuals.
Statistical analysis was performed among 488 subjects with genotype data available.
Genotyping
Genotyping was carried out in UCLA by PCR to identify G/A transition at nucleotide 1312.
Dietary Intake
Dietary intake was assessed with three 24-hour recall.
Dietary measurements were repeated at the 18-month follow-up.
Dietary assessment was averaged over the 6 recalls.
Statistical analysis
Adjusted means were estimated with least squares regression for the genotypes.
The effect modification of the genotype for dietary fat intake on baseline BMI was analyzed with general linear model.
The comparison of regression weight of dietary fat intake on BMI between the two genotypes was done with multiple group analysis.
Models were adjusted for age, gender, race, smoking status, and physical exercise.

Allele type and genotypeAllele frequency among the cohort: G (wild-type allele)95.7
A (variant allele) 4.3Genotype:
frequency percent expectedGG: 448 91.8 447GA: 38 7.79 40AA: 2 0.41 1
Three genotypes were combined into:Wild-type 448 91.8Variant 40 8.2
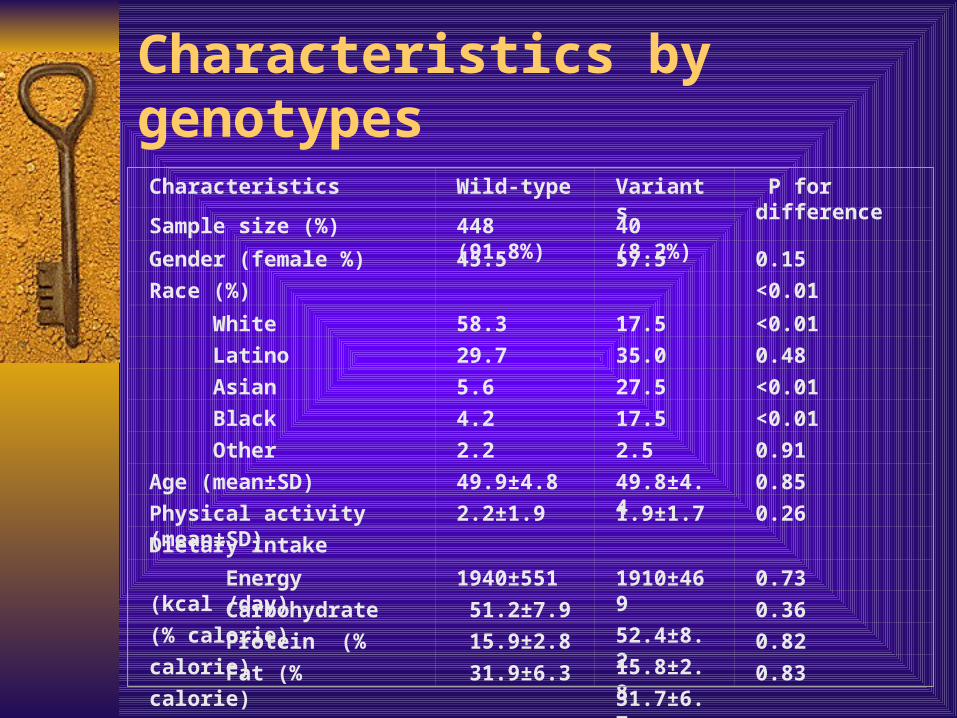
Characteristics by genotypes
Characteristics Wild-type Variants
P for difference
Sample size (%) 448 (91.8%) 40 (8.2%)
Gender (female %) 45.5 57.5 0.15
Race (%) <0.01
White 58.3 17.5 <0.01
Latino 29.7 35.0 0.48
Asian 5.6 27.5 <0.01
Black 4.2 17.5 <0.01
Other 2.2 2.5 0.91
Age (mean±SD) 49.9±4.8 49.8±4.4 0.85
Physical activity (mean±SD) 2.2±1.9 1.9±1.7 0.26
Dietary intake
Energy (kcal /day) 1940±551 1910±469 0.73
Carbohydrate (% calorie)
51.2±7.9 52.4±8.2 0.36
Protein (% calorie) 15.9±2.8 15.8±2.8 0.82
Fat (% calorie) 31.9±6.3 31.7±6.7 0.83
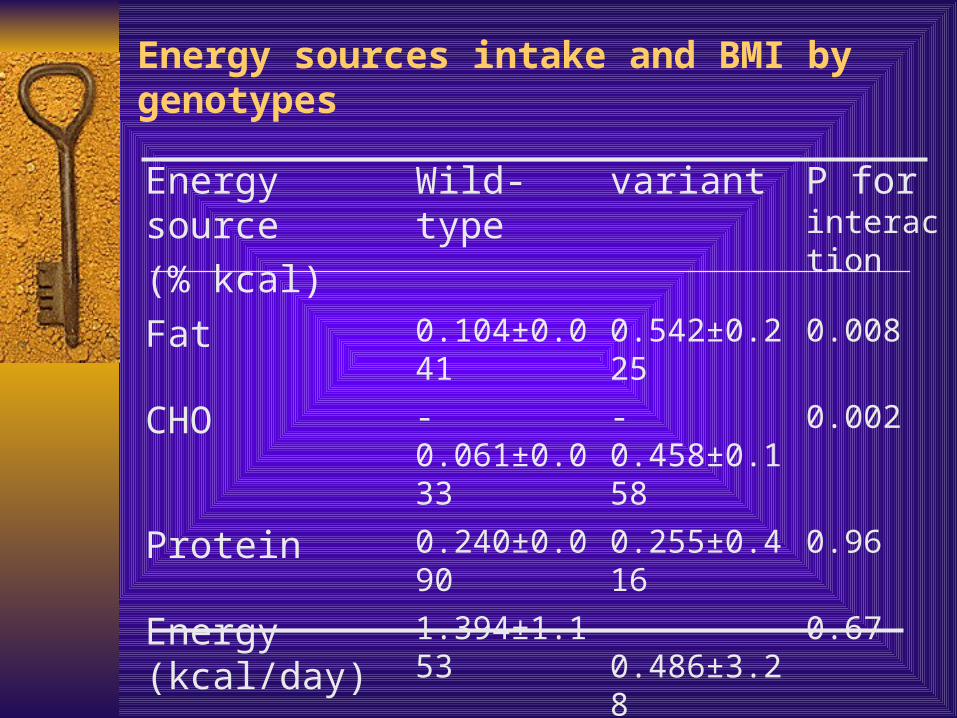
Energy sources intake and BMI by genotypes
Energy source
(% kcal)
Wild-type variant P for interaction
Fat 0.104±0.041 0.542±0.225 0.008
CHO -0.061±0.033 -0.458±0.158 0.002
Protein 0.240±0.090 0.255±0.416 0.96
Energy (kcal/day)
1.394±1.153 -0.486±3.28 0.67
Fat/CHO 3.18 ±1.17 10.49±4.48 0.047
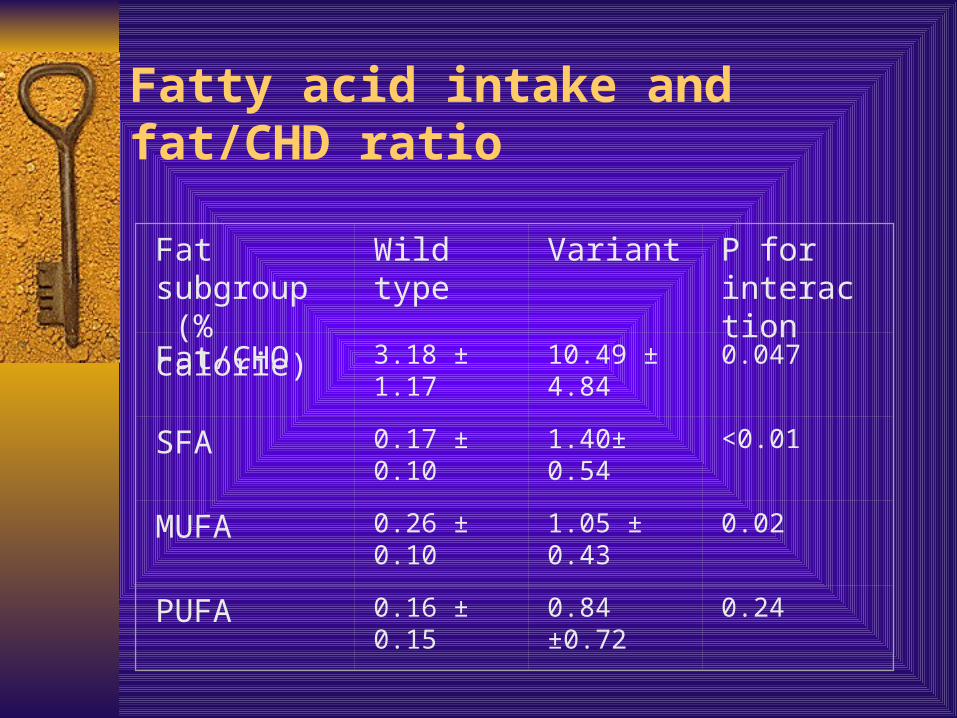
Fatty acid intake and fat/CHD ratio
Fat subgroup (% calorie)
Wild type Variant P for interaction
Fat/CHO 3.18 ± 1.17 10.49 ± 4.84 0.047
SFA 0.17 ± 0.10 1.40± 0.54 <0.01
MUFA 0.26 ± 0.10 1.05 ± 0.43 0.02
PUFA 0.16 ± 0.15 0.84 ±0.72 0.24
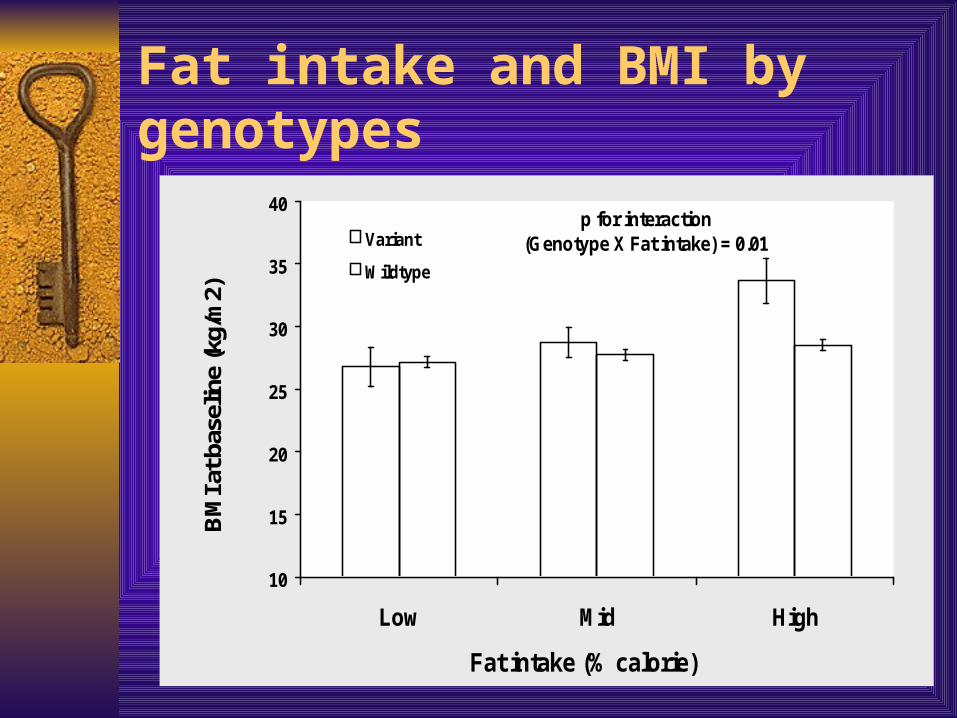
Fat intake and BMI by genotypes
10
15
20
25
30
35
40
Low Mid High
Fat intake (% calorie)
BM
I at b
asel
ine
(kg/
m2)
Variant
Wildtype
p for interaction (Genotype X Fat intake) = 0.01
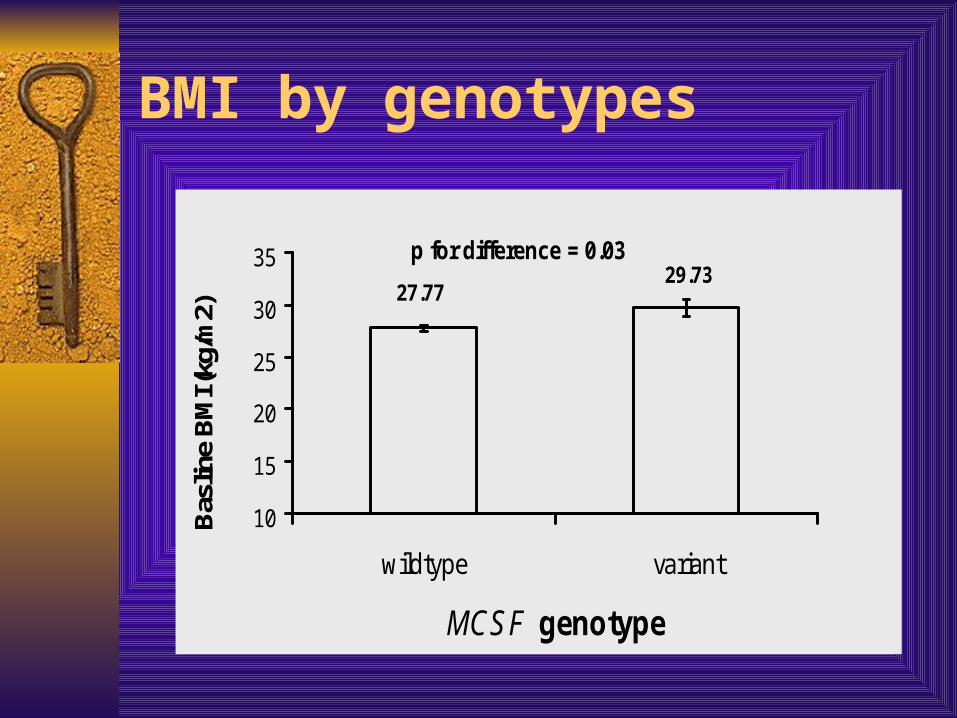
BMI by genotypes
27.7729.73
10
15
20
25
30
35
wildtype variant
MCSF genotype
Bas
line
BM
I (kg
/m2)
p for difference = 0.03
Fat vs Carbohydrate
There has been argued about the different roles of dietary fat and carbohydrate intake on the development of obesity.
Negative association between carbohydrate intake supported and reflected the positive association for fat intake.
Increased BMI by switching intake of carbohydrate to fat also indicated a dominative effect of fat on obesity.
Effect modification of MCSF at fat intake
Variants (Gly438Arg) enhanced fat contribution on BMI, and was more adipogenesis.
No difference in dietary fat intake between genotypes, indicating an impact on fat utilization and storage.
Interpretation of the findings
Non-conservative variation usually results in less active protein product.
Explanation is hard with function study data not available.
Other consistent findings
Similar report by Rosmond et al on GTF-1 gene.
Acrobat Document

Possible mechanisms
Without function study, the possibility of elevation in MCSF activity can not fully excluded.

Possible mechanisms (cont.)
Gene-gene interaction.
Acrobat Document

Possible mechanisms (cont.)
Another example
Acrobat Document
Possible mechanism (cont.)
Two forms of MCSF, one with 224 AA and one with 522 AA.
Two forms have different fates.
Stanley E et al, Mol Reprod Dev 1997;46:4
G1312A occurs at the longer MCSF. Mutual communication between the two
forms possible.
Limitations
Comparatively small sample size.
for multivarible adjustment Difficulty in interpretation of the
findings due to lack of functional data.
Conclusion
MCSF gene may be involved in the obesity development via an interaction with dietary fat.
Acknowledgement
Dr. Jack Lusis at UCLA for genotyping and constructive discussion on MCSF gene biology.
Dr. James Dwyer, PI of LAAT. Maura Paul-Labrador for statistical
analysis. Dr. Kathleen Dwyer, Co-PI.

Thank you!