Embed Size (px)
Citation preview
Evaluation of an Automated Digital Imaging System,Nextslide Digital Review Network, for Examination
of Peripheral Blood Smears
Hongbo Yu, MD, PhD; Chi Young Ok, MD; Adam Hesse, BS; Peter Nordell, MEM, MBA; Diane Connor, MT; Erica Sjostedt, MT;Liberto Pechet, MD; L. Michael Snyder, MD
N Context.—Several automated digital imaging systemshave been introduced in recent years to improve turn-around time and proficiency in examining peripheral bloodsmears in hematology laboratories.
Objective.—To evaluate a new automated digital imag-ing system, Nextslide Digital Review Network (Nextslide),for examination of peripheral blood smears.
Design.—We evaluated 479 peripheral blood smears,of which 247 (51.6%) were included for comparison ofNextslide and manual white blood cell differentialcounts and morphology evaluation, 204 (42.6%) wereincluded for comparison of Nextslide and CellaVision(DM96) differential counts, and 28 (5.8%) were neona-tal samples examined for enumeration of nucleated redblood cells.
Results.—Results from both method comparisons showedexcellent correlation for all major white blood cell classes withcorrelation coefficients ranging from 0.70 to 0.99. Evaluation ofwhite blood cell, red blood cell, and platelet morphology alsoshowed good correlation among methods. White blood cellpreclassification capability in the system was evaluated for rateand accuracy. Leukopenic samples demonstrated markedlydecreased review time with Nextslide. Enumeration of nucle-ated red blood cells showed good correlation among methods.
Conclusions.—Our evaluation of Nextslide shows excel-lent correlation when compared with conventional manualdifferentials and CellaVision (DM96) differentials for evalu-ation of peripheral blood smears.
(Arch Pathol Lab Med. 2012;136:660–667; doi: 10.5858/arpa.2011-0285-OA)
The primary step in assessing hematologic function andthe presence of disease is an examination of the
cellular elements in the peripheral blood.1 Examination ofthe blood frequently provides important information thataids in the diagnosis of hematologic diseases and maysuggest further testing.2 The complete blood cell count(CBC) is one of the most commonly ordered laboratorytests. A CBC test may be ordered as a simple count ofblood elements and red blood cell (RBC) indices or as atest that includes a white blood cell (WBC) differentialcount. Most laboratories use automated analyzers forCBCs. These analyzers can flag abnormalities in RBCs,WBCs, and platelets and can, thus, trigger examination ofthe peripheral blood smear. Automated blood cell analysisand visual morphologic examination of blood cells eachoffer significant advantages and disadvantages.3 It is
unlikely that either approach will totally supplant theother. Automated analyzers provide clinical laboratorieswith the capability to efficiently handle a large volume ofsamples and provide superior accuracy and precisionin quantitative blood cell measurements. However, thecomplexity and remarkable variation of formed bloodelements offer formidable challenges for any automatedanalyzer. A significant proportion of samples still requiremanual examination of the blood-test slide for definitivediagnosis of morphologic abnormalities.
Examination of peripheral blood slides by light micros-copy remains one of the major labor-intensive proceduresin the hematology laboratory, requiring a highly trainedstaff. In addition, manual differential counts remainsubject to significant statistical variance.4 Thus, automatedmorphology-analysis systems have been developed. Ide-ally, these automated systems should be able to mor-phologically analyze a peripheral smear-test slide, withreproducible results faster than, or at least as fast as,medical technologists. The first automated morphologicalanalysis system introduced was the Cydac ScanningMicroscope System (Cydac, Uppsala, Sweden) in 1966.5
A few digital analysis systems in the past include theLARC (leukocyte automatic recognition computer; Corn-ing Medical, Raleigh, North Carolina), the Hematrak(Geometric Data, Wayne, Pennsylvania), the Coulter Diff 3and Diff 4 (Coulter S-Plus WBC histogram, CoulterElectronics, Hialeah, Florida), and the ADC 500 (AbbottLaboratories, Abbott Park, Illinois).6 However, those
Accepted for publication August 22, 2011.From the Department of Hospital Laboratories, University of
Massachusetts Memorial Medical Center, Worcester (Drs Yu, Ok,Pechet, and Snyder and Mss Connor and Sjostedt); and NextslideImaging LLC, Cleveland, Ohio (Messrs Hesse and Nordell).
Adam Hesse is a system architect and Peter Nordell is a managingpartner at Nextslide Imaging LLC. The other authors have no relevantfinancial interest in the products or companies described in this article.
Presented at the annual meeting of the American Society for ClinicalPathology; October 29, 2010; San Francisco, California.
Reprints: Hongbo Yu, MD, PhD, Department of Hospital Laboratoriesand Department of Pathology, University of Massachusetts MemorialMedical Center, One Biotech Park, 365 Plantation Street, Worcester,MA 01605 (e-mail: [email protected]).
Original Article
660 Arch Pathol Lab Med—Vol 136, June 2012 Nextslide, an Automated Digital Imaging System—Yu et al
instruments were slow and offered a limited degree ofautomation and, thus, failed to provide significantimprovements in workflow. Several automated digitalimaging systems have been introduced in recent years toimprove turnaround time and proficiency.7–9 CellaVision(Lund, Sweden) has been the system most often used forthis purpose. CellaVision introduced 3 new systems, in2001 the Diffmaster Octavia, in 2004 the DM96, and in2010, the CellaVision DM1200 was introduced in theUnited States through Sysmex America, Mundelein,Illinois. These instruments scan slides at low power,identifying WBCs, and then take digital images at highmagnification. The images are analyzed by an artificialneural network based on a database of cells andpreclassified according to WBC class. The cells arepresented on a computer screen for confirmation orreclassification.
We evaluated a new automated digital imaging system,Nextslide Digital Review Network (Nextslide), for exam-ining peripheral blood smears. This system was codevel-oped by Nextslide Imaging (Cleveland, Ohio) and theDepartment of Hospital Laboratories, University ofMassachusetts Memorial Medical Center (Worcester).The goal of this study was to evaluate the clinical accuracyand operational efficiency of this new image system incomparison to the standard reference manual differential10
and to the CellaVision (DM96). Within this study, wespecifically evaluated 4 areas of performance important toour operation: (1) classification of WBCs, (2) manuallyproduced peripheral blood slides, (3) leukopenic samples,and (4) neonatal samples.
MATERIALS AND METHODS
Nextslide Digital Review Network
The Nextslide Digital Review Network consists of a high-resolution slide scanner, a hosted software-application suiterunning in a data center accessed through the Internet, and aninterface with the hospital laboratory information system. Thehosted application suite serves the same functions as traditional,installed software, but the maintenance and support is fullymanaged by Nextslide Imaging. The suite includes an image-processing application, a management application, and an onlinereview application. The image-processing application acceptscompleted images from the slide scanner and processes them toidentify and classify WBCs. Users log into the online reviewapplication and review the processed and raw images, as well asthe classification results, from their Web browser.
Scanning.—When a peripheral blood slide is placed on theslide scanner, snapshot images of the test area and of the bar-coded slide label are obtained and uploaded to the data center.The laboratory information system interface is queried for theupstream CBC results; that information is used to optimize thescanning process and to provide part of the subsequent reviewinformation. The low-resolution peripheral blood smear image isthen analyzed, and a scan location is selected for each peripheralblood slide. The scan coordinates are transmitted back to thescanner, and the high-resolution scanning begins. Slides areloaded onto trays for scanning, and each tray holds 5 slides. Thethroughput of the instrument is 26 slides per hour. A single slidecan be loaded into the instrument for rush cases or STAT review.
Image Analysis.—Once scanning is completed, the scanneruploads the high-resolution image (3100) to the data center. Theimage-processing applications analyze each image. The WBCsare located, an image of each is cropped and copied, and eachWBC image is classified.
Slide Review.—An experienced technician reviews each case,accessing the image remotely with a Web browser. The reviewer
examines 110 WBC images and some portion of the full-resolution slide image. The WBC images are presented to thereviewer in a gallery grouped by cell class. The reviewerconfirms the classification and notes morphologic abnormalities.The peripheral blood smear image is reviewed to evaluate theRBC and platelet morphology and to estimate a platelet count ina manner similar to using a manual microscope. Reviewers canadjust brightness and zoom throughout the review as necessary;zoom is used in a manner similar to ‘‘flipping’’ objectives on amanual microscope, and because the scanned image is made at3100 magnification, all image data used in the review is availableat full 3100. Additionally, CBC results from the blood analyzercan be extracted from the laboratory information system andpresented in the user interface to assist in the review process.When the technician has completed the review, the test resultsare uploaded to the laboratory information system.
Hematology Review.—If necessary, the technician can flag thecase for hematology review, and the network will notify thephysician to access the case. Hematology review is performedusing the same application and image data as above but with adifferent user profile, which optimizes the workflow for thephysician.
Blood Samples
Cases were retrieved from files archived from the hematologylaboratory at the Department of Hospital Laboratories, Univer-sity of Massachusetts Memorial Medical Center (Worcester).This study was approved by the University of MassachusettsMemorial Medical Center Institutional Review Board.
We evaluated 479 peripheral blood smears in total. Forcomparison between Nextslide and manual WBC differentialcounts and morphology evaluation, we examined 247 peripheralblood slides (51.6%), including 50 blood samples (10.4%) withinreference range and 197 blood samples (41.1%) with abnormal-ities flagged by the automated hematology analyzers. Forcomparisons between Nextslide and CellaVision (DM96), 102samples (21.3%) within reference range, and 102 samples (21.3%)with abnormalities were selected. The blood samples withabnormal results included various clinical conditions, such asacute myeloid leukemia, acute lymphoblastic leukemia/lympho-ma, myelodysplastic syndrome, myeloproliferative neoplasms,chronic lymphocytic leukemia, other mature B-cell lymphomas,plasma cell neoplasms, T-cell prolymphocytic leukemia, infec-tions, chronic inflammatory conditions, leukopenia, and anemia(Table 1). The WBC counts ranged from 200/mL to 197 400/mL(reference range, 4500–11 000/mL). In addition, 28 neonatalsamples (5.8%) were studied to address the use of smalleramounts of blood for examination and enumeration of nucleatedRBCs.
Methods
Peripheral blood smears were prepared either automatically ormanually. When prepared automatically, they were made andstained either by Beckman Coulter LH785 (Beckman Coulter, Inc,Miami, Florida) or a Sysmex SP-1000i (Sysmex America, Inc,Mundelein, Illinois). The manually prepared peripheral bloodsmears were then stained using Hematek (HemaTechnologies,Lebanon, New Jersey) or Midas (Thomas Scientific, Swedesboro,New Jersey) stainer with Wright-Giemsa stain.
The first segment of the study was done primarily to comparemanually prepared peripheral blood smears on Nextslide with amanual microscope, with the focus on leukopenic samples. Ourprevious experience with CellaVision found that it had limitedperformance with manually prepared smears and leukopenicsamples. Poor performance on manually prepared smears hasrequired the addition of a slide maker at any location thatemploys a digital microscope. Each peripheral blood smear wasthen reviewed using both the reference method (manual) and thetest method (digital) in parallel. One of 2 experienced medicaltechnologists or a pathology resident performed all the reviewsusing both methods. Reviews included a 100-cell differential
Arch Pathol Lab Med—Vol 136, June 2012 Nextslide, an Automated Digital Imaging System—Yu et al 661

WBC count and a morphologic examination for WBC, RBC, andplatelet abnormalities. The cell counts for each peripheral bloodsmear by each method were compared, and any cases where theresults of the 100-cell count were outside the Rumke limits4 wererereviewed by both methods as 200-cell counts. Twenty-eightneonatal manually prepared peripheral blood smears were alsoincluded in the study. Enumeration of nucleated RBCs wasperformed either by an experienced medical technologist or by apathology resident using a light microscope and Nextslide inparallel for each case.
The second segment of this study was performed on all slidesproduced by slide makers to compare Nextslide to CellaVision(DM96). Two slides were made for each sample. Each slide wasreviewed by 2 different technologists, who used each method toperform a 200-cell differential count. The results of each 400-celldifferential count were analyzed, and any samples that were notwithin the 95% confidence interval were arbitrated by a seniormember of the laboratory staff.
Timing Study
The timing study was performed on 42 leukopenic samples(WBC range, 200/mL to approximately 1800/mL). Review timesfor the manual microscopic method and the Nextslide methodfor each test slide were recorded.
Statistical Analysis
Statistical analysis was performed using an Excel spread-sheet (Microsoft, Redmond, Washington) for evaluation ofaccuracy.
RESULTS
Accuracy of WBC Differential Counts
For this part of the study, 247 peripheral blood smearswere evaluated as described, the preclassification functionwas not used. Nextslide acquires an image, whichincludes, on average, 220 WBCs. By default, the user ispresented with the first 110 WBC images (Figure 1) but isallowed to view and classify all available WBC images.Accuracy was assessed by computing the regression slopeand the correlation coefficient (r2) between manualdifferential counts and Nextslide results (Figure 2). Be-cause of the limited number of slides of promyelocytes,myelocytes, and metamyelocytes, these cells were groupedtogether and reported as immature granulocytes. Strongcorrelation was observed with neutrophils (Figure 2, A),lymphocytes (Figure 2, B), atypical lymphocytes (Figure 2,F), blasts (Figure 2, G), immature granulocytes (Figure 2,H), and bands (Figure 2, I), with slopes being close to 1.0(range, 0.93–1.06), and r2 greater than 0.85. Correlationcoefficients for monocytes (Figure 2, C) and eosinophils(Figure 2, D) were slightly lower, with the values being0.82 and 0.77, respectively. The low value for basophils(Figure 2, E; r2 5 0.56) was not significant because of thefew cells counted on the peripheral blood smears.
Preclassification of WBCs
Nextslide’s preclassification engine uses an artificialneural network to classify images; therefore, it can bedeployed using any number of cell types. The currentversion of Nextslide’s classification engine, however, doesnot extract some of the subtle features necessary todistinguish among some abnormal cell types. Thesefeatures are to be added to a future version of Nextslide’sclassification engine. Primarily, Nextslide’s preclassifica-tion feature is a productivity tool that eliminates the needto classify most cells within reference range, which makesup most of the classification effort. In addition, because thereviewer receives a quick view of cells classified as normal,the workflow for time spent on laboratory differential ratesshould be reduced because reviewers can quickly evaluatethe patient’s WBC morphology results as within referencerange and move on to study RBC morphology.
The accuracy and classification rates of the preclassifi-cation function were analyzed as part of this study. Thisfunction was not enabled for the study; it was developedin parallel to the study, and its performance was evaluatedby using the manual classification results.
Functionally, a cell image is classified by comparing it to aset of reference images and deciding within which cellgroup the cell image best fits. In total, more than 25 000 cellswere manually classified by an operator in this study onNextslide; these manually classified images were used in2 ways to evaluate the classification function. A referencelibrary was defined by collecting more than 1500 sampleimages from the collection of cells classified in the study. Inaddition, a second group of 2907 cell images were collectedand classified using the classification function. Theseclassification results were compared against the originalclassifications evaluated by the technician.
Table 2 summarizes the classification rate and theaccuracy of the classification function. The classificationrate is determined by the total cells classified, divided bythe total cells attempted. Accuracy is defined by the totalnumber of cells classified correctly, divided by the totalnumber of cells classified. Both classification rate andaccuracy were evaluated on a per–cell-type basis. The ratefor each WBC class ranged from 75.3% to 96.9%, with thehighest rate in the neutrophil class and the lowest rate inthe basophil class. The accuracy for each WBC classranged from 94.6% to 99.7%.
Morphology Review of WBCs, RBCs, and Platelets
The reviewer can perform WBC morphology reviewusing the morphology codes within the same WBCclassification screen in Nextslide. In addition, Nextslideallows the reviewer to examine RBC and plateletmorphology at a range of magnifications, with the highest
Table 1. Clinical Conditions Included in This Study
Clinical Conditions No. of Cases
Acute myeloid leukemia 12Acute lymphoblastic leukemia/lymphoma 8Myelodysplastic syndrome and myeloproliferative neoplasm 18Chronic lymphocytic leukemia and other mature B-cell lymphoma 11Plasma cell neoplasm 5T-cell prolymphocytic leukemia 1Infections and chronic inflammatory conditions 112Leukopenia 60Anemia 21
662 Arch Pathol Lab Med—Vol 136, June 2012 Nextslide, an Automated Digital Imaging System—Yu et al

magnification being 3100 (Figure 3). The WBC, RBC, andplatelet morphologies for the 247 peripheral blood smearswere evaluated by the examiner based on the morphologycodes listed in Table 3. Each peripheral blood smear wasscored as present or absent for each morphology code. Thepercentage of positive agreement was calculated byidentifying all cases in which each morphology codewas identified in both the reference and test methods,divided by all cases in which the morphology code wasidentified in the reference method alone, that is, true-positive/(true-positive + false-negative). Each morphologyresult was grouped by cell type (WBC, RBC, and platelet)and the value of the overall percentage of positiveagreement was calculated for each cell type (Table 3). Ingeneral, our study demonstrates good correlation betweenthe microscopic method and the Nextslide method.
In addition, an estimate of the platelet count can bemade. The Nextslide workflow process includes a screenthat allows the user to view any part of the scannedperipheral blood smear image. A 199-mm by 126-mmrectangle is annotated on the image, which is an areasimilar to a single high-power (3100) field under themicroscope. This area can be moved to any location andallows the user to estimate platelets in the same mannerused for manual microscopy.
Platelet satellitosis occurs occasionally in peripheralblood samples collected in ethylenediaminetetraaceticacid anticoagulant and thus leads to pseudothrombocy-topenia. We examined 5 such cases, and Nextslidesuccessfully detected platelet clumps in all cases (datanot shown).
Leukopenic Samples
Leukopenic samples pose a challenge for any differen-tial count, and they require longer review times thansamples with WBC counts that are within reference rangeor are elevated. Nextslide offers a useful feature for
leukopenic samples, allowing the scanning area to beadjusted based on the WBC count. For leukopenicsamples, the scanning size can be expanded to capture asufficient number of cells. In our study, we included60 leukopenic samples with WBC count ranging from200/mL to 1800/mL. The WBC images from a representa-tive leukopenic sample and a blood sample withinreference range are shown in Figure 4. The quality of thecell images for the leukopenic samples is comparable tothe samples within reference range. The average time toscan and capture images for samples with normal WBCcount results is 2.3 minutes. For leukopenic samples, thetime varies based on the WBC counts. For samples withWBC counts around 1500/mL, it usually takes approxi-mately 4 minutes. The longest time was 15 minutes for aperipheral blood smear with a WBC count of 200/mL. Weconducted 100-cell differential counts on 59 leukopenicsamples. Nextslide identified 21 WBC images on onesample with a WBC count of 200/mL. We also comparedthe review time of 42 leukopenic samples between a manualWBC differential count and Nextslide. The mean reviewtime for the manual differential count was 10.9 (SD 4.28)minutes. Without preclassification, Nextslide shows a meanreview time of 2.83 (SD 0.95) minutes. Therefore, our resultreveals that Nextslide can evaluate leukopenic samples anddoes so with a markedly decreased review time.
Nucleated RBC Enumeration in Neonatal Samples
Neonatal samples are unique because of their smallersample volume and high frequency of nucleated RBCs.In addition to the 247 samples studied above, peripheralblood smears from 28 neonatal samples were alsoexamined. Nextslide clearly identified nucleated RBCs(data not shown). Enumeration of nucleated RBCs wasperformed for each peripheral blood smear and wasexpressed as the number of nucleated RBCs per 100WBCs. The correlation coefficient was 0.87 (Figure 5).
Figure 1. Default white blood cell (WBC) review screen in the Nextslide Digital Review Network system. The unclassified WBC images arepresented on the left. Morphology codes for WBC can be entered or edited on the right.
Arch Pathol Lab Med—Vol 136, June 2012 Nextslide, an Automated Digital Imaging System—Yu et al 663

Comparison of Nextslide to CellaVision (DM96)
The comparison of Nextslide to CellaVision demon-strated correlation coefficients similar to that found in thecomparison with the manual microscope (Figure 6). Formajor cell classes, including neutrophils (Figure 6, A),
lymphocytes (Figure 6, B), monocytes (Figure 6, C),eosinophils (Figure 6, D), blasts (Figure 6, G), andimmature granulocytes (Figure 6, H), correlation coeffi-cients ranged from 0.92 to 0.97. Correlation coefficients forbasophils (Figure 6, E), atypical lymphocytes (Figure 6, F),and bands (Figure 6, I) were lower at 0.71, 0.72, and 0.86,respectively. The primary reason for the increasedstatistical match was due to use of a 400-cell differentialcount, rather than a 100-cell differential count. Approxi-mately 10% of the slides failed to yield results on theCellaVision, whereas all the slides were successfullyevaluated on the Nextslide.
COMMENT
Examination of peripheral blood smears by lightmicroscopy is one of the major labor-intensive diagnostic
Figure 2. Correlation of white blood cell (WBC) classification by the Nextslide Digital Review Network system and by manual differentialmicroscopic method. Correlation of neutrophils (A), lymphocytes (B), monocytes (C), eosinophils (D), basophils (E), atypical lymphocytes (F), blasts(G), immature granulocytes (the sum of promyelocytes, myelocytes, and metamyelocytes) (H), and bands (I) between the 2 methods. Abbreviation:R2, correlation coefficient.
Table 2. Rate and Accuracy of Preclassified Cellsfor Each White Blood Cell (WBC) Class by Nextslide
Digital Review Network System
Cell Class Rate, % Accuracy, %
Neutrophil 96.9 99.7Lymphocyte 86.6 95.3Monocyte 87.6 94.6Eosinophil 93.1 99.0Basophil 75.3 95.5
664 Arch Pathol Lab Med—Vol 136, June 2012 Nextslide, an Automated Digital Imaging System—Yu et al

procedures in hematology laboratories. Moreover, leuko-penic samples often generate additional burden onmedical technologists to accurately classify the WBCsand achieve an appropriate turnaround time. We reportthe evaluation of a new, automated digital imagingsystem, Nextslide Digital Review Network, for examina-tion of peripheral blood smears.
We evaluated 479 peripheral blood smears usingNextslide, CellaVision, and microscopic manual differen-
tial. Our data show that Nextslide can generate WBCdifferential results that are comparable to either method,with correlation coefficients greater than 0.77 for majorWBC classes. The Nextslide preclassification rate andaccuracy for each WBC class was between 75.3% and99.7%. This feature helped the reviewers to achieveaccurate results and to reduce review time.
From the evaluation of 28 manually prepared, neonatalperipheral blood smears, our study showed that Nextslide
Figure 3. A representative Nextslide DigitalReview Network system review screen for redblood cell and platelet morphology evalua-tion (original magnification 3100).
Table 3. Percentage of Positive Agreement Between the Nextslide Digital Review Network System and Microscopyfor White Blood Cell (WBC), Red Blood Cell (RBC), and Platelet Morphology Review
Cell Type Morphology Code Occurrences, No. Concordance, % Overall Concordance, %
WBC Toxic granulations 28 78.57 76.10Dohle bodies 5 80.00Vacuolations 38 84.21Smudge cells 32 65.63Clefted lymphocytes 10 60.00Hairy projections 2 100.00Auer rods 2 100.00
RBC Anisocytosis 54 74.07 76.50Poikilocytosis 31 83.87Microcytosis 7 71.43Macrocytosis 2 50.00Hypochromasia 3 100.00Polychromasia 35 80.00Echinocytes (burr cells) 19 89.47Dacrocytes (teardrops) 16 81.25Spherocytes 6 66.67Target cells 2 50.00Acanthocytes 1 100.00Ovalocytes 28 71.43Schistocytes 5 80.00Stomatocytes 2 0.00Howell-Jolly bodies 1 100.00Basophilic stipplings 5 40.00
Platelet Clumped platelets 3 66.67 87.50Platelet satellitosis 5 100.00Large platelets 8 100.00Giant platelets 8 75.00
Overall 77.12
Arch Pathol Lab Med—Vol 136, June 2012 Nextslide, an Automated Digital Imaging System—Yu et al 665
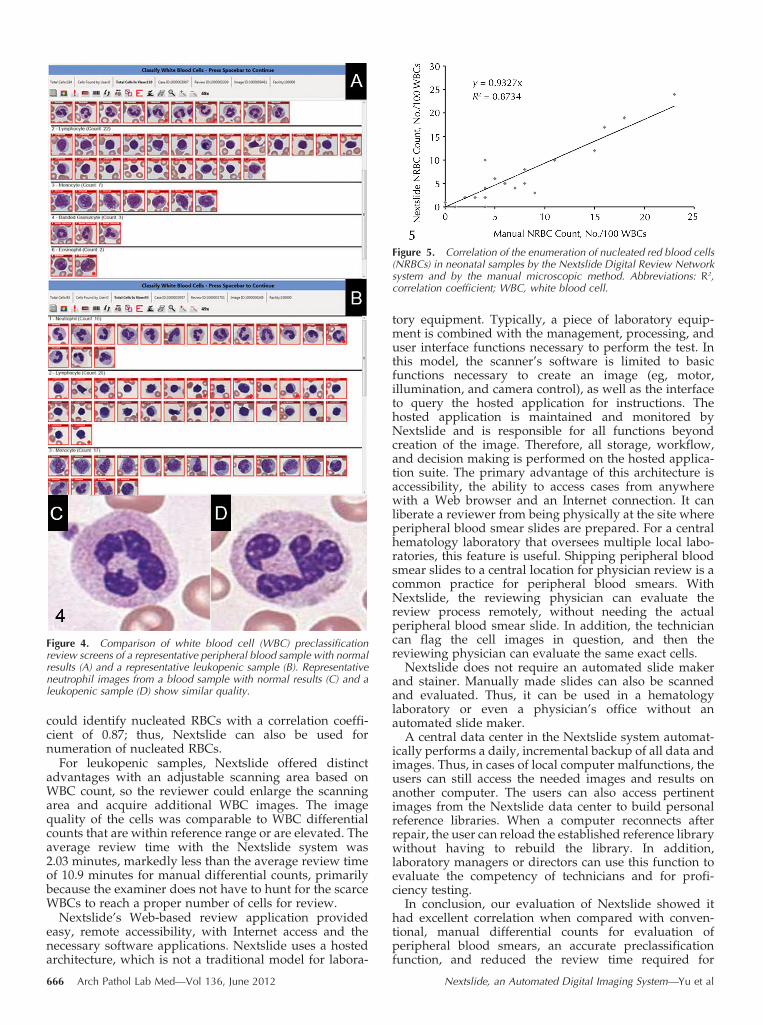
could identify nucleated RBCs with a correlation coeffi-cient of 0.87; thus, Nextslide can also be used fornumeration of nucleated RBCs.
For leukopenic samples, Nextslide offered distinctadvantages with an adjustable scanning area based onWBC count, so the reviewer could enlarge the scanningarea and acquire additional WBC images. The imagequality of the cells was comparable to WBC differentialcounts that are within reference range or are elevated. Theaverage review time with the Nextslide system was2.03 minutes, markedly less than the average review timeof 10.9 minutes for manual differential counts, primarilybecause the examiner does not have to hunt for the scarceWBCs to reach a proper number of cells for review.
Nextslide’s Web-based review application providedeasy, remote accessibility, with Internet access and thenecessary software applications. Nextslide uses a hostedarchitecture, which is not a traditional model for labora-
tory equipment. Typically, a piece of laboratory equip-ment is combined with the management, processing, anduser interface functions necessary to perform the test. Inthis model, the scanner’s software is limited to basicfunctions necessary to create an image (eg, motor,illumination, and camera control), as well as the interfaceto query the hosted application for instructions. Thehosted application is maintained and monitored byNextslide and is responsible for all functions beyondcreation of the image. Therefore, all storage, workflow,and decision making is performed on the hosted applica-tion suite. The primary advantage of this architecture isaccessibility, the ability to access cases from anywherewith a Web browser and an Internet connection. It canliberate a reviewer from being physically at the site whereperipheral blood smear slides are prepared. For a centralhematology laboratory that oversees multiple local labo-ratories, this feature is useful. Shipping peripheral bloodsmear slides to a central location for physician review is acommon practice for peripheral blood smears. WithNextslide, the reviewing physician can evaluate thereview process remotely, without needing the actualperipheral blood smear slide. In addition, the techniciancan flag the cell images in question, and then thereviewing physician can evaluate the same exact cells.
Nextslide does not require an automated slide makerand stainer. Manually made slides can also be scannedand evaluated. Thus, it can be used in a hematologylaboratory or even a physician’s office without anautomated slide maker.
A central data center in the Nextslide system automat-ically performs a daily, incremental backup of all data andimages. Thus, in cases of local computer malfunctions, theusers can still access the needed images and results onanother computer. The users can also access pertinentimages from the Nextslide data center to build personalreference libraries. When a computer reconnects afterrepair, the user can reload the established reference librarywithout having to rebuild the library. In addition,laboratory managers or directors can use this function toevaluate the competency of technicians and for profi-ciency testing.
In conclusion, our evaluation of Nextslide showed ithad excellent correlation when compared with conven-tional, manual differential counts for evaluation ofperipheral blood smears, an accurate preclassificationfunction, and reduced the review time required for
Figure 4. Comparison of white blood cell (WBC) preclassificationreview screens of a representative peripheral blood sample with normalresults (A) and a representative leukopenic sample (B). Representativeneutrophil images from a blood sample with normal results (C) and aleukopenic sample (D) show similar quality.
Figure 5. Correlation of the enumeration of nucleated red blood cells(NRBCs) in neonatal samples by the Nextslide Digital Review Networksystem and by the manual microscopic method. Abbreviations: R2,correlation coefficient; WBC, white blood cell.
666 Arch Pathol Lab Med—Vol 136, June 2012 Nextslide, an Automated Digital Imaging System—Yu et al

leukopenic samples. The system provided distinct oper-ational advantages. We found the Nextslide DigitalReview Network to be a good option for the hematologylaboratory in need of an automated digital imaging systembecause it improved workflow and efficiency and reducedturnaround time.
References
1. Bell A. Morphology of human blood and marrow cells: hematopoiesis. In:Harmening DM, ed. Clinical Hematology and Fundamentals of Hemostasis. 4thed. Philadelphia, PA: FA Davis Co; 2002:2.
2. Perkins SL. Examination of the blood and bone marrow. In: Lee GR, FoersterJ, Lukens J, et al, eds. Wintrobe’s Clinical Hematology. 10th ed. Philadelphia, PA:Lea & Febiger; 1998:9–10, 19–22, 27.
3. Felgar RE, Ryan DH. Automated analysis of blood cells. In: Hoffman R,Benz E, Shattil S, et al, eds. Hematology: Basic Principles and Practice. 4th ed.Philadelphia, PA: Elsevier Inc; 2005:2673–2686.
4. Rumke CL. Impression of ratio-derived differential leukocyte counts. BloodCells. 1985;11(2):311–315.
5. Prewitt JM, Mendelsohn ML. The analysis of cell images. Ann N Y Acad Sci.1966;128(3):1035–1053.
6. Tatsumi N, Pierre RV. Automated image processing: past, present, andfuture of blood cell morphology identification. Clin Lab Med. 2002;22(1):299–315.
7. Ceelie H, Dinkelaar RB, van Gelder W. Examination of peripheral bloodfilms using automated microscopy: evaluation of Diffmaster Octavia andCellaVision DM96. J Clin Pathol. 2007;60(1):72–79.
8. Cornet E, Perol JP, Troussard X. Performance evaluation and relevance ofthe CellaVision DM96 system in routine analysis and in patients with malignanthematological diseases. Int J Lab Hematol. 2008;30(6):536–542.
9. Briggs C, Longair I, Slavik M, et al. Can automated blood film analysisreplace the manual differential?: an evaluation of the CellaVision DM96automated image analysis system. Int J Lab Hem. 2009;31(1):48–60.
10. Koepke JA, Van Assendelft OW, Brindza LJ, et al. Reference Leukocyte(WBC) Differential Count (Proportional) and Evaluation of Instrument Methods.Vol 27, no 4. 2nd ed. Wayne, PA: Clinical and Laboratory Standards Institute;2007. CLSI Reference Method Approved Standard document H20-A2.
Figure 6. Correlation of white blood cell (WBC) classification by the Nextslide Digital Review Network and the CellaVision (DM 96) systems.Correlation of neutrophils (A), lymphocytes (B), monocytes (C), eosinophils (D), basophils (E), atypical lymphocytes (F), blasts (G), immaturegranulocytes (the sum of promyelocytes, myelocytes, and metamyelocytes) (H), and bands (I) between the 2 methods. Abbreviation: R2,correlation coefficient.
Arch Pathol Lab Med—Vol 136, June 2012 Nextslide, an Automated Digital Imaging System—Yu et al 667


![Mycology - Dr. Hashemi.ppt - iacld.ir · A yeastA yeast--like dematiaceus fungus, ... Erythrasma Definition: ... Mycology - Dr. Hashemi.ppt [Compatibility Mode] Author: bathaei](https://img.pdfslide.net/doc/110x75/5ad803fa7f8b9ab8378cd5eb/mycology-dr-iacldir-yeasta-yeast-like-dematiaceus-fungus-erythrasma.jpg)