Embed Size (px)
Citation preview

Journal of Chromatography A, 1015 (2003) 163–184
Evaluation of analyte protectants to improve gaschromatographic analysis of pesticides�
Michelangelo Anastassiades1, Katerina Maštovská, Steven J. Lehotay∗
US Department of Agriculture, Agricultural Research Service, Eastern Regional Research Center,600 East Mermaid Lane; Wyndmoor, PA 19038, USA
Received 9 August 2002; received in revised form 3 February 2003; accepted 4 February 2003
Abstract
A common problem in gas chromatography (GC) applications is the analyte losses and/or peak tailing due to undesired inter-actions with active sites in the inlet and column. Analytes that give poor peak shapes or degrade have higher detection limits, aremore difficult to identify and integrate, and are more prone to interferences than stable analytes that give narrow peaks. For sus-ceptible analytes, significant peak quality improvements are obtained when matrix components are present because they fill activesites, thus reducing analyte interactions. This phenomenon is called “matrix-induced chromatographic response enhancement.”Several approaches have been proposed to minimize peak distortion phenomena and compensate for matrix-induced effects,which is especially important for accurate quantitation, but each approach has serious limitations for routine multi-pesticideanalysis. In this study, we demonstrate the feasibility of using “analyte protectants” to provide a more convenient and effectivesolution to the problem than other approaches developed thus far. The protecting agents are added to extracts and matrix-freestandards alike to provide the chromatographic enhancement effect even for the most susceptible analytes in a very dirty GCsystem. In this study, we evaluated 93 different compounds to find the most suitable ones for improving chromatographic qualityof the signal. Because hydrogen bonding has been shown to be an important factor in analyte interactions with active sites,we mainly focused on additives with strong hydrogen bonding capabilities. Dramatic peak enhancements were achieved usingcompounds containing multiple hydroxy groups, such as sugars and sugar derivatives, and gulonolactone appears to be the mosteffective protecting agent for the most pesticides that we tested. The benefits of using analyte protectants versus alternativeprocedures for overcoming matrix-induced effects in quantitation include: (a) simpler procedure; (b) easier integration of peaks;(c) lower detection limits; (d) better quantitation; (e) less maintenance of the GC inlet; and (e) lower cost. However, long-terminfluences on the performance of the chromatographic system have yet to be established.© 2003 Elsevier B.V. All rights reserved.
Keyword: Pesticides
� Presented at the 4th European Pesticide Workshop (EPRW 2002), Rome, 28–31 May 2002.∗ Corresponding author. Tel.:+1-215-233-6433; fax:+1-215-233-6642.E-mail address: [email protected] (S.J. Lehotay).1 Present address: Chemisches und Veterinäruntersuchungsamt Stuttgart, Schaflandstrasse 3/2, 70736 Fellbach, Germany.
0021-9673/$ – see front matter © 2003 Elsevier B.V. All rights reserved.doi:10.1016/S0021-9673(03)01208-1

164 M. Anastassiades et al. / J. Chromatogr. A 1015 (2003) 163–184
1. Introduction
In pesticide residue analysis using gas chromatog-raphy (GC), the quantitation of certain importantpesticides is adversely affected by a phenomenoncommonly known as the “matrix-induced chromato-graphic response enhancement effect,” which has beena subject of many studies in the last decade[1–16].This effect is noted by improved chromatographicpeak intensity and shape of affected compounds whenthey are injected in the presence of a complex ma-trix. When no matrix is present, poor peaks with lowresponse result for the susceptible analytes. The ac-cepted explanation is that matrix components maskactive sites in the GC system, which leads to fewerof these sites being available to interact with ana-lytes, thus leading to fewer losses and better peakshapes. The matrix-induced enhancement effect hadbeen apparent for many years, particularly in the GCanalysis of certain types of pesticides, but it was notuntil 1993 that Erney et al. gave the effect its nameand proposed an explanation for its cause[1].
A variety of factors are involved in matrix-inducedenhancement, which include: (1) number and type ofactive sites in the inlet and GC column; (2) chemicalstructure (hydrogen bonding character and thermola-bility) of the analytes; (3) analyte concentration; (4)injection temperature; (5) interaction time (a functionof flow rate, pressure, injection volume, solvent ex-pansion volume, column diameter, and retention time);and of course (6) the matrix type and concentration.Among these factors, the analyte and its concentra-tion cannot be altered, but attempts have been madeto reduce or eliminate the effect by varying each ofthe other aspects, mainly by addressing the injectionprocess, as described below.
Accurate quantitation in the analysis of susceptibleanalytes depends on consistent compensation for thematrix-induced enhancement effect and/or overcom-ing it altogether. Ideally, the root cause of the effect(silanols, metal ions, and other active sites on surfacesin the GC system) would be eliminated to solve theproblem. However, it is virtually impossible to makea suitably inert, inexpensive, and heat-tolerant surfacefor GC analysis to avoid this problem. Even the moststable column phase polymers break down over timeat hot temperature which generates surface activity. Inany event, nonvolatile matrix components will build
up on potentially inert surfaces after repeated injec-tions and form new active sites that pose the sameproblem. This is the reason that priming of the GCsystem with matrix is only a short-lived and usuallyineffective remedy, which also increases the need forGC maintenance over time.
The use of cold, on-column injection is anotherpossible approach to reduce the matrix-induced en-hancement effect, but on-column techniques lead tomore maintenance of the column and are impracticalfor routine applications of complex matrices. Pro-grammable temperature vaporization (PTV) injectionis generally preferred over on-column techniques, butthis involves the use of a liner as in classical injectiontechniques. Pulsed-splitless injection works well toreduce residence time and minimize solvent expan-sion volume, but this approach can force nonvolatilematrix components farther into the column than de-sirable [8]. Furthermore, all of these injection tech-niques only reduce the effect and do not eliminate it[8,11,16].
Extensive cleanup of the extracts is an approachthat could work in theory to eliminate the matrixcomponents that cause the effect, but it is untenablein practice due to the wide polarity range of the pes-ticide analytes in multiclass, multiresidue methodsand complexity of the matrices[7]. Moreover, thematrix-induced enhancement effect gives larger andhigher quality peaks, thus it would serve the analysisbetter to take advantage of this phenomenon ratherthan eliminate it.
Since the source of the matrix-induced enhance-ment effect is not likely to be eliminated, the otherways to avoid its problems are to compensate for it.The method of standard additions may improve quan-titation of susceptible compounds in matrix, but thisapproach requires much extra effort and still leads toinaccuracies because the matrix effect is concentrationdependent. The use of deuterated internal standardsfor each pesticide susceptible to the effect wouldsolve the problem, but such standards are not gener-ally available, and would be prohibitively expensive ifthey were. Further limitations with using isotopicallylabeled internal standards are the restriction in the useof detection techniques other than mass spectrom-etry (MS) and the additional burden of developinganalytical conditions for so many more compounds.The use of a matrix-induced enhancement calculation

M. Anastassiades et al. / J. Chromatogr. A 1015 (2003) 163–184 165
factor to compensate for the effect during the cal-culation of results is not acceptable because theeffect is too variable and the notion of using sucha “fudge factor” is objectionable to most analyticalchemists.
The most widely used approach to account for thephenomenon is the use of matrix-matched standard-ization [3]. This involves the preparation of calibra-tion standards in blank extracts to provide the sameamount of matrix-induced enhancement as in the sam-ple extracts. This procedure works reasonably well,but the disadvantages include: need for enough blankmatrix (ideally exactly the same as the samples) andits long-term storage; extra time, labor, and expensefor preparing the blank extracts for calibration stan-dards; greater amount of matrix material injected ontothe column in a sequence which leads to greater GCmaintenance; and greater potential for analyte degra-dation in the matrix solution.
In routine laboratories, the need for matrix-matchingstandardization creates a heavy burden. In a sequenceof samples, there may be several different types ofsample extracts, and it is too onerous for the analyststo prepare matrix-matched standards for each com-modity. Therefore, routine monitoring laboratoriesoften take short-cuts in their matrix-matching proce-dures by using blanks for one commodity to substitutefor another. This procedure is more convenient, butit can lead to inaccuracies because the degree of thematrix-induced enhancement is commodity depen-dent (and sometimes sample dependent of the samematrix).
Another problem with the use of matrix-matchedstandards is that the two most prominent federalregulatory agencies in the US, the EnvironmentalProtection Agency (EPA) and Food and Drug Admin-istration (FDA), do not permit their use for enforce-ment purposes involving pesticide residues in food.These policies are in place because matrix-matchingcan be manipulated by unscrupulous or ill-informedanalysts to give the desired results in an analysis. Ofcourse,not using matrix-matched standards is wellestablished to provide erroneously high results, so thepolicy ignores the reality of the problem. In Europe,the regulatory guidelines for pesticide analysis callfor the use of matrix-matched standards unless ma-trix effects are demonstrated not to affect the signal[17]. For susceptible pesticides, such as methami-
dophos, acephate, omethoate, monocrotophos, andmany others, the true concentrations and recover-ies in the GC analysis are suspect unless matrixeffects are taken into account. If standards in sol-vents are used as EPA and FDA policies infer, thencalculated results for the susceptible pesticides areover-estimated.
EPA and FDA policies for pesticide analysis do notprohibit the use of additives to the extracts to overcomeor generate the effect consistently. With this in mind,Erney and Poole studied compound additives to min-imize the matrix-induced chromatographic responseenhancement[2]. However, they only studied eightdifferent “masking reagents,” and none gave a suitableeffect for the purpose of pesticide residue analysis.Their conclusion was “that because of the wide rangeof physical and chemical properties of pesticides andtheir matrices that are possible, it is unlikely that anysingle compound exists which is able to totally resolvethe matrix-induced chromatographic response effect”[2].
In this study, we have revisited this concept andtested a larger number and wider variety of com-pounds that we have termed “analyte protectants.”In a previous study concerning the development ofthe quick, easy, cheap, effective, rugged, and safe(QuEChERS) method for pesticides[18], we notedthat the matrix-induced enhancement effect was sig-nificantly reduced after the dispersive-solid-phase ex-traction (dispersive-SPE) cleanup step using primarysecondary amine (PSA) sorbent. We realized that if thetypes of compounds that protected the analytes fromdetrimental interactions could be added to the solu-tion, and if these analyte protectants did not interferein the analysis, then the approach could be very useful.
The aim of this study was to evaluate a varietyof different additives that could be employed as an-alyte protectants in the GC analysis of susceptiblepesticides and to demonstrate the effectiveness ofthese agents for improving the quality of the anal-ysis. Furthermore, we wanted to develop a simpleand inexpensive procedure that does not violate EPAand FDA guidelines for enforcement purposes andstill provide accurate quantitation in the analysis ofdifficult GC-amenable pesticides. Additionally, wesought to further elucidate the mechanisms behind thematrix-induced chromatographic response enhance-ment effect.
166 M. Anastassiades et al. / J. Chromatogr. A 1015 (2003) 163–184
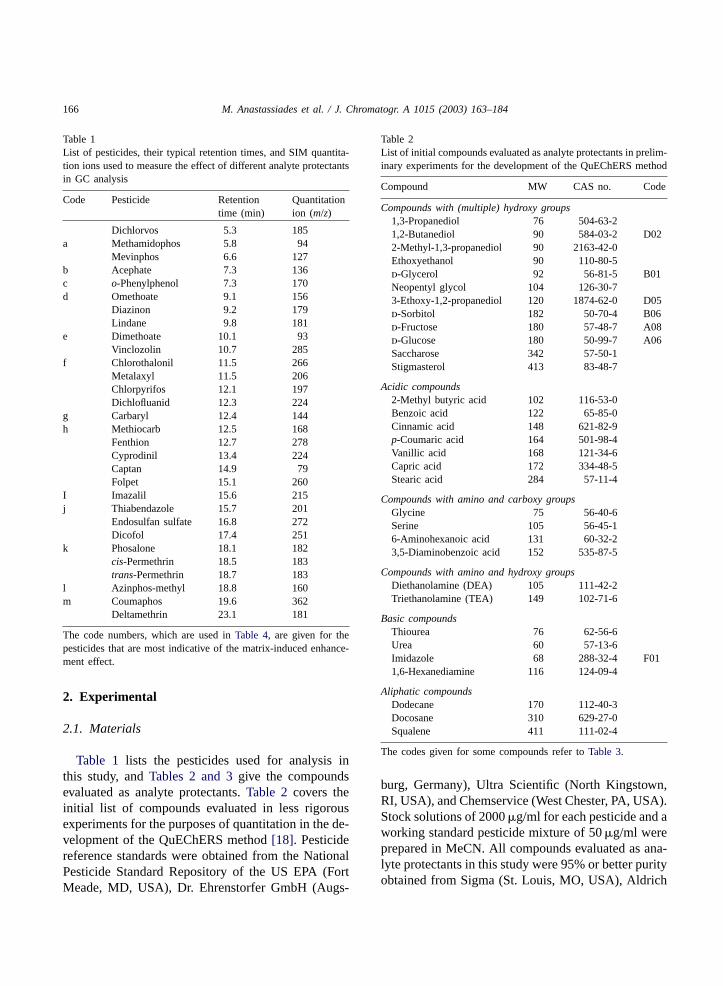
Table 1List of pesticides, their typical retention times, and SIM quantita-tion ions used to measure the effect of different analyte protectantsin GC analysis
Code Pesticide Retentiontime (min)
Quantitationion (m/z)
Dichlorvos 5.3 185a Methamidophos 5.8 94
Mevinphos 6.6 127b Acephate 7.3 136c o-Phenylphenol 7.3 170d Omethoate 9.1 156
Diazinon 9.2 179Lindane 9.8 181
e Dimethoate 10.1 93Vinclozolin 10.7 285
f Chlorothalonil 11.5 266Metalaxyl 11.5 206Chlorpyrifos 12.1 197Dichlofluanid 12.3 224
g Carbaryl 12.4 144h Methiocarb 12.5 168
Fenthion 12.7 278Cyprodinil 13.4 224Captan 14.9 79Folpet 15.1 260
I Imazalil 15.6 215j Thiabendazole 15.7 201
Endosulfan sulfate 16.8 272Dicofol 17.4 251
k Phosalone 18.1 182cis-Permethrin 18.5 183trans-Permethrin 18.7 183
l Azinphos-methyl 18.8 160m Coumaphos 19.6 362
Deltamethrin 23.1 181
The code numbers, which are used inTable 4, are given for thepesticides that are most indicative of the matrix-induced enhance-ment effect.
2. Experimental
2.1. Materials
Table 1 lists the pesticides used for analysis inthis study, andTables 2 and 3give the compoundsevaluated as analyte protectants.Table 2 covers theinitial list of compounds evaluated in less rigorousexperiments for the purposes of quantitation in the de-velopment of the QuEChERS method[18]. Pesticidereference standards were obtained from the NationalPesticide Standard Repository of the US EPA (FortMeade, MD, USA), Dr. Ehrenstorfer GmbH (Augs-
Table 2List of initial compounds evaluated as analyte protectants in prelim-inary experiments for the development of the QuEChERS method
Compound MW CAS no. Code
Compounds with (multiple) hydroxy groups1,3-Propanediol 76 504-63-21,2-Butanediol 90 584-03-2 D022-Methyl-1,3-propanediol 90 2163-42-0Ethoxyethanol 90 110-80-5d-Glycerol 92 56-81-5 B01Neopentyl glycol 104 126-30-73-Ethoxy-1,2-propanediol 120 1874-62-0 D05d-Sorbitol 182 50-70-4 B06d-Fructose 180 57-48-7 A08d-Glucose 180 50-99-7 A06Saccharose 342 57-50-1Stigmasterol 413 83-48-7
Acidic compounds2-Methyl butyric acid 102 116-53-0Benzoic acid 122 65-85-0Cinnamic acid 148 621-82-9p-Coumaric acid 164 501-98-4Vanillic acid 168 121-34-6Capric acid 172 334-48-5Stearic acid 284 57-11-4
Compounds with amino and carboxy groupsGlycine 75 56-40-6Serine 105 56-45-16-Aminohexanoic acid 131 60-32-23,5-Diaminobenzoic acid 152 535-87-5
Compounds with amino and hydroxy groupsDiethanolamine (DEA) 105 111-42-2Triethanolamine (TEA) 149 102-71-6
Basic compoundsThiourea 76 62-56-6Urea 60 57-13-6Imidazole 68 288-32-4 F011,6-Hexanediamine 116 124-09-4
Aliphatic compoundsDodecane 170 112-40-3Docosane 310 629-27-0Squalene 411 111-02-4
The codes given for some compounds refer toTable 3.
burg, Germany), Ultra Scientific (North Kingstown,RI, USA), and Chemservice (West Chester, PA, USA).Stock solutions of 2000�g/ml for each pesticide and aworking standard pesticide mixture of 50�g/ml wereprepared in MeCN. All compounds evaluated as ana-lyte protectants in this study were 95% or better purityobtained from Sigma (St. Louis, MO, USA), Aldrich

M. Anastassiades et al. / J. Chromatogr. A 1015 (2003) 163–184 167
Table 3List of compounds evaluated as analyte protectants in the study categorized into different chemical classes
Code Compound name CAS no. %Water
Group A: SugarsA01 d-Ribose 50-69-1 2A02 d-Arabinose 28697-53-2 9A03 l-Arabinose 87-72-9 3A04 d-Xylose 58-86-6 2A05 d-Lyxose 1114-34-7 2A06 d-Glucose 50-99-7 10A07 d-Galactose 59-23-4 5A08 d-Fructose 57-48-7 4A09 l-Sorbose 87-79-6 8
Group B: Sugar alcoholsB01 d-Glycerol 56-81-5 2B02 meso-Erythritol (1,2,3,4-butanetetraol) 149-32-6 2B03 1,4-Anhydroerythritol (tetrahydro-3,4-furandiol) 4358-64-9 –B04 Ribitol (adonitol) 488-81-3 2B05 Xylitol 87-99-0 2B06 d-Sorbitol (d-glucitol) 50-70-4 6B07 d-Mannitol 69-65-8 3B08 d-Galactitol (d-dulcitol) 608-66-2 14B09 myo-Inositol 87-89-8 25B10 Quebrachitol 642-38-6 11
Group C: Other sugar derivativesC01 2-Deoxy-d-ribose 533-67-5 2C02 1,6-Anhydro-�-d-glucopyranose 498-07-7 1C03 1-O-Methyl-�-l-arabinopyranoside 3795-69-5 3C04 1-O-Methyl-�-d-xylopyranoside 612-05-5 2C05 1-O-Methyl-�-d-glucopyranoside 97-30-3 2C06 4,6-O-Ethylidene-�-d-glucopyranose 13224-99-2 2C07 1,2-O-Isopropylidene-�-d-glucofuranose 18549-40-1 2C08 d-Ribonic acid�-lactone 5336-08-3 –C09 d-Gluconic acid�-lactone 90-80-2 2C10 l-Gulonic acid�-lactone 1128-23-0 2
Group D: DiolsD01 2,3-Butanediol 513-85-9 –D02 1,2-Butanediol 584-03-2 –D03 1,2,4-Butanetriol 3068-00-6 –D04 3-Methoxy-1,2-propanediol 623-39-2 –D05 3-Ethoxy-1,2-propanediol 1874-62-0 –D06 3-Allyloxy-1,2-propanediol 123-34-2 –D07 (R)-3-Benzyloxy-1,2-propanediol 56552-80-8 –D08 Monomyristin 589-68-4 –D09 1,6-Hexanediol 629-11-8 –D10 1,9-Nonanediol 3937-56-2 –D11 Pentaerythritol (2,2-bis(hydroxymethyl)-1,3-propanediol) 115-77-5 –
Group E: Poly-ethersE01 Diethylene glycol 111-46-6 –E02 Diethylene glycol monomethyl ether 111-77-3 –E03 Diethylene glycol dimethyl ether 111-96-6 –E04 Diethylene glycol diethyl ether 112-36-7 –E05 Diethylene glycol monohexyl ether 112-59-4 –E06 Diethylene glycol stearyl ether (Brij 72) 9005-00-9 –

168 M. Anastassiades et al. / J. Chromatogr. A 1015 (2003) 163–184
Table 3 (Continued )
Code Compound name CAS no. %Water
E07 Diethylene glycol oleyl ether (Brij 92) 9004-98-2 –E08 Triethylene glycol 112-27-6 –E09 Triethylene glycol dimethyl ether 112-49-2 –E10 Tetraethylene glycol 112-60-7 –E11 Tetraethylene glycol dimethyl ether 143-24-8 –E12 PEG (polyethylene glycol) 300 25322-68-3 –E13 18-Crown-6 (1,4,7,10,13,16-hexaoxacyclooctadecane) 17455-13-9 –E14 Triglycerol 20411-31-8 1
Group F: Basic compoundsF01 Imidazole 288-32-4 –F02 2-Thiouracil 156-82-1 1F03 Caffeine 58-08-2 2F04 Albendazole 54965-21-8 –F05 Thiabendazole 148-79-8 –F06 Imazalil 35554-44-0 –
Group G: MiscellaneousG01 5-(Hydroxymethyl)-2-furaldehyde (HMF) 67-47-0 0.25G02 N-Glycylglycine 556-50-3 25G03 Diacetin 102-62-5 –G04 Triacetin 102-76-1 –G05 Benzoin 119-53-9 –G06 Propyl gallate 121-79-9 2G07 Cyclamic acid 100-88-9 0.5G08 Acesulfame K 55589-62-3 1
The percent water column indicates the amount of water needed to dissolve the compound to make a 1 mg/ml concentration in MeCNsolution.
(Milwaukee, WI, USA), Fisher (Fair Lawn, NJ, USA),Fluka (Buchs, Germany), or other source. Workingsolutions of≈10 mg/ml were prepared of each po-tential protecting agent in MeCN or MeCN:watersolutions (known amounts of water were added to theMeCN solution which was sonicated until the com-pound dissolved). Anhydrous MgSO4 and NaCl wereobtained from Aldrich. The MgSO4 was heated for5 h at 500◦C in a muffle furnace to remove phthalates.Primary secondary amine sorbent was obtained fromVarian (Harbor City, CA, USA); fruit and vegetablesamples were obtained from local organic food stores.For the screening evaluation experiments, analyteprotectant solutions typically of 10 mg/ml (in MeCNor MeCN:water) were added to pesticide standardsin MeCN to yield final concentrations of 1�g/mlfor pesticides and 1 mg/ml for protecting agents. Thepercentage of water present in the final pesticide stan-dard solutions after adding the potential protectingagents is given inTable 3. In a few cases, other pro-
tectant and pesticide concentrations were evaluatedfor the more promising analyte protectants, and fruitand vegetable matrix extracts were also used in someexperiments.
2.2. Sample preparation
The QuEChERS method which was used to prepareextracts is presented elsewhere[18], but in brief, theprocedure entails: (1) weigh 10 g previously choppedsample into a 40 ml Teflon centrifuge tube; (2) add10 ml MeCN and shake the sample vigorously for1 min using a vortex mixer; (3) add 4 g MgSO4 and 1 gNaCl and vortex immediately for 1 min; (4) centrifugethe extracts for≈3 min at 5000 rpm; (5) transfer a 1 mlaliquot of the upper layer into a 2 ml micro-centrifugevial containing 25 mg PSA and 150 mg MgSO4;(6) vortex for 30 s and centrifuge the extracts for≈1 min at 5000 rpm; (7) transfer 0.5 ml of the ex-tract into an autosampler vial for GC/MS analysis.
M. Anastassiades et al. / J. Chromatogr. A 1015 (2003) 163–184 169
Analyte protectants were added or not depending onthe experiment being conducted.
2.3. Analysis
All analyses were conducted with a Hewlett-Packard(Agilent; Little Falls, DE, USA) Model 5890 SeriesII Plus GC coupled to a 5972 mass selective detector.The system was equipped with a split/splitless injec-tion inlet, electronic pressure control, and a 7673Aautosampler; Chemstation software was used forinstrument control and data analysis. The chromato-graphic conditions were: DB-35ms (Agilent; Folsom,CA, USA) capillary column of 30 m, 0.25 mm i.d.,0.25�m film thickness, He constant flow of 1 ml/min,inlet temperature 250◦C, injection volume 1�l (split-less), MS transfer line temperature 290◦C, temper-ature program of 95◦C for 1.5 min, then 20◦C/minramp to 190◦C followed by a 5◦C/min ramp to 230◦Cand a 25◦C ramp to 290 (held for 20 min). Total runtime was 36.65 min. Full scan analysis (40–450m/z)was used in experiments to determine the chromato-graphic and MS traits of the different compoundsand selected ion monitoring (SIM) mode was used tomeasure the effect of the potential analyte protectantson the intensity and quality of the pesticide peaks.Table 1gives typical retention times (tR) and quanti-tation ions for the pesticides on the DB-35ms column.In follow-up experiments, the same GC method wasalso used with a 30 m, 0.25 mm i.d., 0.25�m filmthickness Rtx-5ms column (Restek; Bellefonte, PA,USA), and the SIM program was modified slightlyto account for the small retention time differences. Itshould be noted that the GC inlet and columns werepoorly maintained on purpose to better ascertain andshow the effects of the analyte protectants.
3. Results and discussion
3.1. Features of analyte protectants
The main factors to consider in the search for agood analyte protecting agent (or combination ofprotectants) include: (1) hydrogen bonding ability;(2) volatility; and (3) practical aspects. The primaryconsideration is that the protecting agent(s) must givea strong matrix-induced enhancement effect. Previous
observations have indicated that hydrogen bonding isa key factor in the phenomenon. Indeed, pesticideswith hydroxy (–OH) and amino (R–NH–) groups,imidazoles and benzimidazoles (–N=), carbamates(–O–CO–NH–), urea derivatives (–NH–CO–NH–)and several organophosphate compounds (–P=O) arethe most susceptible type of analytes to the effect[1–8]. These types of molecules interact with silanolgroups and possibly metal ions on glass surfaces(liners, glass wool, etc.) as seen by the greater en-hancement effect when nonsilanized glass is used ver-sus deactivated surfaces. Moreover, cleanup of fruitand vegetable extracts with PSA sorbent resulted inincreased tailing and degradation rates of target ana-lytes during GC/MS, obviously due to the removal ofcompounds that provide good protection and peak en-hancement[18]. In our QuEChERS experiments, wenoticed that various organic acids (such as phenolicand fatty acids) and carbohydrates (such as fructose)were among the most prominent compounds removed.PSA contains primary and secondary amine groupsand thus has the ability to interact via hydrogen bond-ing (and ionic interactions) which further supports theimportance of hydrogen bonding in the effect. Effec-tive analyte protecting agents are therefore likely toneed multiple hydroxy and/or amino groups to be ableto interact with active sites via hydrogen bonding.
Ideally, a low concentration of analyte protectantsshould give the full response enhancement effect, butthis will depend on the number of active sites in the GCsystem to be filled and the affinity of the agents to thesesites. Furthermore, the protecting agent must be fillingthe active sites in the liner and column at the sametime that the pesticide of interest is most susceptibleto interactions with these active sites. This means thatvolatility of the analyte protectant(s) should be similarto that of the analyte(s) being protected. Thus, for awide range of analytes, the protecting agent(s) mustalso cover a wide volatility range.
Practical features of an ideal protecting agent forspecific and general purposes include: (a) it should beunreactive with analytes in solution or the GC systemand not induce degradation; (b) it should not deterio-rate performance of the GC column or detector; (c) itshould not interfere in the detection (thus it must havelow intensity, low mass ions in its MS spectra); (d)it should not accumulate in the GC injector or else-where in the system; (e) it should be widely available,

170 M. Anastassiades et al. / J. Chromatogr. A 1015 (2003) 163–184
inexpensive, and non-hazardous; and of course (f) itmust be soluble in the solvent of interest. Given thefact that the most effective agent(s) will most likelypossess multiple polar groups, relatively polar solventssuch as MeCN, which are miscible with water, seemto be more appropriate. However, in order to avoidadverse chromatographic effects, not too much wa-ter co-solvent should be needed to achieve sufficientsolubility of the protectant.
3.2. Initial investigations
In exploratory experiments, an initial list of 32compounds was evaluated, andTable 2 lists thepotential protectants divided into six groups: (1) com-pounds with multiple hydroxy groups (including sug-ars and sugar alcohols); (2) acidic compounds withcarboxy groups (including fatty and phenolic acids);(3) amphoteric compounds with carboxy and aminogroups (including amino acids); (4) compounds withamino and hydroxy groups; (5) basic compounds; and(6) aliphatic compounds.
Each pesticide/compound pair was evaluated interms of peak heights, areas, retention times, andpossible interferences in order to measure and com-pare the effects of the different prospective analyteprotectants. Most agents were used at a concentrationof 1 mg/ml, but several of the most volatile com-pounds were also injected at higher concentrations upto 20 mg/ml. Observations regarding the protectiveeffect of the agents are discussed as follows.
3.2.1. Agents with (multiple) hydroxy groupsAs expected, those compounds that act as strong
hydrogen bond donors and acceptors, were the mosteffective at enhancing peak intensity and reducingthe analyte peak tailing. Some of the agents them-selves gave broadly eluting and tailing peaks, whichprotected pesticides over a broad volatility range. Themost volatile of the agents tested (1,3-propanediol,1,2-butanediol, 2-methyl-1,3-propanediol, and neo-pentyl glycol) only worked for the most volatileanalyte, dichlorvos. The slightly less volatile com-pound, 3-ethoxy-1,2-propanediol, offered excellentprotection for pesticides with short and intermedi-ate retention times, but did not work well for thelate-eluting ones. In the case of the much less volatilecompound, sorbitol, only late-eluting pesticides were
protected. Unlike sorbitol, fructose and glucose con-tain a reactive carbonyl group that causes them toreadily degrade into several products in solution andduring injection. These degradation products elutethroughout the chromatogram, which serves to pro-tect analytes over a broader volatility range. It shouldbe noted that the degradation pattern of sugars maystrongly depend on the pH of the extract. In the caseof fructose, for example, we noticed very differentGC degradation pattern, resulting in different analyteprotection properties, when acidic versus neutral so-lutions were injected. Interestingly, the multi-hydroxycompounds tested did not interfere with the detec-tion of the tested analytes, as will be discussed inSection 3.4. A disadvantage of sugars, however, is thepotential formation of caramelization products thatcan contaminate the GC system over time.
3.2.2. Acidic agentsIn the case of organic acids, the protection was
best for analytes eluting close to the agent. For exam-ple, stearic acid worked well for analytes with reten-tion times of≈13–15 min (fenthion, cyprodinil, andimazalil), which co-eluted with the broad stearic acidpeak, but it did not protect analytes that eluted ear-lier or later. Interestingly, base-sensitive analytes, suchas captan, folpet, dichlofluanid, and chlorothalonil,were effectively protected irrespective of whether theyco-eluted with the acidic agents or not. Later experi-ments determined that the source of this “protection”was the lower pH provided by the acidic agents whichminimized degradation of the base-sensitive pesticidesin solution.
3.2.3. Basic agentsIn theory, compounds with basic functions should
be very promising analyte protectants because aminogroups are well known to strongly interact with acidicsilanol groups. However, due to the higher pH of thesolution, base-sensitive pesticides were partly or en-tirely lost in the presence of the bases. As in nearlyall cases, certain analytes withtR in close proximityto the agents were protected very well.
3.2.4. Amphoteric agents with amino andcarboxy or amino and hydroxy functions
As in the case of basic agents, base-sensitive pes-ticides were negatively affected by these type of

M. Anastassiades et al. / J. Chromatogr. A 1015 (2003) 163–184 171
compounds. An exception was 3,5-diaminobenzoicacid, in which the strength of the carboxylic acidgroup is greater than the basicity of the anilinegroups. This compound gave the best protection ofthe basic pesticides, thiabendazole and imazalil. Thiscan be attributed to co-elution effects and/or theaffinity of the agent to the active sites that poten-tially interact with the basic analytes. A disadvantageof 3,5-diaminobenzoic acid is that it strongly andrapidly reacts with sugars. In an experiment where3,5-diaminobenzoic acid and fructose were added atthe same time for protection purposes, the solutionturned dark, obviously because of Maillard-type reac-tions, and many of the analytes originally containedin the solution disappeared from the chromatogram.
3.2.5. Aliphatic compoundsIn order to investigate the influence of high molec-
ular weight compounds that do not form hydrogenbonds, a few aliphatic compounds were tested. Dode-cane was included because it is frequently used as a“keeper” in pesticide residue analysis to reduce lossesof highly volatile analytes during solvent evaporationsteps. The late-eluting squalene was the only aliphaticcompound that had a positive impact on any of thepesticides, and these were the late-eluting coumaphosand deltamethrin, which importantly demonstrates thatanalyte protection can also be provided by agents thatdo not form hydrogen bonds. The proposed mecha-nism of this protection process will be discussed inSection 3.8.
Figs. 1 and 2show the degree of the effects ob-served with the co-injection of different compoundson the peak shapes and intensities of 1�g/ml each ofomethoate (code d fromTable 1) and thiabendazole(code j), two pesticides with notorious susceptibilityto the matrix-induced enhancement effect and severepeak tailing. The instrument conditions were so badthat there were almost no observable peaks for thesepesticides when standards in MeCN solvent were in-jected without the use of protectants.
As can be seen inFig. 1, 20 mg/ml of 3-ethoxy-1,2-propanediol (code D05), also known as 3-O-ethyl-glycerol, gave excellent results for omethoate (andother early-eluting pesticides not shown, such asmethamidophos, acephate, mevinphos,o-phenylphenoland carbaryl). A chromatogram of a similarly for-tified tomato extract from the QuEChERS method
Fig. 1. Effect of different analyte protectants evaluated on the peakshape and intensity of 1�g/ml omethoate.
Fig. 2. Effect of different analyte protectants evaluated on the peakshape and intensity of 1�g/ml thiabendazole.

172 M. Anastassiades et al. / J. Chromatogr. A 1015 (2003) 163–184
after dispersive-SPE cleanup with PSA is providedfor comparison. Other than 3-O-ethylglycerol at20 mg/ml, none of the other 25 compounds evalu-ated gave an enhancement effect stronger than thetomato matrix for omethoate. A high concentrationof 3-O-ethylglycerol was necessary because it did notwork as well at 1 mg/ml concentration. In general, theinjection of such a large amount of any compoundwould cause concern in capillary GC analysis, butwe assumed that volatile protecting agents, such as3-O-ethylglycerol, were not likely to contaminate theGC system.
In Fig. 2, a few of the same and other examples ofpotential analyte protectants are shown in the case ofthiabendazole. Notable observations not only pertainto the degree of tailing that occurs for the thiabenda-zole peak, but also how much thetR shifts dependingon the analyte protecting effect of the different com-pounds. The sharp peaks at≈16.8 min (endosulfansulfate) and≈17.4 min (dicofol) demonstrate how thepeak shapes andtR vary less significantly for thosepesticides not strongly affected by the matrix-inducedenhancement effect. The best enhancement for thi-abendazole was achieved with 3,5-diaminobenzoicacid.
In a separate experiment, the effect of analyte pro-tectant concentration on the degree of protection ofvarious pesticides was tested. InFig. 3, the effect of in-creasing concentrations of 3,5-diaminobenzoic acid onthiabendazole and imazalil and of 3-O-ethylglycerolon mevinphos and dichlorvos is presented. As thefigure shows, the addition of 3,5-diaminobenzoicacid significantly improved the quality of thiabenda-zole and imazalil peaks, and initially caused themto shift to shortertR. However, as the concentrationof 3,5-diaminobenzoic acid was increased, shifts tolonger tR were observed. SimilartR anomalies athigh agent concentrations also occurred for someother protectant/analyte combinations, usually whenthey co-eluted. We propose possible mechanisms toexplain these types of effects inSection 3.8. Fig. 3bshows how 20 mg/ml 3-O-ethylglycerol caused a dis-turbance in the analyte focusing process and distortedthe dichlorvos peak. The highest tested concentrationof 3-O-ethylglycerol did not adversely affect the peakshapes of other pesticides, as the figure shows in thecase of mevinphos (in which the higher concentrationled to better resolution of the two isomers).
Unfortunately, none of the 32 initial compoundsscreened was able to serve by itself as a useful analyteprotectant for all pesticide analytes evaluated. Instead,we chose a combination of 3-O-ethylglycerol and sor-bitol to achieve our objectives in the development ofthe QuEChERS method[18], andFig. 4presents howthis pair of protectants improved the quality and inten-sity of the peaks for many pesticides in the method.
In summation of the initial experiments, three mainconclusions could be made: (1) compounds with mul-tiple hydroxy groups generally provided better analyteprotection than other types of compounds; (2) volatil-ity (in terms of tR) is a critical factor and protectantsof a certain volatility better protect pesticide analytesof a similar volatility; and (3) greater concentrationof the protecting agents generally leads to a largerenhancement effect. However, our initial experimentsdid not find the ideal analyte protectant(s), and furtherexperiments were planned and conducted for a widervariety of compounds. We chose to investigate addi-tional analyte protectants in order to better understandthe mechanism of the protection process and to find amore ideal protecting agent or combination of agents.
3.3. Evaluation of 68 possible analyte protectants
As shown inTable 3, the 68 compounds for investi-gation consisted of (A) sugars; (B) sugar alcohols; (C)other sugar derivatives; (D) diols (including a triol andtetraol); (E) poly-ethers (including the mono-ether,diethylene glycol); (F) basic compounds; and (G)miscellaneous others. These were primarily selectedon the basis of the preliminary results, but also wechose some compounds that were already availablein the laboratory or those that could be ordered anddelivered quickly. A wide variety of amine-containingcompounds were not evaluated because as discussedearlier, strong bases lead to pesticide degradation insolution, which make the use of such compoundsimpractical for multiclass, multiresidue applications.The amount of water present in the final mixture toyield a 1 mg/ml solution of the compound in MeCNalso appears inTable 3.
The experimental isolation of different parametersto study matrix-induced enhancement effects and thedevelopment of a measurable approach to quantifythe results in an objective manner were challengingtasks. In our experiments, it was very easy to alter a

M. Anastassiades et al. / J. Chromatogr. A 1015 (2003) 163–184 173
Fig. 3. Impact of the agent concentration on the peak shape, intensity and retention time of various pesticides: (a) 3,5-diaminobenzoic acidin the case of thiabendazole and imazalil and (b) 3-ethoxy-1,2-propanediol in the case of dichlorvos and mevinphos (each at 0.25�g/ml).
single parameter, namely the protecting agent used,but an important uncontrollable parameter, the con-dition of the GC system, changes over time. Tocompensate for this, we placed standards in MeCNsolvent, 3-O-ethylglycerol, and sorbitol in the se-quence approximately every seven injections. GC/MSin the SIM mode was used to evaluate each pes-ticide/compound pair for a total of 110 injections.
The sequence was repeated for each potential analyteprotecting agent in full scan MS mode (scan range= 40–420m/z) to determine the potential chromato-graphic and mass spectral interferences. A 20 minbaking-out period at 290◦C was monitored at theend of each chromatographic analysis to check forlate-eluting peaks, and we checked frequently forghost peaks from previous injections. No verifiable

174 M. Anastassiades et al. / J. Chromatogr. A 1015 (2003) 163–184
Fig. 4. Improvement of peak shapes and peak areas with the helpof 10 mg/ml 3-O-ethylglycerol and 0.5 mg/ml sorbitol—GC/MS(SIM) chromatograms of a mixture of pesticides at 1�g/ml inA: matrix extracts+ analyte protectants; B: matrix extracts; C:solvent + analyte protectants; and D: pesticides in solvent only.The matrix consisted of a mixture of several fruits and vegetableswhich was extracted using the QuEChERS method[18].
ghost peaks (carry-over of compounds from previousinjections) were observed for any of the compoundsevaluated. The longesttR for any significant peak inthe GC/MS analyses was 21.7 min for Brij 72 and92 (E06 and E07), which was shorter than the lastpesticide to elute (23.1 min for deltamethrin).
The evaluation to measure the effects was per-formed in a number of different ways until we de-cided on the final systematic approach. In essence, wewanted to assess the two different undesirable mech-anisms that occur during injection and analysis: (1)analyte losses due to degradation and/or irreversibleretention (mainly occurring in the GC inlet); and (2)tailing of the analyte peaks due to retention on activesites (mainly occurring on the column). The latter ef-fect could be measured from the peak height to peakarea ratio (H/A) to indicate the degree of peak tail-ing. The overall enhancement effect however couldbe better measured from peak height. To compensatefor fluctuations within the sequence, the peak heightswere normalized to the sum of the peak heights for thethree most unaffected pesticides (lindane, chlorpyri-fos, and endosulfan sulfate), which only gave 10–15%RSD for their variability in peak heights among the110 injections. Both the H/A and normalized peak
height approaches were conducted to evaluate the re-sults, but only the peak height evaluation is presentedhere.
Table 4ranks and compares most of the compoundsevaluated in this study, as listed by the code numbersgiven in Table 3and coded pesticides fromTable 1.The compounds are ordered according to overall re-sults using a ranking system based on normalized peakheight. A value between 1 and 4 was assigned foreach of 13 pesticides (codes a–m) susceptible to thematrix-induced enhancement effect with a wide rangeof retention times. A ranking of 4 meant that the com-pound induced a strong effect (among the highest ofall compounds evaluated for a particular pesticide). Aranking of 1 meant that the peak response was verypoor, even to the point of giving a lower response thanstandards in MeCN alone. Rankings of 2 and 3 werebased on splitting the signal range difference betweenthe 1 and 4 scores, and no ranking (“–”) indicateswhen an interferant occurred that did not allow inte-gration to be possible. It is important to mention, thatthe ranking does not necessarily reflect the real poten-tial of an agent to protect analytes since the effect isstrongly dependent on the concentration of the agentsand the activity of the system. Some of the sugars andderivatives tested are isomers and behaved similarlyin terms of retention times, degradation products, andenhancement effects. InTable 4, we have thereforegrouped all pentoses (codes A01–A05) and hexoses(codes A06–A09) using the average protection effectsfor ratings. For the sake of brevity, compounds thatgave a total ranking less than 22 are not listed in thetable.
As the table shows, compound C10,l-gulonic acid�-lactone (gulonolactone), gave the highest summa-tion of individual pesticide rankings among all com-pounds evaluated with a score of 50 out of a possible52 (all of the selected pesticides except methami-dophos and acephate gave rankings of 4). The othersugar lactones evaluated also gave high overall scores,and all of the sugars yielded among the highest overallscores. For comparison purposes, the initially chosenanalyte protectants for the QuEChERS method, sor-bitol (B06) and 3-ethoxy-1,2-propanediol (D05), gavesignificantly lower summation scores of 34 and 22,respectively (note that the concentration of sorbitolwas twice as high as previously and the concentra-tion of 3-O-ethylglycerol was 20-fold lower than the

M.
Anastassiades
etal.
/J.
Chrom
atogr.A
1015(2003)
163–184175
Table 4Evaluation and ranking of the compounds screened as analyte protecting agents
Code Structure MW Retention time(s) ofmajor component(s)(min)
MSbasepeak
Rating for enhancement effect onselected pesticides
a b c d e f g h i j k l m Sum
C10 178 12.1 (10.9–13.3)a 73 (5) 3 3 4 4 4 4 4 4 4 4 4 4 4 506.7 (6.6–11.1) 55 (6)16.9 (15.3–18.5) 44 (2)
C09 178 12.0 (10.8–13.3)a 73 (5) 3 2 4 3 3 4 4 4 4 4 3 4 3 456.7 (6.6–11.0) 55 (6)16.9 (15.3–18.5) 44 (2)
A01–A05 150 7.6 (7.0–8.8)a 73 (1) 4 4 3 4 4 4 4 4 2 3 3 4 2 454.9 (5.2–5.6) 43 (0)5.8 (5.6–6.2) 57 (2)6.4 (6.3–7.0) 45 (0)16.7 (15.3–18.4) 43 (4)
A06–A09 180 4.9 (4.7–5.4) 43 (0) 4 4 3 4 4 4 4 4 2 2 2 3 2 425.4 (5.3–9.0) 97 (2)7.3 (7.1–8.6) 57 (2)7.6 (7.5–8.6) 43 (1)9.1 (9.0–10.7) 43 (3)17.0 (15.8–18.6) 43 (4)
E12 300 5.1 (5.0–6.5) 45 (0) 3 2 4 1 4 2 2 3 4 4 3 4 2 387.1 (7.0–9.0) 45 (1)10.1 (10.0–12.0) 45 (1)14.1 (14.0–16.0) 45 (1)16.7 (16.6–18.5) 45 (2)18.6 (18.5–20.5) 45 (2)
C08 148 8.6 (6.9–10.8) 73 (1) 2 3 2 3 4 4 4 4 2 2 2 3 2 37

176M
.A
nastassiadeset
al./
J.C
hromatogr.
A1015
(2003)163–184
Table 4 (Continued )
Code Structure MW Retention time(s) ofmajor component(s)(min)
MSbasepeak
Rating for enhancement effect onselected pesticides
a b c d e f g h i j k l m Sum
C06 206 9.0 (8.7–10.0)a 73 (0) 2 4 3 4 4 4 4 3 2 1 1 2 1 354.9 (4.8–6.3) 45 (1)6.9 (6.7–7.1) 45 (3)7.2 (7.1–7.4) 45 (1)7.5 (7.4–8.0) 45 (4)8.2 (8.0–10.0) 45 (4)
B06 182 16.2 (12.2–18.8) 73 (3) 1 1 1 1 3 3 2 3 3 4 4 4 4 34
E07 357 7.3 (7.2–8.7) 41 (8) 1 1 2 1 3 4 2 4 4 2 3 4 3 349.0 (8.9–11.0) 55 (10)11.2 (11.1–11.9) 55 (9)12.0 (11.9–12.4) 57 (8)14.7 (14.6–15) 55 (12)15.7 (15.6–16.0) 45 (10)16.9 (16.8–17.8) 45 (10)18.7 (18.6–20.0) 45 (9)21.7 (21.6–23.0) 45 (9)
B04 152 10.9 (8.3–13.0) 74 (3) 2 1 2 1 3 3 2 3 4 4 3 3 2 33
B05 152 10.1 (7.9–12.0) 61 (2) 2 1 2 1 3 3 3 3 4 4 2 3 2 33
C01 134 6.2 (5.7–10.4)a 44 (5) 4 3 4 1 2 2 2 2 4 2 2 3 2 335.5 (5.4–5.8) 57 (1)
E14 240 16.5 (14.1–20.0)a 57 (3) 2 1 2 2 3 2 2 2 3 4 4 4 2 337.9 (7.7–10.0) 57 (6)

M.
Anastassiades
etal.
/J.
Chrom
atogr.A
1015(2003)
163–184177
B09 180 16.5 (11.7–18.8) 73 (1) 1 1 1 2 3 3 2 3 3 3 2 4 4 32
G02 132 11.0 (9.9–12.8) 114 (1) 1 1 1 1 2 3 3 4 4 4 2 2 2 30
B02 122 6.1 (6.0–10.0) 61 (1) 4 2 3 2 3 3 2 3 2 1 1 2 1 29
B07 182 16.4 (12.9–18.0) 73 (2) 2 1 2 1 2 2 1 2 3 2 3 4 4 29
G06 212 14.2 (12.3–18.2)a 153 (4) 1 1 1 1 2 3 4 4 1 3 4 1 3 2913.2 (11.8–20.0) 209 (9)
F04 265 20.0 (18.5–24.3)a 165 (12) 2 1 2 1 1 1 2 2 4 4 4 3 1 28<4.5 (<4.5–8.0) 44 (0)18.1 (17.5–18.5) 178 (9)
B10 194 11.2 (8.8–17.2) 87 (4) 1 1 1 1 3 3 2 3 4 2 2 3 1 27
B08 182 15.5 (12.6–17.8) 73 (2) 1 1 1 1 2 2 1 2 2 2 3 4 4 26
E06 359 11.4 (11.2–12.4) 43 (9) 1 1 1 1 2 3 2 2 3 2 2 3 3 2614.8 (14.7–15.8) 57 (7)16.9 (16.8–18.0) 45 (8)18.8 (18.7–19.8) 45 (8)21.7 (21.6–22.7) 45 (7)
G03 176 5.3 (<4.5–20.0) 43 (1) 2 1 2 1 2 3 2 3 2 1 2 3 2 26

178M
.A
nastassiadeset
al./
J.C
hromatogr.
A1015
(2003)163–184
Table 4 (Continued )
Code Structure MW Retention time(s) ofmajor component(s)(min)
MSbasepeak
Rating for enhancement effect onselected pesticides
a b c d e f g h i j k l m Sum
D03 106 5.1 (<4.5–8.0) 75 (1) 3 1 3 1 2 2 2 2 2 1 2 2 1 24
D07 182 7.8 (7.6–12.0) 91 (5) 2 1 4 1 2 2 2 2 2 2 1 2 1 24
F03 194 12.3 (11.8–14.2) 194 (5) 1 1 1 1 2 4 4 4 1 1 1 2 1 24
G04 218 5.8 (5.1–20.0) 43 (2) 2 1 3 1 2 3 2 2 1 1 2 2 2 24
C03 164 6.4 (5.8–11.8) 60 (0) 3 3 4 1 1 2 1 1 2 2 1 1 1 23
C04 164 6.7 (5.9–12.0) 60 (0) 4 3 4 1 2 2 1 1 1 1 1 1 1 23
D08 302 15.7 (15.3–20.0)a 43 (20) 1 1 2 1 2 2 1 1 4 – 2 3 3 2314.8 (14.4–24.0) 117 (10)
E13 264 11.5 (11.2–12.7) 45 (3) 1 1 1 1 2 4 2 4 1 1 2 2 1 23

M.
Anastassiades
etal.
/J.
Chrom
atogr.A
1015(2003)
163–184179
F02 128 12.0 (11.8–16.0) 128 (2) 1 1 1 1 2 2 4 3 2 2 1 2 1 23
G08 201 8.1 (7.7–16.3) 43 (2) 1 1 2 1 2 4 2 3 1 1 2 2 1 23
C05 194 9.2 (8.0–10.8) 60 (1) 1 2 1 2 4 2 1 1 3 1 1 2 1 22
D05 120 5.9 (5.5–10.0) 31 (1) 3 1 2 1 2 3 2 2 1 1 1 2 1 22
D11 136 7.6 (6.1–9.5) 57 (0) 1 2 2 1 3 3 2 2 1 1 1 2 1 22
E11 222 6.8 (6.7–12.2)a 59 (1) 3 1 2 1 1 2 2 2 1 1 2 2 2 225.7 (5.6–6.2) 45 (0)
G07 179 5.1 (<4.5–9.0) 56 (2) 1 1 2 – 2 3 2 3 1 1 2 2 2 22
Code refers to the list of compounds inTable 3, and the selected pesticides are marked inTable 1. The numbers assigned are based on a 4-point ranking scale in which thepeak heights (normalized to the sum of lindane, chlorpyrifos, and endosulfan sulfate) were given point values in relation to the signal (highest signals= 4). The sum of all13 values gives the overall enhancement effect for the range of most susceptible pesticides. Also given in the table are the MS base peak (in parentheses appear the numberof ions of m/z > 75 and relative abundance >10%) and retention time(s) of major component(s) (with time window that the peak appears) in the GC/MS chromatogram.
a Peak of the original compound added.

180 M. Anastassiades et al. / J. Chromatogr. A 1015 (2003) 163–184
amount used in the QuEChERS method). On the sur-face, it appears that gulonolactone could be used as thesole analyte protectant for the entire analytical rangeof pesticides, but further evaluations discussed belowlead us to believe that a combination of analyte pro-tectants still probably yield the best results.
3.4. Mass spectral interferences
To help estimate the potential of mass spectralinterferences when using the various agents, the fol-lowing indicative parameters have been included inTable 4: (1) the molecular weight (MW) of each agent;(2) the retention time ranges of all agents and/or oftheir major degradation products; and (3) the basepeaks from the mass spectra, and in parentheses thenumber of ions withm/z > 75 that exceeded 10%relative abundance of the base peak. In many cases,several peaks appeared in the chromatogram due todegradation of the analyte protectant in the hot GCsystem and/or in solution. The chromatographic peakfor the original compound added to the solution isdenoted in the table when it could be determinedthrough mass spectral library identification withNIST’98.
Interestingly, none of the most promising analyteprotectants gave interferences in the SIM analysis(identification and integration) of the 30 selected pes-ticides using a quadrupole GC/MS instrument. Thiscan be generally explained by the low mass fragmentsthat occur from the protectants, which are less likelyto interfere with the higher mass ions of pesticides.Overall, only isolated instances of interferences oc-curred for the 30 pesticides at the chosen ions in theexperiments with the 93 protecting agents (only twoinstances inTable 4). In cases when an interferenceoccurs, the generally broad, significantly tailing peakof an effective protecting agent could be easily distin-guished from analyte peaks. When feasible, differention(s) could be chosen for quantitation of the affectedanalyte. However, even if no interference occurs in theSIM mode, the identification of full-scan mass spec-tra with mass spectral libraries can still be adverselyaffected by the presence of the analyte protectants.Furthermore, we have not tested the concept on iontrap or time-of-flight instruments that may be proneto indirect MS interferences when a large co-elutionoccurs with the analyte, even though the targeted
ions can be much different from those of the largeco-elutant.
3.5. Effects of volatility
As concluded in the preliminary experiments,volatility (retention time coverage) of the protect-ing agent was an important factor in the enhance-ment effect, and the larger experiment more clearlypresents this aspect. The pesticides a–m inTable 4appear in order oftR from left to right on the page,and by looking at the individual scores, it becomesapparent how the rankings correlate fairly well ver-sus elution profile of the agents. Compounds C04(1-O-methyl-�-d-xylopyronoside), C08 (ribonolac-tone), and B06 (sorbitol) serve as examples of theeffect. From left to right, C04 gives rankings of 4, 3,4, 1, 2, 2, 1, 1, 1, 1, 1, 1, 1, which indicates how itmainly protects only the early-eluting pesticides. Inthe case of C08, the order of the rankings is 2, 3, 2,3, 4, 4, 4, 4, 2, 2, 2, 3, 2, which shows how the com-pound is very effective for pesticides with retentiontimes in the middle of the chromatogram, but not atthe beginning or end. In the case of B06, the scores 1,1, 1, 1, 3, 3, 2, 3, 3, 4, 4, 4, 4 reflect how it protectsonly late-eluting compounds. On the other hand, theelution profile for gulonolactone (C10) and its degra-dation products covers almost the entire pesticidetRrange, which was the main reason that it gave thehighest overall score.
An interesting example to show the effect of degra-dation products is the comparison between the resultfor gluconolactone (C09) and 1-O-methylgluco-pyranoside (C05), which on the surface have verysimilar structures. Dramatic differences occur in theenhancement effects on the susceptible pesticides asindicated by the ranking score of 45 for C09 and 22for C05. The reason for this large disparity is linkedto the greater stability of C05 in the solution and GCsystem. Thus, C05 generates a relatively narrow elu-tion profile centered at 9.2 min in the chromatogramand has minimal impact, whereas C09 (and all ofthe good protecting agents) breaks down into a num-ber of compounds to better mask and co-elute witha wider array of analytes of diverse volatility. Thisfurther demonstrates that masking of active sites inthe inlet is not the only factor that is involved in thematrix-induced enhancement effect.

M. Anastassiades et al. / J. Chromatogr. A 1015 (2003) 163–184 181
3.6. Effect of concentration
Concentration of the analyte protecting agents in theinjected solution is another important factor in the re-sponse enhancement effect. To achieve routine appli-cation of the analyte protection concept in real-worldpesticide analysis, a single concentration of analyteprotectant solution would be added to both standards insolvent and matrix extracts to give a consistently max-imized response to all analytes of interest. In theory,a limited number of active sites occurs in a particularGC system (liner+ column combination), and theirsaturation can be reached if enough agent is presentto mask all active sites. However, the masking effectis only temporary, and the degree of protection thatthe various analytes experience during the chromato-graphic run depends on the elution characteristics andconcentration of the agent and, of course, on the localactivity of the system.
To determine the effect of concentration, we con-ducted an experiment that measured peak heights ofthe different pesticides (at 0.5�g/ml in MeCN) withrespect to increasing concentration of gulonolactone(the best overall analyte protectant inTable 4). Fig. 5shows the results of this experiment. The GC condi-
Fig. 5. Effect of concentration of gulonolactone (C10 inTable 3) in MeCN solution on the peak height of selected pesticides at 1�g/ml(normalization was to the highest peak height for each pesticide in the series of injections).
tions were so poor that without the analyte protectingagent, no response was observed for some of the pes-ticides (that is why the 0 mg/ml bar cannot be seen fordimethoate and coumaphos). For carbaryl, thiaben-dazole, phosalone, and coumaphos (and most otherpesticides withtR > 12 min), maximized responses (aresponse plateau) were achieved at gulonolactone con-centrations exceeding≈10 mg/ml, while in the casesof fenthion ando-phenylphenol, this saturation effectwas observed at lower concentrations. Unfortunately,at gulonolactone concentrations >10 mg/ml, peaksplitting occurred for pesticides withtR < 10 min(such aso-phenylphenol and dimethoate). This had anegative impact on the peak height of these analytesand explains the absence of a response plateau in theircase inFig. 5. The peak splitting is likely a resultof droplet formation in the column due to the highercontent of water and agent in the 10 and 20 mg/mlgulonolactone solutions[19,20].
3.7. Observations about certain pesticides
The overall rankings and main conclusions becameclear when the data was compiled inTable 4, but sev-eral observations and notes were taken while all of the

182 M. Anastassiades et al. / J. Chromatogr. A 1015 (2003) 163–184
pesticide peaks were being integrated because someinteresting results for certain pesticide/compoundpairs would have been missed otherwise. For exam-ple, deltamethrin sometimes gave two peaks, but onlythe purecis-isomer was added to the solution. Someof the deltamethrin was converted to thetrans-isomereither in solution or in the GC inlet when certaincompounds were present in MeCN. This is not an un-common event for deltamethrin in pesticide analysiswith acetone and MeCN, and we are conducting fur-ther investigations to further characterize this effect.
Several of the 30 targeted pesticides were onlyslightly affected by any of the analyte protectants, if atall. Analytes that were not susceptible to the enhance-ment effect included lindane, chlorpyrifos, and endo-sulfan sulfate. For this reason, those pesticides servedas excellent internal standards to normalize the signalagainst in the evaluation of the different compoundsin the case of susceptible pesticides. Also, diazinonwas only slightly affected by the analyte protectants.
Other pesticides were unaffected in nearly all casesexcept a curious enhancement would occur in a fewspurious instances. For example, vinclozolin gave avery reproducible normalized peak height except whenco-injected with benzoin (G05), which gave a 14-foldincrease versus the solvent standard. In this case, thepeak was exceptionally narrow and tall which meansthe effect was chromatographic rather than degrada-tive. The tR also shifted from 10.74 min in MeCNalone to 10.87 min in the presence of benzoin, whichco-eluted with vinclozolin (benzointR ≈ 10.8 min).
Similar events happened for other pesticide/com-pound pairs. For instance, the co-elution of 18-crown-6ether (E13) with metalaxyl at 11.5 min increasedpeak height of metalaxyl by a factor of 2 and shiftedits tR from 11.51 to 11.57 min. Caffeine (F03,tR =11.8–14.2) gave peak height enhancement effects onseveral pesticides that eluted at approximately 12 min,which included: carbaryl (14-fold enhancement), me-thiocarb (7.7-fold) fenthion (2.5-fold), and cyprodinil(2.8-fold). Interestingly, the competition of these pes-ticides with the high concentration of caffeine caused≈7 s shifts to shortertR rather than delayed elution asin the previous examples.
Cyprodinil injected with 2-thiouracil (F02) andpropyl gallate (G06) gave three times higher peaksfor standards in analyte protectants versus standardsin MeCN alone. Propyl gallate also worked excep-
tionally well in the case of folpet (10-fold significantimprovement). Furthermore, folpet response was alsoimproved by a factor of 4 with Brij 72 and 92 (E06and E07) and the sugar lactones (C10, C09 and C08);these lactones worked very well for dicofol, too. Per-methrin in combination with sorbitol (B06), Brij 72and 92 (E06 and E07), and albendazole (F04) in-creased relative response factors by 1.8, 2.0, and 4.5times, respectively.
3.8. Possible mechanisms
In the GC analysis of pesticides and other analytesin general, the optimal intensity and quality of thepeaks relies on several facets in the process: (1) stabil-ity of the analytes in the sample solution; (2) completetransfer of the analytes from the injection port to thecolumn; (3) minimization of peak distortion duringfocusing of the analyte at the front of the column andpeak broadening (due to diffusion) during the separa-tion process; and (4) elimination of peak tailing of theanalyte due to strong interactions with the stationaryphase (primarily with silanol groups in the case of po-lar pesticides). In consideration of these factors withrespect to our results, we have postulated four mech-anisms that may contribute to the analyte protectingprocess, in respective order: (1) the use of stabilizingcompounds, such as acids, prevents the degradation ofbase-sensitive pesticides; (2) the transfer efficiency ofthe injection process is increased through the use ofmasking agents that fill the active sites in the liner andfront of the column which act to reduce irreversible ad-sorption and degradation of analytes; (3) peak broad-ening is reduced due to the decreased diffusion (in boththe gas and stationary phases) in the presence of thehighly concentrated co-eluting agent which, presum-ably, increases the viscosity of the gas phase within theelution band and competes with a substantially smalleramount of the analyte in the partition process, suchas in the vinclozolin/benzoin and similar examplesdescribed inSection 3.7.; and (4) tailing is minimizedwhen active sites (e.g. silanol groups) on the station-ary phase are being masked by a co-eluting compoundwith high affinity and/or high concentration. Thislatter case may entail physico-chemical interactionswith the active sites (such as hydrogen bonding) orsimply a physical blockage of analyte access to theactive sites.
M. Anastassiades et al. / J. Chromatogr. A 1015 (2003) 163–184 183
In addition to improved peak shapes and intensi-ties, tR shifts were observed in the case of certainanalyte/agent combinations. Shifts to shortertR canbe explained by reduced interactions of the analytewith the stationary phase and the active sites, whereasshifts to longertR are more difficult to understand.We conceptualize that the latter case can be attributedto the following two mechanisms: (1) the highlyconcentrated agent acts like a “keeper” to delay thevaporization of the affected analytes to some extent;and (2) interactions (such as hydrogen bonding) oc-cur between the analyte and the co-eluting protectingagent, that temporarily modifies the stationary phase,resulting in a slightly increased analyte retention. Inthe first case, shifts to longertR should occur simulta-neously for various analytes of similar volatility. Thiswas observed in the case of 3-O-ethylglycerol at highconcentrations, where peaks of several early-elutinganalytes, such as dichlorvos (seeFig. 3b), methami-dophos and acephate were shifted to longertR. Thesecond proposed mechanism would only affect an-alytes, which physico-chemically interact with theagent. Such an effect was observed in the case ofthiabendazole and imazalil when co-injected with3,5-diaminobenzoic acid (seeFig. 3a). In this experi-ment, peaks of these two compounds shifted to longer
6610% infinite % value 8415%
0
50
100
150
200
250
300
350
400
450
500
Dic
hlor
vos
Met
ham
idop
hos
Mev
inph
osAc
epha
teo-
Phen
ylph
enol
Om
etho
ate
Dim
etho
ate
Dia
zino
nVi
nclo
zolin
Car
bary
lM
etal
axyl
Pirim
ipho
s-m
ethy
lM
ethi
ocar
bFe
nthi
onC
hlor
pyrif
osC
ypro
dini
lTh
iabe
ndaz
ole
Imaz
alil
Endo
sulfa
n su
lfate
Phos
alon
eAz
inph
os-m
ethy
lPe
rmet
hrin
sC
oum
apho
s
Rel
ativ
e re
spo
nse
(%
)
(A) Without analyte protectant (B) With analyte protectant C10
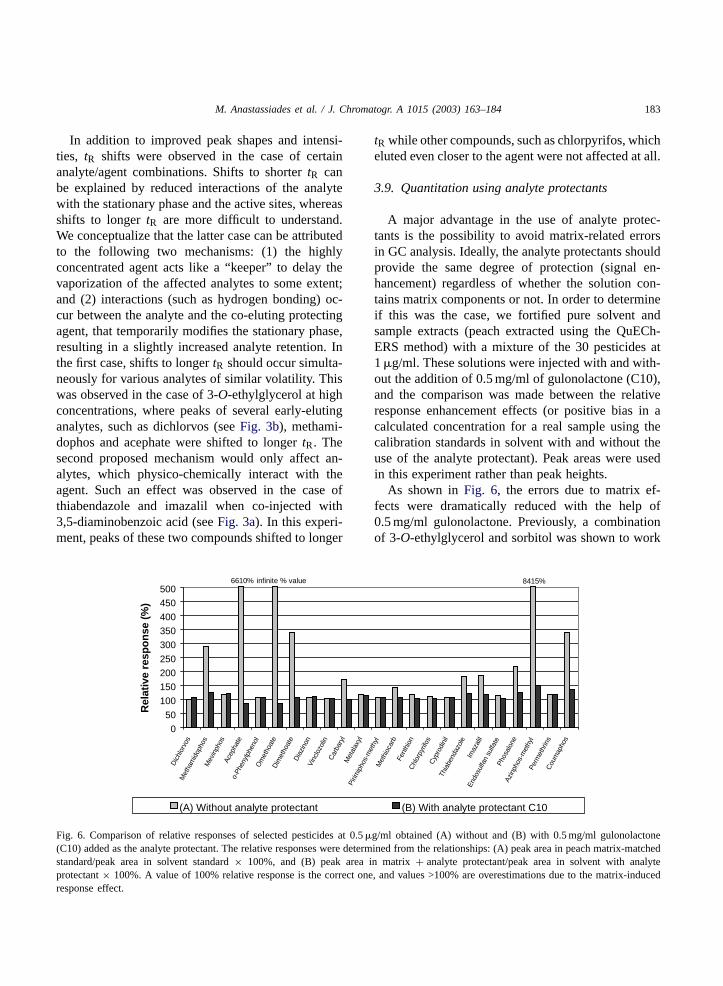
Fig. 6. Comparison of relative responses of selected pesticides at 0.5�g/ml obtained (A) without and (B) with 0.5 mg/ml gulonolactone(C10) added as the analyte protectant. The relative responses were determined from the relationships: (A) peak area in peach matrix-matchedstandard/peak area in solvent standard× 100%, and (B) peak area in matrix+ analyte protectant/peak area in solvent with analyteprotectant× 100%. A value of 100% relative response is the correct one, and values >100% are overestimations due to the matrix-inducedresponse effect.
tR while other compounds, such as chlorpyrifos, whicheluted even closer to the agent were not affected at all.
3.9. Quantitation using analyte protectants
A major advantage in the use of analyte protec-tants is the possibility to avoid matrix-related errorsin GC analysis. Ideally, the analyte protectants shouldprovide the same degree of protection (signal en-hancement) regardless of whether the solution con-tains matrix components or not. In order to determineif this was the case, we fortified pure solvent andsample extracts (peach extracted using the QuECh-ERS method) with a mixture of the 30 pesticides at1�g/ml. These solutions were injected with and with-out the addition of 0.5 mg/ml of gulonolactone (C10),and the comparison was made between the relativeresponse enhancement effects (or positive bias in acalculated concentration for a real sample using thecalibration standards in solvent with and without theuse of the analyte protectant). Peak areas were usedin this experiment rather than peak heights.
As shown inFig. 6, the errors due to matrix ef-fects were dramatically reduced with the help of0.5 mg/ml gulonolactone. Previously, a combinationof 3-O-ethylglycerol and sorbitol was shown to work

184 M. Anastassiades et al. / J. Chromatogr. A 1015 (2003) 163–184
similarly [18]. The use of analyte protectants is thusa good alternative to other approaches dealing withthe problem of matrix-induced signal enhancements.
4. Conclusions
This report re-introduced the concept of reagentmasking agents, or analyte protectants as we pre-fer to call them, to provide a consistently highmatrix-induced enhancement effect for the analysisof pesticide residues. In the previous study[2], theauthors only tested eight compounds and concludedthat the concept was not viable. In this study, 93different compounds were evaluated as analyte pro-tectants, and the results demonstrate that the approachis feasible with the appropriate protecting agent(s). Avariety of sugars and sugar lactones provided the bestoverall effect for the volatility range of GC-amenablepesticides tested (from dichlorvos to deltamethrin).Further work should be done to evaluate the perfor-mance of the best protecting agents in actual analysesof pesticide residues and other applications.
The advantages of using analyte protectants include:(1) intensity and shape of analyte peaks are improved;(2) cleanup of extracts can be conducted without con-cern for loss of matrix-induced enhancement; (3) peakidentification and integration become easier and moreaccurate; (4) as a result, greater selectivity, lower de-tection limits, and greater confidence in the resultsmay be achieved; (5) errors caused by matrix-inducedenhancement effects can be eliminated without theneed to perform inconvenient approaches, such asmatrix-matching; (6) the policies of US federal agen-cies do not preclude the use of analyte protectants inregulatory analyses concerning pesticide residues infood; (7) the approach is very easy, fast, and inexpen-sive; and (8) less maintenance of the GC system isneeded because even a very dirty system can providegood results with the use of analyte protectants.
The long-term influence of the analyte protectantson the GC/MS system still needs to be evaluated, butwe have made approximately 1000 injections usinganalyte protectants in our GC/MS quadrupole instru-ment without conducting a source cleaning. The ana-lyte protectants do not give interferences in the GC/MSSIM analyses of the 30 pesticides tested at our con-ditions, but indirect effects in GC/MS analyses using
ion trap or time-of-flight instruments have not beeninvestigated.
Acknowledgements
The authors thank Marc Fiddler for preparing thechemical structures inTable 4. This research was sup-ported in part by Research Grant Award No. IS-3022-98 from BARD, the United States–Israel BinationalAgricultural Research and Development Fund.
References
[1] D.R. Erney, A.M. Gillespie, D.M. Gilvydis, C.F. Poole, J.Chromatogr. 638 (1993) 57.
[2] D.R. Erney, C.F. Poole, J. High Resolut. Chromatogr. 16(1993) 501.
[3] D.R. Erney, T.M. Pawlowski, C.F. Poole, J. High Resolut.Chromatogr. 20 (1997) 375.
[4] J. Hajšlová, K. Holadová, V. Kocourek, J. Poustka, M. Godula,M. Kempný, J. Chromatogr. A 800 (1998) 283.
[5] M. Anastassiades, E. Scherbaum, Deutsche Lebensmittel-Rundschau 93 (1997) 316.
[6] M. Anastassiades, Entwicklung von schnellen Verfahrenzur Bestimmung von Pestizidrueckstaenden in Obst undGemuesse mit Hilfe der SFE—ein Beitrag zur Beseitigunganalytischer Defizite, Shaker Verlag, Aachen, 2001.
[7] F.J. Schenck, S.J. Lehotay, J. Chromatogr. A 868 (2000) 51.[8] P.L. Wylie, K. Uchiyama, J. AOAC Int. 79 (1996) 571.[9] Pesticide Analytical Methods in Sweden, Part I, National
Food Administration, Uppsala, 1998.[10] E. Soboleva, N. Rathor, A. Mageto, Á. Ambrus, A. Fajgelj, Á.
Ambrus (Eds.), Principles and Practices of Method Validation,Royal Society of Chemistry, Cambridge, UK, 2000, p. 138.
[11] M. Godula, J. Hajšlová, K. Alterová, J. High Resolut.Chromatogr. 22 (1999) 395.
[12] S.J. Lehotay, K.I. Eller, J. AOAC Int. 78 (1995) 821.[13] P.D. Johnson, D.A. Rimmer, R.H. Brown, J. Chromatogr. A
765 (1997) 3.[14] G.P. Molinari, S. Cavanna, L. Fornara, Food Addit. Contam.
15 (1998) 661.[15] L.V. Podhorniak, J.F. Negron, F.D. Griffith Jr., J. AOAC Int.
84 (2001) 873.[16] M. Godula, J. Hajšlová, K. Maštovská, J. Krivánková, J.
Sep. Sci. 24 (2001) 355.[17] A. Hill, Quality control procedures for pesticide residues
analysis—guidelines for residues monitoring in the EuropeanUnion, Document 7826/VI/97, European Commission,Brussels, 1997.
[18] M. Anastassiades, S.J. Lehotay, D. Štajnbaher, F.J. Schenck,J. AOAC Int. 86 (2003) 412.
[19] K. Grob, J. Chromatogr. 219 (1981) 13.[20] K. Grob, J. Chromatogr. 324 (1985) 251.